
1. Introduction
Tomato is, after potato, the most frequently consumed vegetable in the world (Matoo et al., 2008). This crop is adapted to various culture conditions and is used for industrial transformation as well as for fresh consumption. Within the Lycopersicon esculentum Mill. species, the variety Moneymaker is known for its productivity and resistance and is commonly used in scientific studies.
The aim of the present study was to evaluate the effects of salt stress on tomato seedlings. High salt concentration in the plant environment plays indeed a major role in soil degradation and affects 19.5% of irrigated land and 2.1% of dry land devoted to agriculture (FAO, 2000). On the physiological level, salinity problems often impair the plant mineral nutrition (Pascale et al., 2003). Moreover, salt stress is often accompanied by oxidative stress caused by an increased reactive oxygen species (ROS) production (Dias de Azevedo Neto et al., 2006). ROS such as H2O2 control many processes in plants but can also exhibit deleterious effects on living cells. Considering their potential harmfulness, the intracellular levels of ROS must therefore be tightly regulated and plant cells contain enzymatic and non enzymatic mechanisms, which can detoxify them (Halliwell, 2006). On the enzymatic level, two major enzymatic antioxidants are often studied: ascorbate peroxydase (APX) and catalase (CAT). APX is mainly present in chloroplasts and cytosol and oxidizes H2O2 in presence of ascorbate (Halliwell, 2006). CAT can be found mainly in peroxisomes and glyoxisomes and is only efficient when H2O2 concentration is high (Feierabend, 2005). On the non enzymatic level, ascorbate is the major antioxidant in plants and it is found in every cell compartments (Smirnoff, 2000; Blokhina et al., 2003).
Among the main classes of biomolecules, polyunsaturated fatty acids (PUFA) are considered to be the most susceptible targets to oxidative attacks mediated by ROS (Spiteller, 2003). Their oxidative metabolism produces biologically active compounds named oxilipins (Howe et al., 2002). The first step of the metabolic pathway of oxilipins leads to the production of fatty acid hydroperoxides (HPO), formed enzymatically by lipoxygenase or not enzymetically by auto-oxidation. Enzymatic oxygenation of PUFA by LOX may occur on the carbon 9 (9-LOX) or 13 (13-LOX) (Liavonchanka et al., 2006). Fatty acid hydroperoxides are key intermediates that can be transformed in various compounds by several enzymatic or non enzymatic reactions. For instance, HPO can be reduced in their corresponding hydroxy derivatives or transformed in jasmonic acid by oxo-phytodienoic reductase.
Lipoxygenase pathway or lipid peroxidation has been studied by a few authors in salt-stressed plants. Indeed, Shalata et al. (1998) have shown that, in salt stress conditions, a wild salt-tolerant tomato exhibited much lower lipid peroxidation levels than the cultivated tomato while CAT and APX activities were higher in the same plant. In salt-tolerant cells of Citrus sinensis Osbeck, it was shown that a 9-LOX was specifically induced by salt-stress (Ben-Hayyim et al., 2001). In salt-stressed rice, LOX activity and lipid peroxidation products were increased in a sensitive cultivar compared to a resistant one (Roychoudhury et al., 2008).
In the present study, we characterized the plant response to salt stress at an early developmental stage (seedling). Within this physiological context, the biochemical studies were focused on the antioxidant system and on the LOX pathway at the mRNA, enzymatic and metabolite levels in order to better understand the implication of those metabolic pathways in the salt stress response of tomatoes.
2. Materials and methods
2.1. Biological material
The salt stress was studied on seedlings of tomato (L. esculentum) and the seeds of the variety Moneymaker were used to realize the following experiments. In a first step, these seeds were disinfected, placed in Petri dishes to germinate and develop under salt stress.
Seeds disinfection. Ten grams of seeds were agitated during 5 min in 400 ml of 50% v/v ethanol. The mixture was then filtered on flat filter paper to remove the supernatant. Then, the seeds were agitated for 10 min in 200 ml of an aqueous solution of sodium hypochlorite 10% w/v containing one drop of tween 20. After being filtered on sterile filter paper and rinsed three times with sterile water, seeds were collected, poured in a bottle containing 100 ml of sterile water and stored at 4°C overnight.
Seeds germination on Petri dishes. After filtration on sterile filter, seeds were placed on Petri dishes to germinate on a filter paper. Two ml of sterile water were added in all dishes which were afterwards closed with parafilm and stored in a culture chamber (25°C, photoperiod 16 h light).
Application of salt stress. After 8 days of germination, when two cotyledons were produced by the seedlings, 2 ml of water (control) or NaCl solution (100 mM) were added to all Petri dishes. All samples were harvested after 12 days from the beginning of the germination and immediately immersed in liquid nitrogen. Afterwards, the material was stored at -80°C.
Samples preparation. Each biological sample was individually crushed using a cryogrinding process. Plantlets were sprinkled with liquid nitrogen and ground to obtain a very thin powder.
2.2. Extraction and quantification of RNA
RNA extractions from control and stressed seedlings of L. esculentum were performed according to Gentra-Systems, Purescript protocol with minor modifications. Shortly, 80 mg of tomato powder were homogenized 5 min on ice in 300 µl of lysis buffer (2% SDS, 68 mM TRIS, 10 mM EDTA, pH 3.5 acetic acid). The previous suspension was mixed vigorously with 100 µl of precipitation buffer (4 M NaCl, 17 mM TRIS, pH 3.5 acetic acid). Each sample was incubated 5 min on ice and centrifuged during 5 min at 18 000 g. Supernatant was mixed with one volume of isopropanol, incubated 15 min on ice and centrifuged during 5 min at 18 000 g. Pellet was washed with 100% ethanol (300 µl) and centrifuged during 5 min at 18 000 g. Pellets were dried on air and RNA pellet was resuspended in 50 µl of DEPC water. RNA quality was estimated on 1% agarose gel. RNA were quantified using Quant-iT Assay Kits (Invitrogen) according to the manufacturer’s instructions.
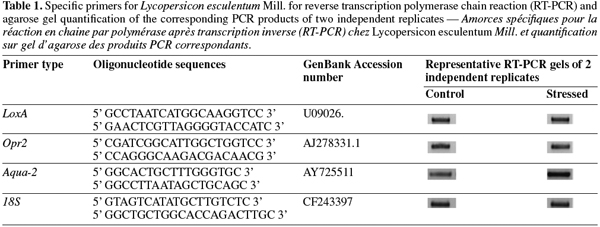
cDNA was synthesised from 200 ng of total RNA using RevertAid H Minus First Strand cDNA Synthesis Kit (Fermentas) as recommended by the manufacturer. To perform expression analysis, specific primer sets (Table 1) were designed for lox-A (lipoxygenase A), opr-2 (oxo-phytodienoic reductase), aqua-2 (aquaporin) and 18S (housekeeping gene). Reverse transcription polymerase chain reaction was performed on a PTC-100 thermocycler (MJ Research, Inc.) under the following conditions: an initial cycle of denaturation (5 min at 95°C), followed by 35 cycles with denaturation (1 min at 95°C), annealing (1 min at 50°C) and elongation (2 min at 72°C) and by a final elongation (10 min at 72°C). From each PCR reaction, 4 µl of PCR products were loaded onto a 1% agarose gel.
Expression levels were quantified using ImageQuant version 5.0 Software (Molecular Dynamics, Amersham Bioscience). Levels of expression for each gene were normalized according to 18S amplifications. Two independent biological replicates were used for transcriptomic analysis.
2.3. Antioxidant system
Preparation of protein extracts.
Hot SDS extraction of proteins. According to Delaplace et al. (2006), 1 g of tomato powder stored at -80°C was weighed in one tube of 16 ml containing 2 ml of SDS lysis buffer (20 mM sodium phosphate buffer, pH 7.0, with 4% w/v SDS, 5% w/v sucrose, 10% w/v polyvinylpolypyrrolidone and 0.3% w/v dithiothreitol) preheated at 65°C. The suspension was homogenized 1 min at 1 800 rpm, incubated 1 min at 65°C, homogenized 1 min at 1 800 rpm and finally incubated 3 min at 65°C. Then the tubes were cooled on ice during 15 min before being centrifuged at 15 000 g, at 4°C during 15 min. The supernatant was then centrifuged using the same parameters.
Protein assay. The total protein concentration was determined with the “RC/DC Protein Assay” from Bio-Rad (Hercules, CA, USA). All the steps were performed according to the manufacturer’s instructions, at room temperature.
SDS-PAGE proteins resolution. The X-Cell SureLock Mini-Cell (Invitrogen, Carlsbad, California, USA) was used to perform the electrophoretic separations in denaturing conditions (SDS-PAGE). Twenty-five µg of extracted proteins were diluted in sample buffer (Tris 141 mM, lithium dodecylsulfate 2% w/v, glycerol 10% w/v, EDTA 0.51 mM, Serva Blue G250 0.22 mM, phenol red 0.175 mM, pH 8.5) to load each well with a final volume of 30 µl. The migration was performed at 200 V during 50 min. After migration, the gel was rinsed three times during 5 min with H2O, stained for 60 min with 30 ml of Coomassie blue (simply blue, Invitrogen) and washed twice (during 60 min and 12 h) with 100 ml of water.
Ascorbate content determination. Ascorbate (AsA) and dehydroascorbate (DHA) contents were determined using the method described by de Pinto et al. (1999). The samples (0.5 g of tomato powder) were vortexed at room temperature with 1 ml of ice-cold metaphosphoric acid 5% w/v. The homogenate was then centrifuged for 15 min at 14 000 g, 4°C. The supernatant was collected and stored on ice. The total concentration of ascorbic acid was determined after the reduction of DHA in AsA by dithiothreitol.
The concentration of DHA was obtained by difference between the concentrations of “total” ascorbic acid (AsA + DHA) and AsA. Three independent repetitions were realized for each kinetic point.
Characterization of enzymatic antioxidants.
Protein extraction for enzymatic assays.
Extraction: 1 ml of extraction buffer (K-phosphate buffer 50 mM pH 7.0, EDTA 1 mM, PVPP 1% w/v) cooled on ice was added to 500 mg of tomato powder. The suspension was vortexed at room temperature and stored on ice. Then it was centrifuged at 4°C during 30 min at 13 500 g and the supernatant was collected and used for analyses.
Protein concentration assay: the protein extracts concentration was determined with the Bradford method (1976) using the Bio-Rad “Protein assay kit II”. The samples were assayed for protein content in triplicate.
Determination of the activities (ascorbate peroxydase and catalase) by spectrophotometry. APX activity: APX activity was determined according to Nakano et al. (1981). The decrease in ascorbate concentration was followed as a decrease in optical density at 290 nm and activity was calculated using the extinction coefficient (2.8 mM-1 cm-1 at 290 nm) of ascorbate. One APX unit corresponded to 1 µmol of ascorbate consumed per minute.
CAT activity: CAT activity was assayed by measuring the initial rate of disappearance of H2O2 according to Claiborne (1985). The decrease in H2O2 was followed at 240 nm, and activity was calculated using the extinction coefficient of 43.6 mM-1 cm-1 at 240 nm. One CAT unit was defined as the amount of enzyme that degraded 1 µmol of H2O2 min-1 mg-1 of protein. Three independent extractions were used for each point of the kinetics.
2.4. Oxylipins
Extraction and determination of free and esterified oxylipins. Free and esterified oxylipins were extracted and analyzed according to Göbel et al. (2003) with a three step HPLC procedure using internal standards for quantification. The first step performed on a reverse phase column allows group separation; the second step performed on a straight phase column allows individual oxylipin quantification while the third step performed on a chiral phase column allows chirality determination. For free and esterified oxylipins, 2.0 g of tomato powder were used. The results were expressed in terms of nmol.g-1 FW. The analysis was performed in duplicate and for each oxylipin; means were classified using the Student T-test with Minitab 15.1.
Extraction and enzyme activity determination. According to Fauconnier et al. (2001), 0.5 g of powder was homogeneized for 30 min on ice in 5 ml of sodium phosphate buffer (0.1 mol.l-1, pH 7.5). The resulting suspension was centrifuged at 3 000 g at 4°C for 30 min, and the supernatant was used for LOX activity determination using linoleic acid and linolenic acid as substrates (Surrey, 1964). For HPO decomposition activity determination, 1 g of powder was stirred for 1 h 30 on ice in 2 ml of sodium phosphate buffer (0.1 mol.l-1, pH 6.7) containing EDTA (3 mmol.l-1), cysteine (10 mmol.l-1), and Triton X-100 (0.5%) (v/v), the resulting suspension was centrifuged at 1 000 g at 4°C for 5 min. The resulting supernatant was used for fatty acid HPO decomposition activity using 9/13-HPOD and 9/13-HPOT as substrates according to Vick (1993) and Fauconnier et al. (1997). Two independent extractions were performed on two independent samples (control and stressed). For each sample, three repetitions were carried out.
3. Results
3.1. Genes expression
Salt stress response was compared to control seedling in two biological repetitions. After extraction, RNA quality was evaluated on agarose gel and was suitable for RT-PCR analysis. Regulations of three candidate genes and one housekeeping gene were studied. Lox-A and opr-2 were representative of the lipoxygenase pathway. The gene coding for aquaporine (aqua-2) was representative of drought stress response. Amplification of 18S gene was used as control. This amplification showed the four genes expression in all samples (Table 1). Whereas no significant difference on the level of lox-A, opr-2 and 18S expression was observed, the aqua-2 was overexpressed during salt treatment. After quantifications, we showed that transcript level for aqua-2 was 2.48 fold increased under salt stress conditions.
3.2. Proteomics and antioxidant system analysis
Proteomic analysis. The electrophoresis 1D gel did not show any significant particular modification of proteins expression between control and salt-stressed samples (data not shown). A phantom band could be observed near 116,3 kDa. For both salt-stressed samples, a light disappearance of the band near 55,4 kDa was visible.
Antioxidant enzyme activity. CAT and APX activities were studied on control and salt-stressed seedlings. The entire seedling was ground so, leaves and roots were mixed together. CAT and APX activities did not change significantly between control and salt-stressed samples (Table 2).
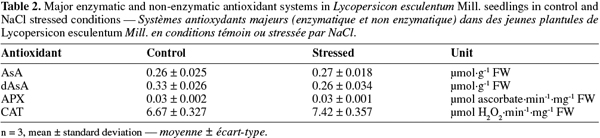
Non-enzymatic antioxidant activity. Antioxidant system was studied for AsA and dAsA and no significant difference between control and salt-stressed samples was detected (Table 2).
3.3. Oxylipin patterns
LOX activity determination using LA and LeA as substrate. LOX activity was determined by spectrophotometry using LA and LeA as substrates (Table 3).
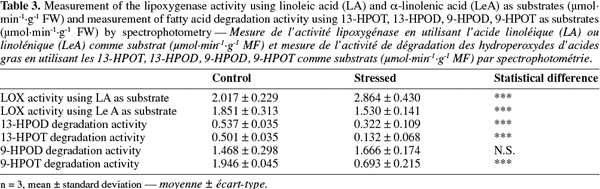
In all samples, LA was preferentially used as substrate by LOX. A clear difference was observed between control and stressed plant with a LOX activity varying from 2.017 ± 0.229 µmol.min-1.g-1 FW in control plants to 2.864 ± 0.430 µmol.min-1.g-1 FW in stressed plants (LA as substrate). On the contrary, when LeA was used as substrate, the LOX activity was higher in control plants (1.851 ± 0.313 µmol.min-1.g-1 FW) than in stressed plants (1.530 ± 0.141 µmol.min-1.g-1 FW).
Degradation activity of 13- and 9-hydroperoxy-octadecadienoic acid and of 13- and 9-hydroperoxy-octadecatrienoic acid. LOX forms 13 or 9 hydroperoxides of linoleic and linolenic acid that can be further degraded by different enzymes. Here, we measured the degradation activity of 13- and 9-hydroperoxy-octadecadienoic acid (13-HPOD and 9-HPOD) and of 13- and 9-hydroperoxy-octadecatrienoic acid (13-HPOT and 9-HPOT) by spectrophotometry (Table 3).
Nine hydroperoxides (9-HPOD and 9-HPOT) were preferentially degraded in all samples (control and stressed seedlings). Nevertheless, a significant difference was observed between control and stressed samples for three out of the four tested substrates. The 13-HPOD, 13-HPOT and 9-HPOT degradation activities decreased in NaCl-stressed plantlets compared to control ones while 9-HPOD degradation activity was statistically unchanged but tended to increase.
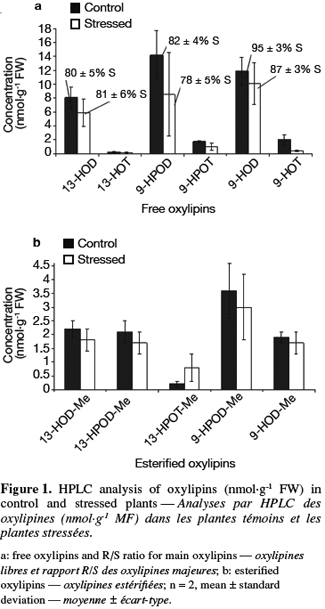
HPLC determination of free and esterified oxylipins. Thirteen-HPOD, 9-HPOD, 9-HPOT, 13- and 9-hydroxy-octadecadienoic acids (13-HOD and 9-HOD), 13- and 9-hydroxy-octadecatrienoic acids (13-HOT and 9-HOT) can be encountered in plants in a free form but also esterified (-Me) to phospholipids or galactolipids. Free and esterified hydroxy and hydroperoxy derivatives of linoleic and linolenic acids were determined in control and stressed samples using a three step HPLC procedure. Results are presented in figure 1a for free oxylipins and in figure 1b for esterified oxylipins. The concentration of free oxylipins was significantly higher than the concentration of esterified oxylipins in all samples. LA derivative concentrations were higher than LeA derivatives ones while 9-oxylipins were found in higher concentration than 13-oxylipins. Except for 13-HPOT-Me, concentrations of each free and esterified oxylipin tended to be higher in control plants than for stressed plants. However, these differences were not statistically significant. Chiral phase analysis was performed on the main oxylipins (13-HOD, 9-HOD and 9-HPOD). Results are presented in figure 1a as a R or S form percentage. Oxylipins formed enzymatically correspond to a S percentage superior to 85% (Goëbel et al., 2003). It thus clearly appears that 13-HOD and 9-HPOD are formed non enzymatically in both samples while 9-HOD are formed enzymatically.
4. Discussion
Salt contamination in soil is one of the major challenges for agriculture and, tomatoes appear as one of the most consumed fruit in the world. A better understanding of NaCl effects on tomato plants growth is thus essential.
Our data revealed a differential response of plants when treated with NaCl. Indeed, NaCl regulated gene involved in global water balance (aquaporin), but not in oxylipin pathway (lox1, opr2) at the transcriptomic level. The aqua-2 gene over expression in salt stressed seedlings demonstrated that they had been stressed by salt. This stress increased ROS concentrations, which can cause an oxidative stress (Dias de Azevedo Neto et al., 2006).
H2O2 is the substrate of different enzymatic pathways such as APX and CAT. These enzymes are part of the antioxidant system, which allows plants protecting themselves in response to the stress. Our results did not show any significant difference in enzyme activity between salt-stressed plants and control plants (APX and CAT). APX results are strengthened by AsA content that is similar in control and stressed plants. The role of CAT and APX activities in plant response to salt-stress is not clear as evidenced by literature. Indeed, Shalata et al. (1998) have shown that APX activity increases in both salt-sensitive and salt-tolerant tomatoes after salinization; but it was only clearly noticeable ten days after salinization. In the same experimental conditions, CAT activity clearly increases in salt-tolerant tomato but decreases in the sensitive one with a slight effect four days after salinization. In maize, salt stress did not affect leaf CAT activity in salt-tolerant variety but reduced it in salt-sensitive one (Dias de Azevedo Neto et al., 2006). In rice, CAT activity decreases 48 h after salinization in both salt-tolerant and salt-sensitive varieties (Roychoudhury et al., 2008). Our data are consistent with a moderate or minor oxidative stress but much severe stress conditions (e.g. higher NaCl concentrations or stress duration) could result in increased oxidative damages. Nevertheless, according to Parida et al. (2004), plants could use other antioxidant pathways or other non enzymatic antioxidants to reduce ROS concentrations in stressed plants.
PUFA are among the more susceptible biological molecules to oxidation. They can easily be oxidized into their corresponding hydroperoxides non enzymatically (e.g. by ROS) or enzymatically by LOX. Our chiral phase data analysis revealed that fatty acid hydroperoxides and their corresponding hydroxide derivatives are formed partly enzymatically (9-HOD) and partly non enzymatically (13-HOD and 9-HPOD). Nevertheless, no significant difference could be observed between oxylipin contents in control and stressed plants with a tendency to decrease in the stressed plants. In stressed plants compared to control samples, LOX activity is higher when LA is used as substrate but lower when Le A is used. LOX activity is responsible for 9-HPOD and 9-HOD synthesis but salt stress does not result in their accumulation. This last result can be explained by the low availability of free linoleic acid, substrate of LOX or by the fact that fatty acid hydroperoxides are key intermediates of the LOX pathway that can be used as substrate by various other enzymes. Indeed, fatty acid hydroperoxide degradation activities decrease significantly in stressed plantlets compared to control ones, mainly when 13-HPOT and 9-HPOT are used as substrates. Lipid peroxidation and LOX activity have been studied by several authors in the salt stress context. Shalata et al. (1998) have shown, using an indirect marker of lipid peroxidation (malondialdehyde content), that lipid peroxidation increased markedly in salt-sensitive tomato while it decreased slightly in the salt tolerant one. The difference between control and stressed plants was reached 14 days after salinization. In rice, LOX activity increased in salt-sensitive varieties but remained unchanged in tolerant one 48 h after salinization. In the same samples, malondialdehyde accumulated in sensitive varieties but not in the tolerant ones (Roychoudhury et al., 2008). In maize leaves, malondialdehyde accumulated slowly up to 20 days after salinization in the sensitive variety but remained unchanged in the tolerant one (Dias de Azevedo Neto et al., 2006). In salt stressed cells of Citrus sinensis Osbeck, LOX expression (9-LOX) was induced very rapidly after salinization only in the salt-tolerant cells and in a transient manner, the maximum being reached 1 h after salt treatment (Ben-Hayyim et al., 2001).
5. Conclusion
We can conclude that our experimental conditions induced a clear water stress in plants as evidenced by aquaporin gene expression. At the same time, no clear modification of the main enzymatic and non enzymatic antioxidant systems could be observed. Those last results are in agreement with a moderate or minor oxidative stress context and are strengthened by the absence of oxylipin accumulation. Nevertheless, a LOX activity increase was observed in stressed plants when LA was used as substrate. As evidenced by literature, the role of antioxidant systems and enzymatic (LOX) or non enzymatic lipidic peroxidation in plant salt stress response is far from clear. Salt stress is a very complex trait and focussing on a particular aspect does not allow us to forget that many other factors and metabolic pathways interfere in salt stressed plants. Further experimentations have thus to be performed in order to better understand the role of LOX pathway in response to salt stress. Different LOX isoforms could be studied at different levels while kinetic aspects should not be neglected. The comparison of the response of a salt-tolerant tomato like Lycopersicon pennellii (Correll) D'Arcy with the salt-sensitive cultivated tomato L. esculentum would provide an outstanding tool for our study.
Abbreviations
Aqua-2: aquaporines (2)
AsA: ascorbate
DHA: dehydroascorbate
HPO: hydroperoxide
LA: linoleic acid
LDS: lithium dodecylsulfate
LeA: α-linolenic acid
LOX: lipoxygenase (enzyme)
Lox-A: lipoxygenase A (gene)
Opr-2: 12-oxo-phytodienoic acid reductases
PUFA: polyunsaturated fatty acids
RT: room temperature
9-HOD: 9-hydroxy-octadecadienoic acid
9-HOT: 9-hydroxy-octadecatrienoic acid
9-HPOD: 9-hydroperoxy-octadecadienoic acid
9-HPOT: 9-hydroperoxy-octadecatrienoic acid
9-HOD-Me: esterified 9-hydroxy-octadecadienoic acid
9-HPOD-Me: esterified 9-hydroperoxy-octadecadienoic acid
13-HOD: 13-hydroxy-octadecadienoic acid
13-HOT: 13-hydroxy-octadecatrienoic acid
13-HPOD: 13-hydroperoxy-octadecadienoic acid
13-HPOT: 13-hydroperoxy-octadecatrienoic acid
13-HOD-Me: esterified 13-hydroxy-octadecadienoic acid
13-HPOD-Me: esterified 13-hydroperoxy-octadecadienoic acid
13-HPOT-Me: esterified 13-hydroperoxy-octadecatrienoic acid
ROS: reactive oxygen species