


View(s): 0 (0 ULiège)
Download(s): 0 (0 ULiège)


Resilience to food insecurity of local communities in the Luki Biosphere Reserve in Democratic Republic of Congo

Résumé
Les impacts négatifs du changement climatique sur l’agriculture poussent les producteurs à surexploiter les ressources forestières afin d’améliorer leur revenu. Cette pression anthropique engendre la dégradation et la déforestation des reliques forestières. L’identification des besoins prioritaires de ces communautés riveraines des zones forestières permet de mieux appréhender cette pression afin de la réduire. En effet, évaluer la résilience de ces communautés permet non seulement de mesurer leur capacité à faire face aux chocs et aux stress alimentaires, mais aussi de cerner plus finement les besoins spécifiques auxquels il convient de répondre en priorité pour renforcer cette résilience. C’est dans cette perspective que s’inscrit la présente étude, qui vise à évaluer la résilience à l’insécurité alimentaire des communautés locales de la Réserve de Biosphère de Luki (RBL) en République Démocratique du Congo (RDC). Dans ce cadre, une enquête sociodémographique a été réalisée de juillet à Octobre 2021 auprès de 313 ménages vivants à l’intérieur et autour de la RBL. La version II de l’outil « Resilience Index Measurement and Analysis » (RIMA) de la FAO a permis de mesurer leur capacité de résilience. L’accès aux services sociaux de base (ABS), les actifs productifs (AST), la capacité d’adaptation (AC) et les filets de protection sociale (SSN) sont les piliers qui ont contribué à la construction de la matrice de structure de résilience (RSM) pour le calcul de l’indice de capacité de résilience (RCI). Les ménages sont pour la plupart résilients à l’insécurité alimentaire (88.5%), en particulier ceux impliqués dans les comités locaux de développement (CLD), ce qui indique un impact positif des projets communautaires. Le RCI est fortement influencé par AST et ABS. Les variables les plus pertinentes sont les actifs agricoles et non agricoles, la production agricole et les installations sanitaires. Elles constituent les besoins prioritaires sur lesquels les décideurs politiques doivent se baser pour améliorer la sécurité alimentaire et la résilience des communautés de la RBL.
Abstract
The negative impacts of climate change on agriculture push farmers to overexploit forest resources to improve their income. This anthropogenic pressure causes the degradation and deforestation of forest relics. The identification of priority needs of these forest riparian communities makes it possible to better understand this pressure in order to reduce it. Indeed, assessing the resilience of these communities not only allows for measuring their ability to cope with food shocks and stresses, but also to identify more precisely the specific needs that need to be addressed as a priority in order to strengthen this resilience. It is in this perspective that the present study aims to assess the resilience to food insecurity of local communities in the Luki Biosphere Reserve (LBR) in the Democratic Republic of Congo (DRC). In this context, a sociodemographic survey was conducted among 313 households living in and around the RBL. Data were collected from July to October 2021. Version II of FAO’s Resilience Index Measurement and Analysis (RIMA) tool measured the resilience capacity of these populations. Access to Basic Services (ABS), Assets (AST), Adaptive Capacity (AC) and Social Safety Nets (SSN) are the pillars that contribute to build the Resilience Structure Matrix (RSM) for the calculation of the resilience capacity index (RCI). 88.5% of households are classified as resilient, particularly those involved in Local Development Committees (CLDs), suggesting a positive impact of community-based projects. The resilience of RBL households is strongly influenced by AST and ABS. The most relevant obvious variables are agricultural and non-agricultural assets, agricultural production, and sanitation facilities (toilets), These variables represent the priority needs that policymakers should rely to formulate targeted interventions for improving food security and resilience of RBL communities.
Table of content
INTRODUCTION
Climate change, characterized by extreme events increasing such as droughts and floods, rising temperatures, increased variability in rainfall and characteristics of agricultural seasons (IPCC, 2007), is the largest focus of international debate. It got the point where rural people have a perception of climate change today (Bernard, 2014; Matsalabi et al., 2018). The agricultural sector in developing countries is subject to negative climate change constraints. This leads to a decrease in the availability of food, and an increase of agricultural products costs (IPCC, 2014). Food security remains negatively impacted and has recently suffered the horrors of Covid-19 crisis (Dury et al., 2021).
In order to adapt to changes, farmers are developing strategies (Matsalabi et al., 2018; Zaidi et al., 2023) to achieve a high level of food security. Community-based mutuals created across Africa are a response to food insecurity (Dagbeto et al., 2022). In Tunisia, for example, farmers proceed by strengthening social bonds and networks. They lend to each other and diversify their farming activities (Dhraief et al., 2019). In Benin Republic, three large families of agro-ecological practices have been adopted since the 1990s in cotton production areas to improve food security. These practices concern Integrated Management of Agriculture and Livestock (GIAE), Integrated Management of Soil Fertility (GIFS), Agroforestry (AF) (Babio et al., 2023). In addition, crop diversification has improved the resilience of some rural communities (Adjimoti & Kwadzo, 2018). In eastern provinces of Democratic Republic of Congo (DRC) like South Kivu, smallholder farmers and livestock herders are actively developing grassroots adaptation strategies. A recent study in South Kivu showed farmers diversifying incomes (57.6%), improving disease control (72%), adopting integrated farming (65%), planting trees (57%), managing pastures (45%), and using improved livestock breeds (41%)(Azine et al., 2025).While all of these strategies aim to increase the incomes of rural communities and improve their food resilience (Adjimoti & Kwadzo, 2018), they have not fully met the needs of local populations. Additional means of acquiring arable land pressure them on the surrounding natural resources. For unsatisfied food and nutritional needs, rural communities continue to increase pressures on natural resources (Houessou et al., 2013). This observation is generally made in local communities living around protected areas In several parts of the Congo Basin, including Virunga, forest degradation has been linked to agricultural expansion, resource extraction, and socio-political instability (Musavandalo et al., 2025). It is also the case of the Luki Biosphere Reserve (LBR) in Democratic Republic of Congo (DRC) (Desclee et al., 2018; Ngabinzeke & Tongo, 2019).
1Despite the efforts of international and state organizations to improve the living conditions of local people, pressure is still being made on natural resources (Béné et al., 2014). The question of the priority needs to be satisfied for local communities is therefore relevant (Muteba et al., 2015). In this case, a positive and rapid impact of accompanying measures for better food security will be expected. To achieve this, one approach is to assess the resilience of households to identify the weak links in their organization. Resilience is the ability of a system (household, community, population...) to anticipate, adapt or manage risks and recover from the effects of shocks (IPCC, 2012). Its multidisciplinary character (psychology, economics, sociology, ecology) (Barrett & Constas, 2014) makes the pillars of its evaluation different from one field to another (Martin-Breen et Marty Anderies, 2011). Resilience measurement is based on the definition of indicators. An indicator is “specific, measurable, acceptable, realistic and time-bound (SMART)”, while those of resilience are not directly measurable (Vonthron et al., 2016). The multidimensional nature of resilience makes its measurement complex, exceptionally because it is based on latent variables. In the area of food security, analytical frameworks (Alinovi et al., 2008; Béné et al., 2012; USAID, 2012; Barrett & Constas, 2014; FSIN, 2014a; FSIN, 2014b) based on different pillars of resilience (USAID, 2013) and pillar aggregation methods (Alinovi et al., 2008; FSIN, 2014a) were developed. Some studies establish relevant indicators according to the realities of each setting (USAID, 2013). Others explain resilience from a composite index (Alinovi et al., 2008; Gambo Boukary et al., 2016; Ndong et al., 2018). FAO has implemented the RIMA (Resilience Index Measurement and Analysis) tool, a quantitative method to calculate the household resilience index (RCI) based on latent characteristics grouped into four pillars/indicators: adaptability, social safety nets, productive assets and access to basic services (FAO, 2016a).
Existing research and national assessments in DRC tend to focus on broad indicators of vulnerability or food insecurity prevalence, but they do not quantify communities’ ability to anticipate, absorb, and adapt to shocks, key components of resilience. In particular, no resilience assessments have been conducted in the Luki Biosphere Reserve region, an area characterized by dynamic interactions between conservation policies, forest-based livelihoods, and environmental degradation. The absence of such data represents a critical knowledge gap that hinders the ability of policymakers, NGOs, and local authorities to design targeted interventions or allocate resources effectively. This study uses the RIMA method (FAO, 2016a; FAO; 2016b; FAO, 2016c) to analyze the resilience to food insecurity of local communities in the Luki Biosphere Reserve (LBR). Thus, two hypotheses were tested. (1) Access to basic services is the most important indicator/pillar of local community resilience in the Luki Biosphere Reserve. (2) Weekly per capita food consumption provides a better appreciation of the resilience of local LBR communities to food insecurity.
MATERIALS ET METHODS
Study area
2The Luki Biosphere Reserve (RBL) is between latitudes 05°30' and 05°43' South and longitudes 13°04' and 13°17' East (Figure 1). It is in the heart of the Mayombe forest in Kongo-Central province and is co-managed by the National Institute of Agricultural Studies and Research (INERA) and the program «Man and Biosphere» attached to the Ministry of Environment and Sustainable Development (MEDD). This reserve is a true natural research laboratory with potential for studies on REDD+ issues and tropical ecosystem functions (Desclee et al., 2018). Luki Biosphere Reserve is one of the two remaining primary forest areas in the province of Kongo-Central, 120 km from the ocean. It was recognized as a protected area by UNESCO in 1979. It covers a total area of 33,811 hectares.
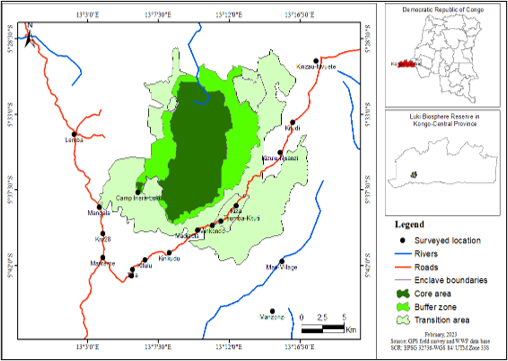
Figure 1: Location of the Luki Biosphere Reserve (LBR) in the Democratic Republic of Congo (DRC), illustrating the spatial arrangement of the core, buffer, and transition zones.
The black points indicate the 18 localities surveyed for the calculation of the Resilience Capacity Index (RCI).
Target group
3The population living around and in the reserve was estimated in 2014 at about 138,589 individuals living in 57 villages structured in Local Development Committees (Nyange, 2014). According to the Ministry of Planning and Monitoring the Revolution of Modernity, Kongo Central Province, DRC, in its 2015 report, the average household size in Kongo Central Province is 6 members (Desclee et al., 2018). Based on this information, the number of households was estimated at 23,098; representing the size of the initial population to be studied Based on an estimated household population of 23,098 The sample size was calculated using the finite population correction formula, commonly applied in survey research (Israel, 1992), assuming a 90% confidence level, 5% margin of error, and a 50% population proportion. The minimum required sample size calculated is approximately 268 households.
4A total of 313 households were sampled in 18 localities (villages) selected within and around the RBL. Villages were selected based on their proximity to the Luki Biosphere Reserve boundary, their involvement in agroforestry or farming activities, and their accessibility during the study period. They are: Camp Inera-Luki, Madiadia, Minkondo, Tsumba-Kituti, Kiza, Mangala, Lemba, Kilomètre 28, Manterne, Lunga Vasa, Tiva, Kifulu, Kinkudu, Mao-Village, Manzonzi, Kizulu-Nsanzi, Kifudi and Kinzau-Mvuete.
Data collection techniques and tools
The choice of RIMA was made because it is a rigorous method that contributes to the creation of a framework for long-term humanitarian and development initiatives aimed at creating resilient livelihoods to ensure food security (FAO, 2016b). The new RIMA-II methodology helped to design, implement, monitor and evaluate assistance to poor populations more effectively, by responding to their priority needs (FAO, 2016c). Increasing the level of security of rural communities would address the concern for Sustainable Development Goal 2 (Zero Hunger) (Bellon et al., 2023) and reduce pressures on the LBR.
Version 2 of the RIMA questionnaire was administered to 313 heads of households in the 18 surveyed locations. The household is the statistical unit commonly used to develop resilience measurement tools (Alinovi et al., 2008 ; Alinovi et al., 2010). This unit of measurement helped to assess the impact of food security interventions within a community (CARE France, 2014; GRET, 2014; GIZ, 2015). The list of 29 questions used in the reduced version of the RIMA questionnaire is based on the experience of RIMA analyses, the literature review, and the technical consultations of RIMA experts (FAO, 2016c). These questions allow the assessment of the pillars of resilience, food security indicators and shocks that people face. The pillars of resilience are: Access to Basic Services (ABS), Assets (AST), Social Safety Nets (SSN), Adaptive Capacity (AC). The food security indicators relate to the costs of the quantities of food consumed by all members of the different households for seven (07) days preceding the survey as well as the food groups concerned (FAO, 2016b). The issue of shocks (questions 28 and 29) was not addressed due to lack of panel data. The questions were adapted to the realities and resources available or not in the community in order to ensure an objective analysis.
Data analysis method
The data were analyzed using FAO’s RIMA methodology. The RIMA-II method includes two approaches, a direct (or descriptive) and an indirect (or inferential). The direct approach measures the resilience capacity index (RCI) and the resilience structure matrix (RSM). The indirect approach examines the determinants of food security loss and recovery (FAO, 2016c). The latter, being causal, studies the determinants of resilience itself and the effects of shocks that occur on food security and resilience (FAO, 2015). The RCI estimate is based on a two-phase procedure. First, resilience pillars are estimated using variables observed through factor analysis (FA). Second, the RCI is assessed according to the pillars, considering food security indicators, using the multiple indicators multiple causes model (MIMIC). According to FAO (2015), food security indicators are considered as resilience outcomes.
A normalization of the observable variables of the resilience pillars has been carried out according to the “min-max” method: Xi* = (X - Xmin) / (Xmax - Xmin); with Xi* the normalized variable, Xi the starting variable, Xmin the smallest observation and Xmax the largest observation.
5The Composite Resilience Index was calculated for each pillar and a Resilience Structure Matrix (RSM) was then developed to indicate the extent to which each pillar contributes to determining resilience capacity. It is a direct measure of resilience that provides descriptive information on household resilience capacity (Ndong et al., 2018). A weighting is given to each pillar through factor analysis. Thus, through an aggregation by the same technique of factor analysis, a calculation of the composite index of resilience is made. This index is a multidimensional variable.
6RCI = f (ABS, AST, AC, SSN)
7Dhraief et al., (2019), inspired by Alinovi et al., (2008) developed a classification of households according to their level of resilience. This classification helped to define the proportions of households vulnerable and those resilient to food insecurity in the Luki Biosphere Reserve (LBR).
8Food security indicators used in this analysis are: per capita food consumption, Dietary Diversity Index (DDI) or Household Dietary Diversity Score (HHDDS) of Simpson and Food Consumption Score (FCS). Per capita food consumption is the monetary value, expressed in US dollars, including products purchased, self-produced, received free of charge (donations or part of a conditional project) and stored foods. Simpson’s DDI is an index that takes into account the number of food groups (cereals, roots, vegetables, fruits, meat, starches, dairy, fat and others); consumed and their relative abundance (Simpson, 1949). In the context of this study, this index ranges from 0 to 12, where 12 represents the maximum food diversity and 0 no diversity (FAO, 2012). The FCS is a score calculated by adding the weighted frequency of consumption of the different food groups consumed by the household during the 7 days before the survey (WFP, 2008). Each group is multiplied by its weight and the number of days consumed by a household member during the past week. The weighting and frequency steps make it possible to potentially use FCS as a measure of the frequency of consumption of food groups at household level, and not only as a measure of household food diversity. The possible range for the composite indicator is 0 to 1121. These thresholds are based on internal WFP decision-making; little empirical work has tested the relevance of these thresholds for detailed nutritional intake over time (Vaitla et al., 2017).
9Excel and R software were used to prepare the data, produce some graphs, and calculate statistical parameters. The ShinyApp platform2, developed by FAO specifically for the calculation of the RCI, made it possible to measure the resilience of the households surveyed (FAO, 2021).
RESULTS
Key Determinants of Community Resilience in the Luki Biosphere Reserve: Identifying the Dominant Pillar
Contribution of observable model variables to the determination of resilience pillars
10Figure 2 provides a clear overview of the relative importance of each variable contributing to the resilience pillars. This allows for the identification of key factors driving each pillar and highlights areas for targeted improvement. The weight of each variable for the determination of a pillar (Figure 2) makes it possible to assess the parameters that will have to be strengthened in order to increase the index of this pillar. The availability of sanitary facilities is the most important observable variable of the ABS pillar followed by access to electricity (strong correlation between the variable ‘ABS_improved_toilet’ and the ABS pillar). The proximity of basic services (ABS_proximity) variable is the least relevant for the pillar. Thus, the distance between households and basic social services is not the most important factor to consider when considering this pillar. Otherwise, building basic infrastructure close to households will not have a significant effect compared to installing sanitary infrastructure (toilets) in the short term.
11Three variables are particularly correlated with the AST pillar. These are wealth index (AST_wealth_index), crop production (AST_crop_production), and Farm Assets Index (AST_agri_wealth_index). The latter is slightly more correlated than the other two. Interest will therefore be focused on the least important pillar, Tropical Livestock Unit (AST_TLU) for which action to improve livestock potential would require more resources.
12The level of education of household members (AC_mean_educ) is the variable most correlated with the AC pillar. The variable that comes second in terms of correlation with the pillar is the level of study of the head of the household (AC_head_level). Diversification of speculations (AC_crop_div) brings virtually nothing to the determination of the AC pillar index.
13Within the Pillar (SSN), the variable “cash and in-kind transfers received by the household” (SSN_HH_transfers_received) from an association, family member, etc., in case of problems is most relevant for this pillar. The households receiving these transfers are in small proportion.
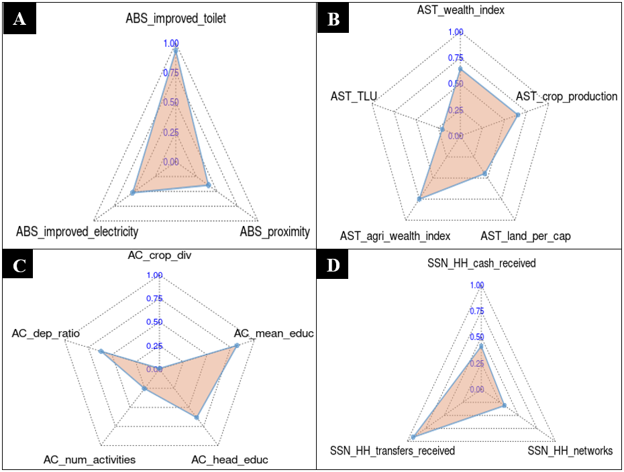
Figure 2: Correlations between sub-variables and resilience pillars.
(A) Access to Basic Services (ABS), including availability of improved sanitary facilities (ABS_improved_toilet), access to electricity (ABS_electricity), and proximity to essential services (ABS_proximity). (B) Assets (AST), comprising the household wealth index (AST_wealth_index), crop production (AST_crop_production), Farm Assets Index (AST_agri_wealth_index), Tropical Livestock Units (AST_TLU), and land owned per capita (AST_land_per_cap). (C) Adaptive Capacity (AC), incorporating crop diversity (AC_crop_div), mean years of education among household members (AC_mean_educ), education level of the household head (AC_head_educ), dependency ratio (AC_dep_ratio), and the number of household livelihood activities (AC_num_activities). (D) Social Safety Nets (SSN). The correlations are based on a factor analysis conducted on survey data from 313 households residing in and around the Luki Biosphere Reserve, Democratic Republic of Congo.
Key pillar of local community resilience in Luki
14According to figure 3, The proportions expressed as a percentage of the different pillars’ contribution to the resilience structure matrix reveal that AST pillar plays the most significant role in determining the household resilience capacity index at the macro level. Productive assets therefore play a major role in the resilience of households to food insecurity. The ABS pillar, coming in second position does not deviate much from the AST pillar, and could also count in a decision-making framework (Figure 3). The SSN pillar contributes the least to the resilience of local communities in the Luki Biosphere Reserve. Relying on this last pillar for resilience building is no less relevant but would require much more resources (financial, material, human, etc.) and in this case, the impacts will be perceived in the long term. It should also be noted that this matrix presents a general framework of the situation for all households combined. From one area to another, the composition of resilience is different.
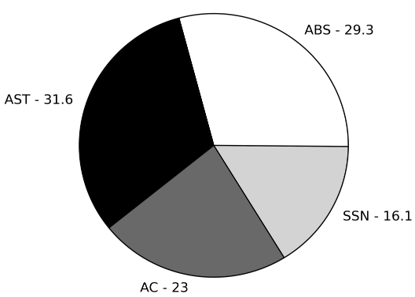
Figure 3: Resilience Structure Matrix used for the calculation of the Resilience Capacity Index (RCI).
The percentages indicate the relative contribution (weight) of each resilience pillar to the overall RCI score. The four pillars include: Access to Basic Services (ABS), Assets (AST), Adaptive Capacity (AC), and Social Safety Nets (SSN). The matrix is derived from the analysis of data collected from 313 households residing in and around the Luki Biosphere Reserve (LBR), Democratic Republic of Congo.
Resilience by locality surveyed
15To better understand the variability of the resilience to food insecurity in the study area, the RCI and the RSM of the different localities are presented in Figure 4. Overall, the results indicate a moderate level of resilience across most communities, with no locality exhibiting extreme vulnerability or complete neglect. Notably, the RCI displays two prominent peaks corresponding to the most resilient localities; Kifudi and Manterne, while Tiva registers the lowest RCI value, indicating relatively lower resilience. This distribution suggests that while some localities perform better, the general trend reflects a prevalence of average resilience throughout the area.
16The study of the resilience structure matrix of each locality shows that the composition of resilience is very variable and different from one locality to another (Figure 4). However, the AST and ABS pillars seem to be the most determining for the calculation of the RCI at the level of most localities, except the localities Kilomètre 28 and Madiadia where the SSN and AC pillars are the most determining. It should be remembered that for these localities, actions to be carried out to increase resilience must be different from those planned at the macro level. In order to increase the resilience of these areas, it will be necessary to act on the social aspect by providing financial or in-kind assistance to communities (for the SSN pillar) and strengthen the education system for a better adaptative capacity (pillar AC).
17For the most resilient village (Kifudi), the absence of the Resilience Structure Matrix (RSM) display limits the interpretation of the results. This absence is due to the lack of variability in the SSN pillar values within the locality, which prevents the model from identifying a differentiated contribution. As a result, it becomes difficult to determine which specific pillar should be prioritized to further enhance resilience, despite the overall positive performance.
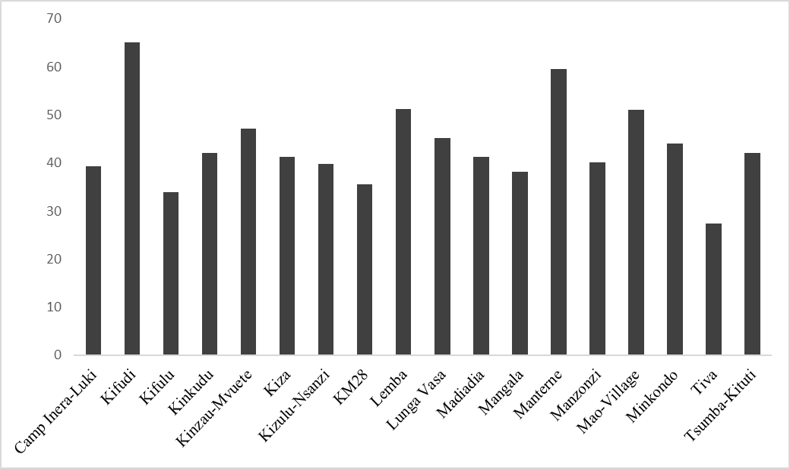
Figure 4a: Distribution of household resilience levels across the surveyed localities within the Luki Biosphere Reserve (LBR), based on average values of the Resilience Capacity Index (RCI).
The x-axis displays the different localities included in the study, while the y-axis represents the corresponding average RCI scores. Results are derived from survey data collected from 313 households residing in and around the LBR.
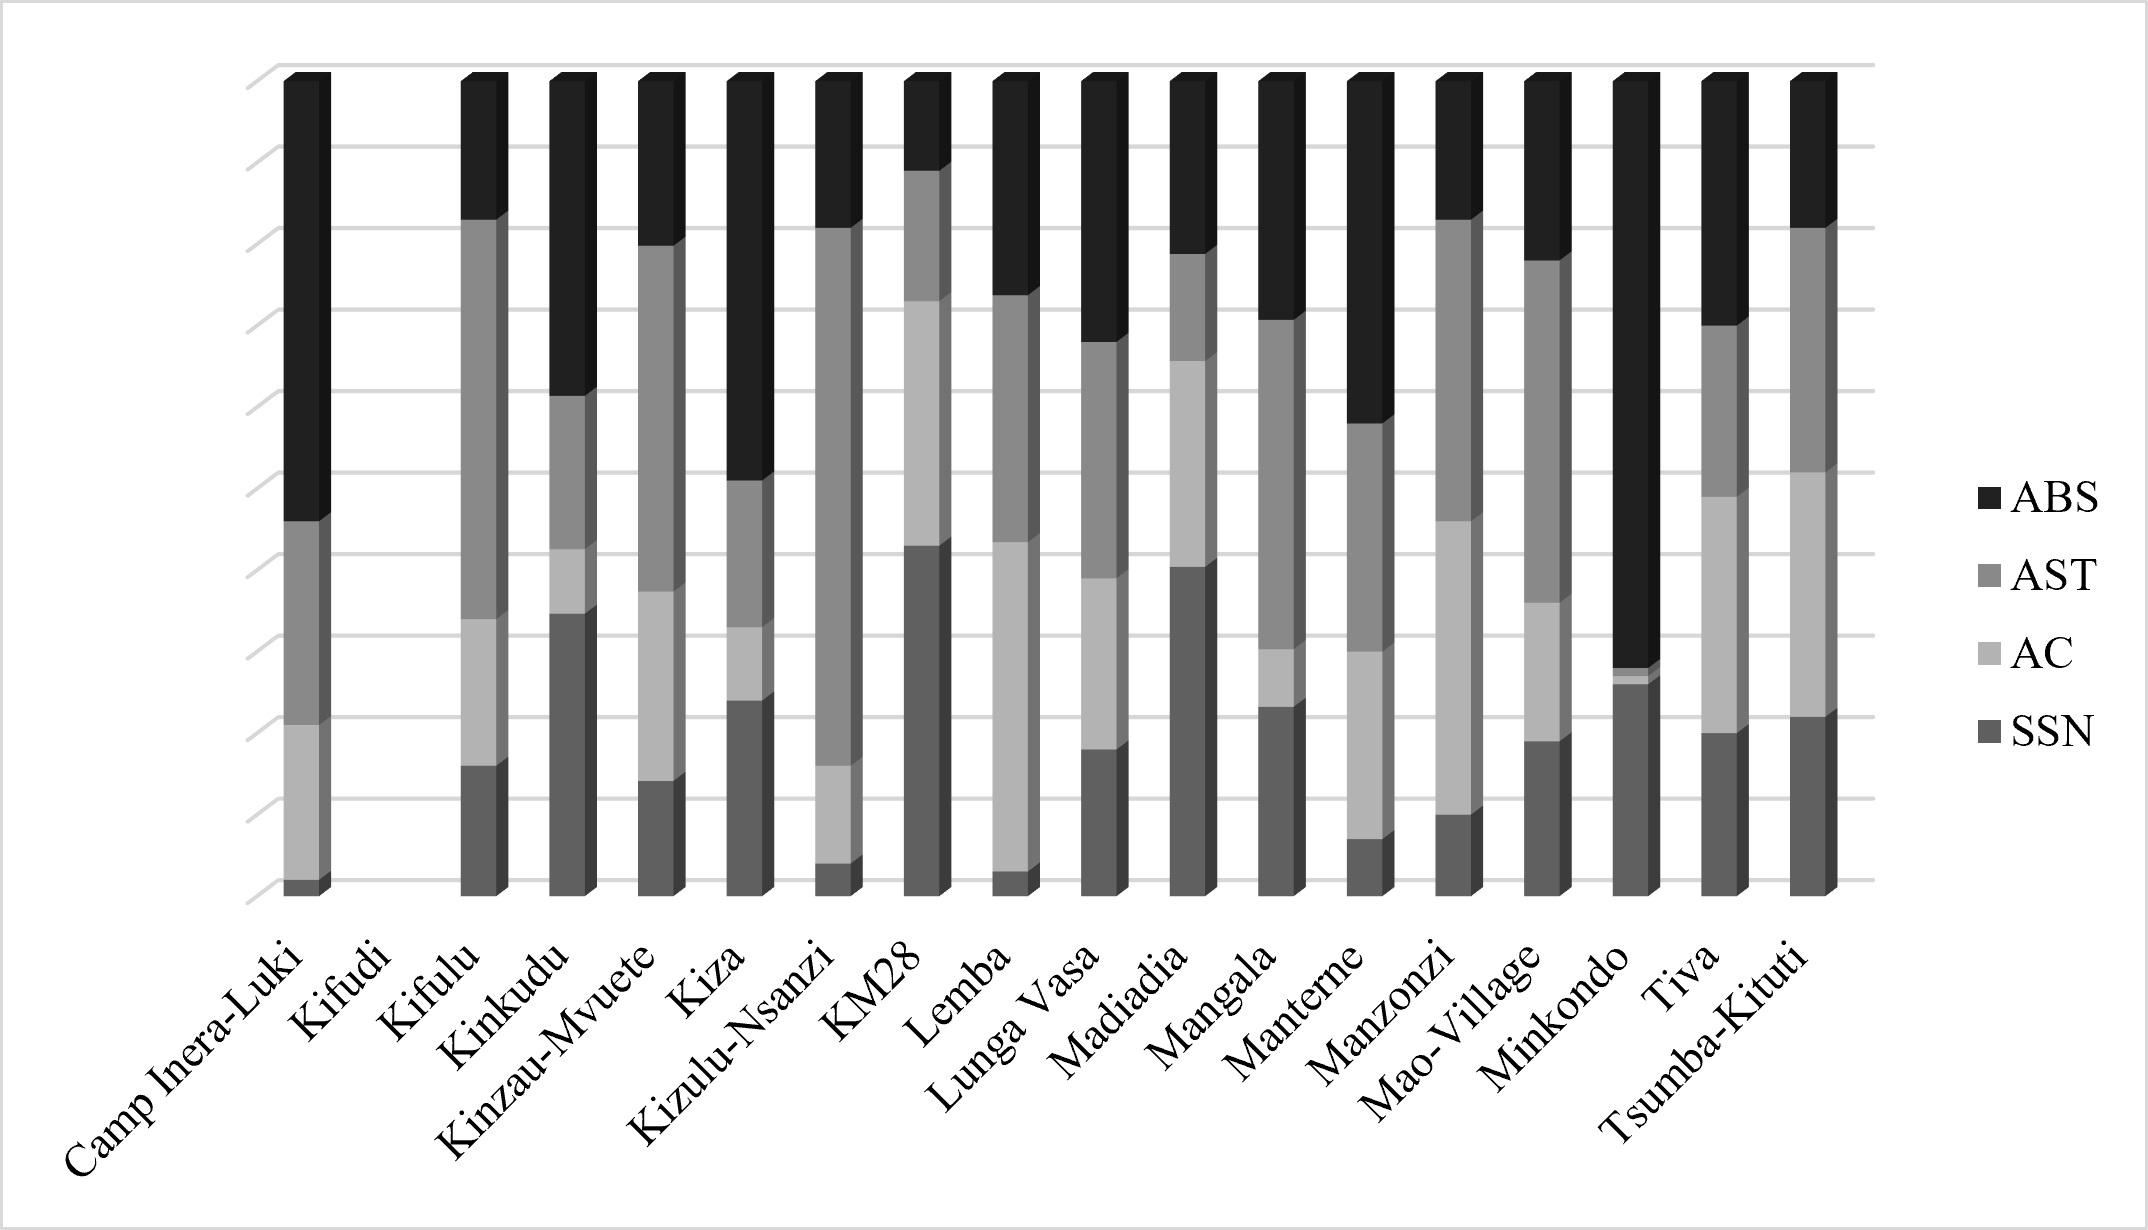
Figure 4b: Resilience Structure Matrix for the calculation of the Resilience Capacity Index (RCI), presented for each surveyed locality in and around the Luki Biosphere Reserve (LBR).
The x-axis displays the different localities included in the study, while the matrix illustrates the relative contribution of the four resilience pillars; Access to Basic Services (ABS), Assets (AST), Adaptive Capacity (AC), and Social Safety Nets (SSN); to the RCI. The results are derived from data collected from 313 surveyed households residing in and around the LBR.
Resilience of local communities of LBR according to the gender of the head of household
18Male-headed households in the RBL are more resilient (45.5 %) than those headed by a woman (40.07%). Indeed, women often become head of households by constraint, typically as a result of divorce, the death of a spouse, or other circumstances beyond their control. Analysis of the resilience structure matrix shows that the SSN pillar of female-headed households is almost non-existent (Figure 5).
19When looking at the level of education by gender at the macro level, women have a lower level (4 years) than men (8 years). The same situation occurs for all members of households headed by a woman compared to households headed by a man (4.68 < 6.34). The level of study could also help to provide a response to the low level of resilience of women compared to men.
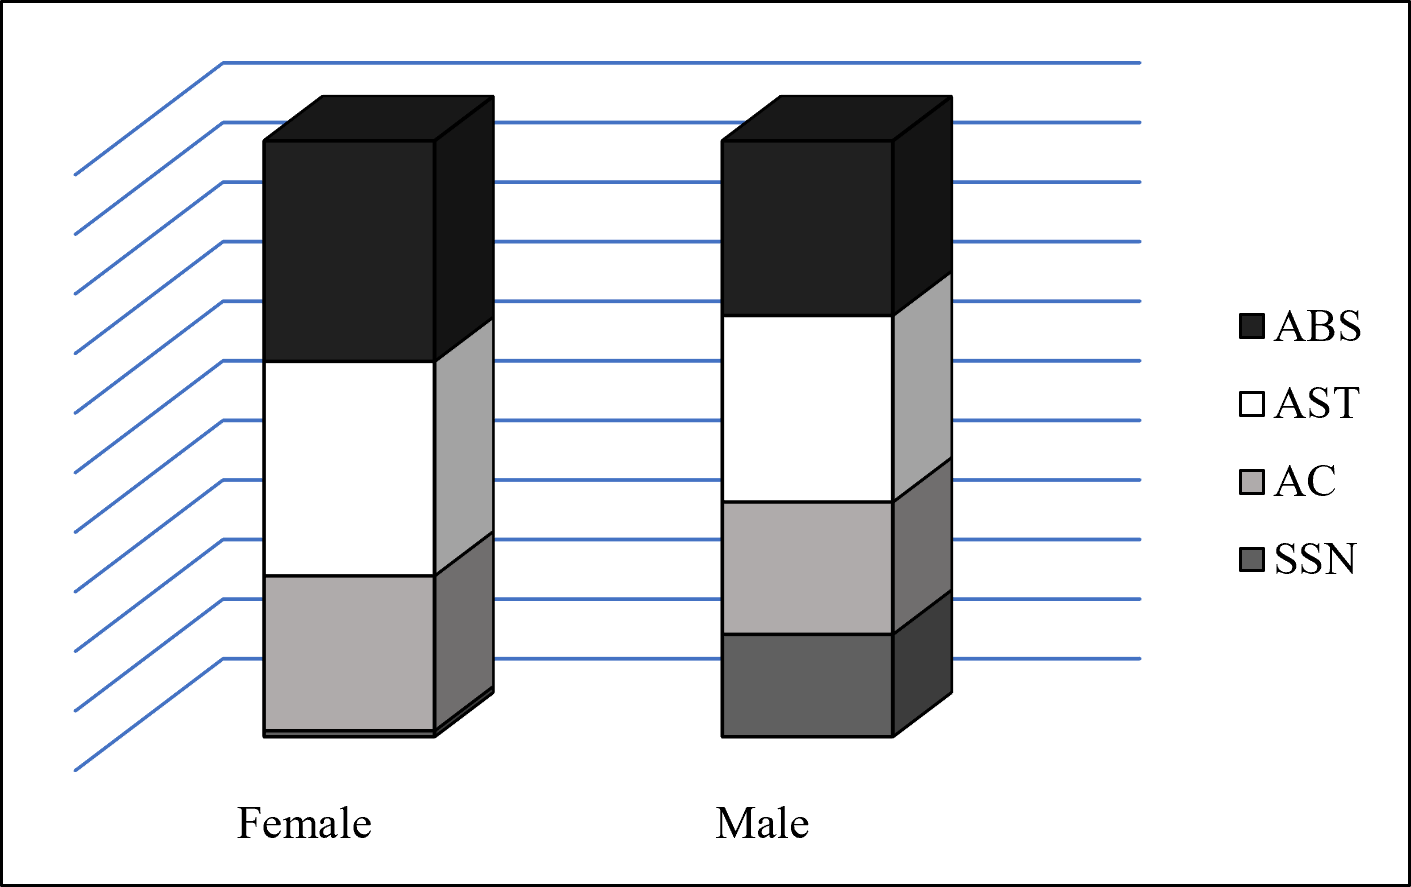
Figure 5: Resilience Structure Matrix (RSM) disaggregated by the gender of the household head.
The x-axis distinguishes the two gender categories of household heads, while the y-axis indicates the relative contribution of each resilience pillar to the Resilience Capacity Index (RCI). The four pillars considered are Access to Basic Services (ABS), Assets (AST), Adaptive Capacity (AC), and Social Safety Nets (SSN). Results are based on data collected from 313 households residing in and around the Luki Biosphere Reserve (LBR), Democratic Republic of Congo.
Categorization of households according to their resilience capacity
20Most households (88.5%) in the LBR are resilient, indicating a generally favorable condition. The average value of LBR household resilience is 44.56% with a standard deviation of 17.93%. The coefficient of variation is 40.24%, which reflects an average variability of values around the average. According to Table 1, it appears that most households in the Luki Biosphere Reserve are resilient (88.5%), when considering the sum of the last two rows of the table. It could be specified that the households belonging to the CLDs are resilient, indicating a positive impact of the projects implemented in this area. There is a low correlation between household size and resilience index (r = 0.28; p<0.0001). This suggests that households with a higher number of members tend to be slightly more resilient.
Table 1: Categorization of Luki Biosphere Reserve Households by Resilience Capacity Index. This classification is based on data collected from 313 households surveyed in and around the Reserve.
|
RCI |
Household Percentage (%) |
Category |
|
0≤RCI≤10% |
0.32 |
Vulnerable |
|
10<RCI≤25% |
11.18 |
Less resilient |
|
25%<RCI≤50% |
56.23 |
Resilient |
|
50%<RCI≤100 |
32.27 |
More resilients |
Link Between Food Consumption and Resilience to Food Insecurity in Luki Biosphere Reserve Communities
21Food security indicators include weekly per capita food consumption (FC_food_exp_per_cap), food consumption index (FC_FCS), and Simpson’s food diversification index (FS_HHDDS). These indicators are the result of resilience.
22At the macro level, the synthesis of food security indicators (table 2) shows that, at the level of the food consumption score, 50% of respondents consume nine (09) food groups. This influences the index of food diversification even if the variability seems more important than the one of the aforementioned parameters. This means that there is a very good food diversification at the local community level of the Luki Biosphere Reserve. It should be remembered that these food groups are estimated on a weekly scale. On the other hand, there is considerable variability in the data on the weekly food consumption of households. The weekly food consumption of a resident of the Luki Biosphere Reserve is 3.29 dollars which is 0.47 dollar per day (940 Congo Franc for a rate of 2000/$). Household size has a significant influence on weekly food consumption.
23Looking at correlations between safety and resilience indicators shows that RCI is strongly correlated with food group diversification (r = 0.89 and 0.87 respectively for the food consumption index and the Simpson food diversification index, p<0.01). The correlation of RCI with weekly food consumption per capita is very low (0.1). Resilience to food insecurity therefore does not provide an important response to monetary food consumption. It means that the quantities consumed are not at all important for all food groups, or for most of them.
Table 2: Statistical summaries of food security indicators. Data collected on 313 households living in and around the Luki Biosphere Reserve (LBR)
|
Indicators of FS |
Mean |
St-deviation |
IQR |
CV |
Min |
Median |
Max |
|
FS_FCS |
63.32 |
13.83 |
13 |
0.22 |
29.50 |
62 |
109 |
|
FS_food_exp_per_cap |
3.29 |
1.80 |
1.73 |
0.55 |
0.83 |
2.86 |
13 |
|
FS_HHDDS |
9.06 |
0.99 |
2 |
0.11 |
6 |
9 |
12 |
24The RCI profile (Figure 6) confirms previous results. Indeed, the figure presents at the first level, the pillars (latent variables) and the weight of their contribution to the determination of resilience. This presentation is different from the one presented above at the level of the resilience structure matrix (Figure 3). The fuller the arrow is, the more it contributes to the determination of the upper rank parameter. It should be noted that the AST pillar has a larger contribution, hence its higher coefficient. The three resilience indicators (FS1, FS2 and FS3) are the result of resilience (Figure 6). Community resilience gives a better response to the food consumption index and the food diversification index than to food consumption. The coefficient of the linear regression of the resilience index on food consumption indicates that the increase of one unit of household resilience will lead to an increase of 0.11 unit of the value of household food consumption.
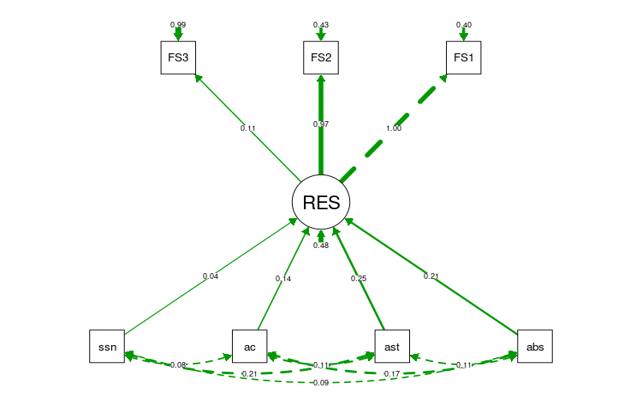
Figure 6: RIMA-II Representation of Luki Biosphere Reserve (LRB) Local Communities.
FS1: FCS (Food Consumption Score), FS2: HHDDS (Household Dietary Diversity Score), FS3: FC (Food Consumption). The resilience (RES) structure is organized around four pillars: Access to Basic Services (ABS), Assets (AST), Adaptive Capacity (AC), and Social Safety Nets (SSN). The analysis is based on data collected from 313 households residing in and around the LBR.
DISCUSSION
Implications of Resilience Patterns and Pillar Contributions
The results show that there is a positive correlation between pillars and resilience. Productive assets (AST) and access to basic social services (ABS) are the pillars contributing most to the resilience of local communities in the Luki Biosphere Reserve. The SSN pillar contributes the least. The most relevant variables for the construction of the resilience structure matrix (RSM) are access to sanitary facilities (toilets), the index of non-agricultural goods, the index of agricultural goods and the agricultural production of the household. These results are virtually similar to those obtained by FAO (2015) in the Triangle of Hope in Mauritania where the resilience capacity of households is strongly influenced by Access to Basic Services (ABS) and Assets (AST). Both descriptive analysis and causal analysis of resilience highlight the importance of access to sanitation, market distances and wealth index for resilience to food insecurity in Senegal (FAO, 2015). The toilets of local communities are traditional but, in many localities, they are non-existent for some households. Feces are left in vegetation close to homes, which could pose a risk of waterborne diseases over time. According to Ndong et al. (2018), toilets are basic infrastructures that a household must have within it in order to reduce its vulnerability and that of the community in terms of health, especially for the fecal hazard. In his study including both rural and urban households in Burkina Faso, traditional toilets were more prevalent in rural areas. Improvements to these toilets could reduce the risk of fecal diseases, thereby reducing the health costs that may be subject to them, to increase their resilience.
Resilience to food insecurity integrates gender. Male-headed households are expected to have better living conditions than female-headed households (Lachaud, 2003 cited par Yaro, 2019). The results obtained within the local communities of the LBR point to the same direction. LBR women have very little access to cash or in-kind transfers. Households headed by ‘women’ households are less resilient than those headed by ‘men’ (Ndong et al., 2018). This resilience-gender relationship was mentioned by Djogbenou (2015). Indeed, this lower resilience of women in the Senegalese context could be explained by the fact that rural women are stay-at-home mothers who often do not access paid employment and even if they manage to have work, it would be justified by the fact that rural women do not often have a high level of education (ANSD, 2015). This may also be the result of the gap between the low educational attainment of women and men in the LBR.
Food Consumption and Resilience: Implications for Measuring Adaptive Capacity in Luki Biosphere Reserve Households
25Measures concerning food groups consumed are strongly correlated with the resilience capacity of LBR households. There are no established limits on the number of food groups from which dietary diversity is considered adequate or inadequate. Furthermore, there is no international consensus on which food groups should be included in the scores (Kennedy and al., 2011). Nevertheless, we note that food diversity remains very significant for most households in the LBR. The question remains about the quantities of these food groups for which there is no precision in the RIMA model. The models, including the consumed quantities of these food groups are much more complex. Others go so far as to assess the severity of food security. This is the example of the FIES (Food Insecurity Experience Scale) developed by Cafiero, which is a contribution to the implementation of a global monitoring indicator of food insecurity (Cafiero et al., 2018).
26The collection period could also have a significant impact on food availability or food groups. The best time of year to measure the dietary diversity of households or individuals depends on the purpose of the survey or monitoring activity. In the case of assessing the food security situation in rural farming communities, the maximum food shortage period is recommended, for example just before harvest, or immediately after an emergency or natural disaster. This assessment can also be used as a reference to monitor changes in food security following an intervention or to study seasonality (Kennedy et al., 2011). In our context, the survey took place during the dry season. Taking this parameter into account, we could expect much better consumption situations during the rainy season. Food diversity will certainly be more important.
From Data to Insight: Implications of Household Resilience Findings
27The analysis of the Resilience Structure Matrix (RSM) and Resilience Capacity Index (RCI) reveals that the AST pillar plays a dominant role in shaping overall resilience, underscoring the need to strengthen agricultural and non-agricultural assets. These findings are consistent with those of Gnonyi et al. (2024), who observed that farmers practicing agro-silviculture in northern Benin displayed significantly higher resilience levels due to improved income and access to ecosystem services. The results of this study provide important insights into household resilience dynamics within the Luki Biosphere Reserve. The high proportion of resilient households (88.5%) suggests a generally favorable level of adaptive capacity to food insecurity and environmental stressors in the area. Notably, the findings indicate that households participating in Local Development Committees (CLD) initiatives are more likely to be resilient, highlighting the positive impact of such projects on local communities. Additionally, while spatial variability in resilience was observed with Kifudi and Manterne showing the highest resilience and Tiva the lowest, most communities exhibit moderate resilience levels, implying a potential for targeted improvements. The low but statistically significant correlation between household size and resilience further suggests that larger households may benefit from diversified labor and income sources, although this effect remains modest. However, several limitations must be acknowledged. The study's sample size, although adequate for exploratory analysis, is limited to 313 households and may not fully represent the broader regional context. Moreover, the cross-sectional nature of the data prevents analysis of long-term trends or causality. The reliance on self-reported data introduces the possibility of bias, and the selection and weighting of variables in the RCI and RSM models could influence the findings. Lastly, while gender-disaggregated analysis was conducted, a deeper examination of gender dynamics within households was beyond the scope of this study. These limitations suggest that future research should incorporate longitudinal data, broader sampling, and more nuanced social analyses to deepen understanding of resilience drivers. Resilience is a dynamic concept that evolves with shocks and adaptive capacities. Environmental degradation or land-use changes as stressors may undermine resilience in certain localities (e.g., Tiva). As shown by Balandi et al. (2024) in Kisangani, spatial fragmentation of natural vegetation due to urban expansion or agricultural intensification can severely compromise ecosystem services that support local resilience.
CONCLUSION
28This study assessed the food insecurity resilience of local communities in the Luki Biosphere Reserve (LBR). The objective is to identify the priority needs of households for a better level of food security and the reduction of anthropogenic pressures on the reserve. The FAO RIMA tool was used to collect and analyze data from 313 households in 18 locations in the Luki Biosphere Reserve. Our work shows that the majority of LBR households are resilient to food insecurity. Assets (AST) and Access to Basic Services (ABS) pillars best contribute to the resilience of local LBR communities in general. Results show that the AST pillar is the most important of all the pillars and productive assets are the needs of these communities. Thus, the hypothesis that Access to Basic Services is the most important pillar of local community resilience in the Luki Biosphere Reserve appears to be partially supported and remains open to debate. This resilience of LBR households varies by locality and gender of the head of household. Households headed by men are more resilient than those headed by women. Food security indicators correlate positively with resilience even if food consumption has a low correlation. The hypothesis stating that weekly per capita food consumption provides a better appreciation of the resilience of local LBR communities to food insecurity is questionable. Food groups are a better response to the resilience of LBR households. It is up to policy makers and development programs to address the priority needs of each LBR locality in order to increase their level of resilience and significantly reduce anthropogenic pressures on the reserve. The RIMA tool provides a quick estimate of resilience capacity at a single point in time. Now, resilience is a dynamic concept that evolves with shocks and adaptive capacities. It is therefore important that panel data should be collected to verify their validity over the long term and better appreciate the real evolution of resilience within communities. The study recommends strengthening as a matter of priority the AST pillar, by supporting agricultural production and local assets, while perpetuating the Local Development Committees (CLD). Less resilient areas, such as Tiva, need targeted interventions. Longitudinal monitoring is essential to assess the evolution of resilience. The results of the RIMA should guide public planning, considering social and gender inequalities. Finally, a multisectoral approach integrating agriculture, health, education and nutrition is essential.
ACKNOWLEDGMENTS
29The authors thank the Regional Postgraduate School of Integrated Management of Tropical Forests and Lands (ERAIFT), WWF-DRC and GIZ for funding this research as part of the project: “Strengthening climate change resilience of local communities in Luki and Maï-Ndombe in DRC”, funded by European Union. May the local communities of the Luki Biosphere Reserve find in this work the fruit of their collaboration.
Bibliography
Adjimoti, G. O., & Kwadzo, G. T. M. (2018). Crop diversification and household food security status: Evidence from rural Benin. Agriculture and Food Security, 7(1), 1–12. https://doi.org/10.1186/s40066-018-0233-x
Agence Nationale de lq Statistique et de la démographie du Sénégal (ANSD). (2015). Enquête à l’écoute du Sénégal.
Alinovi, L., D’Erricco, M., Mane, E., & Romano, D. (2010). Livelihoods strategies and household resilience to food security: an empirical analysis to Kenya. In: Paper prepared for the Conference on “Promoting Resilience through Social Protection in Sub-Saharan Africa”, organised by the European Report of Developm.
Alinovi, L., Mane, E., & Romano, D. (2008). Towards the Measurement of Household Resilience to Food Insecurity: Applying a Model to Palestinian Household Data. In R. Sibrian (Ed.), Deriving Food Security Information From National Household Budget Surveys, Experiences, Achievement, Challenges (pp. 153–166). FAO.
Azine, P. C., Mugumaarhahama, Y., Mutwedu, V. B., Mondo, J. M., Chuma, G. B., Buchekabiri, A., Mutume, T., Bagula, E. M., Ayagirwe, R. B. B., Baenyi, S. P., Bacigale, S. B., & Karume, K. (2025). Assessing smallholder farmers’ vulnerability to climate change and coping strategies in South Kivu Province, eastern Democratic Republic of Congo. Environmental Systems Research, 14(1). https://doi.org/10.1186/s40068-025-00393-8
Babio, S., Hougni, A., & Yabi, J. A. (2023). Sécurité Alimentaire au Bénin: Les Grandes Familles de Pratiques Agro-écologiques Adoptées dans les Zones Cotonnières. European Scientific Journal, ESJ, 19(12), 32. https://doi.org/10.19044/esj.2023.v19n12p32
Balandi, J. B., To Hulu, J. P. P. M., Sambieni, K. R., Sikuzani, Y. U., Bastin, J. F., Musavandalo, C. M., Nguba, T. B., Jesuka, R., Sodalo, C., Pika, L. M., & Bogaert, J. (2024). Anthropogenic Effects on Green Infrastructure Spatial Patterns in Kisangani City and Its Urban–Rural Gradient. Land, 13(11). https://doi.org/10.3390/land13111794
Barrett, C., & Constas, M. (2014). Toward a theory of resilience for international development applications. Proc Natl Acad Sci USA, 111, 14625–14630.
Bellon, M. R., Ntandou-Bouzitou, G., Lauderdale, J. E., & Caracciolo, F. (2023). Combining market and nonmarket food sources provides rural households with more options to achieve better diets in Southern Benin. Food Security, 15(2), 411–422. https://doi.org/10.1007/s12571-022-01320-w
Béné, C., Newsham, A., Davies, M., Ulrichs, M., & Godfrey-Wood, R. (2014). Review article: Resilience, poverty and development. Journal of International Development, 26, 598–623. https://doi.org/10.1002/jid
Béné, C., Wood, R. G., Newsham, A., & Davies, M. (2012). Resilience: New Utopia or New Tyranny? Reflection about the Potentials and Limits of the Concept of Resilience in Relation to Vulnerability Reduction Programmes. In IDS Working Papers (Vol. 2012, Issue 405). https://doi.org/10.1111/j.2040-0209.2012.00405.x
Bernard, A. (2014). Utilisation des terres et REDD+: Le renforcement des capacités des communautés dans et autour de la Réserve de biosphère de Luki par une meilleure compréhension des usages.
Cafiero, C., Viviani, S., & Nord, M. (2018). Food security measurement in a global context : The Food Insecurity Experience Scale.
CARE France. (2014). Tchad : appui au renforcement de la résilience des ménages affectés par la crise alimentaire à l’Est du pays.
Dagbeto, R., Adekambi, S. A., & Yabi, J. A. (2022). Mutuelles Communautaire de Nutrition (NMC) et Sécurité Alimentaire et Nutritionnelle des Enfants, Amélioration de la Résilience Nutritionnelle des Ménages dans un Contexte de Développement Durable en Afrique: Une Revue Systématique de Littérature. European Scientific Journal ESJ, 11, 434–457. https://doi.org/10.19044/esipreprint.11.2022.p434
Desclee, D., Michel, B., & Trefon, T. (2018). Enquête et étude de diagnostique des capitaux et stratégies d’existence des ménages dépendants des ressources de la Réserve de Biosphère de Luki en République Démocratique du Congo. In Tropicultura (Vol. 36, Issue 3, pp. 492–505).
Dhraief, M. Z., Dhehibi, B., Hassen, H. D., & Zlaoui, M. (2019). Livelihoods Strategies and Household Resilience to Food Insecurity : A Case Study from Rural Tunisia. 1–17. https://doi.org/10.3390/su11030907
Djogbenou, R. (2015). Livelihood strategies and household resilience to food insecurity: The case of Niger.
Dury, S., Alpha, A., Zakhia-Rozis, N., & Giordano, T. (2021). Les systèmes alimentaires aux défis de la crise de la Covid-19 en Afrique : enseignements et incertitudes. Cahiers Agricultures, 30, 12. https://doi.org/10.1051/cagri/2020052
FAO. (2012). Data Cleaning and management. Short RIMA Manual 1.0, Part B.
FAO. (2015). Analyse de la résilience dans le triangle de l’espoir, Mauritanie. 1–68.
FAO. (2016a). Mesure et analyse de l’indice de résilience.
FAO. (2016b). Rima-II : Une version améliorée du modèle de mesure et d’analyse de l’indice de résilience – RIMA ( Resilience Index Measurement and Analysis ).
FAO. (2016c). RIMA-II: Moving foward the development of the resilience index measurement and analysis model. 4.
FAO. (2016d). RIMA II, Resilience Index Measurement and Analysis - II.
FAO. (2021). Shiny RIMA Methodology. Not published.
FSIN. (2014a). Common analytical model for resilience measurement. Causal framework and methodological options. Technical Series. 2. I. FAO, WFP, EU, USAID Food Security Information Network. Resilience Measurement Technical Working Group.
FSIN. (2014b). Resilience measurement principles. Toward an agenda for measurement design. Technical Series. 1. I. FAO, WFP, EU, USAID Food Security Information Network. Resilience Measurement Technical Working Group.
Gambo Boukary, A., Diaw, A., & Wünscher, T. (2016). Factors affecting rural households’ resilience to food insecurity in Niger. Sustainability (Switzerland), 8(3), 1–10. https://doi.org/10.3390/su8030181
GIZ. (2015). Sécurité alimentaire et renforcement de la résilience. Initiative spéciale « Un seul monde sans faim ». Bonn/Eschborn : Ministère fédéral allemand de la coopération économique et du développement (BMZ).
Gnonyi, I. H., Kokou, K. B., Teteli, S. C., Fagnibo, A. H., Atade, S. R., Sodalo, C., Ebuy, A. J., & Akossou, A. Y. J. (2024). Pratiques Agroforestières et Résilience Climatique : Étude de Cas dans la Commune de Djougou (Bénin). Revue Ecosystèmes et Paysages, 4(2), 1–20. https://doi.org/10.59384/recopays.tg4205
GRET. (2014). Améliorer la résilience des populations vulnérables en matière de sécurité alimentaire et nutritionnelle. In : Projet Résanut. Nogent-sur-Marne, France.
Houessou, L. G., Teka, O., Toko, I., Lykke, A. M., & Sinsin, B. (2013). Land Use and Land-Cover Change at “W” Biosphere Reserve and Its Surroundings Areas in Benin Republic (West Africa). Environment and Natural Resources Research, 3(2). https://doi.org/10.5539/enrr.v3n2p87
IPCC. (2007). Climate Change 2007 - The Physical Science Basis. Contribution of Working Group I to the Fourth Assessment Report of the IPCC. In Cambridge University Press. https://doi.org/10.1256/wea.58.04
IPCC. (2012). Managing the Risks of Extreme Events and Disasters to Advance Climate Change Adaptation. Special report. In Journal of Epidemiology and Community Health (Vol. 66, Issue 9). https://doi.org/10.1136/jech-2012-201045
IPCC. (2014). Climate change. Synthesis report.
Israel, G. D. (1992). Determining Sample Size.
Kennedy, G., Ballard, T., & Dop, M.-C. (2011). Guide pour mesurer la diversité alimentaire au niveau du ménage et le l’individu. FAO, Rome, Italy.
Lachaud, J. P. (2003). Les déterminants de l’inégalité du bien-être au Burkina Faso: une décomposition de régression, Université Montesquieu-Bordeaux IV –France.
Martin-Breen, P., & Marty Anderies, J. M. (2011). Resilience: A Literature Review. The Bellagio Initiative,.
Matsalabi, A. A., Savadogo, P., & Shah, A. A. (2018). Farmers’ awareness and perception of climate change impacts : case study of Aguie district in Niger. December. https://doi.org/10.1007/s10668-018-0173-4
Musavandalo, C. M., Essouman, P. F. E., Ndjadi, S. S., Balandi, J. B., Nguba, T. B., Sodalo, C., Mweru, J. P. M., Sambieni, K. R., & Bogaert, J. (2025). Anthropogenic Disturbances in Northwestern Virunga Forest Amid Armed Conflict. Land, 14(4). https://doi.org/10.3390/land14040732
Muteba, D., Ntoto, R., & LebaiLLy, P. (2015). Sécurité alimentaire à Kinshasa : vers la ruralisation des pratiques alimentaires des ménages urbains. In J. Bogaert & J.-M. Halleux (Eds.), Territoires périurbains. Développement, enjeux et perspectives dans les pays du Sud (pp. 163–173). Presses agronomiques de Gembloux.
Ndong, M., Kane, R., Bassama, J., & Guiro, A. T. (2018). Mesure de la résilience à l’insécurité alimentaire dans les zones Nord et Sud du Sénégal. Revue Marocaine Des Sciences Agronomiques et Vétérinaires., 7, 233–239.
Ngabinzeke, J. S., & Tongo, Y. M. (2019). Livelihoods Means and Local Populations Strategies of the Luki’s Biosphere Reserve in Democratic Republic of Congo. 4(2), 42–49. https://doi.org/10.11648/j.ijnrem.20190402.12
Nyange, M. N. (2014). Participation des communautés locales et gestion durable des forêts : cas de la Réserve de la biosphère de Luki en République Démocratique du Congo. In Thèse de doctorat. Université Laval & Université de Kinshasa.
PAM. (2008). Food consumption analysis: calculation and use of the food consumption score in food security analysis.
Simpson, E. H. (1949). «Measurement of species diversity», x. Nature, 163: 688.
USAID. (2012). Building resilience to recurrent crisis – USAID policy and program guidance. Washington DC, USA: U.S. Agency for International Development.
USAID. (2013). The resilience agenda: measuring resilience in USAID. Washington DC, USA: U.S. Agency for International Development.
Vaitla, B., Coates, J., Glaeser, L., Hillbruner, C., Biswal, P., & Maxwell, D. (2017). The measurement of household food security : Correlation and latent variable analysis of alternative indicators in a large multi-country dataset. Food Policy, 68, 193–205. https://doi.org/10.1016/j.foodpol.2017.02.006
Vonthron, S., Dury, S., Fallot, A., Alpha, A., & Bousquet, F. (2016). L’intégration des concepts de résilience dans le domaine de la sécurité alimentaire: regards croisés. Cahiers Agricultures, 25(6). https://doi.org/10.1051/cagri/2016039
Zaidi, S., Dhehibi, B., Dhraief, M. Z., & Abdeladhim, M. A. (2023). Résilience des ménages face à l’insécurité alimentaire et au changement climatique dans les régions du centre et du nord-est de la Tunisie: Une analyse empirique. New Medit, 22(1), 19–34. https://doi.org/10.30682/nm2301b
Notes
1 When sugars and oils/fats are consumed daily, scores > 42 are considered acceptable, 28 to 42 at the limit and < 28 low (Vaitla et al., 2017).
2 https://foodandagricultureorganization.shinyapps.io/ShinyRIMA_HHresilience/ accessed on July 9, 2025.
To cite this article
About: Carlo SODALO*
Regional Post-graduate Training School on Integrated Management of Tropical Forests and Lands (ERAIFT), Kinshasa, Democratic Republic of Congo (DRC)
Applied Statistics and Informatics Unit (USIA), Forestry Studies and Research Laboratory (LERF), Faculty of Agronomy, University of Parakou, Republic of Benin.
Corresponding author: sodalocarlo@yahoo.fr
About: Ernestine LONPI TIPI
Regional Post-graduate Training School on Integrated Management of Tropical Forests and Lands (ERAIFT), Kinshasa, Democratic Republic of Congo (DRC)
About: Ruth Raphaëlle OBVALA
Regional Post-graduate Training School on Integrated Management of Tropical Forests and Lands (ERAIFT), Kinshasa, Democratic Republic of Congo (DRC)
About: Kouagou Raoul SAMBIENI
Regional Post-graduate Training School on Integrated Management of Tropical Forests and Lands (ERAIFT), Kinshasa, Democratic Republic of Congo (DRC). Faculty of Architecture, University of Lubumbashi, Democratic Republic of Congo (DRC)
About: Henri Paul ELOMA
Department of Biology, Faculty of Sciences, National Pedagogical University (UPN), Kinshasa, Democratic Republic of Congo (DRC)
Assistant to the Representative, Programme Officer, FAO, Democratic Republic of Congo DRC
About: Joseph LUMANDE KASALI
Regional Post-graduate Training School on Integrated Management of Tropical Forests and Lands (ERAIFT), Kinshasa, Democratic Republic of Congo (DRC)
Faculty of Sciences and Technologies, University of Kinshasa, Democratic Republic of Congo (DRC)
About: Yves Justin Arcadius AKOSSOU
Applied Statistics and Informatics Unit (USIA), Forestry Studies and Research Laboratory (LERF), Faculty of Agronomy, University of Parakou, Republic of Benin
