


- Accueil
- Volume 91 - Année 2022
- Numéro 1
- Importance of Beach Evaluation for Integrated Coastal Zone Management


Visualisation(s): 2875 (29 ULiège)
Téléchargement(s): 275 (0 ULiège)

Importance of Beach Evaluation for Integrated Coastal Zone Management
A Case Study of Tyre Southern Lebanon

Document(s) associé(s)
Version PDF originaleAbstract
Coastal erosion and accretion are short-term and long-term processes that may cause changes in shoreline and beach profiles. Monitoring beach profile is important to figure out the factors that are responsible for these changes so it helps the stakeholders in planning sustainable beach management that plays a vital role in achieving Integrated Coastal Zone Management (ICZM). For this reason, a beach survey was conducted at the study area to monitor and determine the factors that led to erosion and accretion on beach profile. DEM (Digital Elevation Model) helped on comparing between the elevations of ground control points through four seasons of the survey, which compensated: November 2020, December 2020, February 2021, April 2021 and July 2021. The used methodology of using GPS (Global Positioning System) depended on stop and go methodology within the two locations in the study area: site A (Jal El Bahr north of Tyre) and site B (Bahr Slaiyeb south of Tyre). GIS (Geographic Information System) is another tool that was used to have LC (land cover) map. Meteorological data was extracted from Saksakye weather station north of Tyre.
Results of beach survey indicated that the two study areas were exposed to change on profile through the study period especially at Bahr Slaiyeb. These changes in the two study areas are a result of anthropogenic pressure (grooming and cleaning, grazing, human trampling, construction, etc..), vegetation cover and meteorological factors (wind speed, wind direction and precipitation). This database could be used to support in outlining the baseline of strategic beach monitoring and ICZM.
Table des matières
Manuscript received on March 5, 2022 and accepted on July 5, 2022
This article is distributed under the terms and conditions of the Creative Commons license CC-BY 4.0
1. Introduction
1Coastal zones are among the world's most productive locations, providing a diverse range of rich habitats and ecosystem services that have drawn humans and human activities for millennia (Tissier, 2020). As a result of increased industry, trade and commerce, tourism, and the population growth and migration, as well as diminished water quality, the world's coastal zone became increasingly stressed (Nayak, 2000). Long-term management tools must be used to improve coastal resource conservation while increasing the sustainable growth of their use (Tissier, 2020).
2ICZM is a widely acknowledged management framework for addressing coastal and marine environmental challenges and disputes, as well as achieving sustainable coastal resource use, especially in poor countries (Pollnac and Pomeroy, 2005). The mission of the ICZM is to accomplish sustainable development of coastal and marine areas, which includes preserving important natural processes, promoting economic development, and resolving disputes arising from numerous uses of coastal space (Meliadou et al., 2012). The Mediterranean Sea is dealing with a number of environmental issues, including habitat morphological changes, water deterioration, eutrophication, alien species introduction, shoreline erosion, and increased surface water vulnerability (Maugendre et al., 2015). Because of these realities, an integrated management strategy for this coastal zone is required (Zaucha et al., 2016). ICZM was used in the Mediterranean Sea to attain Good Environmental Status (GEnS) for its ecological systems by 2020 (Knežević and Petović, 2016).
3Beaches are already threatened by a variety of human activities. Human changes to sandy shores began at least two centuries ago (Nordstrom, 2000), and are predicted to intensify exponentially over the next few decades (Brown et al., 2008). Evidence for ecological change in beach ecosystems, which are exposed to human pressures at scales and intensities unmatched in history, is accumulating worldwide (Brown and McLachlan 2002; Schlacher et al., 2007). Aside from direct anthropogenic effects on beaches, global climate change is expected to have profound, broad, and long-term ramifications for the world's marine ecosystems (Feagin et al., 2005; Harley et al., 2006). Planners and decision makers need a greater awareness of the instability of sandy beaches and the possible impact of human activities. It is vital to know the shoreline evaluation according to the linked time scale for coastal management purposes (Toure et al., 2019). Furthermore, comprehending coastal erosion necessitates a comprehension of all the elements that interact along the coast, as well as an awareness of various timelines (Marchand et al., 2011). Erosion is a phenomenon that occurs over a wide range of time scales in this context. As a result, in order to combat erosion, a comprehensive view of processes at many scales is required (Fekete et al., 2009).
4On sandy coasts, many present and future conservation and mitigation approaches necessitate active threat management. The examination of morphological changes in beach-dune systems are required for the research and management of coastal regions, at least in certain sectors (Pardo-Pascual et al., 2005). Monitoring the behavior of shorelines is of considerable social and economic importance in support of setback planning, hazard zoning, erosion-accretion management, regional sediment budgets, and the establishment and validation of models for coastline changes (Zuzek et al., 2003). Shoreline change assessment is a crucial component of coastal engineering project planning and evaluating, large-scale shoreline change studies are required to determine the magnitude of the issues and important concern areas (Stauble et al., 2003). Monitoring shoreline changes aids in determining the nature and processes that caused the changes in any given location, assessing the human impact, and planning management (Jana et al., 2016). To build sustainable shoreline management plans, it is vital to monitor and understand long-term, seasonal, and short-term shoreline changes (Kankara et al., 2015).
5No matter how several initiatives were done by the Lebanese government to achieve ICZM, these initiatives did not reach their aims. Lebanon still lacks an integrated plan or strategy for the administration and protection of its coastal zone. Due to some of the irreversible losses to Lebanon's coastal zone, which is considered a national asset of significant economic importance, the adoption of such a strategy/plan has grown increasingly vital and urgent by the day. Different research confirms that sandy beaches on Tyre as Lebanese beaches have been exposed to the erosion and accretion from Qasmieh till Naqoura (Saad et al., 2021). Despite this fact, there is no studies light upon the factors that lead to this phenomenon, also there is no integrated system of beach management designed to evaluate beach environments from all aspects. This study investigates the beach profile change which aims to establish a base information about human and physical factors that lead to this change. This research is an early stage of the decision making process that helps stakeholders and authorities in the planning for ICZM.
2. Study area
6Tyre shoreline is located to the south of the Lebanese coast. Tyre is one of the most well-known Phoenician cities, it is one of the biggest areas of Lebanon's coastal plain, ranging in width from a few hundred meters to three kilometers (Nir, 1996).
7Tyre's maritime location is noteworthy; it is located along the Mediterranean coast, approximately 80 kilometres south of Beirut and 26 kilometres north of the international border. Tyre's coastal zone is a densely populated area marked by significant levels of immigration, which has been a feature of this region since decades. A diverse spectrum of economic, commercial, and recreational activities is attracted to this location. Tyre as many Mediterranean cities plays a vital role in touristic sector. In busy summer days, Tyre’s public beach can attract up to 20,000 visitors.
8Two sandy beaches were selected in this study (Figure 1), the first is Jal El Bahr (Site A) located at north of Tyre city, and the second is Bahr Slaiyeb (Site B) located at the South of Tyre city. Site A is a part of Al Abbasiye and El Bourghliye Beach, where the width of the beach exceeds 50 meters, with fine sand smoothly rising up to the dunes (Kasparek, 2015).
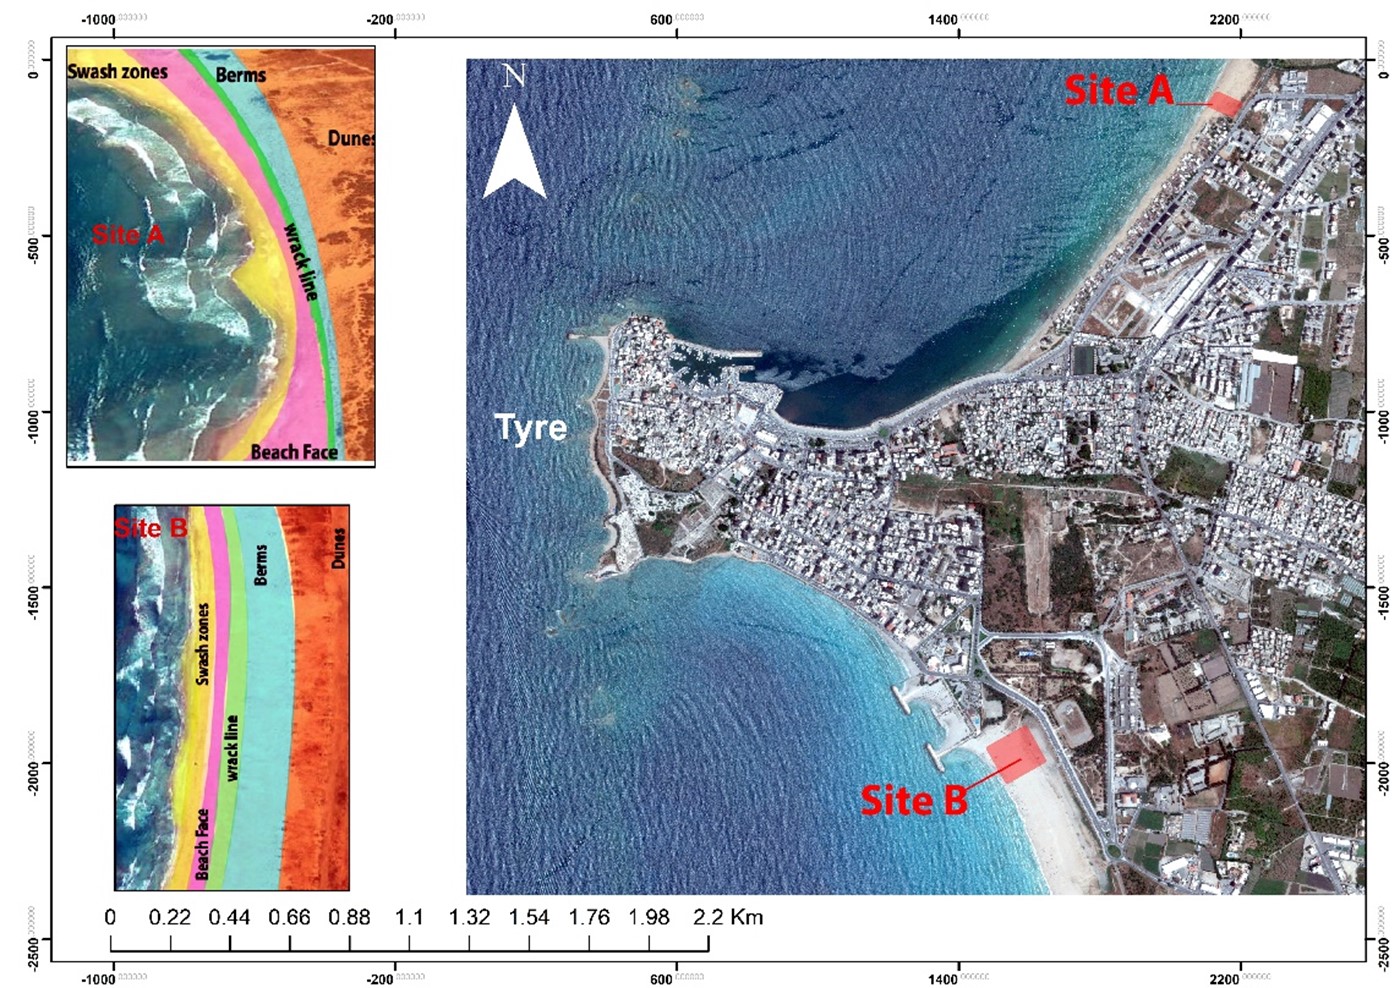
Figure 1.
Location and profiles of the study area, Site A (Jal El Bahr) and Site B (Bahr Slaiyeb).
9The beach profile at Jal El Bahr consists of dunes, berms, wrack line, beach face and swash zone. While a beach is connected to the sea and influenced by waves and tides, dunes are connected to the ground and influenced by wind, they are home to a wide range of highly specialized plants and animals, including endangered and rare species. Sand dunes in this site are characterized by their grey color with well-developed sand dune vegetation. The height of dunes at this site is ranged between 50 cm and 1.5 m.
10The swash zone is the flow region that is continuously covered and uncovered by the run-up and backwash of water as waves impose on a beach (Kelly and Dod, 2010). Berms are typically generated between a mean sea level and a maximum wave run-up level due to these sediment transport rates (Suzuki, 2020). The material found in the swash zone, in lines along the foreshore, and occasionally on the back of the beach, especially after storms, is referred to as wrack line zone. Season, coastal landform, offshore substrates (determining algae/seagrass development), currents, tidal forces, wind, and wave action, all influenced the quantity. The beach face is the part that interacts regularly with wave run up and its shape can respond on short timescales, depending on the balance of forces moving sediment (Bujan et al., 2019).
11Bahr Slaiyeb is recognized by a spectacular sandy beach, the most famous beach in Lebanon and from the vital beaches in Levantine basin. This site is located in the touristic zone of Tyre Coast Nature Reserve (TCNR). TCNR is a Ramsar site (The Ramsar Convention on Wetlands) that was ratified in 1/3/1999 (Law No.23) as well as a nature reserve (The Reserve is part of the city of Tyre, which was designated in 1984 by the United Nations Educational, Scientific and Cultural Organization (UNESCO) as a World Heritage Site). It’s a home to a diverse range of flora, animals, and insects, in addition to providing amusement for visitors. It is a nesting habitat for the endangered Loggerhead and Green Sea Turtles, as well as a haven for the Arabian Spiny Mouse and a variety of other significant animals. A profile of Bahr Slaiyeb is formed from the dunes, berms, wrack line, beach face and swash zone as site A (Figure 1). The sand is extremely fine in texture and heavily compressed. Sand dunes are very flat, and they appear to be the remnants of a much larger and higher sand dune complex. There are dune slacks with permanent stagnant water (Kasparek, 2015). Beach are made up mainly of Biodetritiques sands and have a CaCO3 content (Sanlaville, 1977).
3. Material and Method
3.1. Real Time Kinematic (RTK) GPS surveys
12Changes in beach shorelines are a complicated process, including oceanographic and coastal processes such as waves, tides, currents, and sediment movements. A range of techniques can be used to measure and develop an understanding of these processes, including the use of mathematical models, aerial photography, and topographic surveys (Binti et al., 2016). Various methods were applied to monitor the beach profile changes, including direct measurement using GPS-RTK (Global Positioning System-Real Time Kinematic) (Ruggiero et al., 2009), Total survey station (Lee et al., 2013) as well as remote sensing methods such as coastal imaging (Holman and Stanley, 2007) airborne LIDAR (light detection and ranging) (Saye et al., 2005) and Unmanned Aerial Vehicles (UAVs) for coastal surveying (Turner et al., 2016). Besides, photogrammetric techniques and terrestrial laser scanning (TLS) were used to derive digital elevation models (DEMs) which were used to improve our understanding of coastal changes at different spatial and temporal scales (James et al., 2013). The use of GPS allows the detection of elevation and geographic location. One-dimensional GPS surveys can be used to monitor the berm, high-water line, or vegetation line quickly and affordably. In geodetic and engineering surveying, relative positioning with Global Positioning System (GPS) carrier phase measurements were widely employed for precise positioning (Chen et al., 2009). Most GPS inaccuracies can be cancelled out or greatly reduced in a relative positioning mode (Olynik et al., 2002). As a result, some sources of GPS inaccuracies, such as the earth tide, phase wind-up effects, and satellite antenna offset, are not critical for relative positioning over a short baseline (Chen et al., 2009). Beach morphology monitoring using RTK GPS surveying techniques was widely accepted as an accurate and efficient means to collect coastal morphology data (Binti et al., 2016).
13Due to the advantages of RTK GPS highlighted by previous researchers, the RTK GPS was selected for this study. We used GPS/GNSS (The Global Navigation Satellite System), RTK RECIVER, Full-spectrum of satellite signals, Full connectivity. Kinematic GPS Surveys involve collecting data while the antenna of the mobile receiver is moving. The movement of the antenna can be intermittent: stop and go, or continuous: fully kinematic. We relied on Stop and go methods represented in Figure 2. Typically, a few minutes of data collection at each point were sufficient.
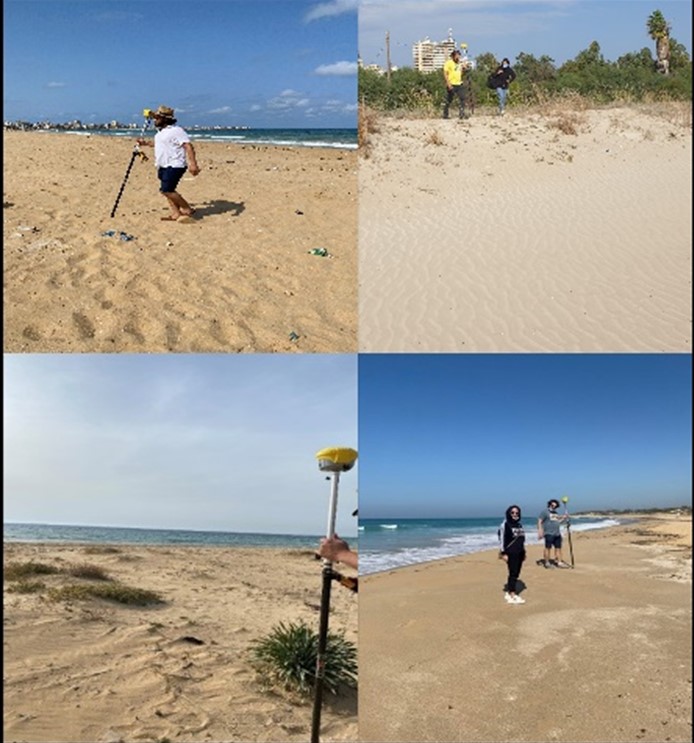
Figure 2:
Stop and go kinematic survey in the field at different periods of times.
14A survey that had started from November 2020 till July 2021 as mentioned in Table 1, covers autumn, winter, spring and summer seasons. The user of stop-and-go kinematic surveys are usually on land and looking for a quick survey of a succession of stationary spots (Morton et al., 1993). During the survey, we linked the GPS receiver rover to GPS receiver station set up on (SRIFA STATION) that has stereographic projection. This receiver base measures its coordinates according to satellites and compare it with entered coordinate to calculate the error in the observation. Basing to the measured error, GPS base delivers to GPS rover corrections, and the vertical accuracy of the GPS rover was about ± 3cm. Noticing that many obstacles have been faced during this survey. The first was the lockdown due to Corona Virus, the second was the Lebanese fuel crisis. These issues hindered our track in complete all months of the seasons.
Table 1. Dates and duration of beach survey (Months, seasons, year, day and duration), November 2020, December 2020, February 2021, April 2021 and July 2021.
|
Season/Month |
Year |
Day |
Duration |
|
Autumn/ November |
2020 |
8 |
From 9:30am till 12:00 am |
|
Winter/ December |
2020 |
20 |
From 10:am till 12:30 pm |
|
Winter/ February |
2021 |
14 |
From 10:am till 12:20 pm |
|
Spring /April |
2021 |
17 |
From 4: pm till 6:pm |
|
Summer/ July |
2021 |
20 |
From 7:30 am till 9:35 am |
3.2. Sections
15We divided each site into different sections. At Jal El Bahr beach, we created three sections due to the variety of topographic features on this site. Also Site B was divided into two sections. Survey on different sections was launched from sand dunes till the swash zone. Every coordinate (x,y) represented by code number from 1 to 20 for ex: x= -366266.81 and Y= -94569.11 is a specific ground control point.
3.3. Land cover (LC) map
3.3.1. Data acquisition
16One Landsat image was downloaded from the USGS Earth Explorer (https://earthexplorer.usgs.gov/) for the year of 2021 to the study area, the detailed data are shown in Table 2. This data was used for the performing of LC maps via the GIS (Geographic Information System).
Table 2. Detailed information about the Satellite image
|
Satellite |
SENTINEL-2A |
|
Projection |
UTM |
|
UTM Zone |
37 N |
|
Datum |
WGS84 |
|
Ground resolution (m) |
10m |
|
Date of Acquisition data |
2021/3/21 |
3.3.2. Image classification
17Classification errors are widely reported using univariate statistical metrics such as producer, user, and overall accuracies, as well as omission and commission errors. Maximum likelihood classification was chosen to detect a two class (vegetation cover and sand area).
18Furthermore, the 'Kappa Coefficient Index,' a discrete multivariate statistical model, has become a commonly used standard tool for CAA (classification accuracy assessment) processes (Jensen, 2005; Congalton and Green, 2009). Producer's Accuracy (PA) is the map accuracy from the point of view of the map producer. It is the number of reference sites classified accurately divided by the total number of reference sites for that class. The minimum acceptable accuracy for a class is 90%. The User's Accuracy (UA) is the accuracy of the attitude of a map user. The User's Accuracy is calculated by taking the total number of truthful classifications for a particular class and dividing it by the row total (Story and Congalton, 1986). The proportion of correctly identified samples in relation to the total number of samples on the map is referred to as overall accuracy. The overall accuracy percentage was calculated as 100 x (Total number of correct samples) / (Total number of samples).
19The Kappa coefficient (Cohen, 1960, 1968) is commonly used to evaluate picture classification accuracy. It is mostly based on the difference between the amount of agreement shown and the amount of the agreement that would be expected to occur by chance alone (Thakkar et al., 2017). The formula for computing Cohen’s k is expressed as (P0 -Pe) / (1-Pe) where P0 is percent agreement, defined as the proportion of subjects on which the raters agree, and Pe is chance agreement, defined as the proportion of agreement that would be expected by chance.
3.4. Meteorological parameters
20Meteorological data has been extracted for Tyre coastline during the study period that extended from 8 November 2020 to 25 July 2021, from Saksakiye weather station, it is located north Tyre. The parameters are: high temperature (High Temp), Low temperature (Low Temp), precipitation (Precip), high wind speed (High WS), and wind direction.
4. Results
4.1. Sections
21The length of sections at site A are different, section one is 143.5 m, section two is 139.4 m while section three is 131.7 m, the distance between sections one and two is 29.1 m while between two and three is 18.3 m (Figure 3). The length of section one at site B is 199.9 m and section two is 183.5 m, the distance between sections one and two is 90.1 m. This difference in length is due to different topography deviation during survey (Figure 4).
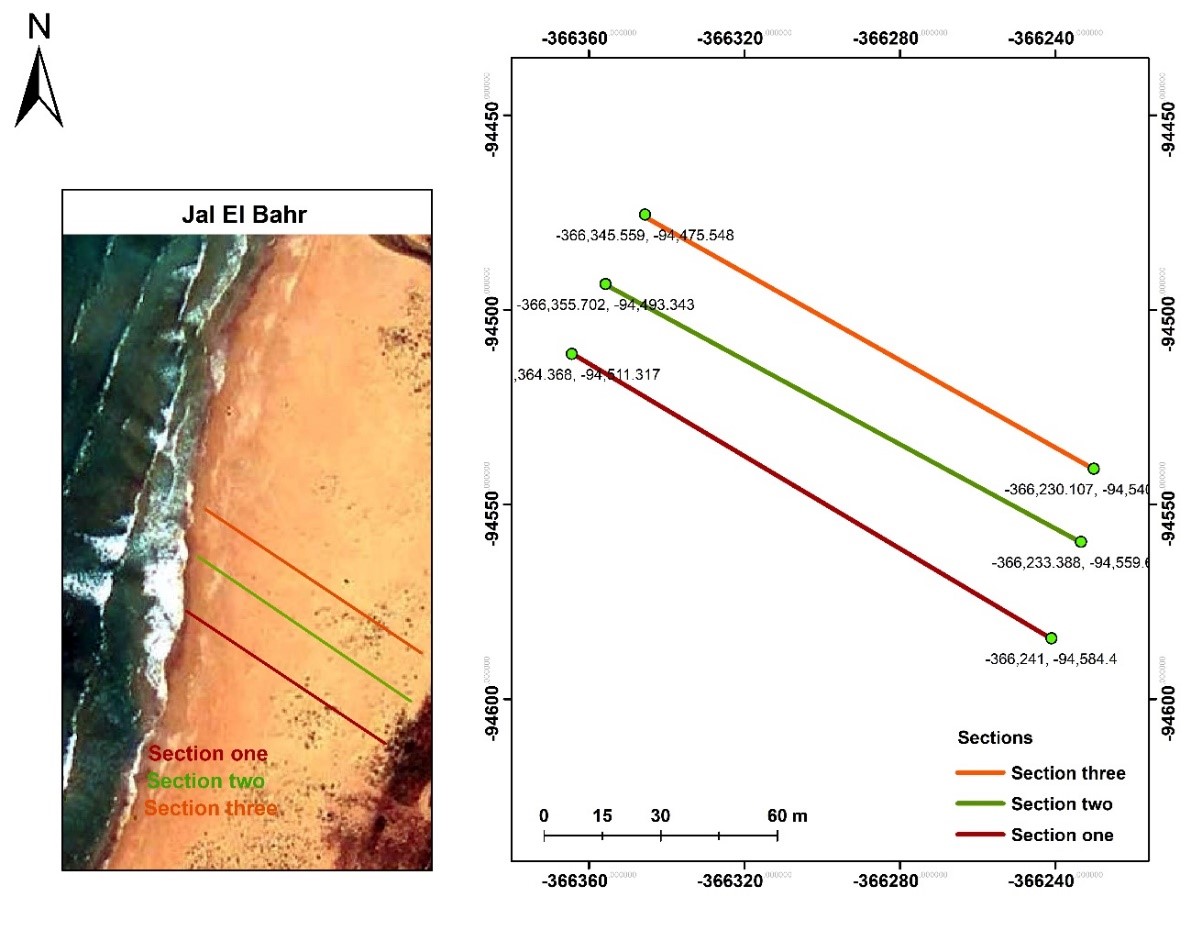
Figure 3:
Site A (Jal El Bahr) consists of three sections.
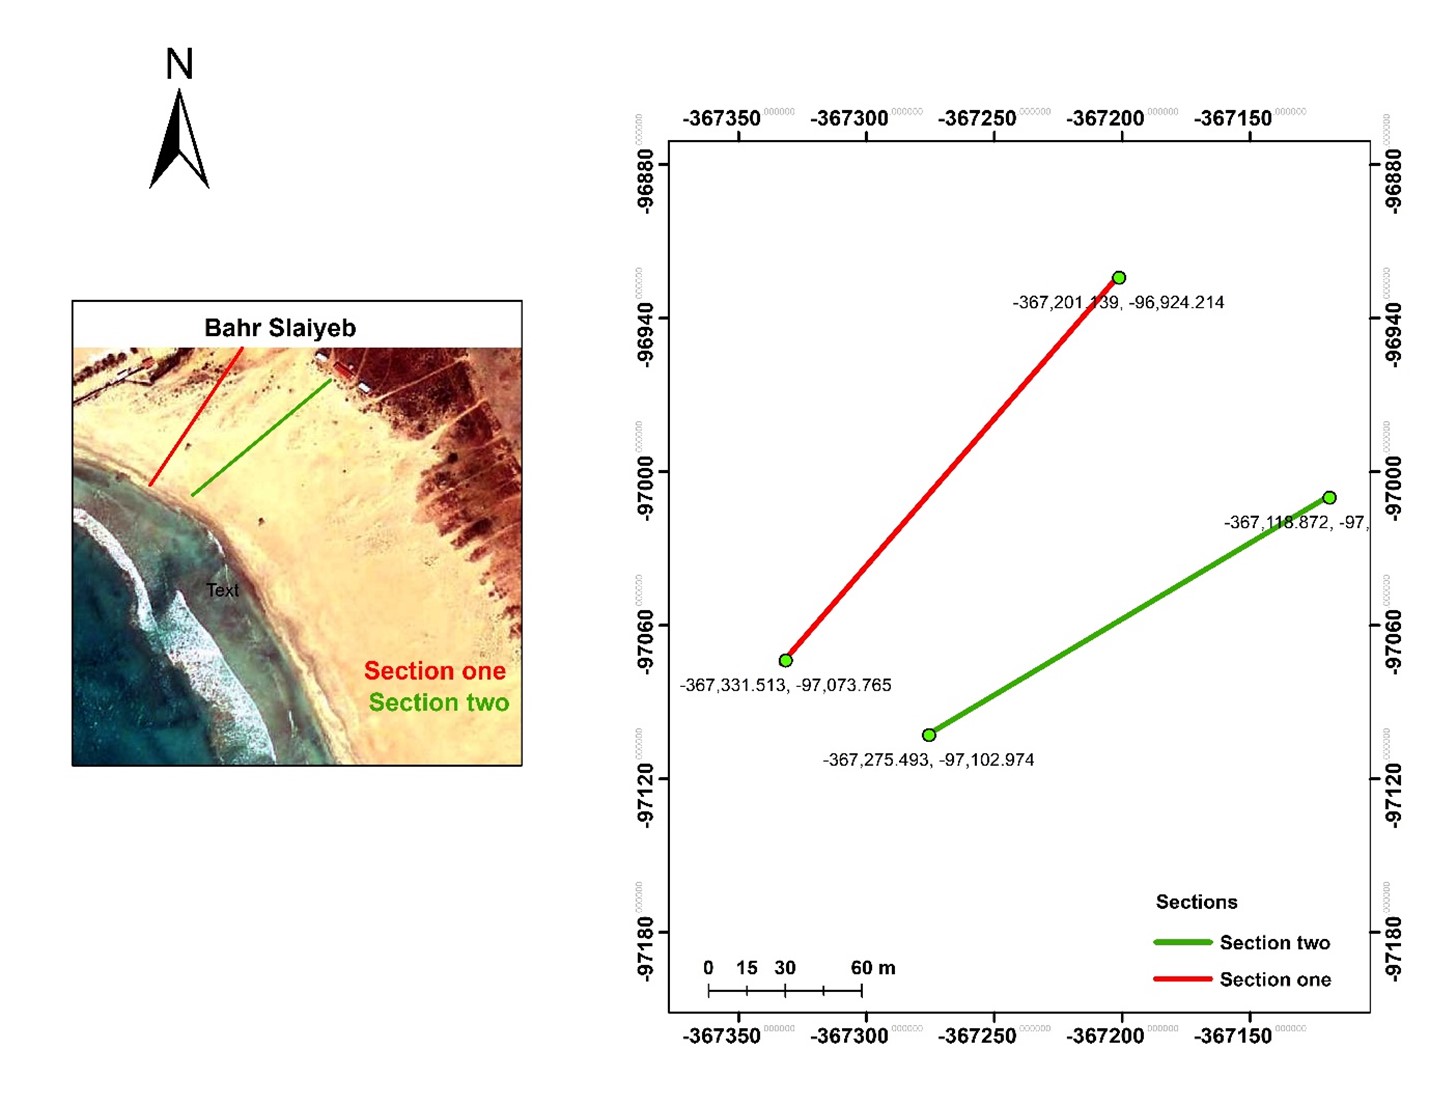
Figure 4:
Site B (Bahr Slaiyeb) consists of two sections.
4.2. Beach Survey
4.2.1. Site A (Jal El Bahr)
22DEMs are used to assess coastal processes and coastal morphology changes over various temporal and spatial scales (Li and King, 2007; White and Wang, 2003) and can be used to support coastal management (Davidson et al., 2007). Section one (Figure 5) indicates a different elevation of ground control points through same month, for example, on November ground control point 2 registered 23.471 m, then it declined 21.115 m at ground control point 16. Depending on this figure, we noticed small modification on the profile of this section between the periods of the study. Section two and section three (Figures 6 and 7) also showed that the elevations of each ground control point registers different values through the same month and during the months. All profiles showed that there were few erosion and accretion processes taking place on site A. The survey recorded high elevation at dunes then it declined at beach face and swash zone.
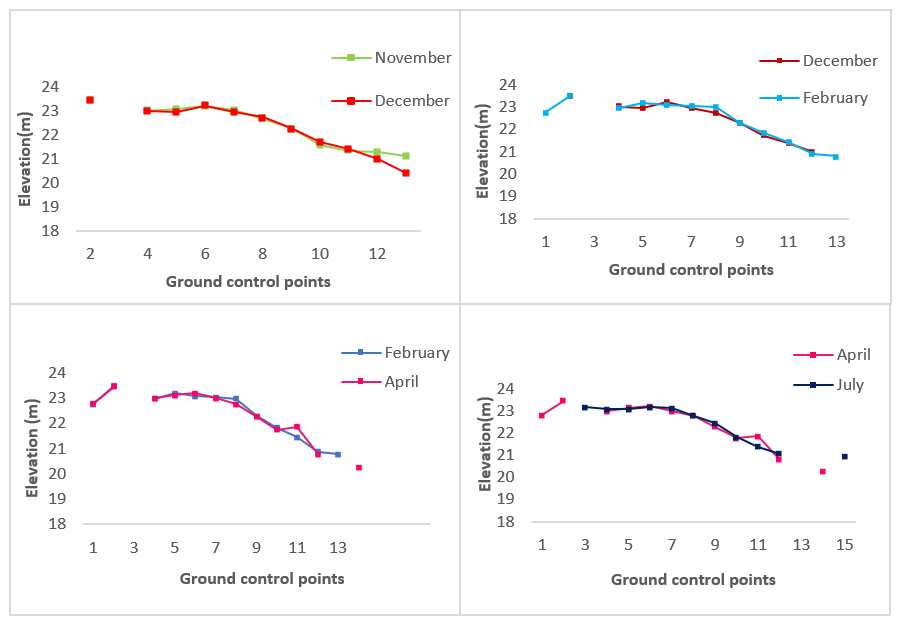
Figure 5:
Modification of beach profile at Site A (Section one) between different periods of time (November-December, December- February, February- April and April- July).
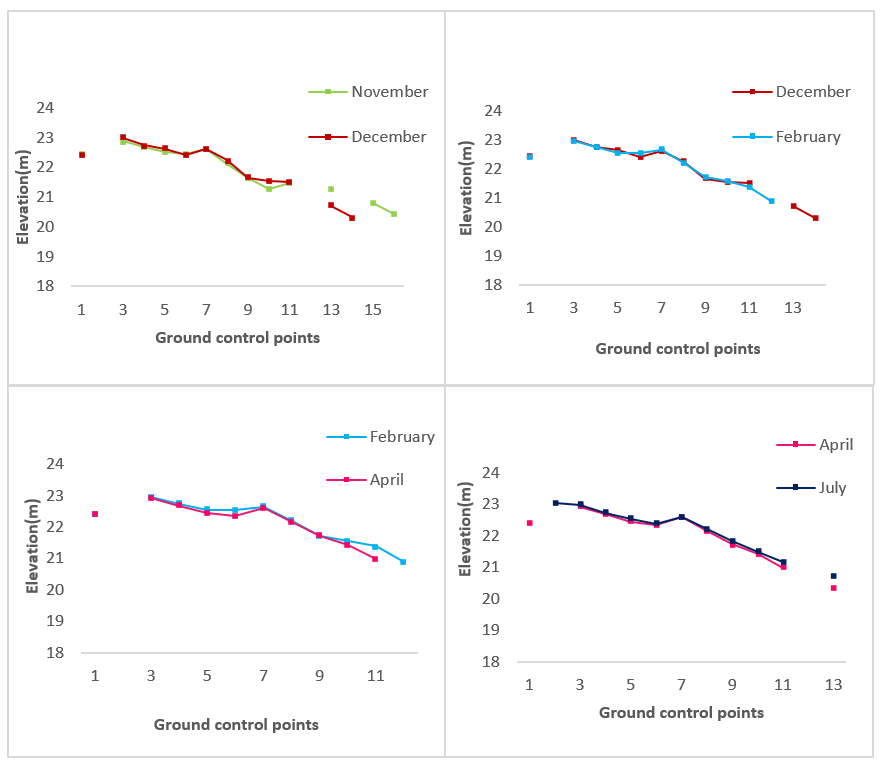
Figure 6:
Modification of beach profile at Site A (Section two) between different periods (November-December, December-February, February-April and April-July)
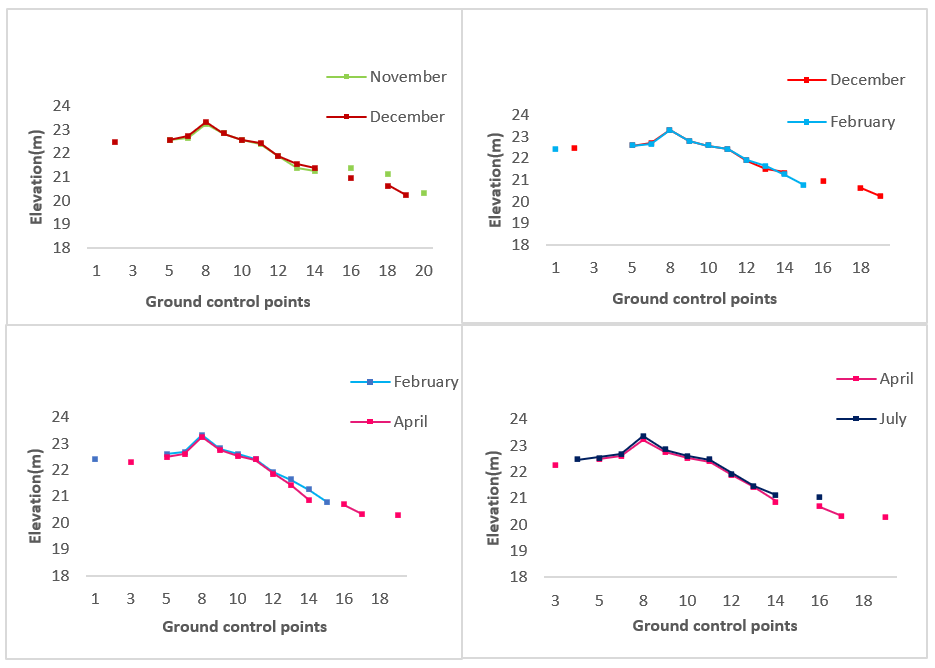
Figure 7:
Modification of beach profile at Site A (Section three) between different periods (November-December, December-February, February-April and April-July)
4.2.2. Site B (Bahr Slaiyeb)
23Section one (Figure 8) indicated high variations between control points through the same month and between the months and periods. In November, the elevation was 22.518 m at control point 1 then it increased to reach 23.069 m at control point 11 and 23.544 m at control point 12, then it decreased to reach 20.477 m at control point 19. We noticed also vital variations in the elevation of ground control points through months. For example, at control point 11 the elevation was 23.06 m in November then it declined to 22.962 m in December then it increased in February to reach 23.027 m. After that the elevation decreased to reach 22.914 m and 21.977 m in April and July respectively. High change was recorded during July as represented in the graph during the period of (April-July), the curve of July declined in obvious rate which led to dramatically change of section one, profile B.
24Figure 9 showed that the profile of section two site B was exposed to a slight variation, especially in December as represented on graph one (November-December). Beach survey recorded different elevations within ground control points. The elevation was high at flat dunes, then it declined to reach its minimum values at swash zone.
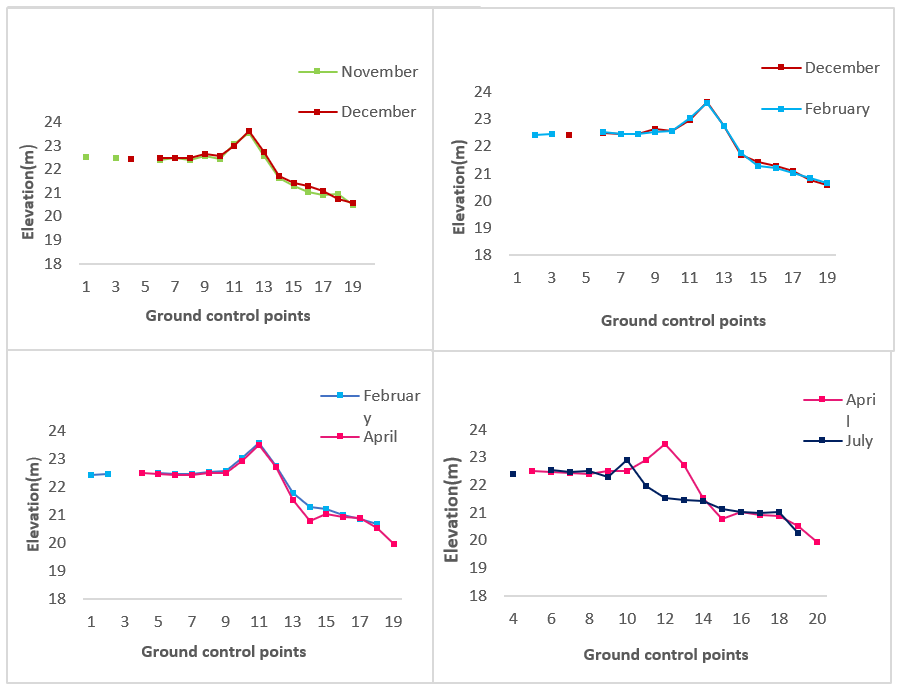
Figure 8:
Modification of beach profile at Site B (Section one) between different periods (November-December, December-February, February-April and April-July)
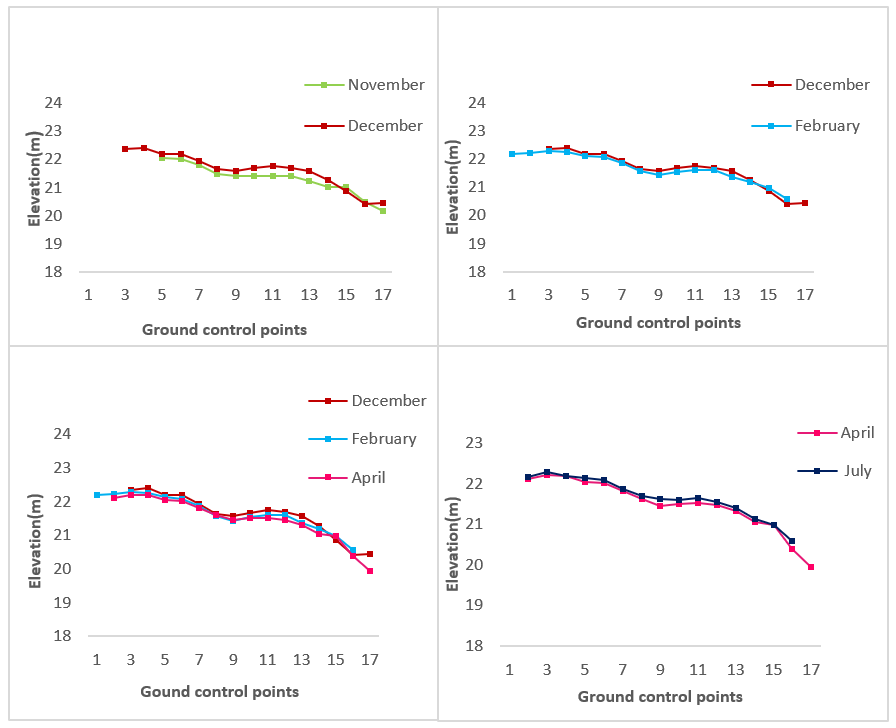
Figure 9:
Modification of beach profile at Site B (Section two) between different periods (November-December, December-February, December-February-April and April-July)
4.3. Vegetation cover
25Sediment distribution is the outcome of the dune environment's retention capacity, which is influenced by a variety of elements including wind regimes, runoff, coastal currents, wave energy, vegetation coverage, and coastal exploitation (Valentini et al., 2020). Beach erosion is largely prevented by vegetation, plant roots in the sand serve to keep the sand in place and make dunes more stable (Robertson, 2010). Plants contribute to build dunes and improve geomorphological stability, while dunes provide habitat for them. Disturbances related to sand movement, whether in accretion (dune formation) or erosion, have a significant impact on these interactions (Miller, 2015).
26Figure 10 represents the vegetation cover and sand area at the site A and site B. The dunes are colonized by Mediterranean-type coastal vegetation, which ranged between annual grasses and some scrub. There are various kinds of plants on Jal El Bahr beach like: sea rocket (Cakile maritima), Convocvulus scundus, Arundo donax L, Cyperus kalli, Dittrichia viscosa L. Greuter, Ipomea stolonifera (Cyr.) Gm., Cakile aegyptia (L.) Mai& Weill, Urgtinea martime (L.). This vegetation is focused on backdunes and inland dunes that stabilize sediments and reduce storm damage by shielding communities and infrastructure behind them from flooding. The overall accuracy is 95.5% of site A (Table 3).
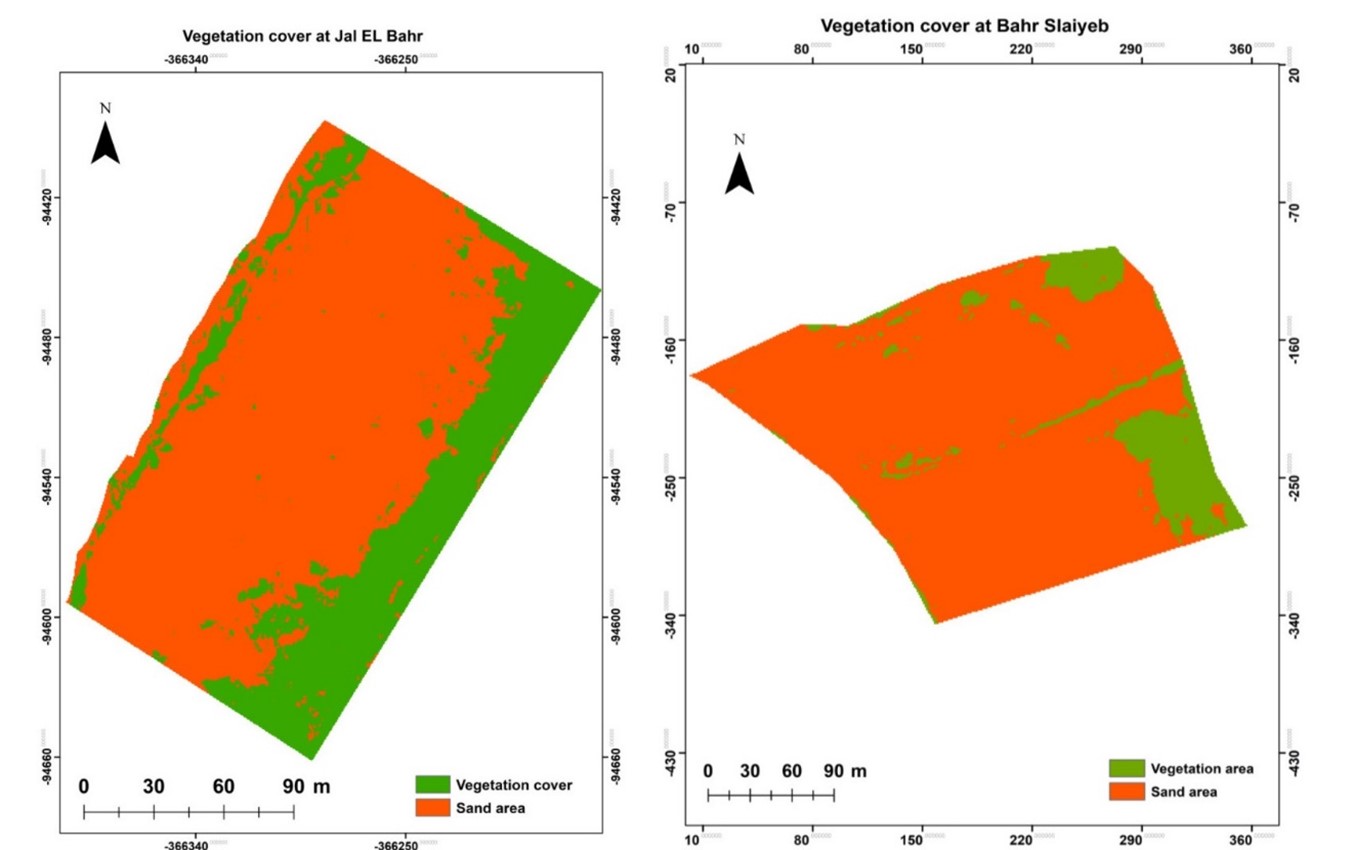
Figure 10:
MLC (Vegetation cover and Sand area) at Site A and Site B
27The vegetation cover is weak in Bahr Slaiyeb. Vegetation cover at this area includes: European Marram Grass, Phragmites australis, Ammophila arenaria (Kasparek, 2015). This vegetation cover is found on the flat dunes noticing that the bloom of plants differs from season to another depending on the weather and meteorological condition. The two maps represented a green color within the wrackline and this is due to the deposition of organic materials (seagrass, shell etc.) by waves. The overall accuracy of LC is 99.3% of site B (Table 4).
28The Cohen’s k is equal 0.92 for site A and 0.98 for site B. Landis and Koch (1977) proposed benchmarks for interpreting Cohen's k, with 0.8 to 1.0 indicating nearly perfect agreement, 0.6 to 0.8 indicating substantial agreement, 0.4 to 0.6 indicating moderate agreement, 0.2 to 0.4 indicating fair agreement, zero to 0.2 indicating slight agreement, and zero or lower indicating poor agreement.
Table 3: Accuracy assessment of LC for Site A
|
Vegetation cover |
Sand area |
|
|
Vegetation cover |
48 |
0 |
|
Sand area |
4 |
59 |
Table 4: Accuracy assessment of LC for Site B
|
Vegetation cover |
Sand area |
|
|
Vegetation cover |
63 |
0 |
|
Sand area |
1 |
85 |
4.4. Wind and precipitation
29Depending on Table 5, the temperature recorded moderate level during the seasons of the study period. The maximum average temperature was recorded during summer season 26.82°C while the minimum average recorded in winter season 16.0°C.
30Maximum precipitation was recorded in the period that extended from 14 December to 7 December 2021 which registered 120.90 mm. The minimum value of precipitation was recorded in the summer within a period that extended from 5 July 2021 to 25 July 2021 (0 mm).
31Maximum high wind speed recorded in a period of (April 5, 2021-April 11, 2021) which registered 11.3 m/s while the minimum wind speed recorded in a period of (July 19, 2021- July 25, 2021) which registered 5 m/s.
32Different wind direction was recorded during the period of the survey. The direction of the wind was SW in autumn, SSE and S through winter, WSW and NW in April while the wind direction was WSW and W in summer season.
Table 5: Weekly meteorological data for the Tyre coastline during the study period that extended from 8 November 2020 to 25 July 2021.
|
Time |
Meteorological Factors |
|||||
|
High Temp (°C) |
Low Temp (°C) |
Average Temp (°C) |
Precip (mm) |
High WS (m/s) |
Wind direction |
|
|
November 2, 2020- November 8, 2020 |
26.0 |
16.0 |
21.0 |
102.6 |
6.3 |
SW |
|
November 30, 2020- December 6, 2020 |
22.9 |
12.3 |
16.7 |
27.7 |
8.7 |
SSE |
|
December 7, 2020- December 13, 2020 |
23.4 |
13.2 |
18.2 |
1.5 |
7.5 |
SSE |
|
December 14, 2020- December 20, 2020 |
24.8 |
11.4 |
16.0 |
120.9 |
7.4 |
S |
|
February 1, 2021 - February 7, 2021 |
24.5 |
11.5 |
17.0 |
18.0 |
9.6 |
S |
|
February 8, 2021- February 14, 2021 |
23.6 |
11.3 |
16.0 |
1.0 |
6.8 |
WNW |
|
April 5, 2021- April 11, 2021 |
34.4 |
9.1 |
18.1 |
40.1 |
11.3 |
WSW |
|
April 12, 2021- April 18, 2021 |
30.9 |
9.8 |
17.7 |
42.0 |
9.5 |
NW |
|
July 5, 2021 - July 11, 2021 |
29.6 |
22.0 |
25.8 |
0.0 |
8.2 |
WSW |
|
July 12, 2021- July 18, 2021 |
30.4 |
23.1 |
26.4 |
0.0 |
5.7 |
W |
|
July 19, 2021- July 25, 2021 |
30.4 |
24.2 |
26.82 |
0.0 |
5 |
W |
5. Discussion
33The beach profile changes for five sections have been successfully obtained. The research and management of coastal environments, at least in some sectors, requires the investigation of morphological changes in beach-dune systems caused by specific agents such as waves, wind, and human activities, as well as antecedent topography, vegetation, material texture, and so on (Pardo-Pascual et al., 2005).
5.1. Site A: Jal El Bahr
34Depending on Figure 11, both erosion and accretion were witnessed at section one through the periods. While the accretion is more than erosion at section two and three during the period of November-December and December-February. The value of accretion reached 0.264 m at the ground control point 10 as a maximum value at section one and 0.13 m at section three, ground control point 12. The moderate level of rainfall that ranged between 102.6 mm during November, 150 mm during December and 19 mm during February helped the dunes to keep their stability with the support of vegetation cover that acted as a natural obstruction against winds and protect the dune from a high erosion.

Figure 11:
Value of erosion and accretion (m) at sections one, two and three (site A) through periods of the study.
35Collectively Sections one, two and three observed a rate of erosion during April, we can notice that during the period of February-April the rate of erosion at section two reached -0.184 m (18.4 cm) as a maximum level at ground control point 6 and -0.048 m (-4.8 cm) as minimum at ground control point 3. While the rate of erosion at the same period in section three reached -0.371 m (37.1 cm) as a maximum level at ground control point 13 and -0.026 m (-2.6 cm) as minimum value at ground control point 10. This change in the elevation of sand was happening as a result of rainfall, wind speed and wind direction. During July, the three sections were exposed to accretion at the dunes, beach face and swash zone as a result of stable weather and vegetation cover.
36Jal El Bahr was exposed to human pressure as a result of many activities like grazing and burning. Grazing included the removal of biomass, reduction fast-growing competitive species (Kooijman, 2004). Livestock may affect both sedimentation and marsh accretion negatively (e.g. Leonard, 1997). Furthermore, livestock caused compaction of the soil by trampling and hence reduced surface elevation change (Elschot et al., 2013; Pagès et al., 2019).
37Off-road vehicles (ORVs) were witnessed at Jal El Bahr beach and this has affected also the elevation of sand. ORVs are commonly used on beaches and dunes worldwide (Schlacher et al., 2007) and cause damage that includes: disturbing the physical attributes and stability of dunes and beaches (Priskin, 2003) destroying dune vegetation, leading to lower diversity and less floral ground cover (Groom et al., 2007); and disturbing, injuring or killing beach fauna (Schlacher et al., 2007). These activities will lead gradually to change the profile of Jal El Bahr beach.
5.2. Site B: Bahr Slaiyeb
38About 50 touristic tents are installed on site B (Bahr Slaiyeb beach) every summer to receive visitors from Tyre and around. This huge flat beach is most likely the remains of sand dunes which sand was extracted for construction purposes. Human impact (constructions, human trampling, camps, cleaning and grooming, mining) and physical factors at this site led to modification of the beach profile. Referring to Figure 12 (section one), erosion and accretion happened obviously. There is an accretion that occurred between November and December.
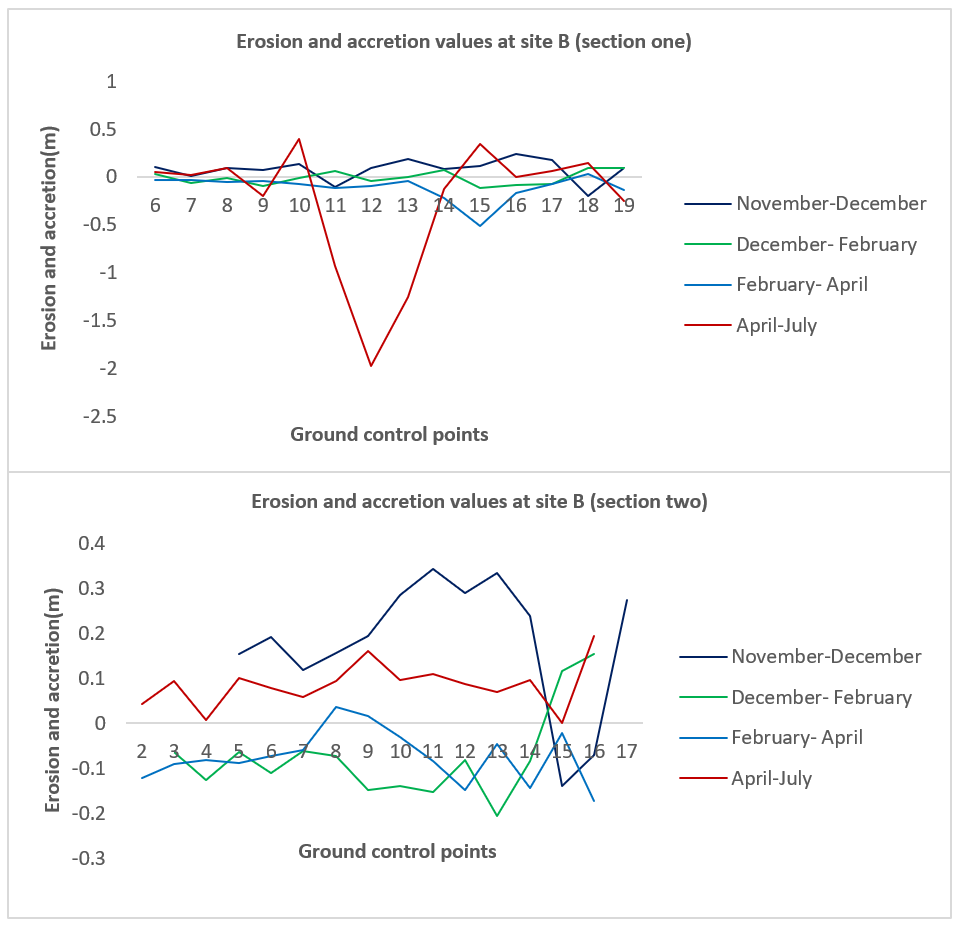
Figure 12:
Value of erosion and accretion (m) at sections one and two (site B) through periods of the study.
39The direction of the wind in relation to the shoreline has a significant impact on sediment delivery to the dune, changing apparent fetch lengths and foredune face slopes, and hence the location and amplitude of deposition (Cohn et al., 2019). During February (Figures 8 and 9) we witnessed an erosion in both sections and this was due to the S and WNS wind (alongshore and offshore transport) that reached 9.4 m/s noticing that the precipitation was 18 mm and this led to erode the sand from the flat dunes to carry it into swash zone. During the period of (December-February) the rate of accretion in the swash zone on section one (ground control point 18 and 19) ranged between 0.094 m (9.4 cm) and 0.095m (9.5 cm) while the rate of accretion on section two (ground control point 15 and 16) at swash zone was 0.116m (11.6 cm) and 0.153m (15.3 cm). Throughout April the value of precipitation was about 82.1 mm and the speed of offshore wind ranged between 9.4 m/s and 11.1 m/s, then this led to decrease the elevation of sand at the two sections, so we noticed erosion at the period of February-April.
40Cleaning or grooming is a common practice used on tourist beaches causing heavy pressure (Dugan et al., 2003; Davenport and Davenport 2006), this act involves raking and sieving the sand, often with heavy equipment, to remove macrophyte wrack, litter, and other debris (Kinzelman et al., 2003; Fanini et al., 2005). During February 2021, tar disposal from Israel washed up Tyre beach and this pushed different campaigns to remove tar from the beach by using different kinds of tools like sieves and shovels, and this also led to changes in the elevation of sands. Tyre’s public beach hosts approximately 375,000 visitors a monthly average during summer season. Trampling has a seasonal influence on supralittoral fauna at medium-high latitudes, allowing for some recovery during low-use seasons (see e.g., Scapini et al., 2005). Human trampling, tents and camps not only lead to harm fauna and flora but also to affect the elevations of sand.
41During summer, the power of waves is low and may reach beach face while in winter the power of waves is large and has high energy moving offshore. This led to having accretion during July (Figures 8 and 9) within the two sections except control point 12 and 13 on section one. The rate of erosion at ground control 12 recorded -2.026 m (the ground control point was 23.544 m during December then it declines to 21.518 m during July) while the rate of erosion at ground control point 13 registered -1.12 m (the ground control point was 22.553 m during December then it declines to 21.441 m during July). This due to the process done during May, where Tyre’s municipality extracted sand from section one to fill the water stream that excavated it between section one and section two at the beginning of winter (during November) in order to direct the water that has been collected in the parking towards the sea by creating artificial water path as mentioned on Figure 13). Noticing that the summit on ground control points 10 and 15 is a result of the gliding sand caused by the Bulldozer.
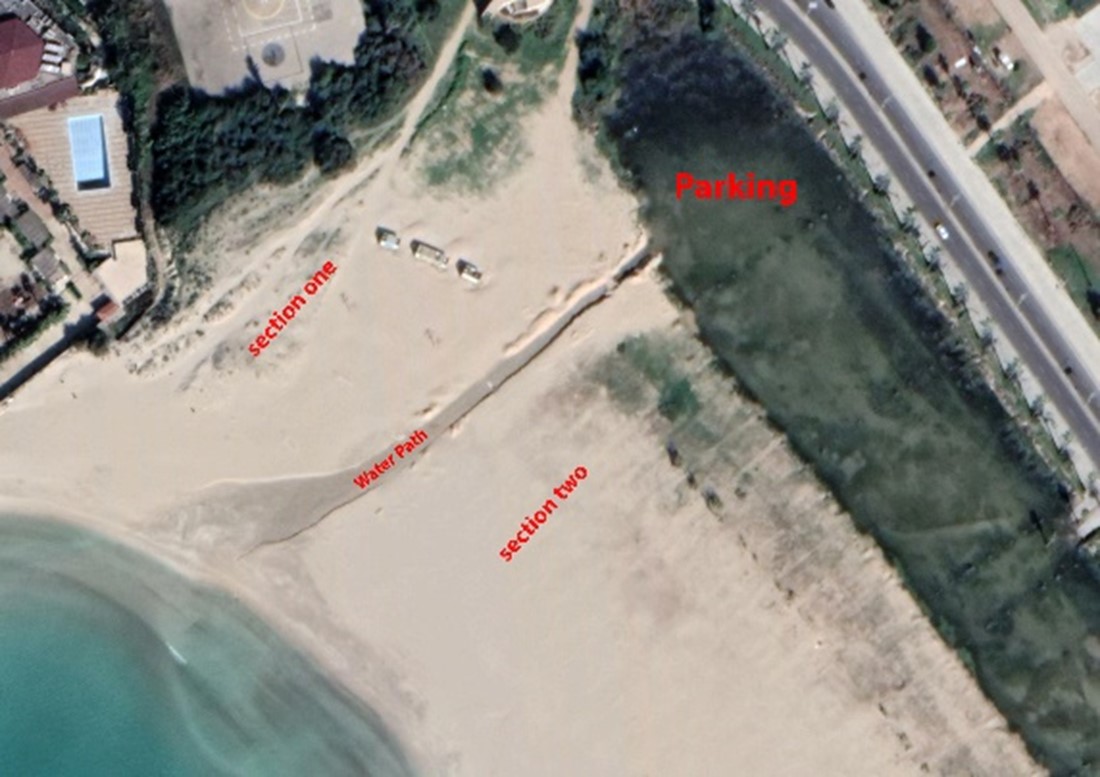
Figure 13:
Location of parking, water path, section one and section two at Bahr Slaiyeb, derived from Google Earth, 12,2020
42Jal El Bar (Figure 11) as Bahr Slaiyeb (Figure 12), recognized lessen in elevations at swash zone, wrack line and beach face, this was mainly due to longshore, cross-shore, swash and backwash sediment transport that were created by waves and currents. The swash zone is critical to the nearshore sediment budget because it is where shoreline erosion and accretion occur (Puleo et al., 2000). Because of local hydrodynamic pressure and cross-shore and alongshore sediment transport gradients, the sediment bed is active (Lanckriet et al., 2014).
6. Conclusion
43Natural and man-made sources have been identified as the primary causes of ongoing erosion and accretion processes within the two sites of the study area: Jal El Bahr and Slaiyeb Beach. This paper presented an example of how the relative kinematic GPS method can be used to monitor the advance or retreat of coastal areas. Analysis of DEM created the lines of beach profile effectivity, the erosion and accretion processes determined that they have occurred throughout the research period. Despite the fact that the changes may not be noticeable, it is still possible to determine that the coastline exhibits were difference in beach profiles each time data was collected. Essentially, it conveyed the impression that the beach is constantly changing over time. Wind speed, wind direction and precipitation played vital role in the change of elevations through the study period. Human intervention and anthropogenic pressure were found within the two study areas, especially at Bahr Slaiyeb, so it can be predicted that this open touristic zone will always change from month to month, from year to year and this is due to the effects of unrestricted human activities. Vegetation on Jal El Bahr beach makes the dunes more stable than the flat dunes at the Bahr Slaiyeb beach.
44Geodatabase represented by physical and human factors helps in perfect understanding of the rate of response of beach profile to these factors. This short-term evaluation of Tyre beach aids in constructing sustainable shoreline management plans.
Further information
Author contributions
45RS: Data curation, Funding acquisition, writing-original drift, Writing – review & editing, Formal analysis, Investigation, Methodology, Resources, Software, Validation. AK: Investigation, Software, Validation. JAG, PG: Supervision, Project administration, Conceptualization.
Conflicts of interest
46The authors declare no conflict of interest.
Bibliographie
Binti, M., Amin, M., Sa, R., Hezmi, M.A., 2016. Beach Profile Changes using RTK GPS: A Case Study. 178–184. https://engineering.utm.my/civil/wp-content/uploads/sites/29/2016/12/Beach-Profile-Changes-using-RTK-GPS-A-Case-Study.pdf
Brown, A.C., Nordstrom, K., McLachlan, A., Jackson. N.L., Sherman, D.J., 2008. Sandy shores of the near future. In: Polunin, N. (Ed.), The Waters, our Future, Prospects for the Integrity of Aquatic Ecosystems. Cambridge University Press.
Brown, A.C., McLachlan, A., 2002. Sandy shore ecosystems and the threats facing them: some predictions for the year 2025. Environmental Conservation, 29(01):62 – 77. DOI: 10.1017/S037689290200005X
Bujan, N., Cox, R., Masselink, G., 2019. From fine sand to boulders: Examining the relationship between beach-face slope and sediment size.Marine Geology, 417: 106012 DOI: 10.1016/j.margeo.2019.106012
Chen, W., Hu, C., Ding, X., 2009. Error Correction Models and their Effects on GPS Precise Point Positioning Error Correction Models and Their Effects on GPS. Survey Review, 41(313): 238-252. DOI 10.1179/003962609X390139
Cohen, J., 1960. A coefficient of agreement for nominal scales. Educational and Psychological Measurement, 20: 37-46. DOI: 10.1177/001316446002000104
Cohen, J., 1968. Weighted kappa: nominal scale agreement with provisions for scaled disagreement or partial credit. Psychological Bulletin, 70:213-220. DOI: 10.1037/h0026256
Cohn, N., Hoonhout, B.M.; Goldstein, E.B.; De Vries, S.; Moore, L.J.; Durán Vinent, O.; Ruggiero, P., 2019. Exploring Marine and Aeolian Controls on Coastal Foredune Growth Using a Coupled Numerical Model. Marine Science and Engineering, 7(1): 13. DOI 10.3390/jmse7010013
Congalton, R.G. and Green, K., 2009. Assessing the Accuracy of Remotely Sensed Data: Principles and Practices. 2nd edition. CRC Press, Taylor & Francis Group, Boca Raton. DOI: 10.1201/9781420055139
Davidson, M., Van Konigsveld, M., de Kruif, A., Rawson, J., Holman, R., Lamberti, A., Medina, R., Kroon, A., Aarninkhof, S., 2007. The Coast View project: developing video derived coastal state indicators in support of coastal zone management. Coastal Engineering, 54: 463–475. DOI: 10.1016/j.coastaleng.2007.01.007.
Davenport, J., Davenport, J.L., 2006. The impact of tourism and personal leisure transport on coastal environments; a review. Estuarine Coastal and Shelf Science, 67(1): 280–292. DOI: 10.1016/j.ecss.2005.11.026
Dugan, J.E., Hubbard, D.M., McCrary, M.D., Pierson, M.O., 2003. The response of macrofauna communities and shorebirds to macrophyte wrack subsidies on exposed sandy beaches of southern California. Coastal and Shelf Science, 58: 25–40. DOI: 10.1016/S0272-7714(03)00045-3
Elschot, K., T.J. Bouma, S. Temmerman, and J.P. Bakker., 2013. Effects of long-term grazing on sediment deposition and salt-marsh accretion rates. Estuarine, Coastal and Shelf Science, 133: 109–115. DOI: 10.1016/j.ecss.2013.08.021
Fanini, L., Cantarino, C.M., Scapini, F., 2005. Relationships between the dynamics of two Talitrus saltator populations and the impacts of activities linked to tourism. Oceanologia, 47: 93–112. http://www.iopan.gda.pl/oceanologia/471fanin.pdf
Feagin R.A., Sherman D.J., Grant W.E., 2005. Coastal erosion, global sea-level rise, and the loss of sand dune plant habitats. Frontiers in Ecology and the Environment, 3(7): 359– 364. DOI: 10.1890/1540-9295(2005)003[0359: CEGSRA]2.0.CO;2
Fekete A, Damm M, Birkmann J.,2009. Scales as a challenge for vulnerability assessment. Natural Hazards, 55:729–747. DOI:10.1007/s11069-009-9445-5
Groom JD, McKinney LB, Ball LC, Winchell CS., 2007.Quantifying off-highway vehicle impacts on density and survival of a threatened dune-endemic plant. Biological Conservation, 135:119–134. DOI: 10.1016/j.biocon.2006.10.005
Harley C.D.G., Hughes A.R., Hultgren K.M., Miner B.G., Sorte C.J.B., Thornber C.S., Rodriguez L.F., Tomanek L Williams S.L., 2006. The impacts of climate change in coastal marine systems. Ecology Letters, 9(2): 228–241. DOI: 10.1111/j.1461-0248.2005. 00871.x
Holman, R.A.; Stanley, J. ,2007. The history and technical capabilities of Argus. Coastal Engineering, 54(6):477-491. DOI: 10.1016/j.coastaleng.2007.01.003
James, M.R., Ilic, S., Ruzic, I., 2013. Measuring 3D coastal change with a digital camera. Coastal Dynamic, 893–904. https://www.researchgate.net/publication/303062207_Measuring_3D_coastal_change_with_a_digital_camera
Jana, A., Maiti, S., Biswas, A., 2016. Analysis of short-term shoreline oscillations along Midnapur-Balasore Coast, Bay of Bengal, India: a study based on geospatial technology. Modeling Earth System Environment, 2:1-10. DOI: 10.1007/s40808-016-0117-7
Jensen, J.R., 2005. Introductory Digital Image Processing: A Remote Sensing Perspective. 3rd Edition, Prentice Hall, Upper Saddle River, 505-512.
Kankara, R.S., Selvan, S.C., Markose, V.J., Rajan, B., Arockiaraj, S., 2015. Estimation of long and short term shoreline changes along Andhra Pradesh coast using remote sensing and GIS techniques. Procedia Engineering, 116: 855–862. DOI: 10.1016/j.proeng.2015.08.374.
Kasparek, M., 2015. The Mediterranean coast of Lebanon : Habitat for endangered fauna and flora : Results of a coastal survey in 2004 Sustainable Utilisation of Natural Habitats The Mediterranean coast of Lebanon : Habitat for endangered fauna and flora Results of a coastal. https://www.researchgate.net/publication/287800506_The_Mediterranean_coast_of_Lebanon_Habitat_for_endangered_fauna_and_flora_Results_of_a_coastal_survey_in_2004
Kelly, D., Dodd, N., 2010. Beach-face evolution in the swash zone. J. Fluid Mechanics, 661:316–340. DOI :10.1017/S0022112010002983.
Kinzelman, J.L., Whitman, R.L., Byappanahalli, M., Jackson, E., Bagley, R.C., 2003. Evaluation of beach grooming techniques on Escherichia coli density in foreshore sand at North Beach, Racine, WI. Lake and Reservoir Management, 19: 349–354. DOI: 10.1080/07438140309353944
Knežević J., & Petović S., 2016. Integrated Coastal Zone Management in Boka Kotorska Bay. The HandBook of Environmental Chemistry, 54 :573–587. DOI: 10.1007/698_2016_31
Kooijman, A.M., 2004. Environmental Problems and Restoration Measures in Coastal Dunes in the Netherlands. Ecological Studies, 171:243–258. DOI: 10.1007/978-3-540-74002-: 5_15
Landis JR, Koch GG. The measurement of observer agreement for categorical data. International Biometrics Society, 33(1):159-74. DOI: 10.2307/2529310
Lanckriet, T., Puleo, J.A., Masselink, G., Turner, I.L., Conley, D., Blenkinsopp, C., Russell, P., 2014. Comprehensive Field Study of Swash-Zone Processes. Waterway, Port, Coastal, and Ocean Engineering, 140: 29–42. DOI: 10.1061/(asce)ww.1943-5460.0000209
Lee, J.M.; Park, J.Y.; Choi, J.Y.,2013. Evaluation of sub-aerial topographic surveying techniques using Total Station and RTK-GPS for applications in macrotidal sand beach environment. Coastal Research, 65: 535–540. DOI: 10.2112/SI65-091.1
Leonard, L.A., 1997. Controls of sediment transport and deposition in an incised mainland marsh basin, southeastern North Carolina. Wetlands, 17: 263–274. DOI: 10.1007/BF03161414
Li, M.Z., King, E.L., 2007. Multibeam bathymetric investigations of sand ridges and association bedforms and their relation to storm processes, Sable Bank, Scotian Shelf. Marine Geology, 243: 200–228. DOI: 10.1016/j.margeo.2007.05.004.
Marchand, M., Sanchez-Arcilla, A., Ferreira, M., Gault, J., Jiménez, J.A., Markovic, M., Mulder, J., van Rijn, L., Stânicâ, A., Sulisz, W., Sutherland, J., 2011. Concepts and science for coastal erosion management - An introduction to the Conscience framework. Ocean & Coastal Management , 54: 859–866. DOI: 10.1016/j.ocecoaman.2011.06.005
Maugendre L., Gattuso J-P., Louis J., de Kluijver A., Marro S., Soetaert K., & Gazeau F., 2015. Effect of ocean warming and acidification on a plankton community in the NW Mediterranean Sea. Marine Science, 72 : 1744–1755. DOI :10.1093/icesjms/fsu161
Meliadou, A., Santoro, F., Nader, M.R., Dagher, M.A., Al Indary, S., Salloum, B.A., 2012. Prioritising coastal zone management issues through fuzzy cognitive mapping approach. Environmental Management, 97: 56–68. DOI : 10.1016/j.jenvman.2011.11.006
Miller, T.E., 2015. Effects of disturbance on vegetation by sand accretion and erosion across coastal dune habitats on a barrier island. Plants Science, 7: 1–10. DOI: 10.1093/aobpla/plv003
Morton, R.A., Leach, M.P., Paine, J.G., Cardoza, M.A., 1993. Monitoring beach changes using GPS surveying techniques. Coastal Research, 9 (3): 702–720. https://www.jstor.org/stable/4298124
Nayak, S., 2000. Critical issues in coastal zone management and role of remote sensing. In: Subtle Issues in Coastal Management, Indian Institute of Remote Sensing, Dehradun. pp. 77-98.
Nir, Y., 1996. The city of Tyre, Lebanon and its semi-artificial tombolo. Geoarchaeology, 11: 235–250. DOI: 10.1002/(SICI)1520-6548(199605)11:3<235::AID-GEA3>3.0.CO;2-4
Nordstrom, K.F., 2000. Beaches and Dunes on Developed Coasts. Cambridge University Press, UK, 338 pp
Olynik, M., Petovello, M., Cannon, M., 2002. Temporal impact of selected GPS errors on point positioning. GPS Solutions, 6: 47–57 (2002). DOI: 10.1007/s10291-002-0011-9
Pagès, J.F., Jenkins, S.R., Bouma, T.J., Sharps, E., Skov, M.W., 2019. Opposing Indirect Effects of Domestic Herbivores on Saltmarsh Erosion. Ecosystems, 22:1055–1068. DOI: 10.1007/s10021-018-0322-5
Pardo-Pascual, J.E., Garcia-Asenjo, L., Palomar-Vazquez, J., Garrigues-Talens, P., 2005. New methods and tools to analyze beach-dune system evolution using a real-time kinematic global positioning system and geographic information systems. Coastal Research, SI 49 (Proceedings of the 2nd Meeting in Marine Sciences): 34 – 39. Valencia -– Spain, ISSN 0749-0208 https://www.jstor.org/stable/25737401
Pollnac, R. B., Pomeroy R.S., 2005. Factors influencing the sustainability of integrated coastal management projects in the Philippines and Indonesia. Ocean & Coastal Management, 4: 233–251. DOI: 10.1016/j.ocecoaman.2005.04.003
Priskin J., 2003. Physical impacts of four-wheel drive related tourism and recreation in a semi-arid, natural environment. Ocean Coast Management 46:127–155. DOI: 10.1016/S0964-5691(02)00124-2
Puleo,JA., Beach,RA., Holman,RA., Allen,JS., 2000. Swash zone sediments suspension and transport and the importance of bore- generated turbulence. Geophysical Research, 105: 17021-17044. DOI: 10.1029/2000jc900024
Robertson, H., 2010. The Preventive Methods of Beach Erosion. Summer Ventures in Science and Mathematics, 1-3. DOI:10.1007/978-3-540-74002-5_15.
Ruggiero, P.; Walstra, D.J.R.; Gelfenbaum, G.; Van Ormondt, M., 2009. Seasonal-scale nearshore morphological evolution: Field observations and numerical modeling. Coastal Engineering, 56: 1153–1172. https://doi.org/10.1016/j.coastaleng.2009.08.003
Saad, R., Gerard, J.A., Gerard, P., 2021. Detection of the Shoreline Changes Using DSAS Technique and Remote Sensing: A Case Study of Tyre Southern Lebanon. Oceanography and Marine Research, 9: 1–18. https://www.longdom.org/open-access/detection-of-the-shoreline-changes-using-dsas-technique-and-remote-sensing-a-case-study-of-tyre-southern-lebanon.pdf
Sanlaville, P., 1977. Étude géomorphologique de la région littorale du Liban. First edition, P135.
Saye, S.E., van der Wal, D., Pye, K., Blott, S.J., 2005. Beach-dune morphological relationships and erosion/accretion: An investigation at five sites in England and Wales using LIDAR data. Geomorphology, 72: 128–155. DOI: 10.1016/j.geomorph.2005.05.007
Scapini, F., Chelazzi, L., Colombini, I., Fallaci, M., Fanini, L., 2005. Orientation of sandhoppersat different points along a dynamic shoreline in southern Tuscany. Marine Biology, 147: 919–926. DOI :10.1007/s00227-005-1617-6
Schlacher TA, Thompson LMC, Price S., 2007. Vehicles versus conservation of invertebrates on sandy beaches: quantifying direct mortalities inflicted by off-road vehicles (ORVs) on ghost crabs. Marine Ecology, 28:354–367. DOI: 10.1111/j.1439-0485.2007.00156.x
Stauble, Donald K., 2003. The Use of Shoreline Change Mapping in Coastal Engineering Project Assessment. Coastal Research, 38: 178–206. https://www.jstor.org/stable/25736606
Story, M., Congalton, R.G., 1986. Remote Sensing Brief Accuracy Assessment: A User’s Perspective. Photogrammetric Engineering and Remote Sensing, 52: 397–399. https://www.asprs.org/wp-content/uploads/pers/1986journal/mar/1986_mar_397-399.pdf
Suzuki, T., Isozaki, S., Sasaki, J., 2020. An improved short-term swash zone beach profile change model focusing on berm formation and erosion. Proc. 7th Int. Conf. Asian Pacific Coasts, APAC 2013 63–68. https://core.ac.uk/download/pdf/25492856.pdf
Thakkar, K., Desai, V., Patel, A., & Potdar, M., 2017. Impact assessment of watershed management programs on land use/ landcover dynamics using remote sensing and GIS. Remote Sensing Applications: Society and Environment, 5:1-15. DOI: 10.1016/j.rsase.2016.12.001
Tissier, M., 2020. Unravelling the Relationship between Ecosystem-Based Management, Integrated Coastal Zone Management and Marine Spatial Planning 403–413. DOI: 10.1007/978-3-030-45843-0_20
Toure, S., Diop, O., Kpalma, K., Maiga, A.S., 2019. Shoreline Detection using Optical Remote. Sensing. Geo Information,8(2): 75. DOI: 10.3390/ijgi8020075
Turner, I.L.; Harley, M.D.; Drummond, C.D., 2016. UAVs for coastal surveying. Coastal Engineering, 114: 19–24. DOI: 10.1016/j.coastaleng.2016.03.011
Valentini, E., Taramelli, A., Cappucci, S., Filipponi, F., Xuan, A.N., 2020. Exploring the Dunes: The Correlations between Vegetation Cover Pattern and Morphology for Sediment Retention Assessment Using Airborne Multisensor Acquisition. Remote Sensing, 12: 1229. DOI: 10.3390/rs12081229.
White, S.A., Wang, Y., 2003. Utilizing DEMS derived from LIDAR data to analyze morphologic change in the North Carolina coastline. Remote Sensing of Environment, 85 (1): 39–47. DOI: 10.1016/S0034-4257(02)00185-2
Zaucha J., Conides A., Klaoudatos D., & Norén K., 2016. Can the ecosystem services concept help in enhancing the resilience of land-sea social-ecological systems? Ocean and Coastal Management, 124: 33-41. DOI: 10.1016/j.ocecoaman.2016.01.015
Zuzek, P.J., Nairn, R.B. and Thieme, S.J., 2003. Spatial and temporal consideration for calculating shoreline change rates in the Great Lakes Basin. Coastal Research. 38: 125-146. https://www.jstor.org/stable/25736603
