

- Accueil
- Volume 92 - Année 2023
- Numéro 1
- Automatic extraction of build-up areas from bare land using Sentinel 2A imagery in El Khroub city, Algeria


Visualisation(s): 35554 (12 ULiège)
Téléchargement(s): 350 (1 ULiège)

Automatic extraction of build-up areas from bare land using Sentinel 2A imagery in El Khroub city, Algeria

Document(s) associé(s)
Version PDF originaleAbstract
In this research work, the separation of built-up areas from bare lands in El Khroub city is carried out using a supervised classification approach involving several indices and combining spectral bands of the Sentinel-2A images sensor.
The multi-index approach is based on the combination of seven indices in order to discriminate between the three main categories of land cover, which are water bodies, green areas and buildings. 3First, this operation requires the use of NDVI, BAEI, NDBI, NDTI, BUI, MNDWI and the NDVIre index, which have a strong discrimination capacity between build-up area and the other land cover features. The neo-images obtained from the combination of the above indices are then classified with the Likelihood algorithm for the extraction of the six class types of land cover (built-up areas, bare land, vegetation, forest, water bodies and asphalt). The multi-index obtained from the combination of BUI, NDTI and NDVIre is the most effective; shown by the evaluation values, where the Overall accuracy is of 96.44%, the Kappa Coefficient (K) of 95.72% and a User Accuracy for built-up class of the order of 100%, with a zero rate of commission.
Therefore, the multi-index (BUI, NDTI and NDVIre) is retained for build-up area extraction due to its best discrimination capability.
Table des matières
1Manuscrit reçu le 7 janvier 2023 et accepté le 3 mars 2023
2Article publié selon les termes et les conditions de la licence Creative Commons CC-BY 4.0
1. Introduction
3Cities in the developing world are gradually being expanded due to the rapid population growth and the exodus phenomena due to the people migration from the surrounding poor rural areas looking for better life and opportunities (Kieffer Emilen 2013; Sinha et al. 2016). Urban areas as well as land covers tend to change more significantly in a short time due to the incessant urbanization (Zha et al. 2003). The replacement of vegetated land with urban land has negative environmental impacts on the urban area (Xu 2008). Urbanization is the main cause of administrative promotion which may generate morphological changes that cities were experiencing (Abdaoui et al. 2020). In the Maghreb, urbanization has undergone an astonishing, rapid and visible upheaval in recent decades (Rousseaux V. 2004). The population growth rate in Algeria between 1960 and 2015 has had direct consequences on urbanization; it has sufficiently modified the urban landscape of Algerian cities (Elodie RUCH 2006). Recent studies have shown that in Sri Lanka the increase in built-up area has had serious negative consequences on the living environment, even leading to an increase in the mortality rate (Ranagalage et al. 2017), and sometimes disastrous effects on public health as in Shanghai (Tan et al. 2010), but also can aggravate local climatic conditions (Liu and Zhang 2011).
4To study and monitor these mutations, remote sensing technics prove to be a reliable tool which can be used to describe the state of the surface (Bouzekri et al. 2015). To discriminate between the components, vegetation, water, buildings with their soil materials, of a heterogeneous ecosystem such as a city, remote sensing image data processing is the best tool to be considered(Sinha et al. 2016). The major challenge of this research is the extraction of the urban area and the detection of the changes that have taken place in the city of El Khroub, by other than conventional means, using a Sentinel 2A satellite scene.
5GIS mapping using satellite images leads to a dynamic expression of time (Cauvin et al. 2007-2008) As a result, it enable us to analyze the spatio-temporal mutations of urban lands, which play a considerable role in urban environmental research (Tien Nguyen 2020). The processing of satellite images makes it possible to draw up maps of urban areas and to identify the changes that have occurred in land use between bare land and building land due to the different classification algorithms, in particular when using satellite images at the most recent high resolution (Zhang et al. 2002). Several studies have recommended the use of urban indices to improve the accuracy of urban land cover classification. Ridd (RIDD 1995) configured the city from three VIS components (vegetation, impermeable surfaces and soil). To assess changes, this configuration has been widely used in studies on urban land cover classification, although it does not take into account the water component (Xu 2007). Zha et al (Zha et al. 2003) proposed the Built-up Normalized Difference Index (NDBI) for the classification of building land with a reflectance in the mid-infrared (MIR) range, much higher than the near infrared (NIR). Xu (Xu 2005) suggested the use of a Built-up Index (BUI) based on three components SAVI (Soil Adjusted Vegetation Index), MNDWI (Modified Normalized Difference Water Index) and building land (NDBI). In addition, (Linh and N.H.K. 2011) used the IBI index for mapping land distribution of in the city of Hue. As-syakur et al. As-syakur et al (As-syakur et al. 2012) proposed EBBI (Enhanced Build up and Bareness Index) to observe urban land fluctuations in Bali (Indonesia). The EBBI index has also been used to classify building and bare lands in urban areas (Bramhe et al. 2018; Li et al. 2017; Rasul et al. 2018; Sekertekin et al. 2018). Bouzekri et al ((Bouzekri et al. 2015) calculated the Built-up Area Extraction Index (BAEI) based on short-wave (red and green infrared) to extract the built-up area of the city of Djelfa (Algeria). Similarly, Gadal and Ouerghemmi (Gadal and Ouerghemmi 2019) applied it for the same purposes in Yakutsk (Russian Federation). Ettehadi Osgouei (Ettehadi Osgouei et al. 2019) applied NDTI (Normalized Difference Tillage Index) for the first time in the Land Cover/Land Use (LULC) domain in some Turkish cities (Istanbul, Ankara and konya). This index is based on the short-wave infrared of sentinel-2A images. Indeed, some researchers have been able to discriminate the vegetation theme with its classes, based on the calculation of the NDVI (Delegido et al. 2011; Frampton et al. 2013; Hansen and Schjoerring 2003). They were able to demonstrate that the application of the normalized vegetation index based on the difference Red-edge B5 (705 nm) and Red B4 (665 nm) (NDVIre) for the Sentinel-2 bands provide high vegetation area index values.
6This work resumes the calculation of the aforementioned indices (BUI (He et al. 2010), NDTI (Deventer van et al. 1997), BAEI (Bouzekri et al. 2015), NDBI (Zha et al. 2003), MNDWI (Xu 2006), NDVI (Rouse, J.W., Haas, R.H., Schell, J.A. and Deering, D.W. 1973) and NDVIre (Hansen and Schjoerring 2003)) using the Sentinel-2A image of the year 2020 as well as the calculation of the following multi-index (BAEI-NDVIre-MNDWI), (NDBI-NDVIre-MNDWI), (NDTI-NDVIre-MNDWI), (BUI-NDVIre-MNDWI). Moreover, these calculated multi-indices are correlated with a new established multi-index (BUI-NDTI-NDVIre) to extract the built-up areas. This extracted build-up areas are compared to reality on the ground, in order to better read and understand the evolution of the land cover/use in El Khroub city and verify the reliability of our new established multi-index (BUI-NDTI-NDVIre) in the process of built-up area extraction.
7This article is above all a model that can be transposed to other similar spaces allowing the analysis and differentiation of urban landscapes involved in urban environmental studies.
8The main objective of this research is the extraction of the different components of the soil, as well as the spatio-temporal growth of the city of El Khroub. It allows urban planners and managers to better understand and assess the spatial growth pattern and changes in land covers that are likely to occur and to enable rational and sustainable management of land capital.
2. Study area
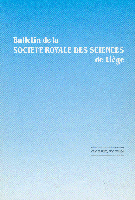
9El Khroub city covers an area of 968 hectares. It is located to the south of the Wilaya of Constantine North East Algeria. It is located between 6° 41' and 6° 43' East longitude, and 36° 15' and 36° 17' North latitude (Institut National de Cartographie et Télédétection 2009) (Figure 1). Its altitude varies between 600 meters in the west and 750 meters in the east. Concerning the lithology of the geological formations, the substrate is composed of clay, limestone and marl (Th Raven. 1957). The climate is semi-arid, with a rainfall varying between 500 and 560 mm per year (Bouteraa et al. 2019). It has a bus station and it is located on the railway line linking Constantine to all parts of the country of the country. It has an important road infrastructures; towards Batna by National Road N° 03, towards Guelma by RN N° 20 and towards Tebessa by RN N° 10 (Hioul 2002) (Figure 1).
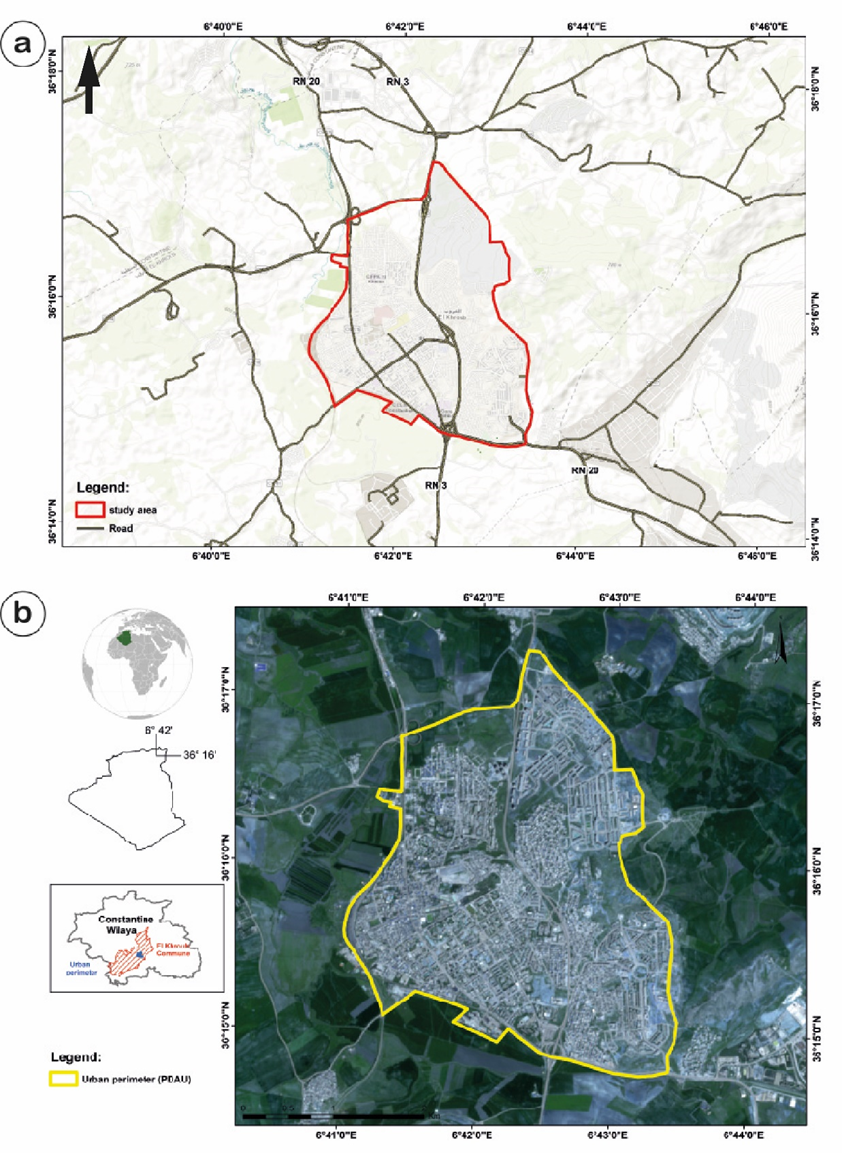
Figure 1: Aerial view showing the location of El Khroub city.
3. Materials and methods
3.1 Topographic maps, administrative documents and statistical data
10The georeferencing and digitalization of the built space appearing on the various maps and graphic documents constitute essential bases in this diachronic study. Indeed, the cartographic marker from which this study started is the topographical map with a scale 1/25000 (Institut Géographique National 1960) established in (1960), the topographical map of 2009 scale 1/25000 (INCT) (Institut Géographique National 1960; Institut National de Cartographie et Télédétection 2009), as well as the summary report of the Master Plan for Urban Developppment and Planning (PDAU) of 1998 of the city of El Khroub (URBACO 1998). More documents are the urban perimeter of the year 1987 and the updated intercommunal PDAU (2014) for Constantine, El Khroub, Didouche, Mourad, Hamma Bouziane and Ain Smara (URBACO 2014). All these documents constitute the main used cartographic base and which were the subject of georeferencing and digitalization.
11The statistical data used in this study are provided by the National Office of Statistics, they concern the general population and the censuses for the years 1966, 1977, 1987, 1998, 2008 (Office National des statistiques 2008).
3.2 Sentinel-2A images
12The Sentinel-2A satellite was launched on June 23, 2015 and was followed by Sentinel-2B on March 7, 2017 (Agro-geoinformatics 2021); the two maintain a synchronous solar path at an altitude of 786 km. The chronological resolution is five days from the two satellite constellations, at the equator. The multi-spectral imager covers 13 spectral bands with a swath of 290 km. The spatial resolution of 10 m covers three visible bands (B2, B3, B4) and a wide near infrared (NIR) band. The 20 m spatial resolution, however, covers three red-edge bands (B5, B6 and B7), and a band B8a of the interval near infrared, and two SWIR bands (B11 and B12). For the 60 m resolution, three bands (B1, B9 and B10) are distributed in the intervals (VIS, NIR and SWIR) respectively (Figure 2). The Sentinel-2A Level-1C image dated 04/06/2020 has been downloaded from the Sentinels Scientific Data Hub (https://scihub.copernicus.eu/). The image is offered radiometrically corrected, and provides the Top of Atmosphere (TOA) reflectance, with 0% cloud cover and geometrically corrected to the Universal Transverse Mercator (UTM) WGS 1984 projection system (Xu et al. 2018). Sentinel-2 data provides similar medium resolution images to SPOT and LANDSAT images (Immitzer et al. 2016; Wulder et al. 2012).
13For a better understanding of the interactions between the different factors that make up the urban environment, we integrated all the documents and images into a Geographic Information System (GIS) environment. In this study all maps are made using ArcGIS 10.7 software.
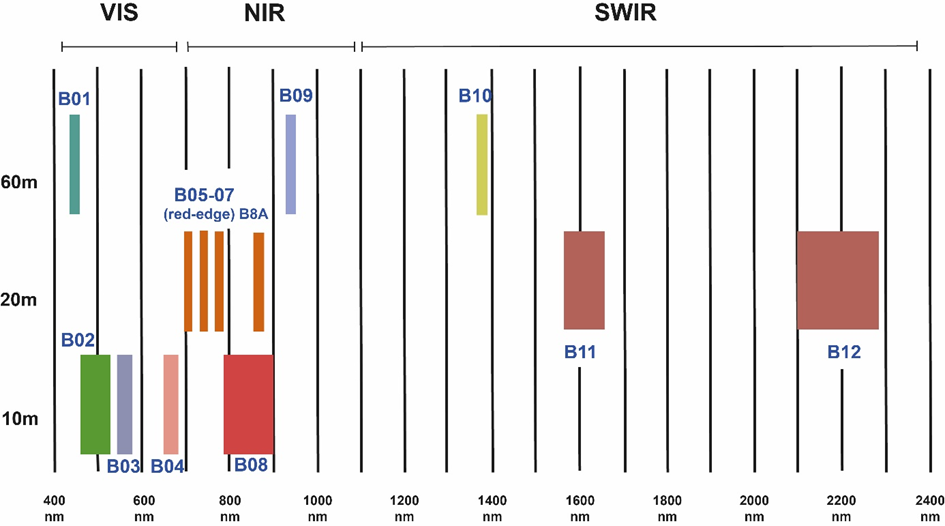
Figure 2: Sentinel- 2A images
3.4 Image processing
14An index is defined as a synthetic and digital variable determining the increase of a complicated phenomenon difficult to be subdivided into a number of parameters easy to deal with (Caloz et al. 2001).
15The spectral indices are calculated using the raster calculator tool of the ArcGIS v10.7 software. Considering the complexity of the soil components and the soil spectral signatures, the products obtained hide a disturbance, but remain acceptable for interpretation (Ettehadi Osgouei et al. 2019).
3.4.1 Implemented Indices
16The spectral bands that were used in our work to create the indices, according to Land cover/Land use (built, vegetation and water) are summarized in Table 1.
17The building discrimination indices combine Green, Red, Nir and SWIR bands. The reflectance for buildings is relatively high for SWIR 1 than for the other bands, hence its involvement in the different formulas (NDBI, BUI, NDVI, NDTI, BAEI) described in the literature (Ettehadi Osgouei et al. 2019) (Figure 3).
Table 1: Summarizes spectral indices
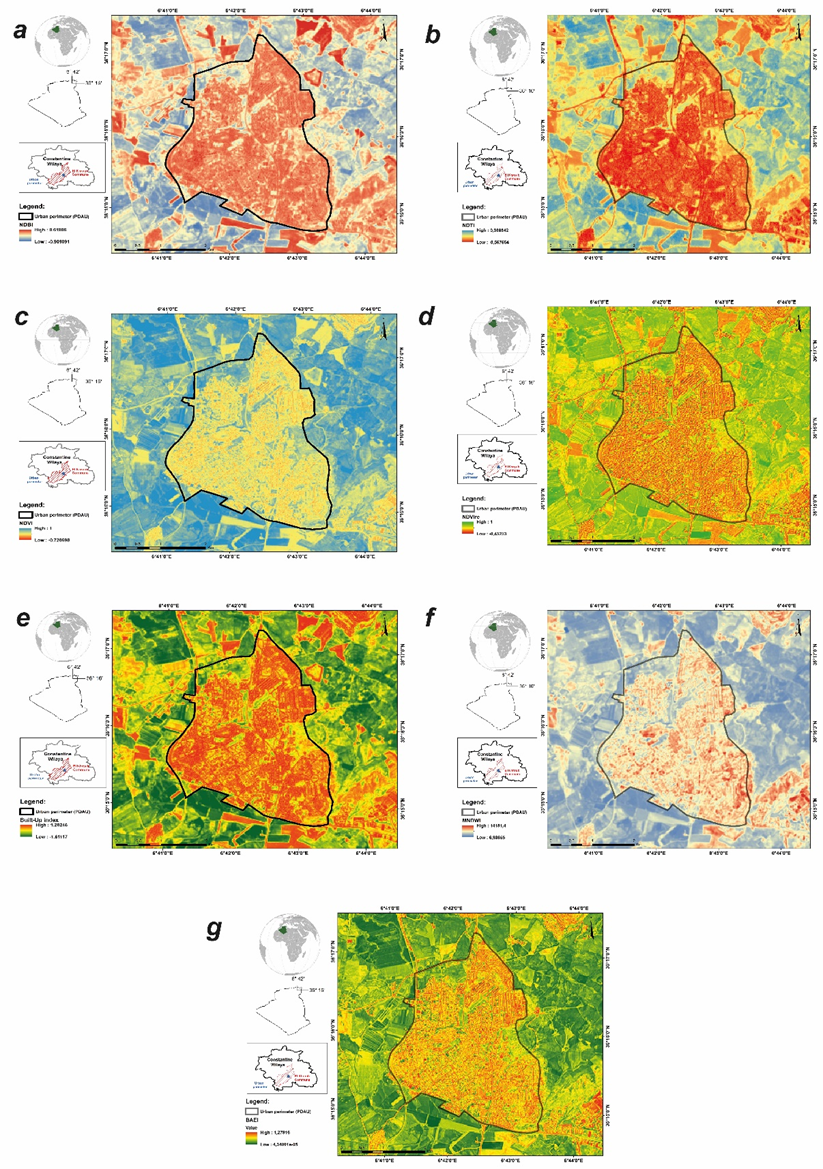
Figure 3: (a) Normalised Difference Built-up Index (NDBI), (b)Normalised difference Tillage index (NDTI); (c) Normalised Difference Vegetation Index (NDVI); (d)Red-Edge-based Normalized Vegetation Index (NDVIre); (e) Built - up index (BUI); (f) Modified Normalized Difference Water Index (MNDWI); and (g) Built-up area extraction index (BAEI).
3.4.2 Multi-index images
18The different spectral indices applied in this research (BUI, NDBI, BAEI and NDTI) can discriminate buildings to different degrees, but the challenge remains how to get better discrimination. Indeed, the concept of the multi-index image, which stipulates the combination of several indices, actually meets this need and makes it possible to sort out built-up areas from other land uses (He et al. 2010; Zhang et al. 2005). The RGB composite: NDTI, NDVIre, MNDWI proposed and applied for the first time by Paria Ettehadi Osgouei (2019) on Turkish metropoles, inspired us with the idea of making the following similar compositions: BAEI-NDVIre-MNDWI, NDBI-NDVIre-MNDWI, BUI-NDVIre MNDWI and BUI, NDTI, NDVIre. These multi-index images establish a good differentiation between the three essential categories of land cover: built-up areas in green, vegetation cover in red and water bodies in blue. The multi-index dataset represents a simple answer for the main concepts of Land Cover/Land Use than the original image strips, indicating better separation capability (Figure 4).
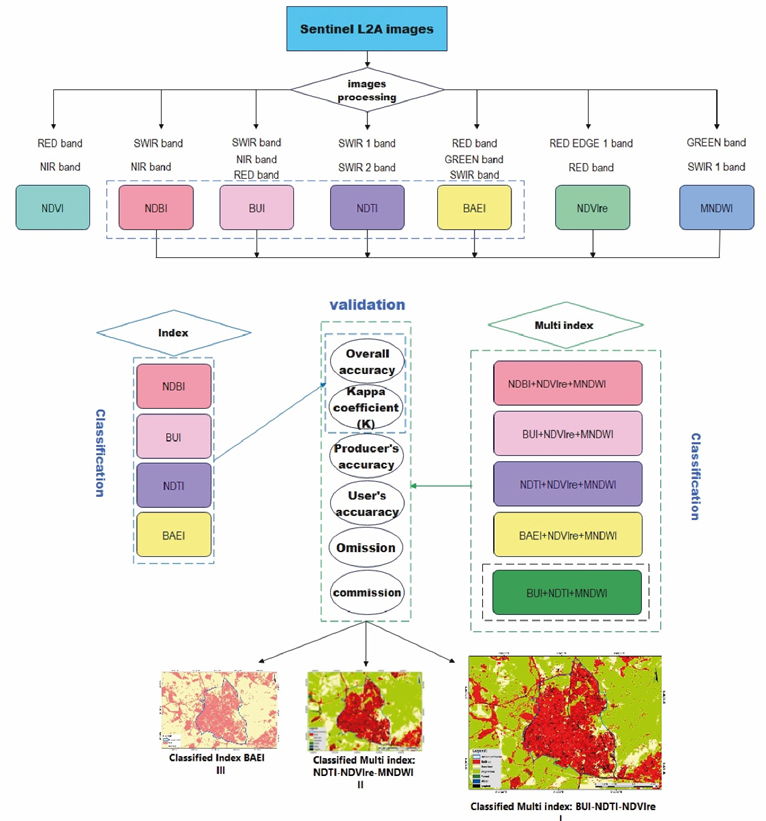
Figure 4: Methodology adopted in the study.
3.4.3 Classification
19To examine the ability of the indices used and the multi-index approach to define land use and cover, and to determine the built-up area, we used the supervised classification method. Many authors have applied it for the characterization and identification of different soil components (Asmala Ahmad 2012; Diagi Bridget Edewede 2018; Fonseca et al. 2009; Mahmon.Nur 2015). The classification process is a multi-step working process (Choudhary et al. 2016). The possibility that pixels have a singular class is the principle key of the maximum likelihood classifier (GebreMedhin et al. 2019; Morgan et al. 2015) which uses spectral signatures acquired from training samples to classify an image (Pushpendra et al. 2014). Using the image classification toolbar, we created training samples to image out the classes we want to extract, and establish a signature file from the training samples. This signature file is then used by multi-varied classification tools to classify the image. The use of supervised classification has allowed good image readability and a more accurate typology of the territory in classes (Mohamed and El-Raey 2020). For discriminating each land use class, we used the classification algorithm (Di Palma et al. 2016). These algorithms have been used to improve mapping accuracy at the pixel and object level (Cleve et al. 2008). The monitoring of urban growth from cartographic documents and the use of satellite imagery is integrated into a geographic information system (Soriano et al. 2019).
20In order to correct the errors caused by the pre-processing prior to classification, several studies have made it possible to carry out this phase (Smith et al. 1985), by using manual methods (Congalton et al. 1983a), automated methods (Congalton et al. 1985; Story et al. 1984) , imaging system (Williams et al. 1983), and by the techniques of sampling and accuracy calculation and comparison of the results (Aronoff 1982; Congalton et al. 1983b; Ginevan 1979; Hay 1979; Hord et al. 1976; Van Genderen et al. 1977). The classification adopted in this work, we used the "likelihood" algorithm, which is based on the random sampling of 60 samples distributed in ranges of built-up areas and bare land, in order to compare the accuracy of the extraction established from our treatments, and assess the difference between them. Regarding the multi-index images, the same method was used but with 240 samples and six classes (built-up area, bare land, asphalt, vegetation, forest and water bodies). The mapping accuracy was validated quantitatively in the form of a confusion matrix and a Kappa coefficient (κ) (Russell et al. 2009).
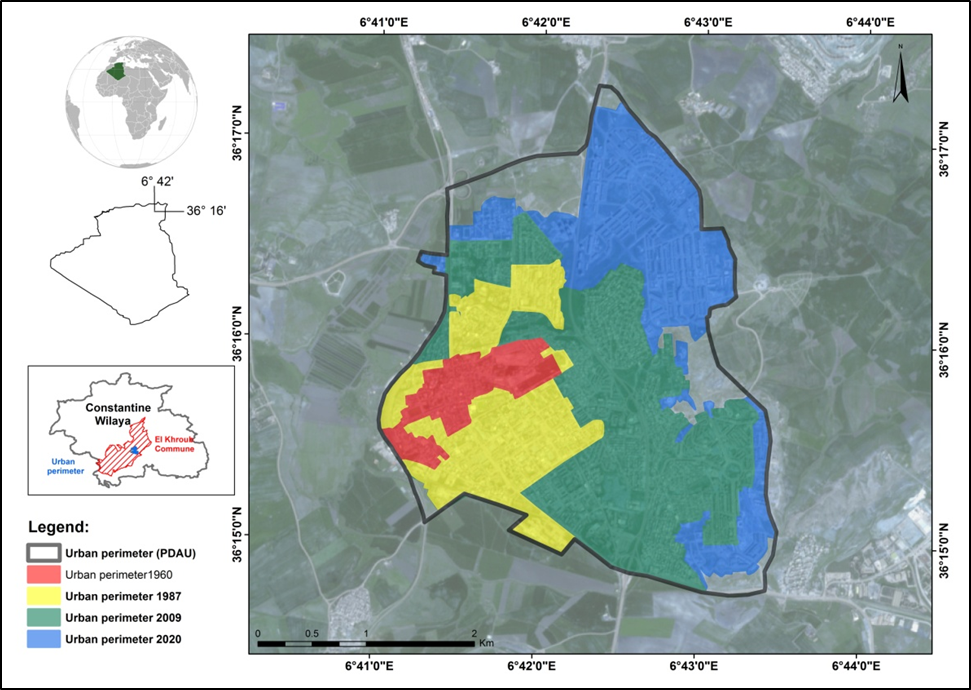
Figure 5: Evolution of El Khroub city 1960-2020.
4. Results and discussion
4.1. Spatiotemporal evolution
21Overlaying the various geo-referenced and digitized cartographic documents in the GIS environment as well as the image data, has enabled us to draw up maps showing the evolution of El Khroub city. Over the last 60 years, the change in the built-up is significant. However, calculations reveal that the built-up area shows a substantial overall increase of 276% (which occurred during the periods 1960-1987, 1987-2009 and 2009-2020 when the increase is of the order of 25.30%, 40.56% and 69.90% (Figure 5).This self-wiled population migration from the old and crowded megacity of Constantine towards El Khroub is the main reason for this increase to which ads the urban policies practiced during the same period.
4.2. Discrimination of built-up areas
4.2.1 Discrimination using Indices
22The correlation of spatio-maps a, b, c and d, corresponding respectively to the classifications of the NDTI, BAEI, BUI and NDBI indices (Figure 6), show that the best discriminating index for built-up areas is the BAEI index. However, these indices confuse agricultural land of binary rotation from the built-up areas, in particular in the north of El Khroub city, and also the built-up areas and the outcrops of rocks located in the south-eastern periphery of the city, because rocks have a spectral response similar to that of building materials.
23The assessment of the classification accuracy which is based on the ratio of the number of well-classified pixels to the total number of pixels (Table 2) shows that the most important value is that of the BAEI index with an overall accuracy of 91.80% and a Kappa coefficient value of 0.83. Second, the NDTI with an overall accuracy of 83.60% with a coefficient of 0.67, then the BUI with an overall accuracy of 81.96% whose coefficient equals at 0.63. Finally, the NDBI with an overall accuracy of 78.33% and a Kappa coefficient of 0.56.
24In our study case and according to these spatial data, the accuracy evaluation shows that the BAEI index can be used to obtain much better results for the extraction of the built-up area, The same Table( shows that the NDTI indices, BUI, and NDBI accuracy is lower than that of BAEI. Using the Green and SWIR bands with the Red band in a normalized difference ratio reinforces the built-up areas and vegetation(Bouzekri et al. 2015).
Table 2: Summary of accuracy assessment results
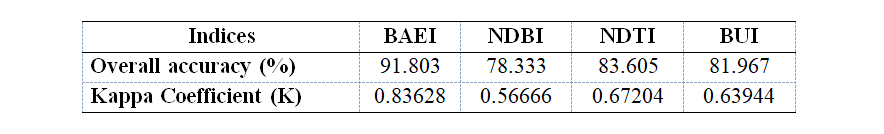
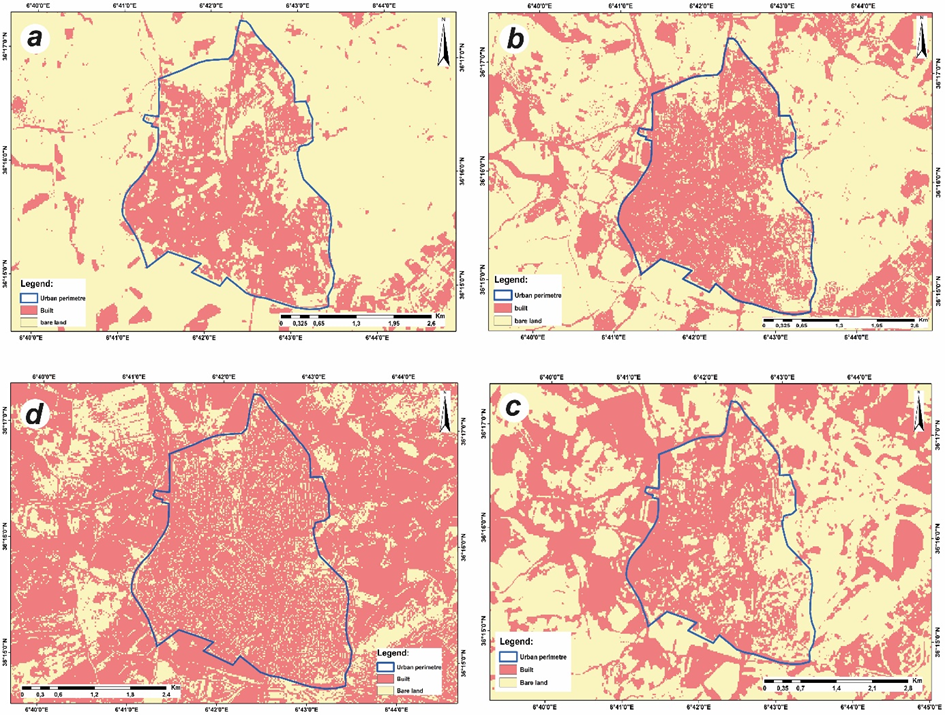
Figure 6: Classified results of: (a)NDTI;(b)BAEI;(c)BUI;(d)NDBI
4.2.2 Discrimination using Multi-index images
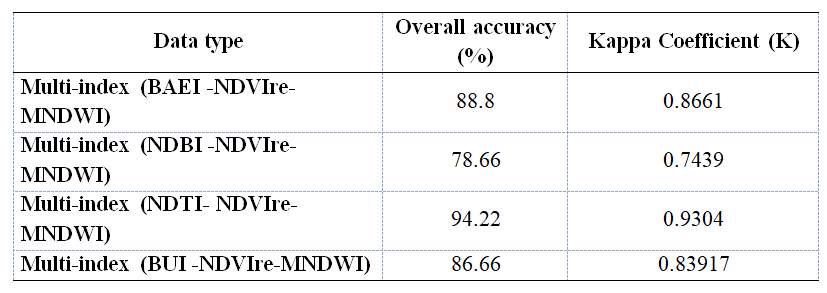
25Among the classifications of the BAEI-NDVIre-MNDWI, NDBI-NDVIre-MNDWI, NDTI-NDVIre-MNDWI, BUI-NDVIre-MNDWI multi-indexes, the classification and accuracy estimation measures proved that the RGB composite of the indices NDTI, NDVIre, MNDWI, provides the greatest discrimination against other assemblies (Table 3, Figure 7).
Table 3: Comparison of the overall accuracy and Kappa statistics
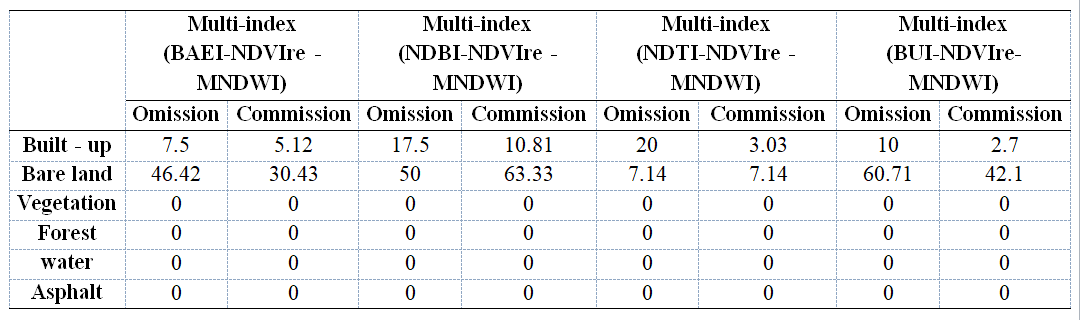
26Accuracy data are derived from the error matrix through individual accuracies and usage classes (Story Michael et al., 1986). The calculations of accuracy by class shown in Table 4 and 5, show that the multi-index image of the BAEI, MNDWI, NDVIre provides overestimated accuracies of the built-up area class, where the Producer's Accuracy is 92.5%, and therefore omission is 7.5% and commission 5.12%. In other words, the classification is not only good for the built-up area, but also good for the other classes (bare land, vegetation, forest, water and asphalt). The User's Accuracy or alternatively the reliability Congalton (Congalton et al. 1985) evaluated at 94.87%. This data that most interests the user of the image, it is a faithful representation of the field conditions (Story Michael et al. 1986). Bare land is also overestimated by this image with a “commission” rate equals to 30.43%.
27BUI-MNDWI-NDVIre multi–index image overestimates the bare land with a commission rate of around 42.1%, the User's accuracy provided by the error matrix represents 57.89% and an omission rate of 60.71%. The same table (5) reveals the effectiveness of this image and the need to improve the extraction of the built-up area with a commission rate of 2.7%; the lowest value in comparison with the other images. Regarding the NDBI-MNDWI-NDVIre multi-index image, the data provided show that they overestimated the built-up areas as well as the bare land, with a commission of around 10.81% and 63.33%.
28Concerning the NDTI-NDVIre -MNDWI multi-index image, it has revealed lower "commission" rates than those of the other indices (7.14% for bare land and 3.03% for built-up areas). For this purpose, the count of the accuracy of the classification generated by random sampling of the classified data, and expressed in the form of the error matrices confirms that the NDTI-NDVIre-MNDWI composite improves the segregation between built-up areas and bare land and greatly corrected the misclassification of bare land as built-up areas.
29On the other hand, the classes of water and forests are well discriminated in all the multi-index images, this is explained by the introduction of the NDVIre index as well as the MNDWI index.
30The NDTI-NDVIre-MNDWI multi-index image provided better accuracies for most land cover classes, especially built and bare land classes. The overall accuracy "Overall accuracy" and the coefficient "Kappa" (Table 3), indicate that the composite based on the NDTI has improved the result and offers an image with consistent ranges for each class of LULC, compared to Sentinel-2A and classified multi-index images from the NDBI, the NDVIre and the MNDWI. The Overall accuracy and kappa measurement presented in Table 4 and 5 indicate that the NDTI-based combination improve accuracy measurements with consistent ranges for each individual LCU class.
Table 4: Producer’s and user’s accuracy of the different images muti- index
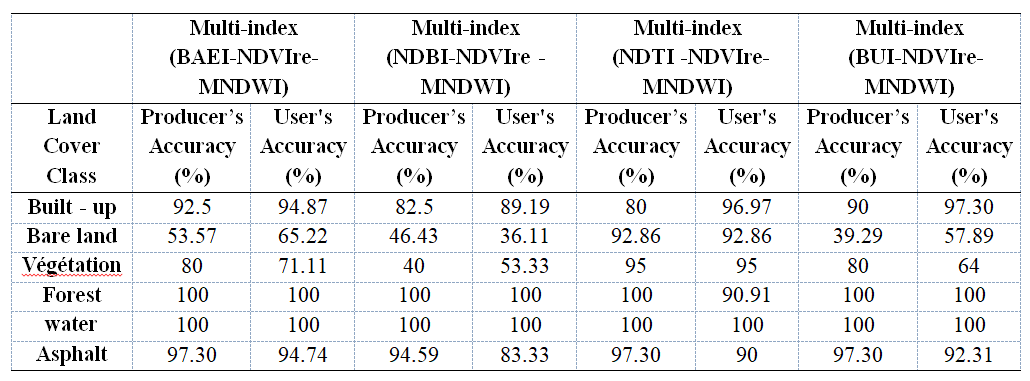
Table 5: Commission and omission of the different images multi-index
31In addition to the assemblies mentioned above, we have attempted an additional practice to the work of Ettehadi Osgouei et al., (2019); in this case the BUI-NDTI-NDVIre composite (Figure 7), which offers better discrimination of built-up areas. This composite fellow the same working methodology (supervised classification, random sampling and evaluation of precision). Thus, the results are presented in the Table 6.
Table 6: Overall accuracy and Kappa statics
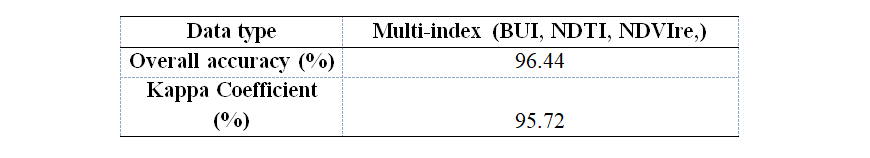
Table 7: Commission and omission, Producer's Accuracy and User’s accuracy of the different images multi-index image
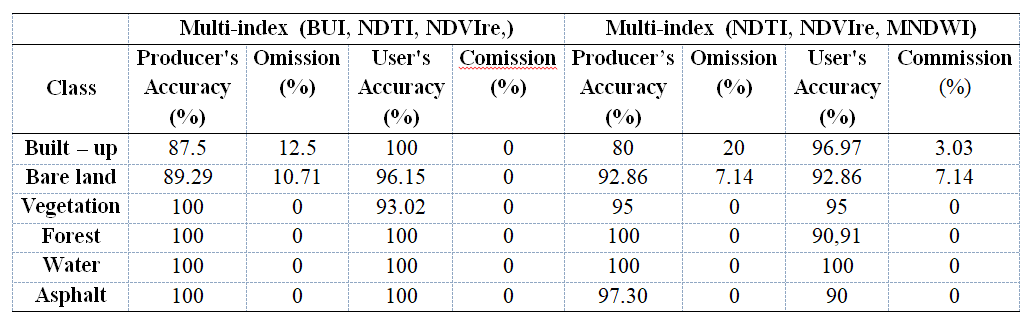
32Table (7) shows that the percentage of the overall accuracy of the last multi-index image is 96.44%, in other words, the pixels are correctly classified as well as the highest rate compared to the other different multi-index images. The kappa coefficient is evaluated at 95.72% where it can be considered that the correspondence between the sampling pixels and the reference pixels is almost perfect. The analysis of the classification error matrices (Table 7) shows that the precision of the Producer's Accuracy for the class of built-up areas is higher by about 87.5%. This is reflected by a lower omission rate (12.5%) compared to the result of the NDTI-NDVIre-MNDWI index image which is of 20%; the accuracy of the User's Accuracy is 100% and 0% commission, which corresponds to the reality on the ground. Regarding bare land, despite the high omission rate (10.71%) compared to the NDTI-NDVIre-MNDWI combination (7.14%), the commission rate remains zero (0%), which clearly confirms that our approach separates built-up areas from bare land with high precision.
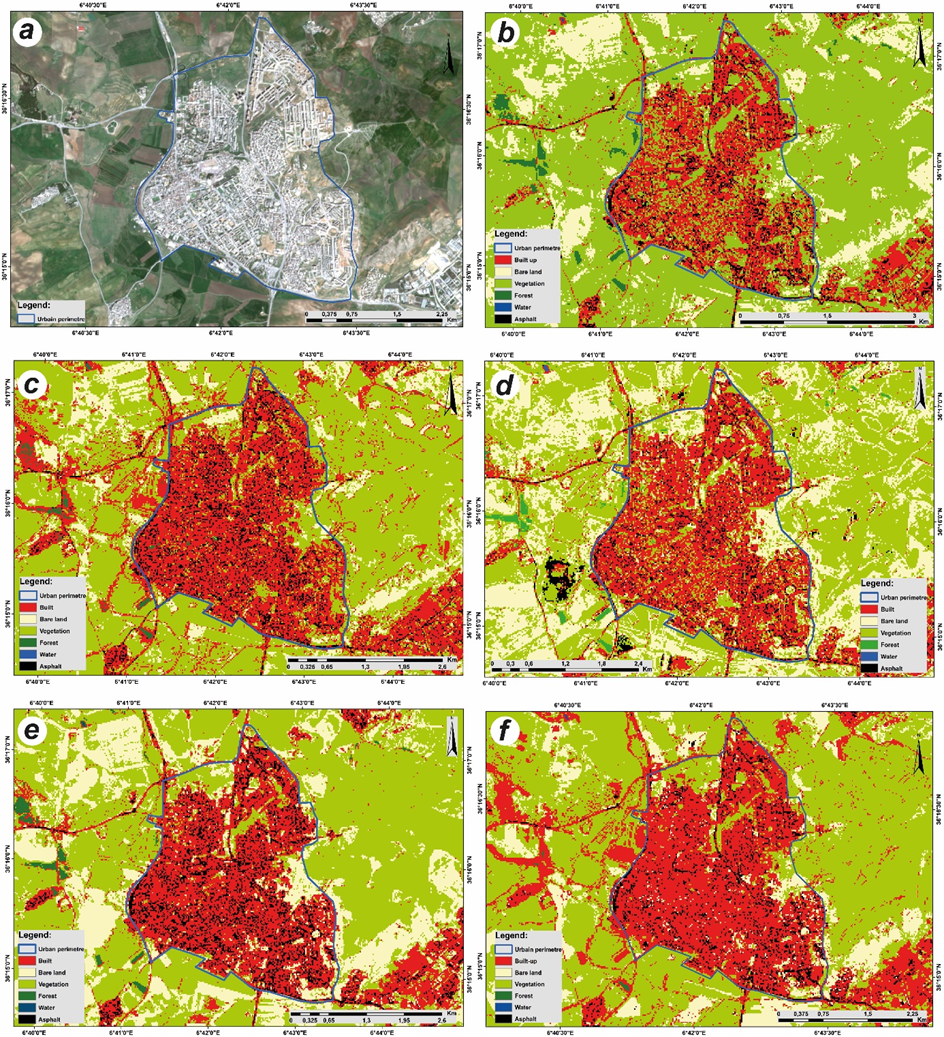
Figure 7: (a) RGB image of Sntinel-2A; (b) The classified multi-index (BUI-NDVIre-MNDWI); (c) classified multi-index (BAEI-NDVIre-MNDWI); (d) classified multi-index (NDBI-NDVIre-MNDWI); (e) classified multi-index (NDTI-NDVIre-MNDWI); and (f) The classified multi-index (BUI-NDTI-NDVIre).
4. Conclusion
33The multi-index image was applied in the area of El Khroub city, Algeria, to map the urban area over a period of 60 years (from 1960 to 2020). The built-up area of the city of El Khroub increased by almost 276% during this period, which led to a significant change in land use.
34Segregating built-up areas from bare land in cities is among the most challenging tasks in mapping urban areas. In order to improve the classification accuracy and solve the problems of misclassification and overestimation, we used spectral indices based methodology that allows us to distinguish three main land cover classes. Multi-index images instituted with distinct combinations of indices underwent supervised classification using the method of likelihood algorithm. In this work, we have introduced the multi-index composite BUI, NDTI, and NDVIre, which proves to discriminate relatively better the built-up areas from the bare lands. The choice of the indices involved is based on the results of the precision of the multi-index images NDTI-NDVIre-MNDWI and BUI-NDVIre-MNDWI, which are respectively of the order of 97.30%, 96.97% for the built-up area and 92.86%, 57.89% for bare land. The results of this study can constitute a useful base for the orientation of the future urban extension, management and sustainable urban planning.
35The main limitation of this paper is linked to the difficulty to determine how the typology of built-up areas that need high-resolution images could be undertaken. Our future researches will be to determine the suitability of the land for the planning of urban services in the city of El Khroub, we will develop a field study to address issues affecting the effectiveness of urban planning (services, housing, various networks).
5. References
Abdaoui, Gihen Ream T, Ahmed Amine B, Foued B, Ahmed aB, Salah (2020) Sprawl, Specificity and Dynamics of Inter-Municipal Urban Agglomerations of the Souf Valley (South East Algeria): Using GIS Techniques,” International Journal of Innovation and Applied Studies, vol. 29, no. 4, pp. 991–1014,. International Journal of Innovation and Applied Studies 29:991–1014
Agro-geoinformatics (2021): Theory and Practice, 1st edn. Springer Remote Sensing/Photogrammetry. Springer International Publishing, Cham
Aronoff S (1982) Classification accuracy: A user approach. Photogrammetric Engineering and Remote Sensing. 48:1299–1307
Asmala Ahmad SQ (ed) (2012) 2012 IEEE International Conference on Control System, Computing and Engineering. IEEE
As-syakur AR, Adnyana IWS, Arthana IW, Nuarsa IW (2012) Enhanced Built-Up and Bareness Index (EBBI) for Mapping Built-Up and Bare Land in an Urban Area. Remote Sensing 4:2957–2970. https://doi.org/10.3390/rs4102957
Bouteraa O, Mebarki A, Bouaicha F, Nouaceur Z, Laignel B (2019) Groundwater quality assessment using multivariate analysis, geostatistical modeling, and water quality index (WQI): a case of study in the Boumerzoug-El Khroub valley of Northeast Algeria. Acta Geochim 38:796–814. https://doi.org/10.1007/s11631-019-00329-x
Bouzekri S, Lasbet AA, Lachehab A (2015) A New Spectral Index for Extraction of Built-Up Area Using Landsat-8 Data. J Indian Soc Remote Sens 43:867–873. https://doi.org/10.1007/s12524-015-0460-6
Bramhe VS, Ghosh SK, Garg PK (2018) EXTRACTION OF BUILT-UP AREA BY COMBINING TEXTURAL FEATURES AND SPECTRAL INDICES FROM LANDSAT-8 MULTISPECTRAL IMAGE. Int. Arch. Photogramm. Remote Sens. Spatial Inf. Sci. XLII-5:727–733. https://doi.org/10.5194/isprs-archives-XLII-5-727-2018
Caloz, Régis C, Claude (2001) Précis de télédétection - Volume 3. Traitements numériques d'images de télédétection. PU QUEBEC
Cauvin C, Escobar F, Serradj A (2007-2008) Cartographie thématique. Traité IGAT. Série Aspects fondamentaux de l'analyse spatiale. Hermès science publications; Lavoisier, Paris
Choudhary, K BM, S K, A K, V. (2016) Land use/cover change detection through remote sensing and GIS techniques: A case study of Astrakhan, Russia. Information Technology and Nanotechnology.:503-509.
Cleve C, Kelly M, Kearns FR, Moritz M (2008) Classification of the wildland–urban interface: A comparison of pixel- and object-based classifications using high-resolution aerial photography. Computers, Environment and Urban Systems 32:317–326. https://doi.org/10.1016/j.compenvurbsys.2007.10.001
Congalton, R aM, R. (1983a) A quantitative method to test for consistency and correctness in photointerpretation. Photogrammetric Engineering and Remote Sensing. 49:69–74
Congalton, R O, R aM, R. (1983b) Assessing Landsat classification accuracy using discrete multivariate analysis statistical techniques. Photogrammetric Engineering and Remote Sensing. 49:1671–1678
Congalton, R aR, A. (1985) COMPAR: A computerized technique for the in-depth comparison of remotely sensed data. Proceedings of the 51st Annual Meeting of the:98–106
Delegido J, Verrelst J, Alonso L, Moreno J (2011) Evaluation of Sentinel-2 red-edge bands for empirical estimation of green LAI and chlorophyll content. Sensors (Basel) 11:7063–7081. https://doi.org/10.3390/s110707063
Deventer van AP, Ward AD, Gowda PH, Lyon JG (1997) Using Thematic Mapper Data to Identify Contrasting Soil Plains and Tillage Practices. Photogramm. Eng. Remote Sens. 63, 87–93.
Di Palma F, Amato F, Nolè G, Martellozzo F, Murgante B (2016) A SMAP Supervised Classification of Landsat Images for Urban Sprawl Evaluation. IJGI 5:109. https://doi.org/10.3390/ijgi5070109
Diagi Bridget Edewede (2018) Assessment of Changes in Landcover and Landuse in Ebonyi State, Using Remote Sensing Technique. Journal of Environment and Earth Science
Elodie RUCH AS (2006) Evolution spatiotemporelle de la tache urbaine à l'aide de cartes anciennes, d’images satellitaires et des Systèmes d'Information Géographique: le cas de Blida en Algérie (de 1936 à 2015).
Ettehadi Osgouei P, Kaya S, Sertel E, Alganci U (2019) Separating Built-Up Areas from Bare Land in Mediterranean Cities Using Sentinel-2A Imagery. Remote Sensing 11:345. https://doi.org/10.3390/rs11030345
Fonseca, Leila Maria Gar N, Laercio Massaru C, Emiliano Ferreira (eds) (2009) 2009 Tutorials of the XXII Brazilian Symposium on Computer Graphics and Image Processing. IEEE
Frampton WJ, Dash J, Watmough G, Milton EJ (2013) Evaluating the capabilities of Sentinel-2 for quantitative estimation of biophysical variables in vegetation. ISPRS Journal of Photogrammetry and Remote Sensing 82:83–92. https://doi.org/10.1016/j.isprsjprs.2013.04.007
Gadal S, Ouerghemmi W (2019) Multi-Level Morphometric Characterization of Built-up Areas and Change Detection in Siberian Sub-Arctic Urban Area: Yakutsk. IJGI 8:129. https://doi.org/10.3390/ijgi8030129
GebreMedhin A, Biruh W, Govindu V, Demissie B, Mehari A (2019) Detection of Urban Land Use Land Cover Dynamics Using GIS and Remote Sensing: A Case Study of Axum Town, Northern Ethiopia. J Indian Soc Remote Sens 47:1209–1222. https://doi.org/10.1007/s12524-019-00974-y
Ginevan M (1979) Testing land use map accuracy: another look. Photogrammetric Engineering and Remote Sensing. 45:1371–1377
Hansen PM, Schjoerring JK (2003) Reflectance measurement of canopy biomass and nitrogen status in wheat crops using normalized difference vegetation indices and partial least squares regression. Remote Sensing of Environment 86:542–553. https://doi.org/10.1016/S0034-4257(03)00131-7
Hay A (1979) Sampling designs to test land use map accuracy. Photogrammetric Engineering and Remote Sensing. 45:529–533
He C, Shi P, Xie D, Zhao Y (2010) Improving the normalized difference built-up index to map urban built-up areas using a semiautomatic segmentation approach. Remote Sensing Letters 1:213–221. https://doi.org/10.1080/01431161.2010.481681
Hioul s (2002) Mutations fonctionnelles d’un village colonial dans la logique de la croissance urbaine de Constantine – le cas d'El Khroub, Magister, université Constantine 1:227
Hord, R aB, W. (1976) Land use map accuracy criteria. Photogrammetric Engineering and Remote Sensing. 42:671--Q77
Immitzer M, Vuolo F, Atzberger C (2016) First Experience with Sentinel-2 Data for Crop and Tree Species Classifications in Central Europe. Remote Sensing 8:166. https://doi.org/10.3390/rs8030166
Institut Géographique National (1960) Carte topographique El Khroub N° 1-2. Institut Géographique National
Institut National de Cartographie et Télédétection (2009) Carte topographique Constantine N°4. Institut National de Cartographie et Télédétection
Kieffer Emilen SA (2013) La télédétection au service des études urbaines : expansion de la ville de Pondichéry entre 1973 et 2009. Géomatique Expert n° 95.
Li H, Wang C, Zhong C, Su A, Xiong C, Wang J, Liu J (2017) Mapping Urban Bare Land Automatically from Landsat Imagery with a Simple Index. Remote Sensing 9:249. https://doi.org/10.3390/rs9030249
Linh, N.H.K. (2011) Automatic establishment of urban land distribution map using IBI index from Landsat TM image: Case study in Hue city - Thua Thien Hue province (in Vietnamese). National Conference on GIS Application:205–212
Liu L, Zhang Y (2011) Urban Heat Island Analysis Using the Landsat TM Data and ASTER Data: A Case Study in Hong Kong. Remote Sensing 3:1535–1552. https://doi.org/10.3390/rs3071535
Mahmon.Nur (ed) (2015) 2015 IEEE 11th International Colloquium on Signal Processing & Its Applications (CSPA). IEEE
Mohamed SA, El-Raey ME (2020) Vulnerability assessment for flash floods using GIS spatial modeling and remotely sensed data in El-Arish City, North Sinai, Egypt. Nat Hazards 102:707–728. https://doi.org/10.1007/s11069-019-03571-x
Morgan, R, S RI, S AE-H, y M (2015) A Comparison of Classification Techniques for the Land Use/ Land Cover Classification. Journal of Agricultural Science . 4:810-818.
Office National des statistiques (2008) Recensement général de la population et l’habitat (RGPH)
Pushpendra, Singh, Sisodia V, Tiwari A, Kumar (eds) (2014) International Conference on Recent Advances and Innovations in Engineering (ICRAIE-2014). IEEE
Ranagalage M, Estoque RC, Murayama Y (2017) An Urban Heat Island Study of the Colombo Metropolitan Area, Sri Lanka, Based on Landsat Data (1997–2017). IJGI 6:189. https://doi.org/10.3390/ijgi6070189
Rasul A, Balzter H, Ibrahim G, Hameed H, Wheeler J, Adamu B, Ibrahim S, Najmaddin P (2018) Applying Built-Up and Bare-Soil Indices from Landsat 8 to Cities in Dry Climates. Land 7:81. https://doi.org/10.3390/land7030081
RIDD MK (1995) Exploring a V-I-S (vegetation-impervious surface-soil) model for urban ecosystem analysis through remote sensing: comparative anatomy for cities†. International Journal of Remote Sensing 16:2165–2185. https://doi.org/10.1080/01431169508954549
Rouse, J.W., Haas, R.H., Schell, J.A. and Deering, D.W. (1973) Monitoring Vegetation Systems in the Great Plains with ERTS. 3rd ERTS Symposium, NASA SP-351, Washington DC
Rousseaux V. (2004) L’urbanisation au Maghreb. Le langage des cartes. Publications de l’Université de Provence. P 254.
Russell, G C, R K, Green. (2009) Assessing the Accuracy of Remotely Sensed Data – Principles and Practices Second edition CRC Press, Taylor & Francis Group, Boca Raton, FL 978-1-4200-5512-2 183 pp. International Journal of Applied Earth Observation and Geoinformation 11:448–449. https://doi.org/10.1016/j.jag.2009.07.002
Sekertekin A, Abdikan S, Marangoz AM (2018) The acquisition of impervious surface area from LANDSAT 8 satellite sensor data using urban indices: a comparative analysis. Environ Monit Assess 190:381. https://doi.org/10.1007/s10661-018-6767-3
Sinha P, Verma NK, Ayele E (2016) Urban Built-up Area Extraction and Change Detection of Adama Municipal Area using Time-Series Landsat Images. IJARSG 5:1886–1895. https://doi.org/10.23953/cloud.ijarsg.67
Smith, J aW, Kovalick (1985) A comparison of the effects of resampling before and after classification on the accuracy of a Landsat derived cover type map. . Proceedings of the International Conference on Advanced Technology for Monitoring and Processing Global Environmental Information. University of London, London, England
Soriano M, Hilvano N, Garcia R, Hao A, Alegre A, Tiburan JC (2019) Land Use/Land Cover Change Detection and Urban Sprawl Analysis in the Mount Makiling Forest Reserve Watersheds and Buffer Zone, Philippines. Environments 6:9. https://doi.org/10.3390/environments6020009
Story, M, J. Campbell and Best, G. (1984) An evaluation of the accuracies of five algorithms for machine processing of remotely sensed data. Proceedings of the. Ninth Pecora Remote Sensing Symposium. Sioux Falls, S.D:399–405
Story Michael R, G and Congalton, R. (1986) Accuracy Assessment: A User’s Perspective. American Society for Photogrammetry and Remote Sensing 52:397–399
Tan J, Zheng Y, Tang X, Guo C, Li L, Song G, Zhen X, Yuan D, Kalkstein AJ, Li F (2010) The urban heat island and its impact on heat waves and human health in Shanghai. Int J Biometeorol 54:75–84. https://doi.org/10.1007/s00484-009-0256-x
Th Raven. (1957) Carte géologique de l'Algérie 1:50,000. El Khroub, N°97. Service de la carte géologique de lÁlgérie.
Tien Nguyen T (2020) Spatio-temporal Analysis of Urban Built-up Land in the Hanoi Metropolitan Area (Vietnam) using Remotely Sensed Images. Asian Review of Environmental and Earth Sciences 7:61–66. https://doi.org/10.20448/journal.506.2020.71.61.66
URBACO (1998) Rapport de synthèse du PDAU, Groupement de Communes: Constantine, El Khroub, Ain Smara, Hamma Bouziane et Didouche Mourad. URBACO
URBACO (2014) Révision du Plan Directeur d’Aménagent et d’Urbanisme du PDAU Intercommunal,. URBACO
Van Genderen, J and Lock, B. (1977) Testing land - use map accuracy. Photogrammetric Engineering and Remote Sensing. 43:1135–1137
Williams, D. I, J L, R , B. Markham, R Nelson, M. Stauffer, and D. Toll (1983) Impact of TM sensor characteristics on classification accuracy. Proceedings of the international geosciences and remote sensing symposium. IEEE, New York 1
Wulder MA, Masek JG, Cohen WB, Loveland TR, Woodcock CE (2012) Opening the archive: How free data has enabled the science and monitoring promise of Landsat. Remote Sensing of Environment 122:2–10. https://doi.org/10.1016/j.rse.2012.01.010
Xu H (2005) A study on information extraction of water body with the modified normalized difference water index (MNDWI). Journal of Remote Sensing. 9. 589-595.
Xu H (2006) Modification of normalised difference water index (MNDWI) to enhance open water features in remotely sensed imagery. International Journal of Remote Sensing 27:3025–3033. https://doi.org/10.1080/01431160600589179
Xu H (2007) Extraction of Urban Built-up Land Features from Landsat Imagery Using a Thematicoriented Index Combination Technique. photogramm eng remote sensing 73:1381–1391. https://doi.org/10.14358/PERS.73.12.1381
Xu H (2008) A new index for delineating built‐up land features in satellite imagery. International Journal of Remote Sensing 29:4269–4276. https://doi.org/10.1080/01431160802039957
Xu R, Liu J, Xu J (2018) Extraction of High-Precision Urban Impervious Surfaces from Sentinel-2 Multispectral Imagery via Modified Linear Spectral Mixture Analysis. Sensors (Basel) 18. https://doi.org/10.3390/s18092873
Zha Y, Gao J, Ni S (2003) Use of normalized difference built-up index in automatically mapping urban areas from TM imagery. International Journal of Remote Sensing 24:583–594. https://doi.org/10.1080/01431160304987
Zhang Q, Wang J, Peng X, Gong P, Shi P (2002) Urban built-up land change detection with road density and spectral information from multi-temporal Landsat TM data. International Journal of Remote Sensing 23:3057–3078. https://doi.org/10.1080/01431160110104728
Zhang Q, Pavlic G, Chen W, Fraser R, Leblanc S, Cihlar J (2005) A semi-automatic segmentation procedure for feature extraction in remotely sensed imagery. Computers & Geosciences 31:289–296. https://doi.org/10.1016/j.cageo.2004.10.003
