- Accueil
- Volume 65 - Année 1996
- Numéro 4-5
- Flash absorption spectroscopy


Visualisation(s): 434 (0 ULiège)
Téléchargement(s): 22 (0 ULiège)

Flash absorption spectroscopy
Priciple and applications in plant photosynthesis research

Document(s) associé(s)
Version PDF originaleTable des matières
1. Introduction
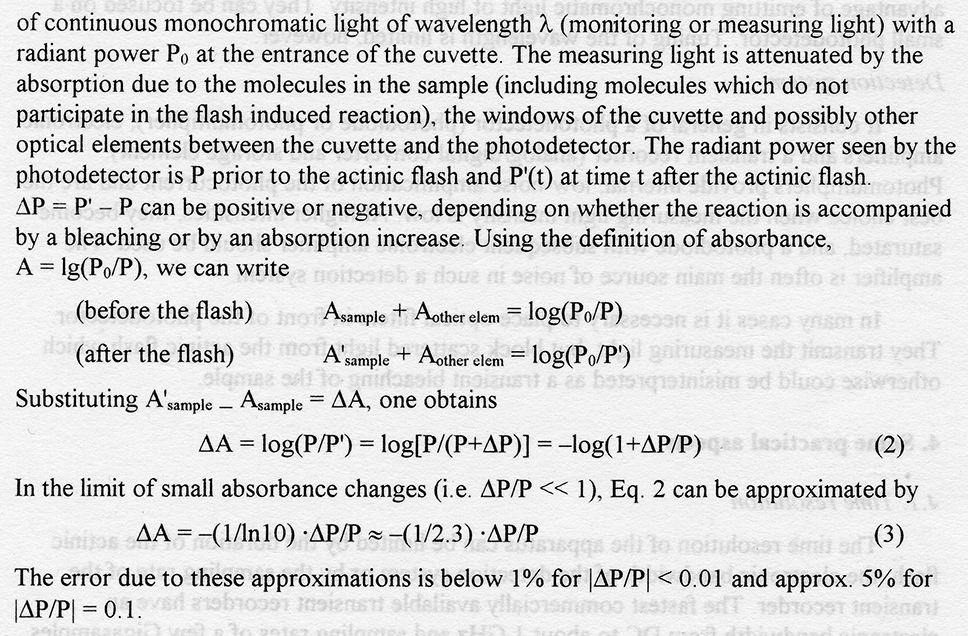
2. Principle
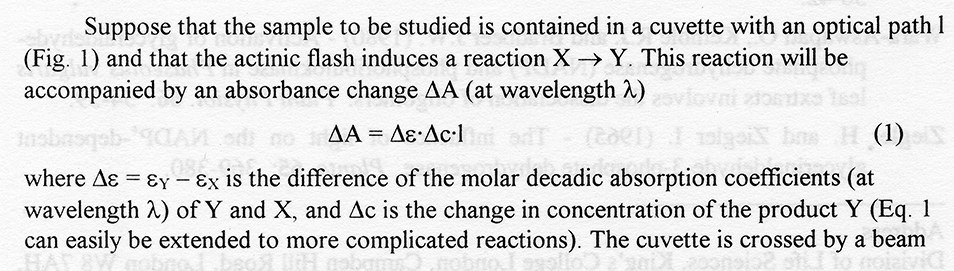
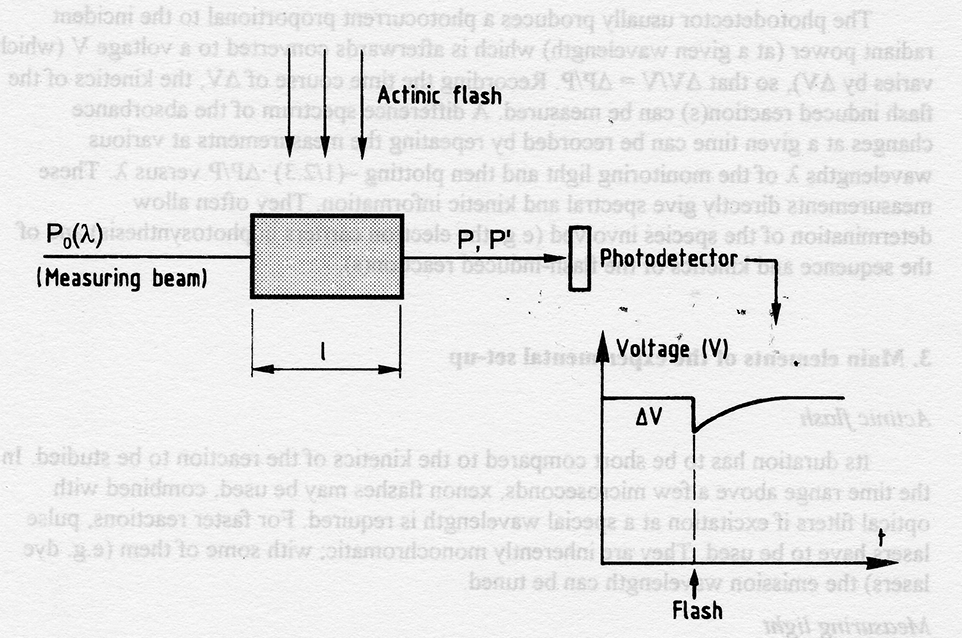
Figure 1 : Principle of measurement of flash-induced absorption changes
3. Main elements of the experimental set-up
4. Some practical aspects
4.1 Time resolution
4.2 Signal-to-noise ratio
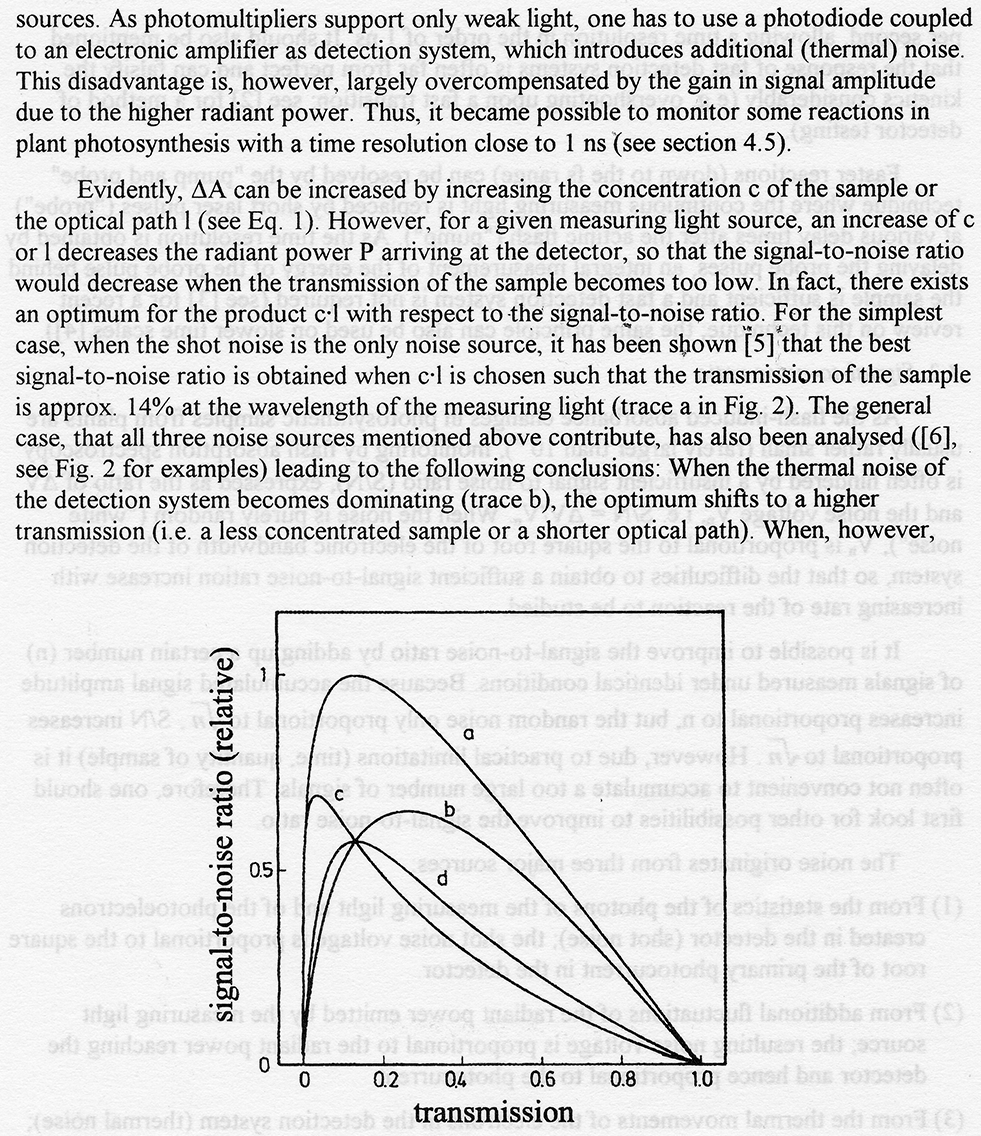
Figure 2: Dependance of the signal-to-noise ratio on the transmission of the sample. Different T values represent different optical paths l or different concentrations c of the same sample. The following assumptions about the noise sources were made: Trace a: shot noise is the only the only noise source. Trace B: thermal noise of the detection system contributes in addition to the shot noise; the ratio ofthermal noise to shot noise is sqrt(2):1 at T = 0.14. Trace c: fluctuations of the radiant power of measuring light source contribute in addition to the shot noise; the ratio of these fluctuations to the shot noise is sqrt(2):1 at T = 0.14. Trace d: all three noise sources contribute equally at T = 0.14. See text and Ref. [6] for further details. Redrawn from Ref. [6].
4.3 Actinic effect of the measuring light
4.4 Fluorescence artefact
4.5 Exemples of set-ups with sub-microsecond time-resolution
References