
A techno-economic approach for capacity assessment and ranking of potential options for geological storage of CO2 in Austria
Abstract
Carbon dioxide capture and geological storage (CCS) is a means to drastically reduce greenhouse gas emissions. This paper shows an application to the Austrian context of a newly developed methodology for the assessment of geological reservoirs, based on expert opinions on the Schönkirchen Tief, Höflein, Schönkirchen Übertief, Reyersdorfer Dolomite, Aderklaa, Atzbach-Schwanenstadt and Voitsdorf reservoirs. Because of a lack in reservoir-specific research for the storage of CO2, large uncertainties on the behaviour and use of the Austrian reservoirs exist. Therefore the potential of the reservoirs remains unknown. Geological, technological and economic simulations are performed which integrate different uncertainties. The results show that there is a significant potential for CO2 storage in Austria. The total practical and matched capacity for Austria is assessed at about 120 and 40 MtCO2 respectively. An exploration priority ranking, based on reservoir development probability, shows that the Schönkirchen Übertief reservoir has the highest potential for storage and should be a primary target for further exploration.
1. Introduction
1The global average concentration of CO2 in the atmosphere has risen from 280 ppmv in pre-industrial times to almost 400 ppmv early 2014 (Keeling et al., 2014). Anthropogenic emission of greenhouse gasses (GHG) such as CO2 from burning fossil fuels are a main contributor to this rise, causing global climate change (IPCC, 2014). CO2 capture and geological storage (CCS) is a potential means to significantly reduce emissions from large stationary industrial facilities (IPCC, 2005). CO2 is captured, purified, pressurized and transported to a suitable injection location. This location is determined by the presence of a suitable geological reservoir for safe and permanent storage. Possible reservoirs include depleted hydrocarbon fields, deep saline aquifers, man-made cavities and active hydrocarbon fields where CO2 is injected to enhance hydrocarbon production.
2Several studies have indicated that storage capacity is available in Europe, although it is not evenly distributed (Christensen & Holloway, 2004; Vangkilde-Pedersen et al., 2009). Long-distance and cross-border transport may therefore become inevitable (Neele et al., 2013). For countries with limited capacity, there are however a number of reasons to consider the development of domestic reservoirs instead of relying solely on export for CO2 storage. Apart from the possible strategic advantage, these reasons mainly come down to a potential lower transport and storage cost.
3Scharf & Clemens (2006) provided a first overview of potential storage reservoirs and accompanying capacity estimates for Austria. They estimate the total storage capacity for the country at 465 MtCO2. This geological overview, however, does not consider geological uncertainties that influence capacity, nor do they consider the availability of CO2 sources and economic opportunities for CO2 capture, transport and storage trough space and time. It has been shown that there is an important interaction between these factors and reservoir capacity assessments for CO2 storage (Bachu et al., 2007; Keating et al., 2011; Middleton et al., 2012). As more information on a reservoir and its economic viability becomes available, its capacity estimate generally decreases. This has results in what is called the techno-economic resource pyramid for CO2 storage capacity. In its final step, a source-sink match determines which portion of the available reservoir space will actually be used for storage.
4This paper aims to provide reservoir capacities and a ranking of the Austrian reservoirs as potential targets for CO2 storage considering a techno-economic framework. In order to obtain realistic results, uncertainties in data on capture, transport and storage are fully integrated in the analysis. In a first step, a geo-economic calculation scheme called “PSS (Policy Support System) Explorer” is used. This methodology relies on expert opinions for including reservoir uncertainties. Source-sink matching is done using the PSS III simulator (Piessens et al., 2012; Welkenhuysen et al., 2013). This methodology allows determination of the probability that a certain reservoir will be used, which reservoirs are primary targets for storage, and which capacity is available and will be used for storage. In this paper the emissions from two of the most CO2-intensive industries, the power and iron & steel sector or about 30% of Austria’s total emissions, will be simulated to be available for storage. With this research, a first realistic assessment is made on the economic potential of CCS and potential reservoirs in Austria, which can direct policy and provide targets for further investigation.
2. Geology of Austria
5In Austria, the geological landscape is dominated by the mountain range of the Eastern Alps, the Penninic Units (the Flysch Zone and the tectonic windows), the Precambrian Bohemian Massif and the Cenozoic sedimentary basins (Fig. 1).
6The Eastern Alps are subdivided into the Northern Calcareous Alps and the Central Alps with their boundaries along the Salzachtal-Ennstal-Mariazell-Puchberg (SEMP) fault to the north and the Periadriatic Lineament to the south. The Northern Calcareous Alps are built up of Permo-Mesozoic sediments deposited on the African passive continental margin. During the Cretaceous orogeny, these sediments together with their basal Palaeozoic sediments (the Grauwackenzone) were torn from their crystalline basement and thrusted to the north (Prey, 1980). The prevalent, mainly Palaeozoic aged crystalline rocks of the Central Alps represent the northern shelf of the African continent and tectonically underlie the Northern Calcareous Alps (Prey, 1980). Tectonic windows within the Central Alps, where mainly Penninic units come to surface due to uplift and erosion, are represented by the prominent Tauern window as well as the Unterengadiner, the Gargellen and the Rechnitzer windows (Prey, 1980), see Figure 1.
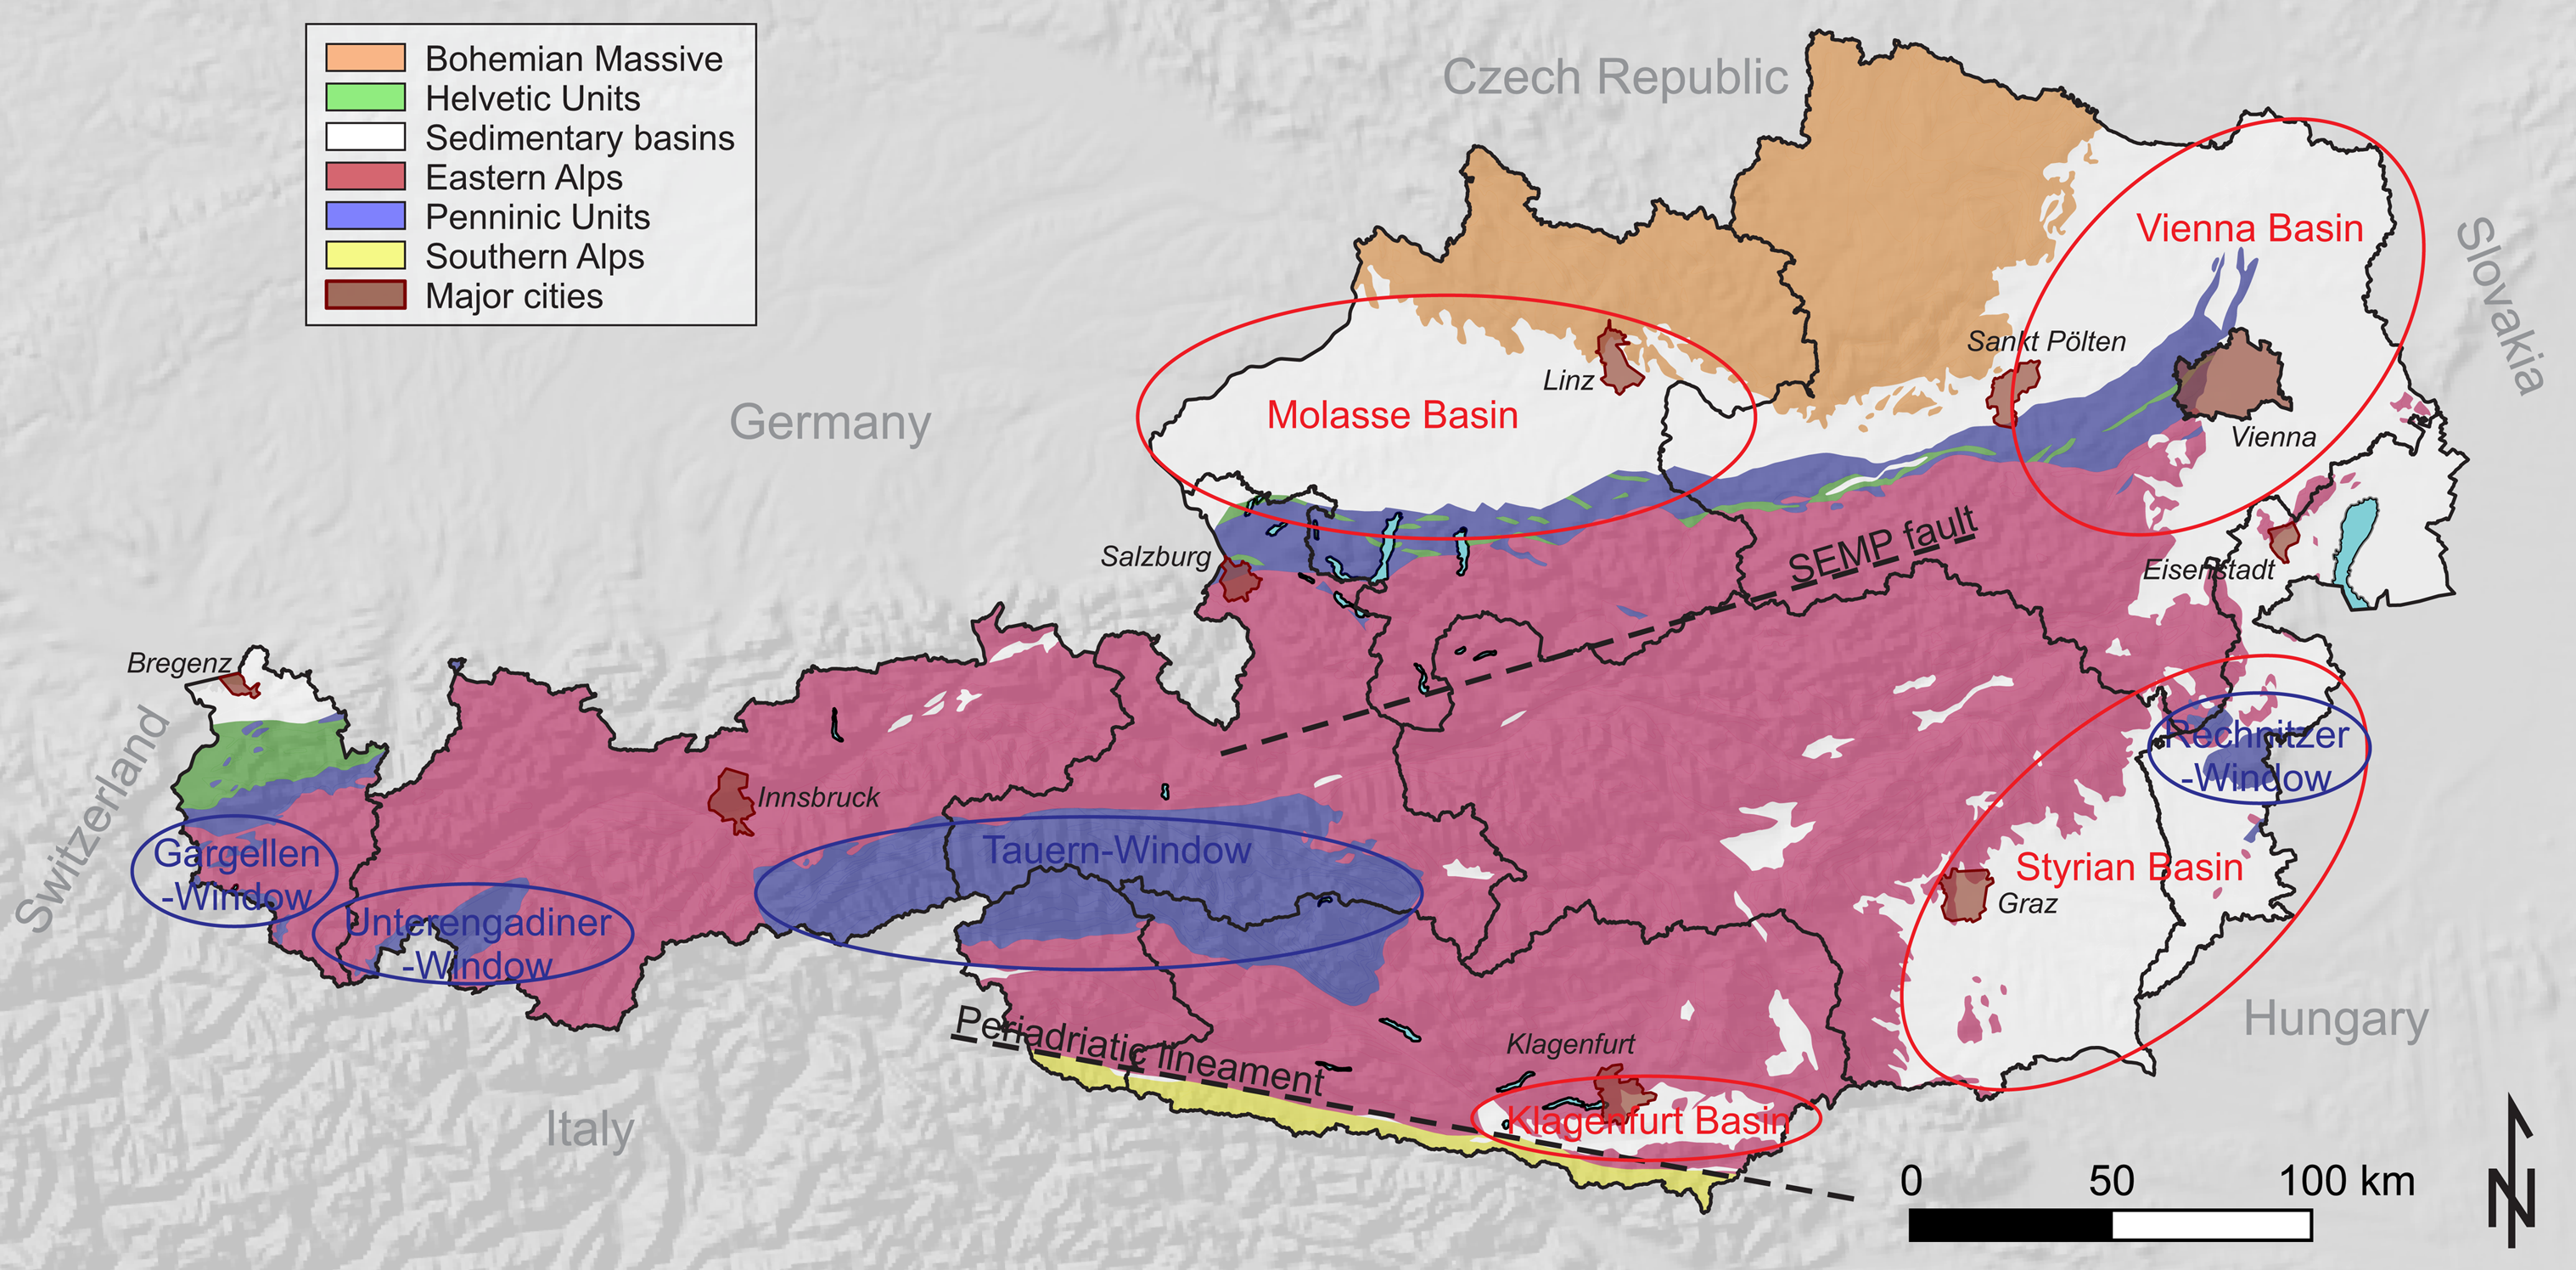
7Figure 1. Map of the predominant geological structures in Austria. The main tectonic units, dominated by the mountain range of the Eastern Alps, are surrounded by different sedimentary basins. Hydrocarbon reservoirs are present in the Molasse and the Vienna Basins (Fig. 2).
8Along the northern side of the Calcareous Alps two main units (both mainly Cretaceous to Cenozoic deposits) are cropping out: the tectonically deeper Helvetic units, which represent European continental shelf deposits and the tectonically higher flysch nappes - Penninic deep water sediments (Wessely, 2006).
9Cenozoic sedimentary basins are predominant alongside the main chain of the Alps to the North and East (Fig. 1). The largest basin, the Molasse Basin with its several kilometres thick Cenozoic marine to freshwater deposits, represents one of the country´s main hydrocarbon reservoir systems. It was formed by flexural bending of the European craton plate underneath the advancing Alpine orogenic wedge to the south (Prey, 1980). The Eocene to Miocene Molasse sediments overly the Jurassic – Cretaceous deposits of the European shelf which rest on top of the southwards subsiding crystalline basement namely the Bohemian Massif that crops out further to the north (Rupp, 2011).
10The second largest sedimentary basin is the Vienna Basin which is bordered by the Eastern Alps to the West, the Carpathians to the Northeast and the Pannonian Basin to the East. It is influenced by the evolution of both of these orogenies and the formation of the Pannonian region. The basin evolution is characterized by the early Miocene piggy-back stage and the Middle to Late Miocene pull-apart stage at the sinistral Vienna Basin Transfer Fault (Seifert, 1992; Peresson & Decker, 1997). The sinistral strike-slip “Leopoldsdorf Fault”, with an overall vertical displacement of 4 km, separates the deeply subsided and hydrocarbon-rich north-eastern part of the basin from the more shallow south-western part (Wessely, 2006).
11The Styrian Basin is the third largest of the Cenozoic basins and is characterized by Miocene – Pleistocene volcanic activity. Eastward directed extension at the end of the Alpine orogeny was essential for the formation of the Styrian basin. These extensional tectonics are related to the lateral escape of the eastern Central Alps along major strike-slip fault zones to the east into the Pannonian region (Ebner & Sachsenhofer 1991). Although there was extensive exploration for hydrocarbons in the Styrian Basin, no profitable reservoirs were found. As a side product of this exploration, the area was proven to have a geothermal potential.
3. Potential reservoirs for CO2 geological storage
12Potential reservoirs for CO2 storage in Austria are known from former and ongoing exploitation of oil and gas fields. The fact that they contained crude oil or natural gas is a good indication for the leak tightness of the seal. Abandoned wells, however, pose additional risk as they may lead to leakage due to inappropriate abandonment practices. Other types of reservoirs, such as aquifers, have not yet been identified, but it is possible that storage capacity is available. Seven candidate reservoirs for CO2 storage were identified by Scharf & Clemens (2006), all located in the Cenozoic sedimentary basins in Upper and Lower Austria, and are commonly identified as the Schönkirchen Tief, Höflein, Schönkirchen Übertief, Reyersdorfer Dolomite, Aderklaa, Atzbach-Schwanenstadt and Voitsdorf (Fig. 2). The summary below is based on Scharf & Clemens (2006).
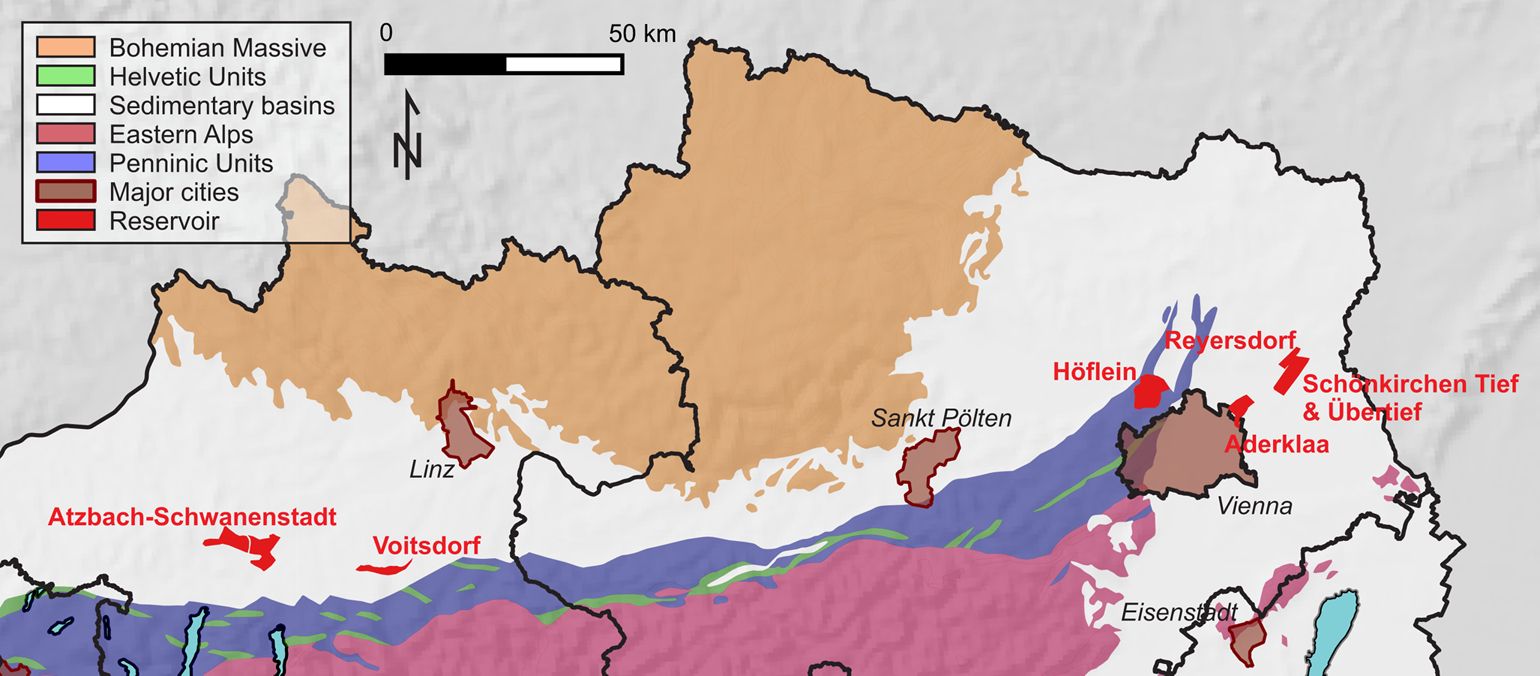
13Figure 2. Location of the 7 hydrocarbon reservoirs (in red), considered by Sharf & Clemens (2006) for CO2 storage, and used in this study. Reservoir contours are drawn after Brix & Schultz (1993).
14The Schönkirchen Tief is a producing oil field, situated in the Vienna Basin in Lower Austria and operated by the Österreichische Mineralölverwaltung (OMV). Situated at 2800 m depth, this dolomite reservoir was first discovered in 1960 with an initial oil content estimated at 20 Mm³. The Schönkirchen Tief is actually part of a hydrodynamic unit consisting of three connected reservoirs (Schönkirchen Tief, Schönkirchen Tief Gas and Prottes Tief). Because of the reservoir condition, structure and high permeability, this reservoir is probably a good candidate for CO2 storage. As the reservoir is exploited using relatively few wells, the risk of leakage along wells is lower. Scharf & Clemens (2006) estimated the total capacity of the Schönkirchen Tief reservoir at 17 MtCO2.
15The Höflein reservoir in Lower Austria is operated by OMV. It is the second largest active gas reservoir in Austria, with an initial gas-in-place of 10 billion m³. It is a geological complex with multiple structural units at a depth of 2700 m. Two-thirds of the gas is contained in dolomitic and quartzitic arenite, the rest in heterogeneous layers. This reservoir could be suitable for CO2 storage because of its large thickness and the homogeneity of the major part of the reservoir. The overlying layers, composed of pelitic sediments and tight limestones and marls, act as a seal. The initial gas in place contained 16% of CO2. The geochemistry of the reservoir and the sealing layer is already in equilibrium with this relatively high concentration of CO2, and the probability that the injection of CO2 will cause major alterations and eventually deterioration of the sealing properties of the overlying layer is low.
16The Schönkirchen Übertief in Lower Austria is also operated by OMV. It is the largest sour gas reservoir in Austria, with an initial gas in place of 18 billion m³ and a 13% CO2 content. This 5500 m deep reservoir has a thickness of 900 m, and consists of fractured dolomite with a 6.5% porosity, and plattenkalk with a 2% porosity. Overall average permeability is 7 mD. CO2 storage capacity is estimated to be 22 Mt (Scharf & Clemens, 2006). Gas production is planned until 2019. This potential reservoir could be an ideal candidate for CO2 storage because the effect of CO2 on the reservoir and cap rock is known, there are no known connections to other aquifers, and all wells have been properly completed.
17The Reyersdorf Dolomite in Lower Austria and operated by OMV, is a partly abandoned reservoir at a depth of ca. 2000 m, with an oil rim and a big sour gas cap. This gas cap is still produced from one well. The end of gas production is expected by 2019.
18The Aderklaa reservoir in Lower Austria and operated by OMV, is an abandoned gas reservoir with an initial gas in place of 4 billion m³. This Triassic dolomite reservoir has an average thickness of 100 m and an average porosity of 7.7%.
19The Atzbach-Schwanenstadt reservoir in Upper Austria and operated by Rohöl-Aufsuchungs AG (RAG), consists of several gas-bearing formations, with an initial gas in place of 4.4 billion m³. The net thickness is 9 m with an average permeability of 25 mD, at a depth of up to 1600 m. The estimated storage capacity by Scharf & Clemens (2006) is 13 MtCO2. Polak & Grimstad (2009) estimated the total storage capacity at 14.5 MtCO2, based on the produced amount of natural gas.
20The Voitsdorf oil field in Upper Austria and operated by RAG, consists of an Eocene and a Cenomanian reservoir, with depths around 1600 m. This potential reservoir is not connected to an aquifer. Storage capacity of both parts combined is 6 MtCO2 (Scharf & Clemens, 2006).
21All of the suitable considered reservoirs are situated in the proximity of industrialized areas. The total theoretical capacity is estimated at 465 MtCO2 by Scharf & Clemens (2006). Some of the fields could become accessible for CO2 storage within a short period of time, due to their projected end of production. There might also be possibilities to apply CO2-enhanced oil or gas recovery (EOR/EGR) to active reservoirs. This option is, however, not taken into account in the current study.
22Storage in deep saline aquifers may be feasible, but identification of potential storage locations is not possible based on current geological knowledge and legal constraints. These are therefore excluded from the current evaluation. Storage schemes associated with salt deposits have also been proposed (IPCC, 2005), but neither salt domes nor mined cavities in Austria are considered suitable because the salt deposits do not have an appropriate extension and/or are not stable (Sharf & Clemens, 2006).
4. Methodology
23To assess the potential of a reservoir to be used in a CCS project, both the available capacity and its economic viability as part of the integrated CCS project should be assessed. Bachu et al. (2007) developed a potential CO2 reservoir ranking based on the exploration and knowledge level which is currently being used in many assessments of CO2 storage capacity (e.g. Vangkilde-Pedersen et al., 2009; Halland et al., 2014). The ranking uses four categories: theoretical, effective, practical and matched. General assessments of reservoirs based on little data are classified as theoretical capacity. Using geological exploration data and applying general practical and economic thresholds, first an effective and then a practical capacity, or available capacity, can be estimated. The matched capacity is the fraction of the practical capacity that will actually be used for storage. Assessing the practical capacity generally requires large investments in exploration, while the matched capacity will only be known at the time of operation. From this concept, one would expect the theoretical capacity to be the largest number, and the matched capacity the smallest. Our results however show that the average matched capacity numbers can be larger than the average practical capacity numbers, which seems contradictory. Further clarification will be provided in the discussion of the results.
24A methodology for CO2 storage reservoir assessment, that uses the classification principle by Bachu et al. (2007), was presented in a previous study (Welkenhuysen et al., 2013) and applied to reservoirs in Belgium. This methodology was specifically developed for the assessment of reservoirs with a large variety in uncertainty ranges, and it enables making a realistic assessment of the practical and matched capacity of these reservoirs. It is based on the geo-economic evaluation of potential reservoirs with a calculation scheme called “PSS Explorer”, and a source-sink matching by a geo-techno-economic simulator called “PSS III”. A brief overview of the methodology and how it is applied in this paper is given hereafter.
25Input data on potential reservoir systems are not provided in the classical form of reservoir parameters such as porosity and permeability. Instead, experts with good knowledge on CO2 storage in general and more specific on the reservoirs in question are asked to provide their judgements. These experts first have to decide individually if they have sufficient knowledge to make such judgements on the individual reservoirs. The reservoir concept is reduced to only the three most basic characteristics: total capacity, injectivity (yearly capacity) and probability of reservoir failure (reservoir fundamentally unsuited for storage of CO2 because of for example fractures in seal). The experts are asked to provide their judgements for a fixed set of potential reservoirs under the form of probability density functions (PDF) for capacity and injectivity, and a percentage for the probability on reservoir failure. Further details of this methodology are explained in Welkenhuysen et al. (2013).
26The rationale behind using expert judgements instead of traditional data is that they provide data that includes the whole geo-technical uncertainty range, which is necessary for the further economic assessments. Concrete data for CO2 storage is in many cases not available, and most information is confidential and in hands of hydrocarbon companies. The validity and problems using expert input are discussed in Welkenhuysen et al. (2013). A number of Austrian experts were selected and approached, based on their knowledge and experience with Austrian geology, reservoir engineering, CO2 storage and their knowledge of the individual reservoirs. Three experts were willing to provide estimates for the selected reservoirs. In Figure 9 all expert input data are shown. As all potential reservoirs that are considered here are or were active hydrocarbon reservoirs, and are therefore sufficiently explored, the expert capacity assessments are considered to be at the effective capacity level. All experts are Austrian geoscientists with experience in reservoir geology and have a good knowledge of the reservoirs they chose to evaluate. It was agreed that their input would be anonymous.
27Experts do not necessarily agree on the reservoir properties. It is therefore very important to follow the methodology for gathering expert input as described in Welkenhuysen et al. (2013). Experts have to be addresses individually, because it is shown that a consensus following discussion does not, in contrast to general belief, necessarily provide a more accurate or reliable view (Morgan & Keith, 2008). As an expert, a person probably has his reasons to have a different opinion. When compiling the expert input, all experts were given equal weight (i.e. the opinions of all experts are equally credible). When experts do not agree regarding the probabilistic distribution, this will result in bi-(or more)-modal distributions. For the failure probability (single number input), the average of all experts is taken. This average equals the result of a random sampling of their individual input, if all experts are given equal weight. The outcome of this methodology reflects the true uncertainties of the state of knowledge on these reservoirs.
28To assess the practical reservoir capacity, the practical and economic viability of reservoir development is calculated with the geo-economic PSS Explorer calculation scheme. The expert judgements serve as input for a Monte Carlo analysis of an economic decision scheme for reservoir exploration and development. The result is a set of probability density functions (PDF) of each reservoir for total capacity and injectivity in function of the price a potential capture facility is willing to pay for storage (storage budget) varying between 1 and 30 €/tCO2, which is the expected range of storage costs (ZEP, 2011). The result of this PSS Explorer calculation is the practical capacity assessment. The average practical capacity that is given in the results section is generally the capacity function at 15 €/tCO2, because at this relatively high price point all reservoirs are considered to be explored for CO2 storage.
29The probability density functions for reservoir capacity and injectivity are direct input parameters for the PSS III simulator. PSS III is a bottom-up techno-economic simulator for source-sink matching in a sector-wide economy (energy or other). Investment decisions are taken based on risk and return of individual projects that can use conventional, CCS or renewable production technology. A CCS project consists of a production facility with CO2 capture, pipeline transport and final storage in a geological reservoir. Technological (e.g. capture costs and performance), economic (e.g. CO2 emission price) and geological (e.g. reservoir capacity) uncertainty is handled with stochastic parameters in a nested Monte Carlo approach for limited foresight. Because the value of the stochastic parameters changes in every Monte Carlo iteration, the resulting investment decisions and their consequences change as well. In practice, a yearly evaluation of the balance between production and demand is made for a certain sector in a certain region or country. In case additional production is needed, because of an increase of demand or the shut-down of existing facilities, the available investment options are evaluated and a realistic investment decision is taken based on two main economic principles: Real Options Analysis (Dixit & Pindyck, 1994) and Optimal Portfolio Theory (Markowitz, 1987).
30The results provide an indication of the chance that a reservoir will be developed in the future (development probability), and an assessment of the exploited storage capacity when the reservoir is used in CCS projects (total and yearly matched capacity) for the chosen timeframe. Not every reservoir will be used for storage in every Monte Carlo iteration. The matched capacity is therefore described by two parameters: the development probability, and the probability distribution of (non-zero) matched capacities, i.e. the capacity that is used in case a project is activated.
5. Techno-economic scenario constraints
31The European Union (EU-15) has committed to reduce its GHG emissions by 8% in the 2008-2012 period in comparison to the reference year (1990 generally and also for Austria) under the UNFCCC Kyoto protocol (European Council, 1993). After the Kyoto protocol came into effect in 2005, Austria committed to a target of 13% reduction (UNFCCC, 2006). Furthermore, a European effort-sharing concept deals with a reduction of GHG emissions of 20% by 2020 (in comparison with 1990 emissions) or a reduction of 16% for Austria (European Parliament, 2009). However, reported emissions for 2012 have shown an increase of about 2.5% of GHG emissions compared to 1990 (Umweltbundesamt Österreich, 2014a). In 1990, Austria’s GHG emissions were 78 MtCO2 equivalent (CO2e); in 2012 they were over 80 MtCO2e (Fig. 3), excluding land use, land use change and forestry (LULUCF). CO2 is the main GHG with an 85% share in 2012, of which 99% comes from the combustion of fossil fuels. These emission numbers indicate that additional measures are necessary to reach climate goals.
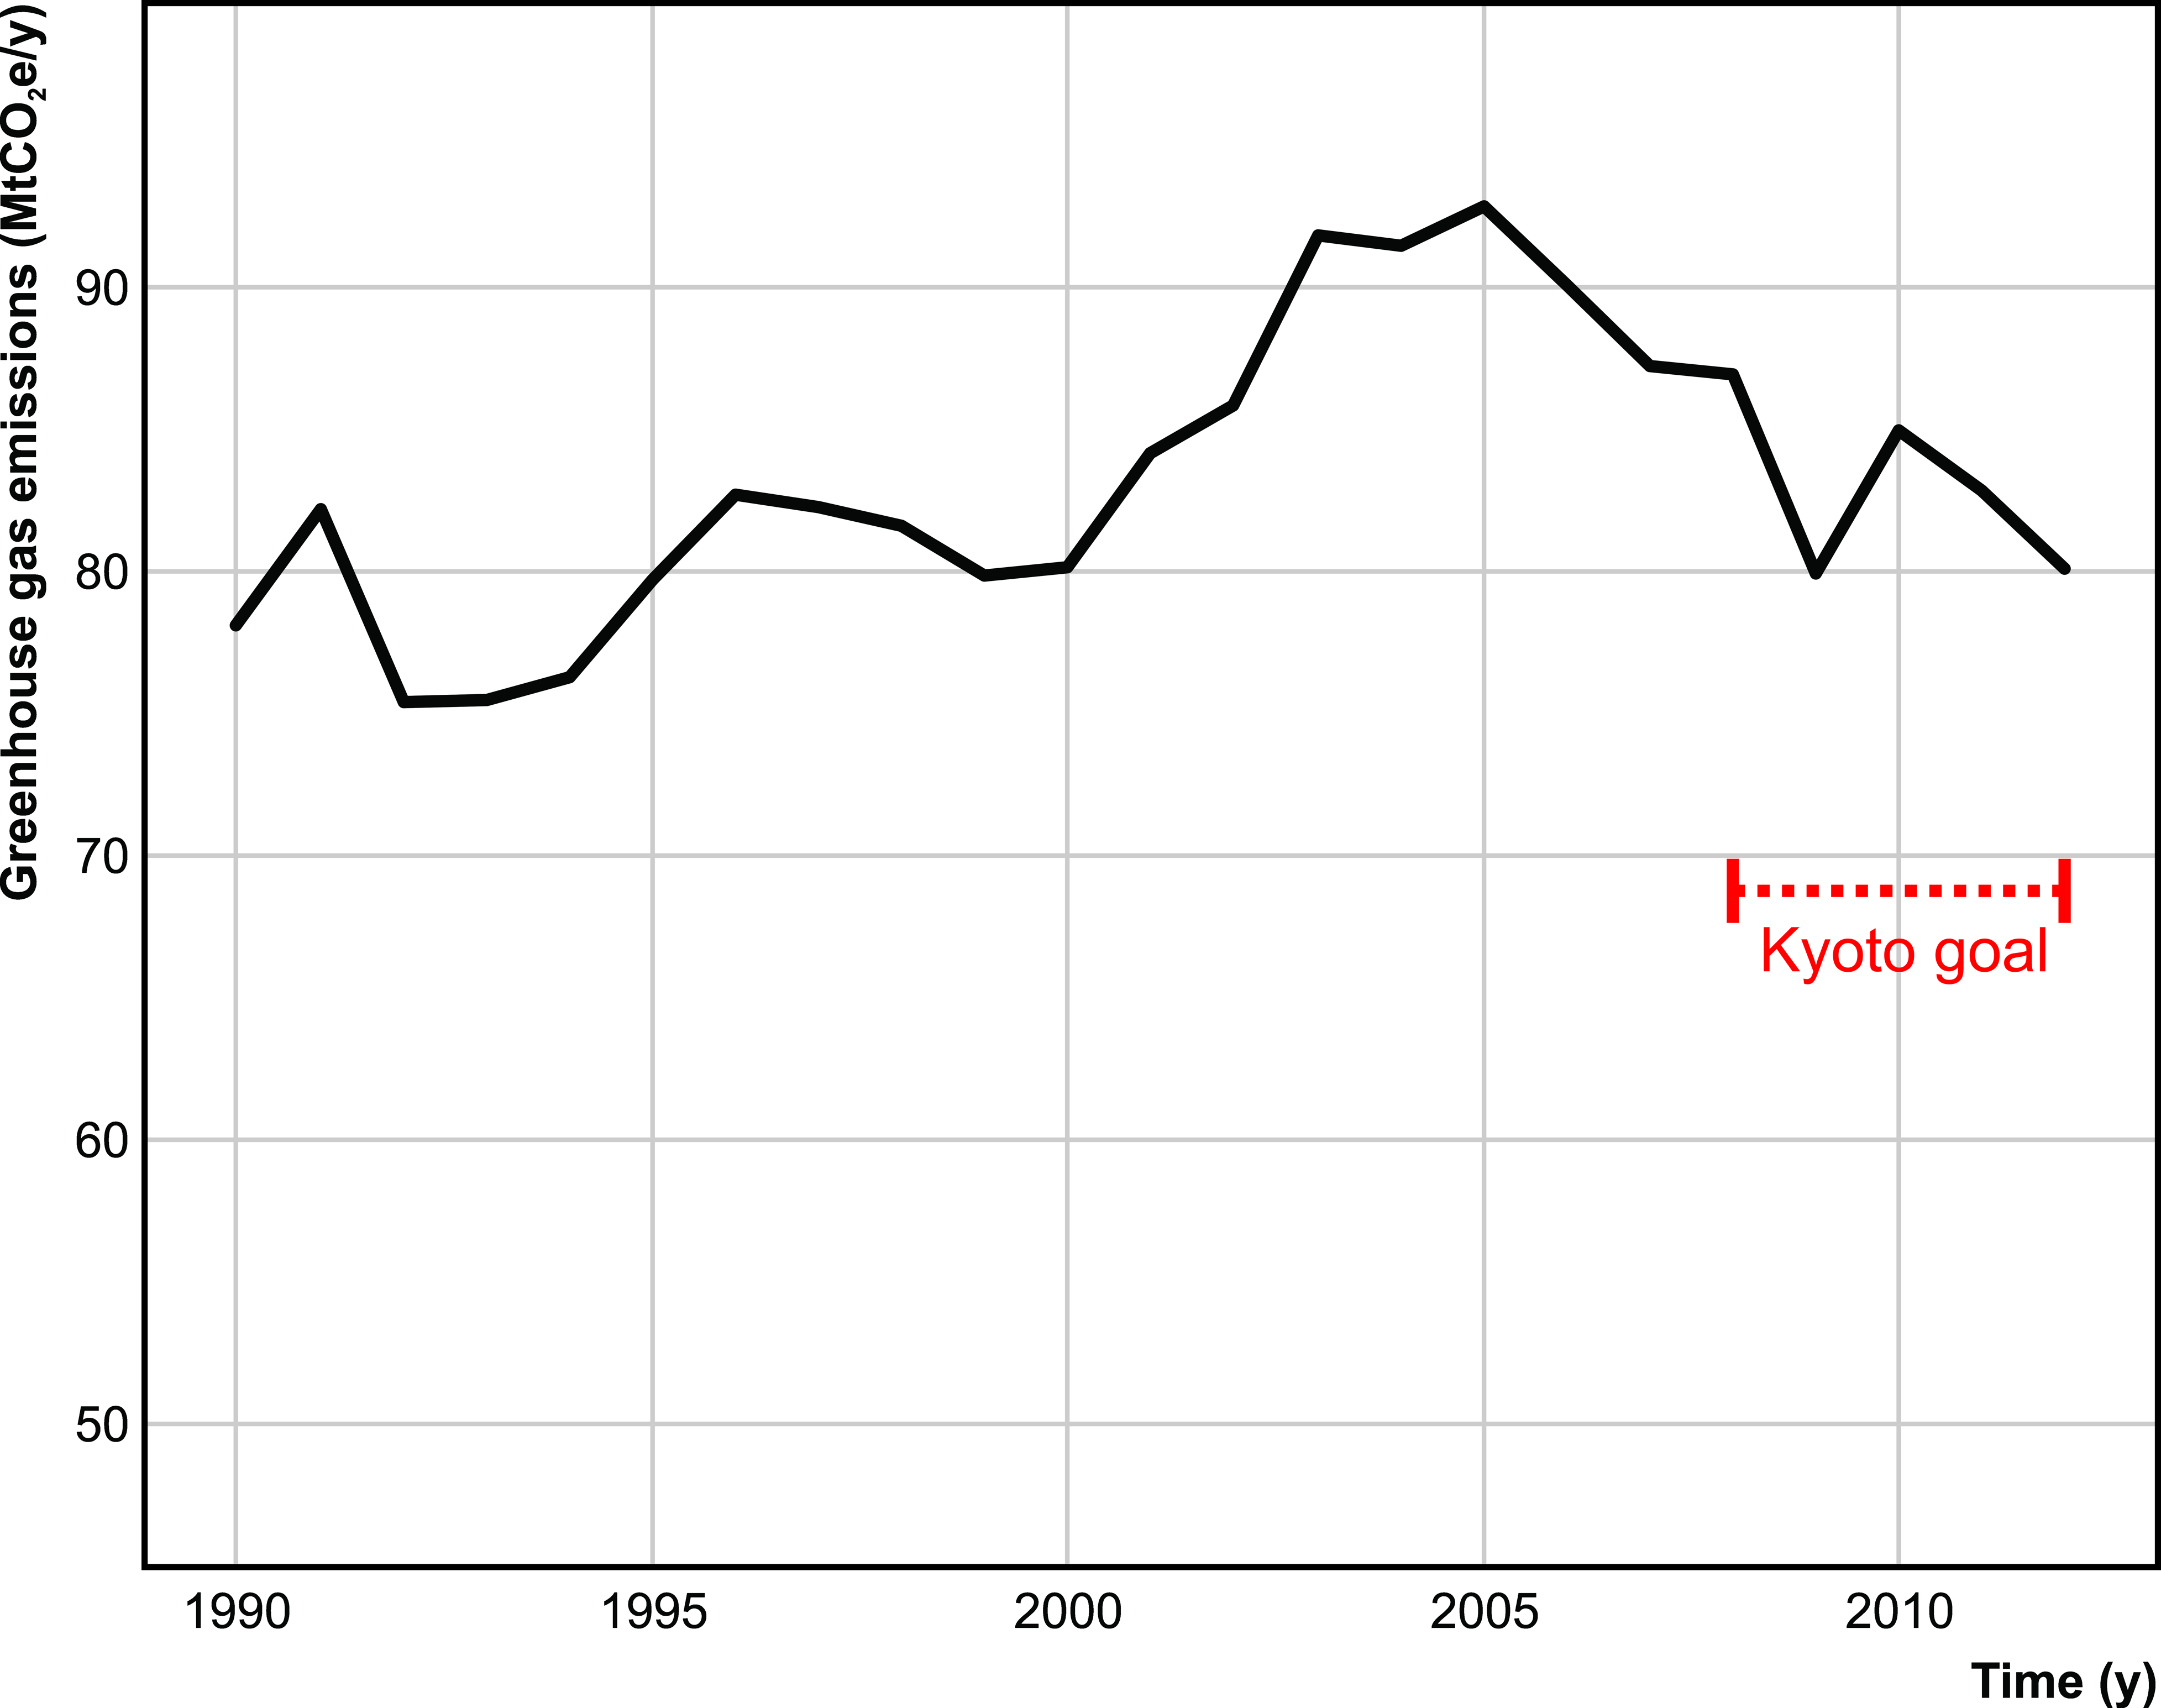
32Figure 3. Austrian greenhouse gas emissions since 1990, the Kyoto Protocol reference year. Despite a decrease since 2005, emissions show an increase of 2.5%, opposed to a Kyoto goal of a 13% reduction (Umweltbundesamt Österreich, 2014a).
33According to the IEA (2014), CCS is expected to contribute 14% to the EU CO2 emission reduction in 2050 to have at least a 50% chance to limit global warming to 2 °C (2DS target) in the most cost-effective manner, compared to the 6DS scenario (continuation of current trends and policies). Public opinion in Austria is in general negative towards geological storage of CO2, and CCS does not form part of Austria’s current climate policy or future strategy. In fact, industrial scale geological storage of CO2 is forbidden until at least 2018, when its status will be re-evaluated (Umweltbundesamt Österreich, 2014b). The main arguments against storage are the level of technology maturity and the possible risks related to storage.
34Two of the main CO2 emitting sectors in Austria, electricity and iron & steel production, were simulated. Emissions from electricity (6.2 MtCO2/y) and iron & steel (11.3 MtCO2/y) production amount to 26% of the total CO2 emissions of Austria (68 MtCO2/y, including industry, domestic and transport, excluding land use, land use change and forestry; reporting year 2012) (E-PRTR, 2015; Umweltbundesamt Österreich, 2014a). Simulations are performed starting in 2013 (actual year of simulation) until 2050, which is considered to be the period of commercial introduction of CCS technology.
35Simulations in PSS III are made in a framework that defines certain boundaries, called scenarios. The main scenario parameters are the CO2 emission price (i.e. the cost for emitting one tonne of CO2 into the atmosphere, the European Emission Allowance price equivalent under the Emission Trading System, EU ETS), sectoral demand and fuel prices. The scenario that was used for the current simulations considers a long-term economic growth and a renewed interest in climate mitigation policy. Considering historical data of the past decade, a long-term 1% demand increase for electricity is used (Statistics Austria, 2009). The same 1% growth is assumed for the iron & steel sector activity, as a result of general economic growth. We assume that a clear climate policy will result in a rising CO2 emission price, with at first a gradual rise; a faster rise once all mechanisms are implemented, and a stabilisation at 100 €/tCO2 in 2050 (Fig. 4, Table 1). This is a scenario which corresponds well with the projections of the European Commission (2013). Next to the large database of production technologies already available in PSS II (Piessens et al., 2012), technologies for the use of renewable sources of energy for the power sector have been added. Cost and performance data on wind, photovoltaic solar, concentrated solar and small-to-medium hydroelectricity production was gathered from the IEA-ETSAP network report (IEA-ETSAP, 2013).
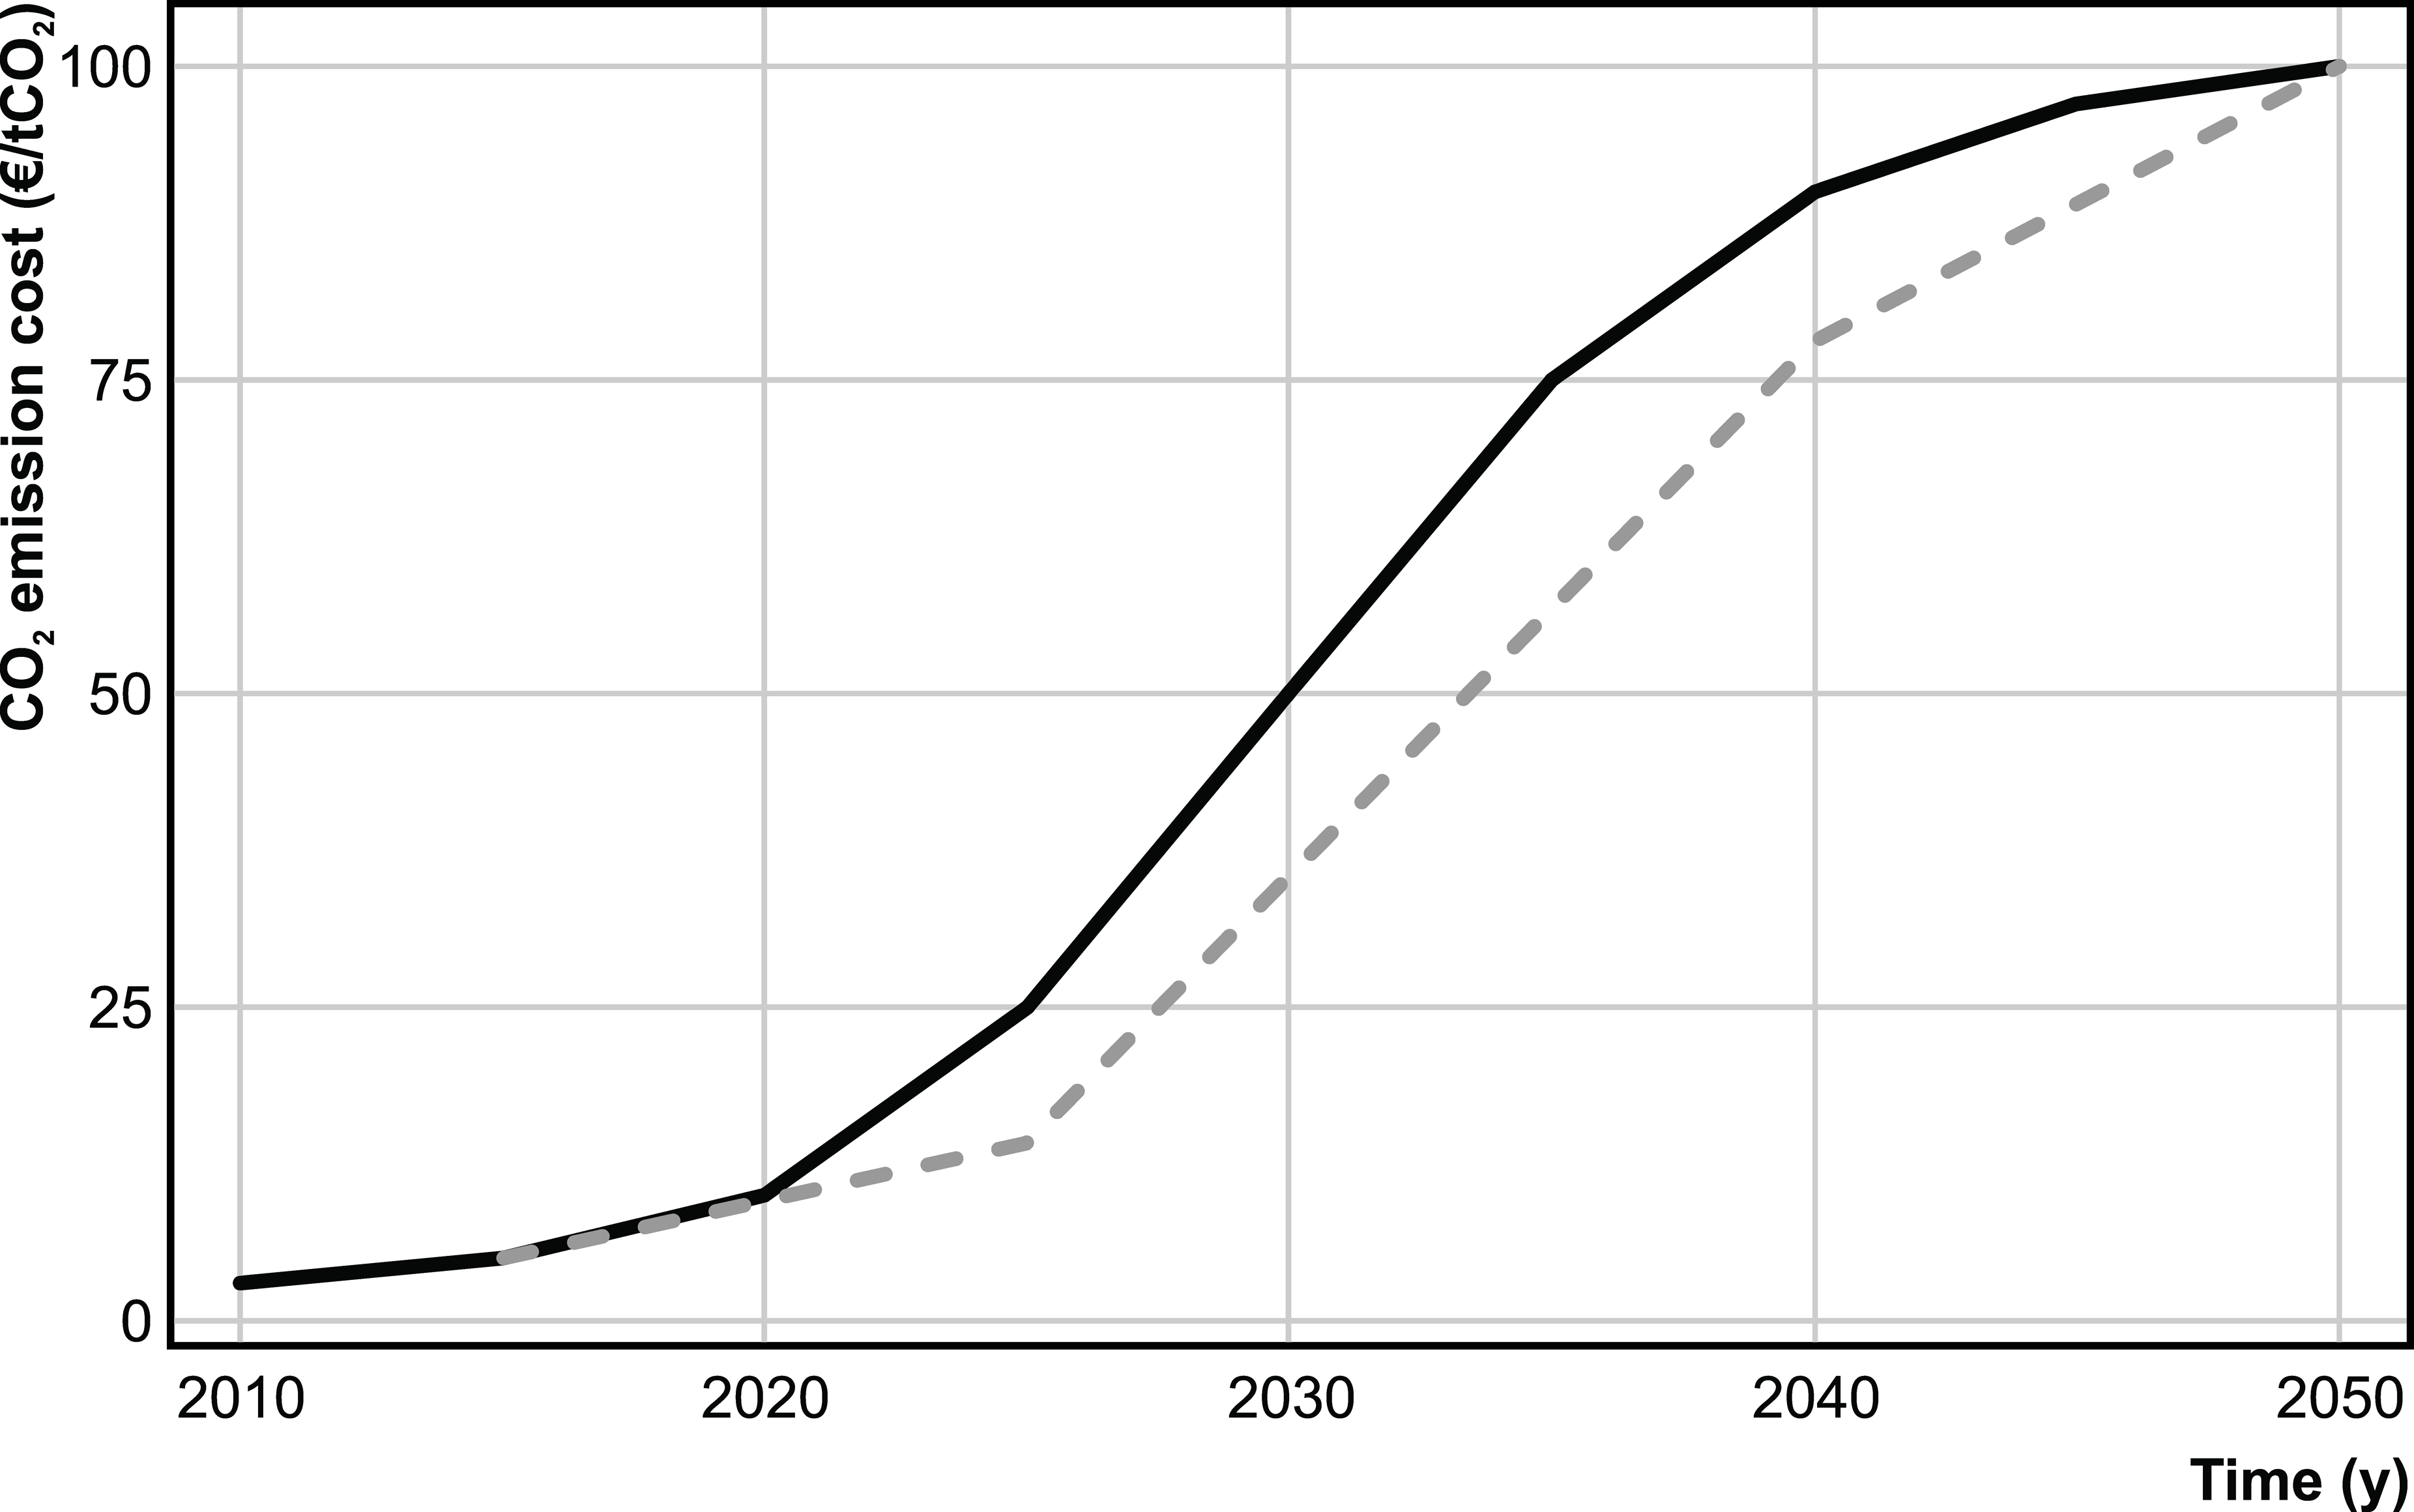
36Figure 4. CO2 price scenario used for the PSS III simulations (black line). This scenario aligns well with predictions used by the European Commission (2013) (dashed grey line).
|
Time (y) |
Solar (GWh) |
Hydro (GWh) |
Wind (GWh) |
Biomass (GWh) |
Demand Power (GWh) |
Demand Iron & Steel (kt) |
CO2 price (€/tCO2) |
|
2010 |
10000 |
7000 |
6000 |
6000 |
65656 |
7272 |
3 |
|
2015 |
5 |
||||||
|
2020 |
10000 |
7000 |
6000 |
6000 |
72386 |
8025 |
10 |
|
2025 |
25 |
||||||
|
2030 |
79806 |
8847 |
50 |
||||
|
2035 |
75 |
||||||
|
2040 |
87986 |
9754 |
90 |
||||
|
2045 |
97 |
||||||
|
2050 |
20000 |
14000 |
12000 |
12000 |
97004 |
10754 |
100 |
37Table 1. Most important scenario data used for the PSS III simulations. From left to right: the upper limits of renewable energy production for solar, hydro, wind and biomass power production; the country-wide demand for electrical power and iron & steel; and the CO2 emission cost. Blank spaces are interpolated by PSS III.
38It was assumed that the existing (large) hydroelectric dams are not decommissioned within the simulation timeframe. Because of physical and economic restrictions to the installation of renewable energy production, an upper limit was imposed on biomass, solar, hydro and wind electricity production, based on the maximum realisable potential for 2020, as reported by the Austrian Federal Ministry of Agriculture, Forestry, Environment and Water Management (BMLFUW, 2009). No information after 2020 is available and significant changes in technological development, economics and land use can occur over time. These upper limits were therefore increased with a factor 2 for 2050 as a rough approximation (Table 1). Although not much public information is available, it was assumed that the geological reservoirs would become available in 2020. Note that this timing is compatible with at least two of the active fields which are expected to cease operation in 2019.
6. Results and discussion
39The PSS Explorer calculation scheme carried out 50000 Monte-Carlo iterations to produce practical capacity and probability numbers. 461 Monte-Carlo iterations, which equals to about two weeks of intensive 18-thread parallel computing, were run with the PSS III simulator for the power and iron and steel sectors. The practical (PSS Explorer) and matched (PSS III simulator) capacity results are displayed in Figure 10 and Table 2. These results are presented as probability density functions. In the text, probabilistic results are given as a mean, and the 5 and 95 percentile values (P5 and P95) as given by the Monte-Carlo calculation results. The development probability is calculated as the fraction of the 461 Monte-Carlo iterations in which a reservoir is active in a CCS project.
40The results indicate that the average total practical capacity of Austria, as calculated by PSS Explorer, is 118 MtCO2 (P5: 47 Mt, P95: 215 Mt). The average matched capacity for the whole country for the calculated scenario is estimated at 39 MtCO2 (P5: 5 Mt; P95: 130 Mt). Comparing the theoretical capacity number from Scharf & Clemens (2006) of 465 MtCO2, with these numbers, they comply with the techno-economic resource-reserve classification by Bachu et al. (2007). In almost every Monte-Carlo iteration of PSS III some amount of CO2 was stored in an Austrian reservoir, for the current scenario the probability that one or more reservoirs are used for CCS in Austria between 2010 and 2050 is 97%.
41Most individual reservoir development probabilities lie between 20 and 30% and average total matched capacity numbers range between 7 and 40 MtCO2 (Table 2). The Schönkirchen Übertief appears as most favourable for development probability (31%), average total (40 MtCO2; P5: 4 Mt; P95: 150 Mt) and yearly matched capacity (2.3 MtCO2; P5: 0.4 Mt; P95: 8.8 Mt). The least favourable reservoir is the Reyersdorf dolomite, with only 5% development probability and a total matched capacity of 13 MtCO2. The Atzbach-Schwanenstadt is estimated to have the smallest matched capacity (7 MtCO2; P5: 1 Mt; P95: 18 Mt). Individual matched capacity ranges between 7 and 40 MtCO2, while the total national capacity is only 39 MtCO2. This apparent contradiction appears because not every reservoir is developed in every Monte Carlo iteration. Development probability and capacity numbers should always be considered together (e.g. 40 MtCO2 and 31% for the Schönkirchen Übertief, and 39 MtCO2 and 97% for the whole of Austria). In Figures 5 and 6 the total and yearly matched and practical capacity assessments are shown as boxplots, and compared to the theoretical capacities as stated in literature.
|
Reservoir |
Theoretical capacity from literature (Mt) |
Practical capacity total (X (P5; P95) Mt) |
Practical capacity yearly (X (P5; P95) Mt) |
Matched capacity total (X (P5; P95) Mt) |
Matched capacity yearly (X (P5; P95) Mt) |
Counts |
Development probability (%) |
|
Schönkirchen Tief |
16-17 |
20 (5; 55) |
0.8 (0.2; 1.7) |
20 (3; 62) |
1.5 (0.4; 4.6) |
112 |
24 |
|
Höflein |
18 (5; 40) |
0.7 (0.2; 1.5) |
15 (4; 34) |
1.0 (0.4; 3.4) |
121 |
26 |
|
|
Schönkirchen Übertief |
22 |
31 (7; 105) |
1.2 (0.4; 3.3) |
40 (4; 150) |
2.3 (0.4; 8.8) |
145 |
31 |
|
Reyersdorf Dolomite |
6 (1; 18) |
0.3 (0; 0.8) |
13 (1; 24) |
1.0 (0.4; 1.4) |
21 |
5 |
|
|
Aderklaa |
23 (1; 61) |
0.8 (0; 2.5) |
25 (5; 76) |
1.7 (0.4; 5.2) |
99 |
21 |
|
|
Atzbach-Schwanenstact |
13.44 |
13 (8; 15) |
0.6 (0.4; 0.7) |
7 (1; 18) |
0.8 (0.3; 1.5) |
86 |
19 |
|
Voitsdorf |
6.1 |
31 (4; 91) |
0.8 (0.2; 3) |
33 (5; 101) |
1.7 (0.4; 5.2) |
130 |
28 |
|
Austria |
465 |
118 (47; 215) |
4.3 (2; 7.6) |
39 (5; 130) |
2.5 (0.4; 9.3) |
448 |
97 |
42Table 2. Summarized PSS III simulation results for the Austrian reservoirs, and Austria as a whole. The practical capacity numbers, calculated by PSS Explorer, and the matched capacity as a result of source-sink matching by PSS III, are compared to the theoretical capacity numbers stated in literature. The development probability results from the division of the number of Monte Carlo calculations in which a certain reservoir is used, divided by the total number of calculations (461).
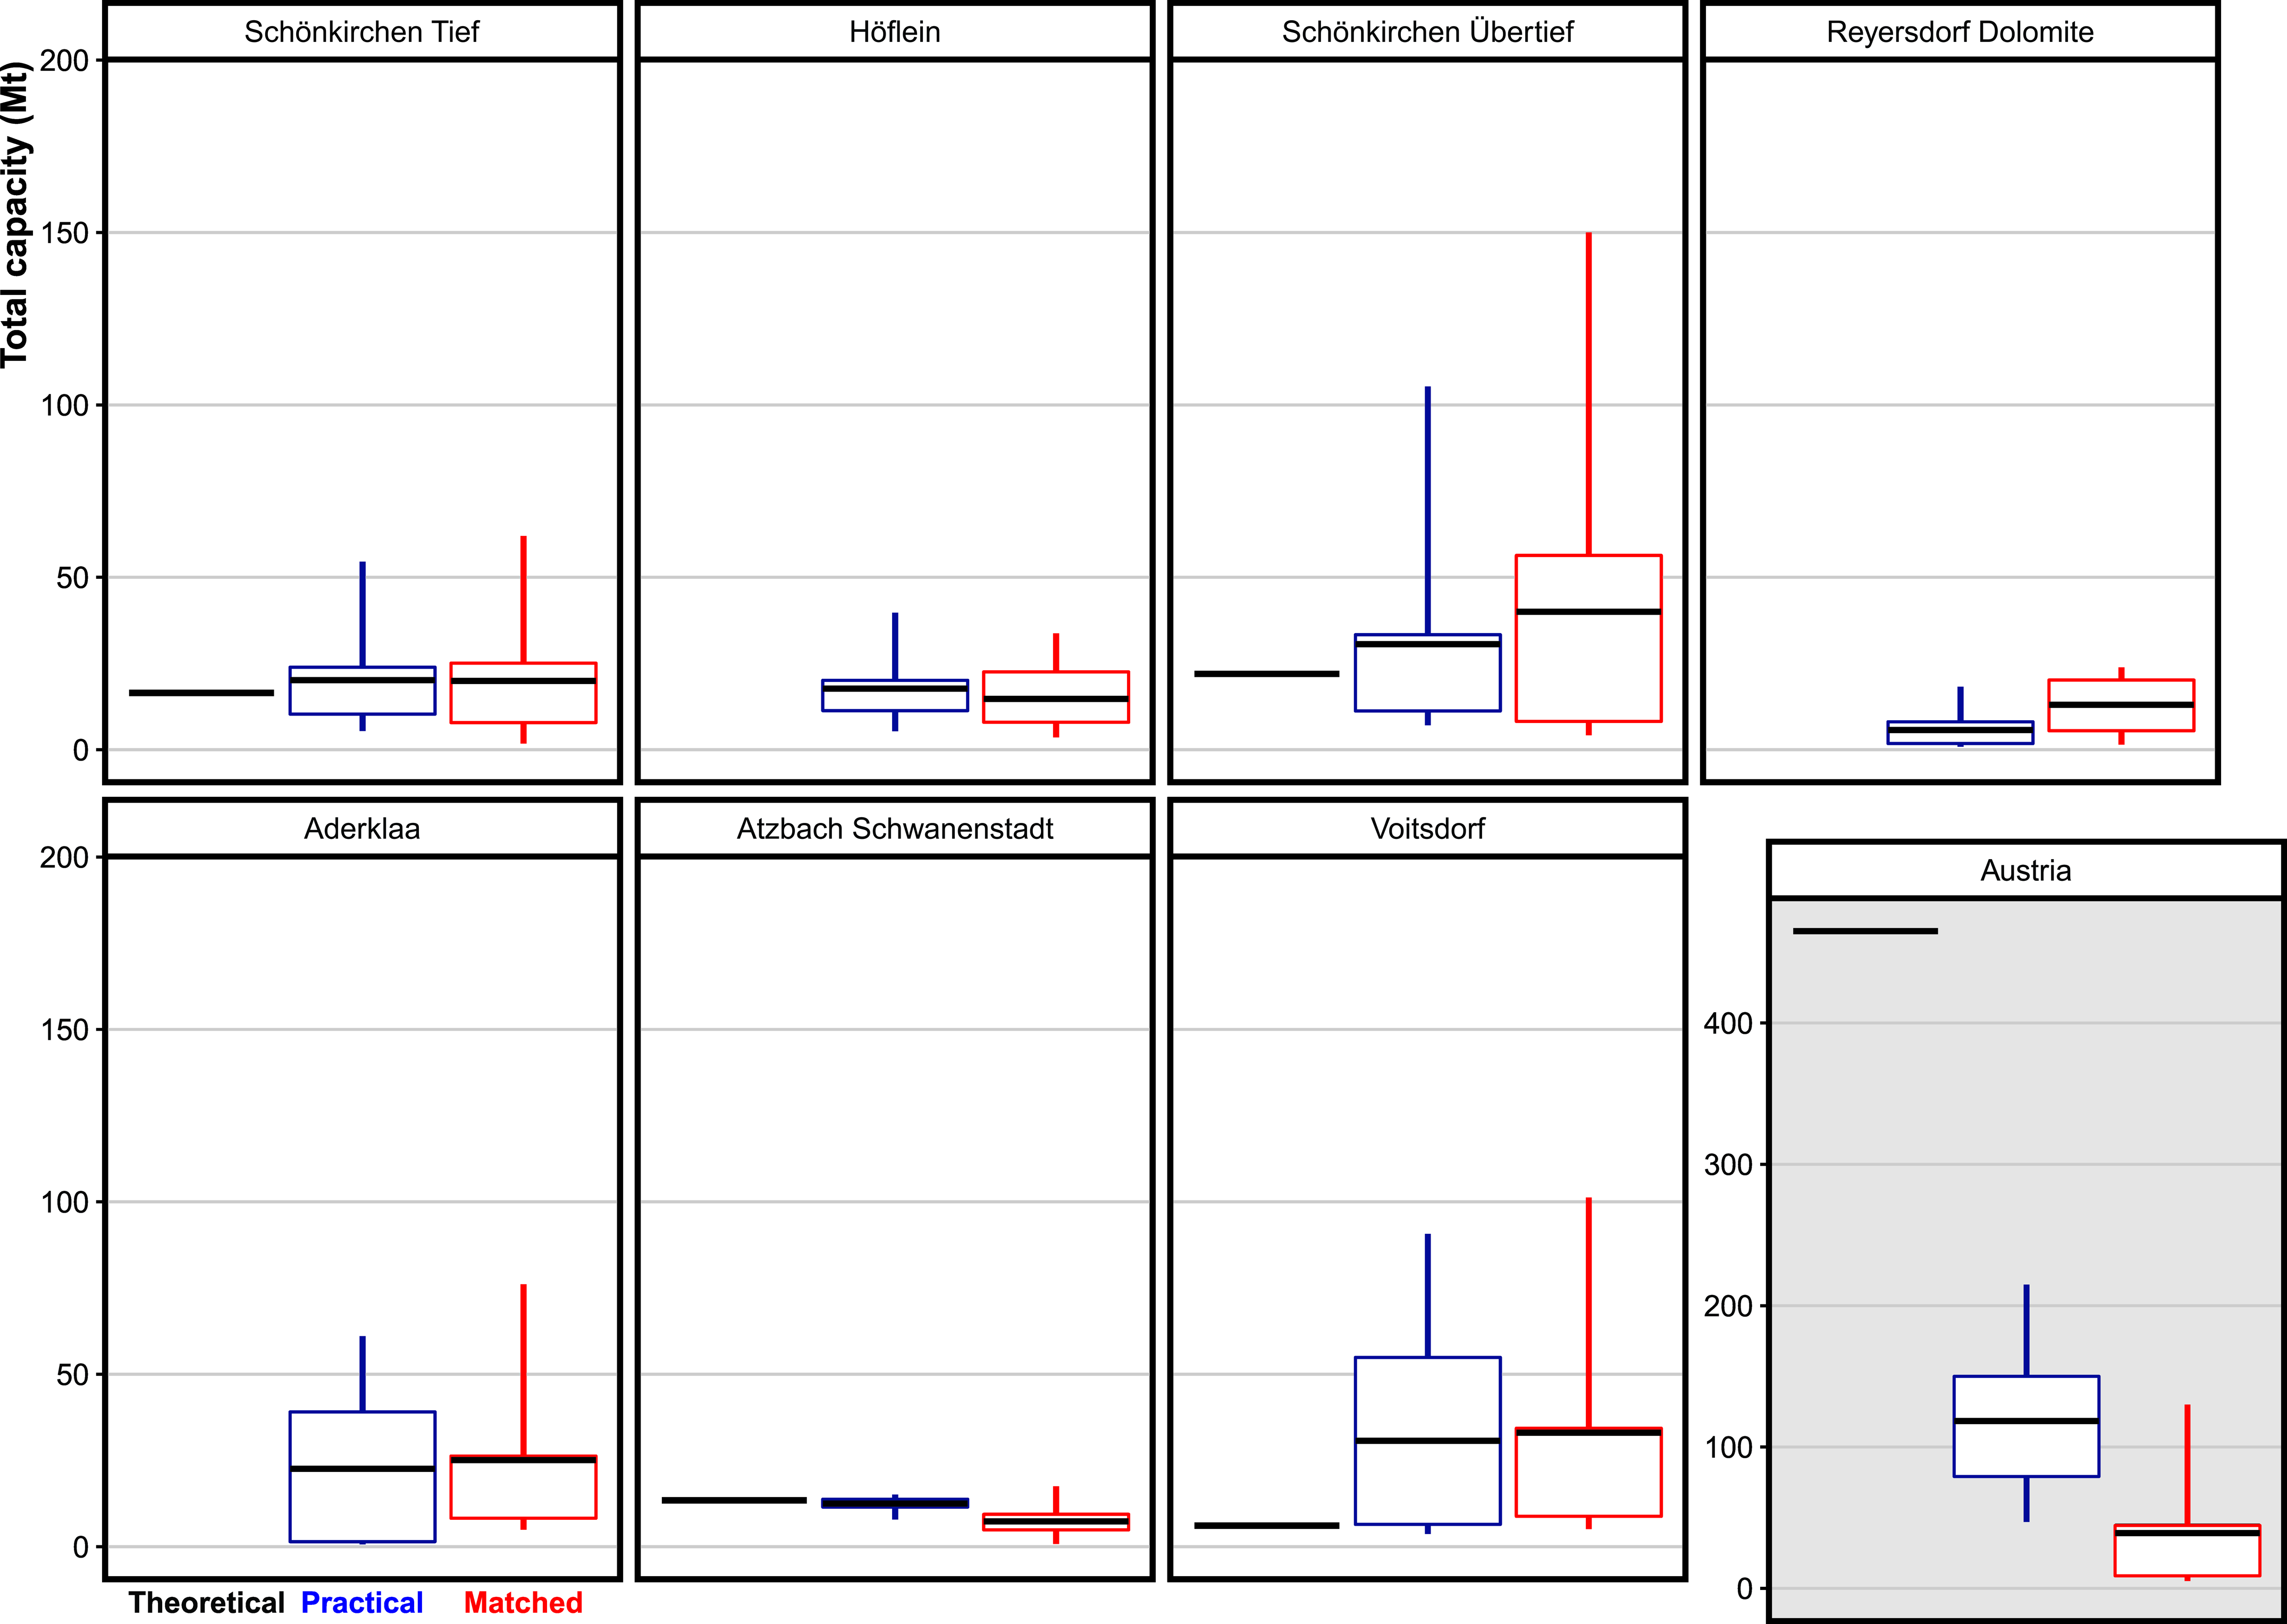
43Figure 5. Boxplots for the comparison of the total theoretical capacity from literature with the practical and matched capacity assessments from PSS III. The black line indicates the average, the box covers the 25th-75th percentile. The whiskers show the 5th-95th percentile as stated in Table 2.
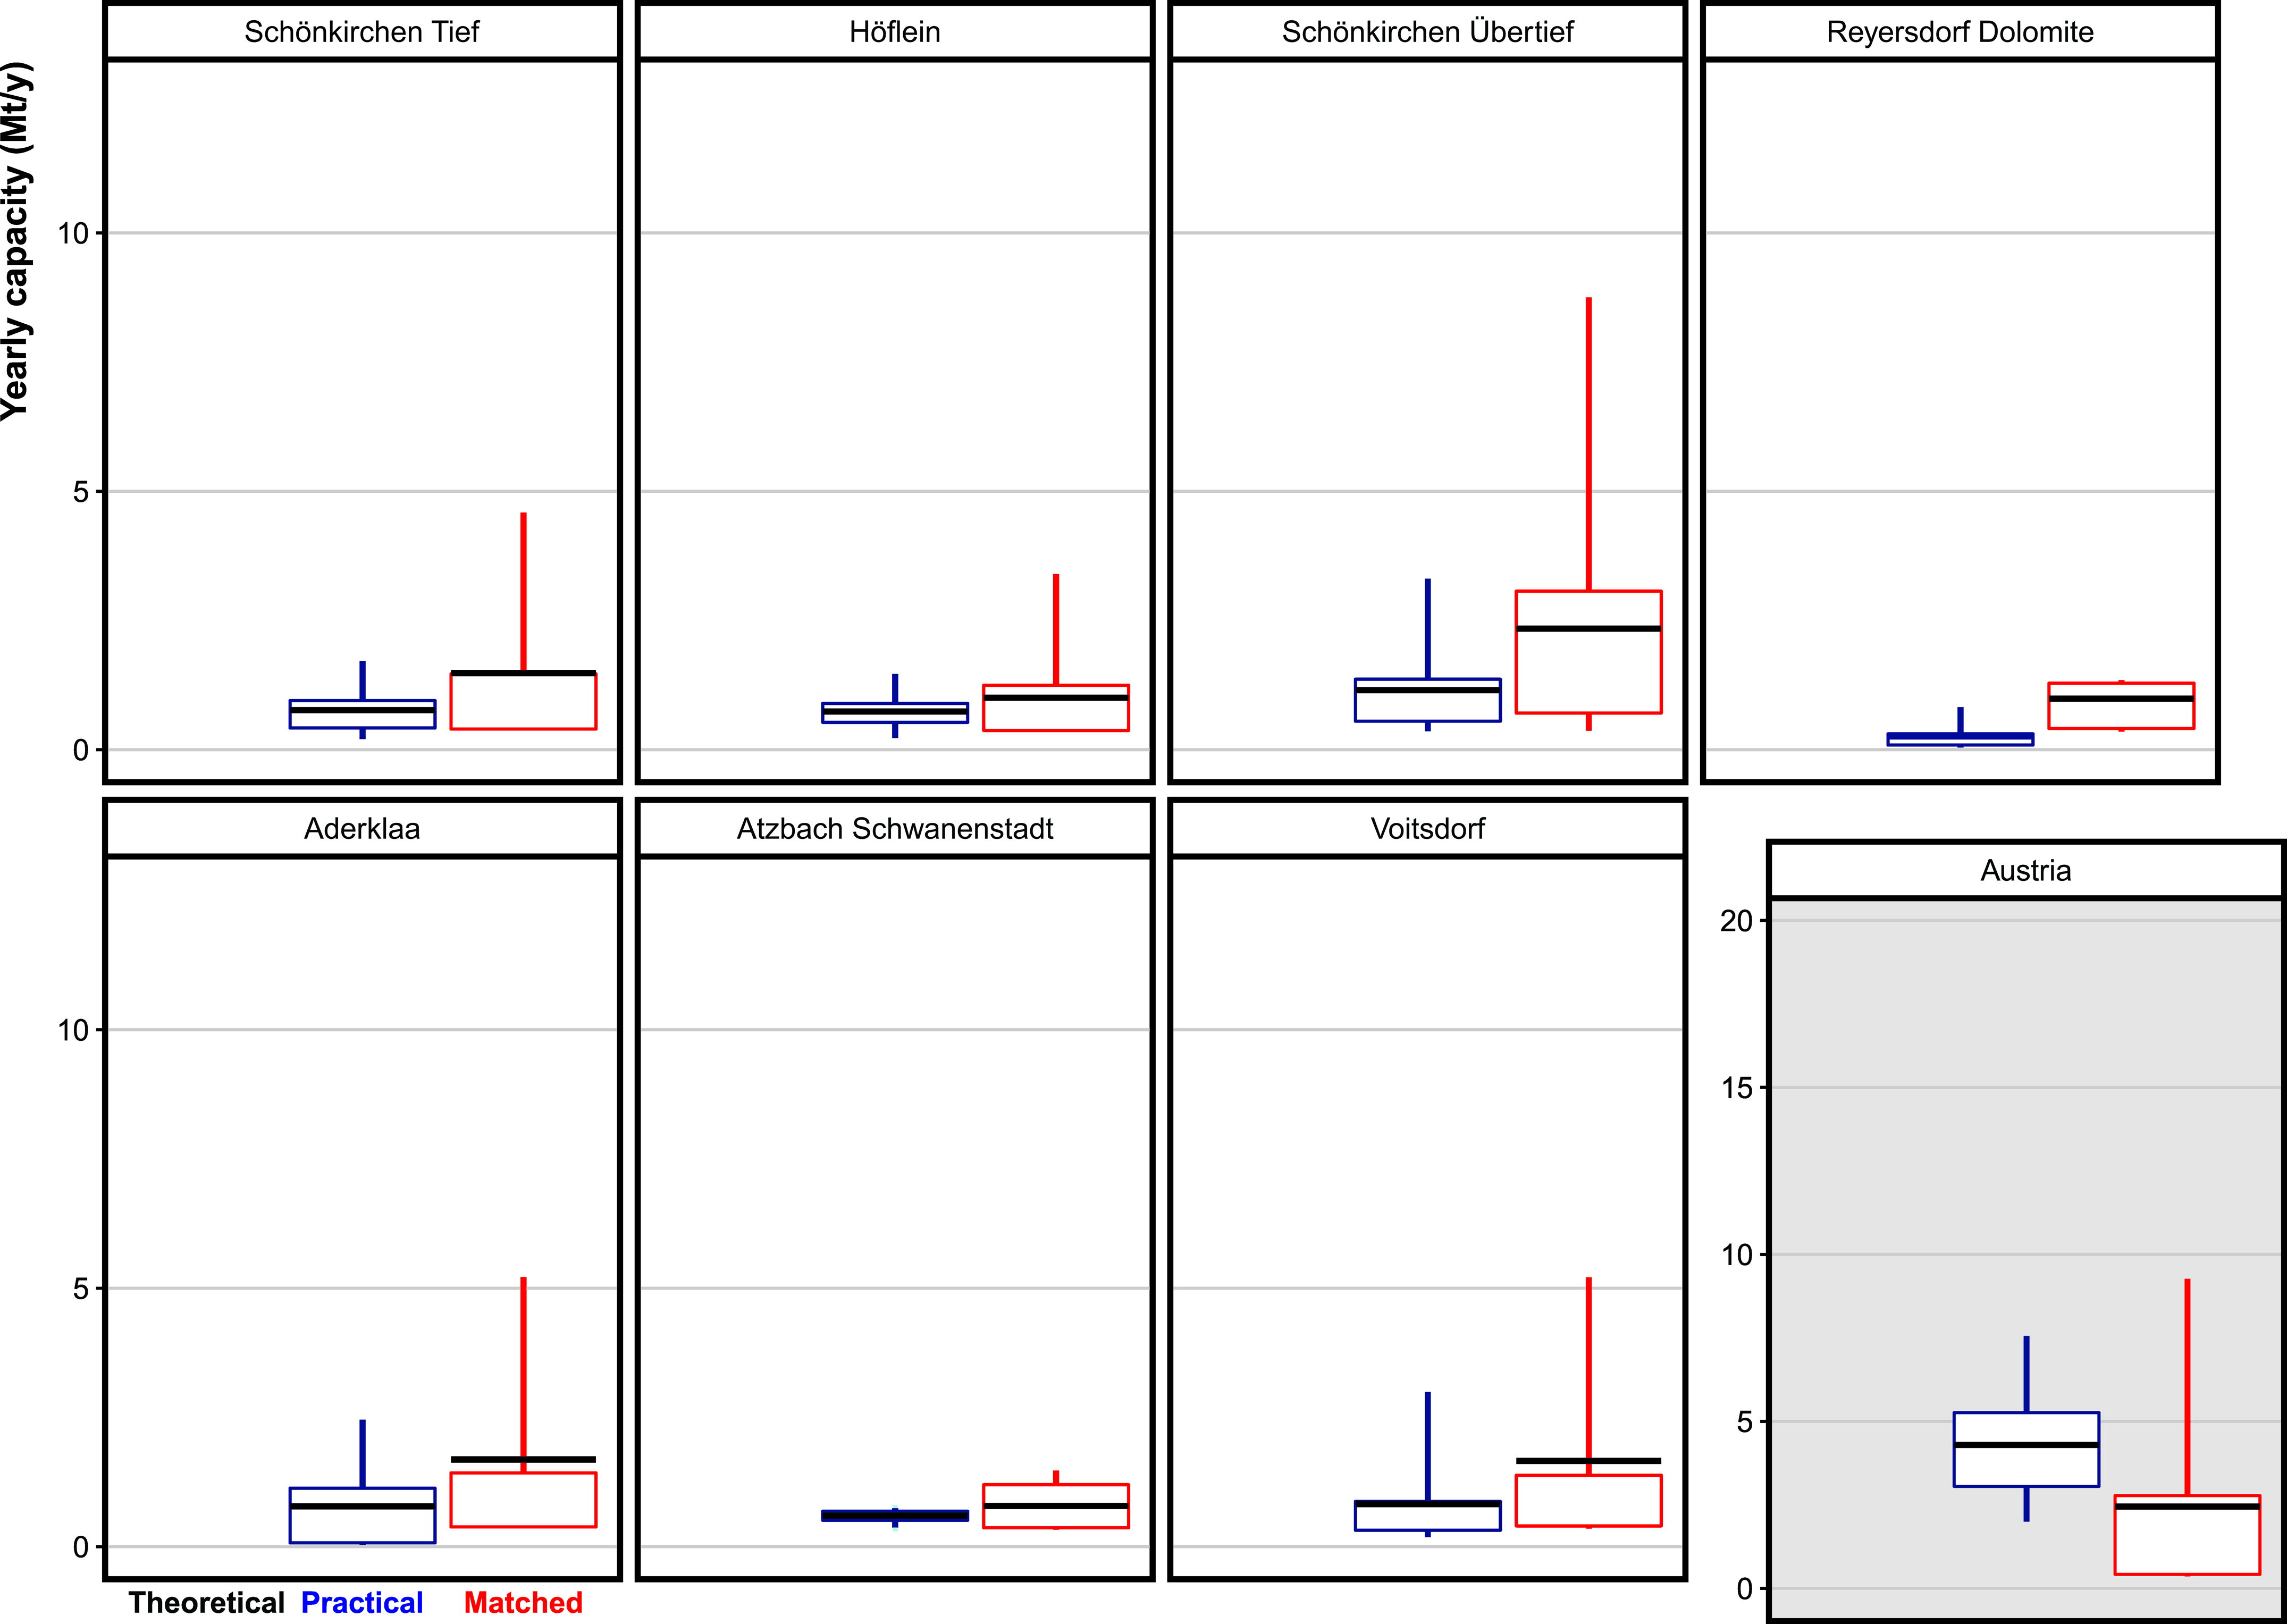
44Figure 6. Boxplots of the yearly practical and matched capacity assessments from PSS III. No yearly theoretical capacity assessments are available for comparison. The black line indicates the average, the box covers the 25th-75th percentile. The whiskers show the 5th-95th percentile as stated in Table 2.
45The capacities found in this paper are slightly higher than those reported by Scharf & Clemens (2006), as can be seen in Table 2. In both cases however the Schönkirchen Übertief reservoir is the largest reservoir. Only for the Voitsdorf reservoir, our calculations show a significant larger capacity (5 times larger than published numbers). For this reservoir, individual expert judgements do not only differ but also mostly do not overlap. Consequently, this is also the reservoir with the largest uncertainty ranges in the PSS III output. The Voitsdorf and Atzbach-Swanenstadt reservoirs were also assessed by only 2 of the 3 experts, which could reduce the quality of the final assessment. However, both the average results and the uncertainty ranges show no abnormal variation, which suggests there is no significant difference in quality. Note that the practical capacity PDFs (Fig. 10) are similar in shape compared to the expert judgements graphs (Fig. 9). This means that, at least for this study, the capacity that is assigned by the experts is also available at practical capacity level.
46For most reservoirs, the average matched capacity is also close to the average practical capacity at 15 €/tCO2 (dashed line in Fig. 10). For four of the seven reservoirs, the average matched capacity is even slightly larger. The matched capacity results are in essence a subsampling of the practical capacity PDFs at different storage budgets. The overall average storage cost in the source-sink matching (for the matched capacity) is just over a relatively high 13 €/tCO2. This is close to the 15 €/tCO2 storage budget of which the practical capacity results are displayed, and therefore a correct comparison between both can be made. As the averages of practical and matched capacity are close for all reservoirs, the subsampling – i.e. CCS deployment – occurs on average without preference for particular high or low capacity numbers.
47When comparing the practical and matched capacity PDF’s in more detail (Fig. 10), a preferential sampling can, however, be observed. There are clear peaks present in the matched capacity PDFs, which relate to the discrete amount of CO2 produced by an industrial facility. This explains why in some cases the average matched capacity is higher than the practical: if only very limited practical capacity is available, there will be no source-sink match. Monte Carlo calculations where no source-sink match is made, and thus no storage project is activated, are not considered when calculating the average of the matched capacity. Therefore these zero values only influence the development probability and not the average matched capacity. A project will only be activated in the case that the random sampling is at the higher end of the practical capacity range, which typically causes the average matched capacity to be higher than the practical capacity. The cause of this observation is the splitting of the development probability and the stochastic (non-zero) matched capacity, which is done because this is more intuitive and facilitates in-depth interpretation. If such a split would not be made, then the matched capacity would always be smaller than the practical capacity. This also demonstrates the importance of distinguishing between matched and practical capacity.
48The reservoirs can be ranked by their development probability, which results in an exploration priority list (Fig. 7). Higher ranked reservoirs have a higher chance on being matched to a CO2 source, and could be considered as primary targets in future exploration. The Schönkirchen Übertief, Voitsdorf and Höflein reservoirs are ranked the highest with development probabilities over 25%, followed by the Schönkirchen Tief, Aderklaa and Atzbach-Schwanenstadt reservoir. The Reyersdorf Dolomite reservoir is ranked the lowest. According to these results, the Schönkirchen Übertief could be a primary target for further research at this stage. There is also some degree of correlation between capacity and development probability, as the highest ranked reservoirs (Schönkirchen Übertief and Voitsdorf) have the highest practical and matched capacities.
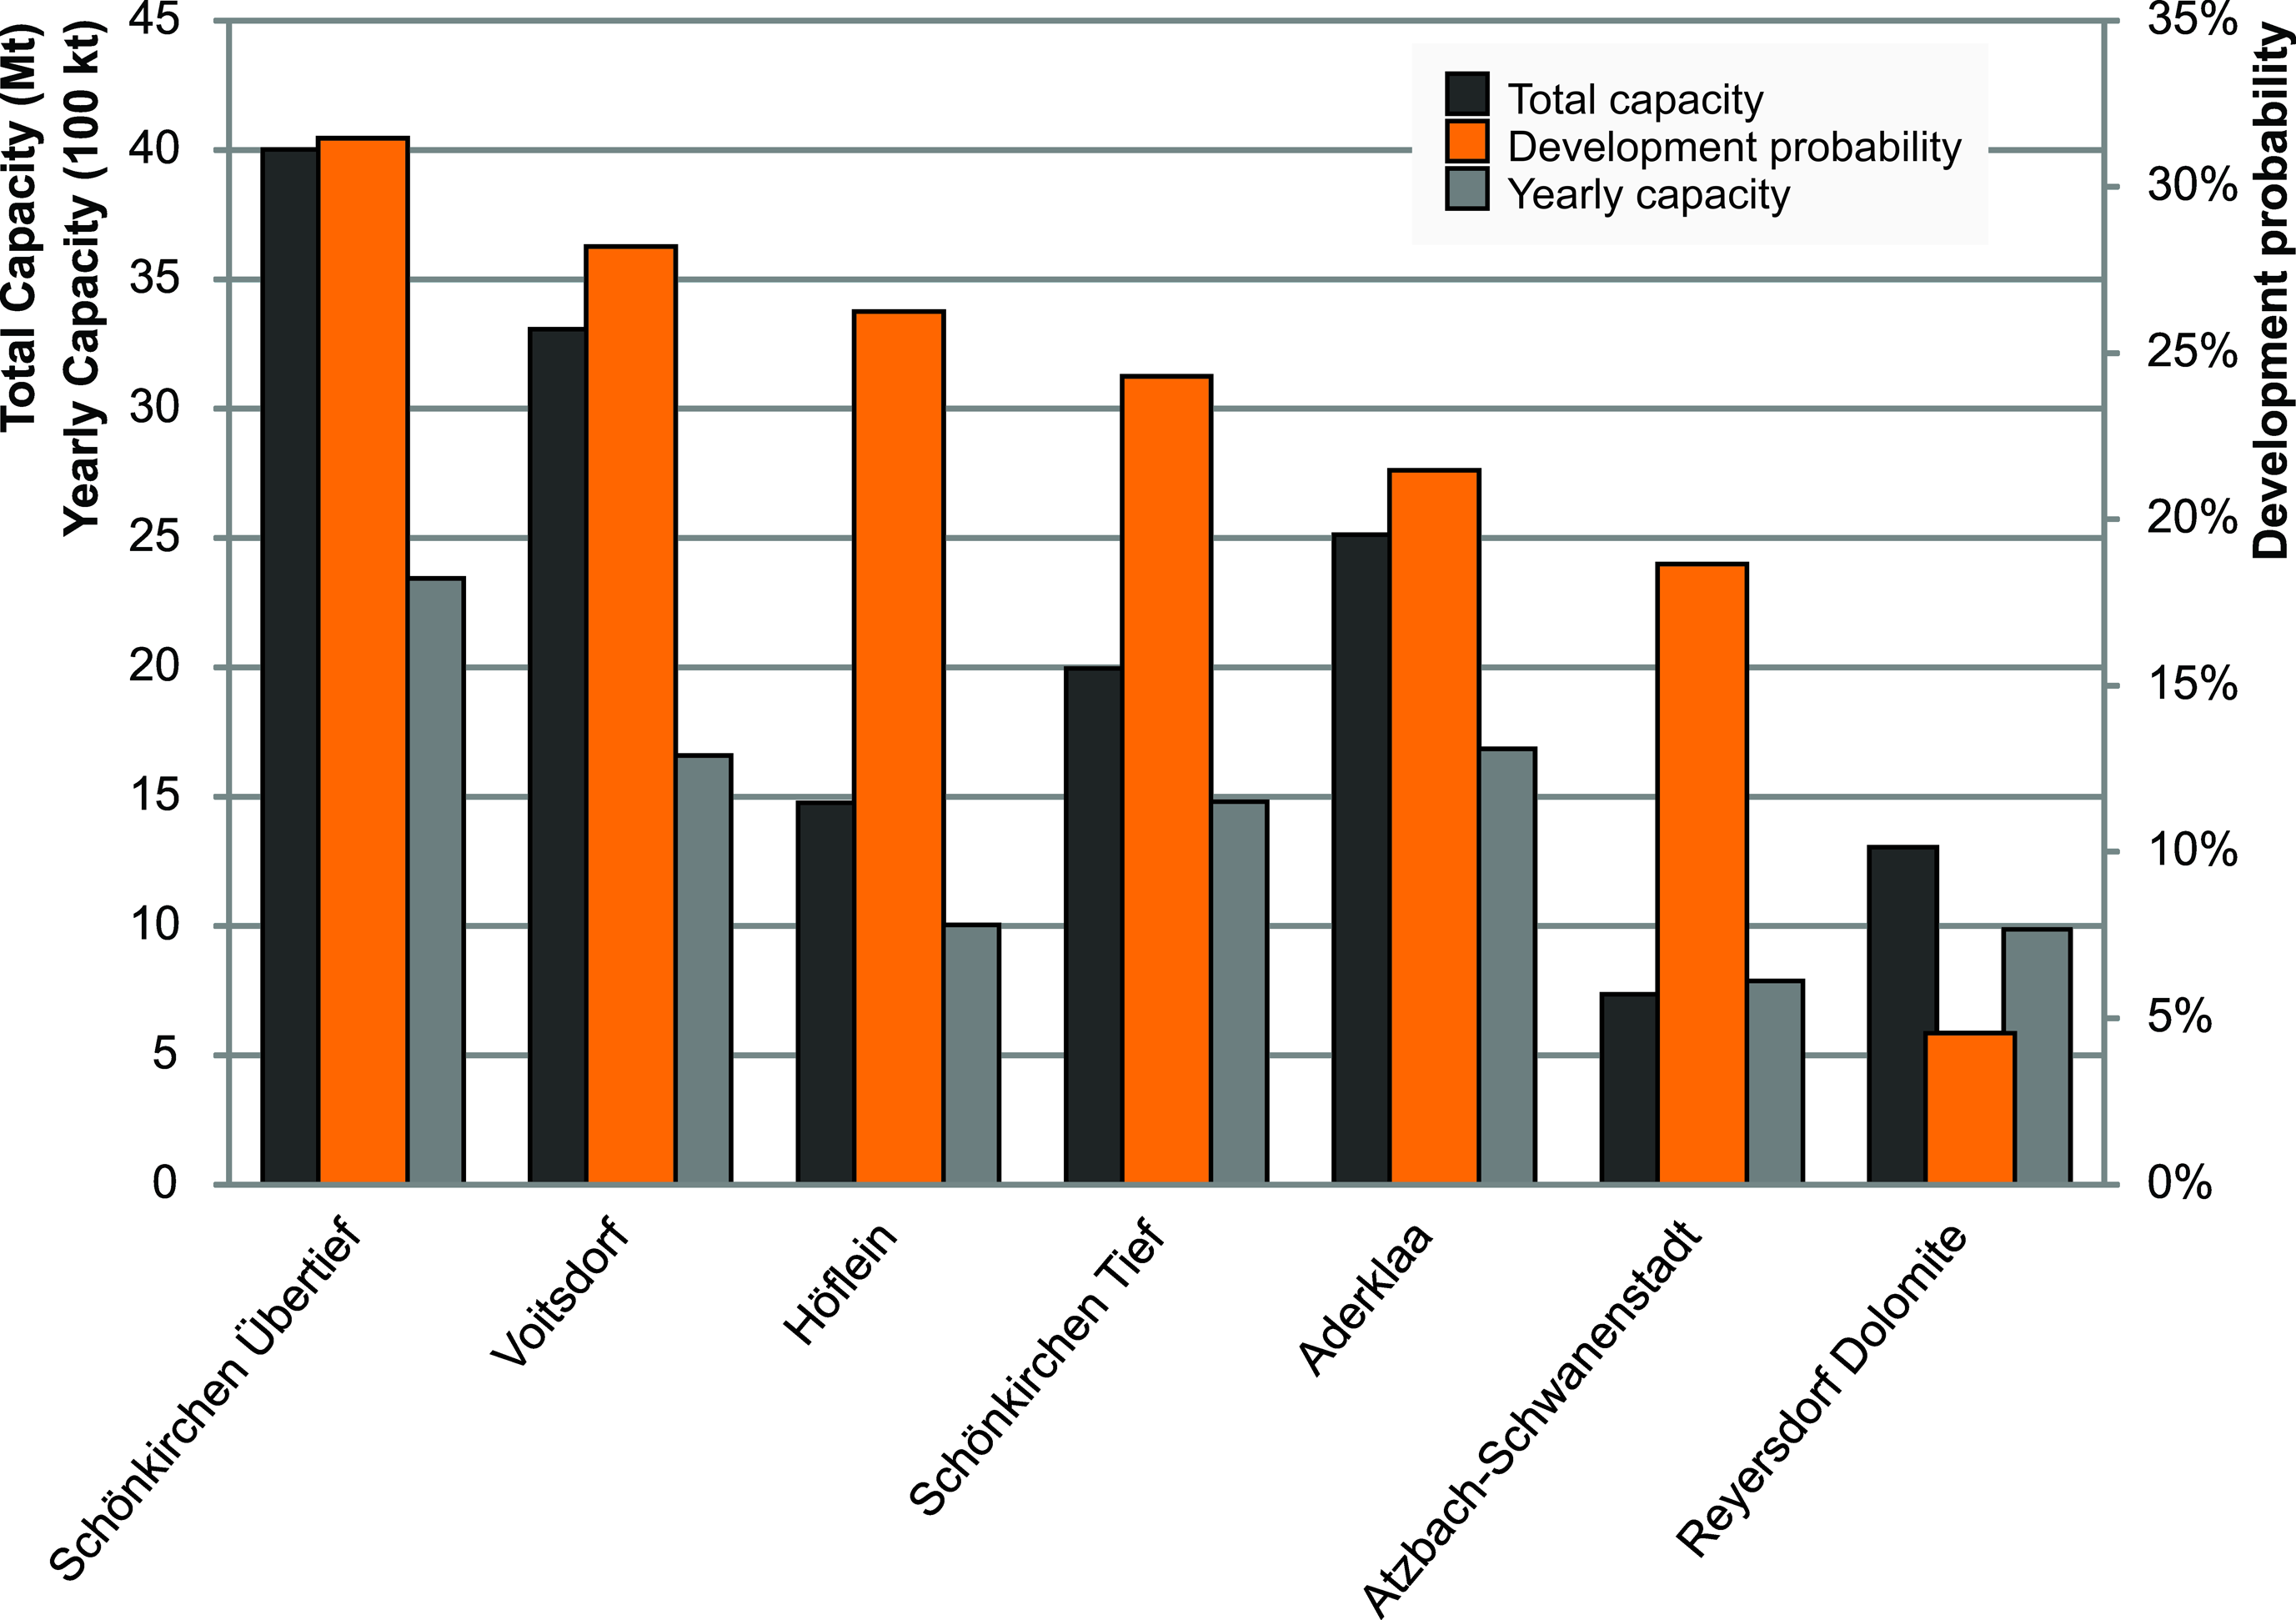
49Figure 7. Reservoir exploration priority ranking, based on the development probability (orange). Total (dark grey, in Mt) and yearly (light grey, in 100 kt) capacities are also given. The Schönkirchen Übertief is the most favourable, while the Reyersdorf Dolomite seems not favourable.
50The findings of this research point out a relatively low storage capacity and high storage cost. This indicates that there are important limiting factors to the actual development of CO2 storage reservoirs. Two main bottlenecks for the geological storage of CO2 in Austria can be identified.
51First is the limited practical capacity of individual reservoirs. The average total and yearly capacities are low compared to the CO2 emissions of a full-size, 1 GW coal-fired power plant (~5 MtCO2/y). It is, however, important to consider the whole uncertainty range of these practical and matched capacity simulations, instead of only the average. Higher-than-average capacities have a significant probability as well, which would enable such a large-scale CCS project. The simulation methodology might also be limiting the installation of large capture plants: in the model a source can only be linked to one reservoir at the same time, which automatically eliminates smaller reservoirs in the source-sink matching process. Simulation results also show a significant possibility that after the commercial introduction of CCS, domestic reservoir capacity can be filled up rapidly. Figure 8 shows the probability that the reservoirs are filled up completely by a certain moment in time. Already before 2025 there is a small probability that some reservoirs reach their maximum capacity. By 2050, this probability has risen to 20-30 %.
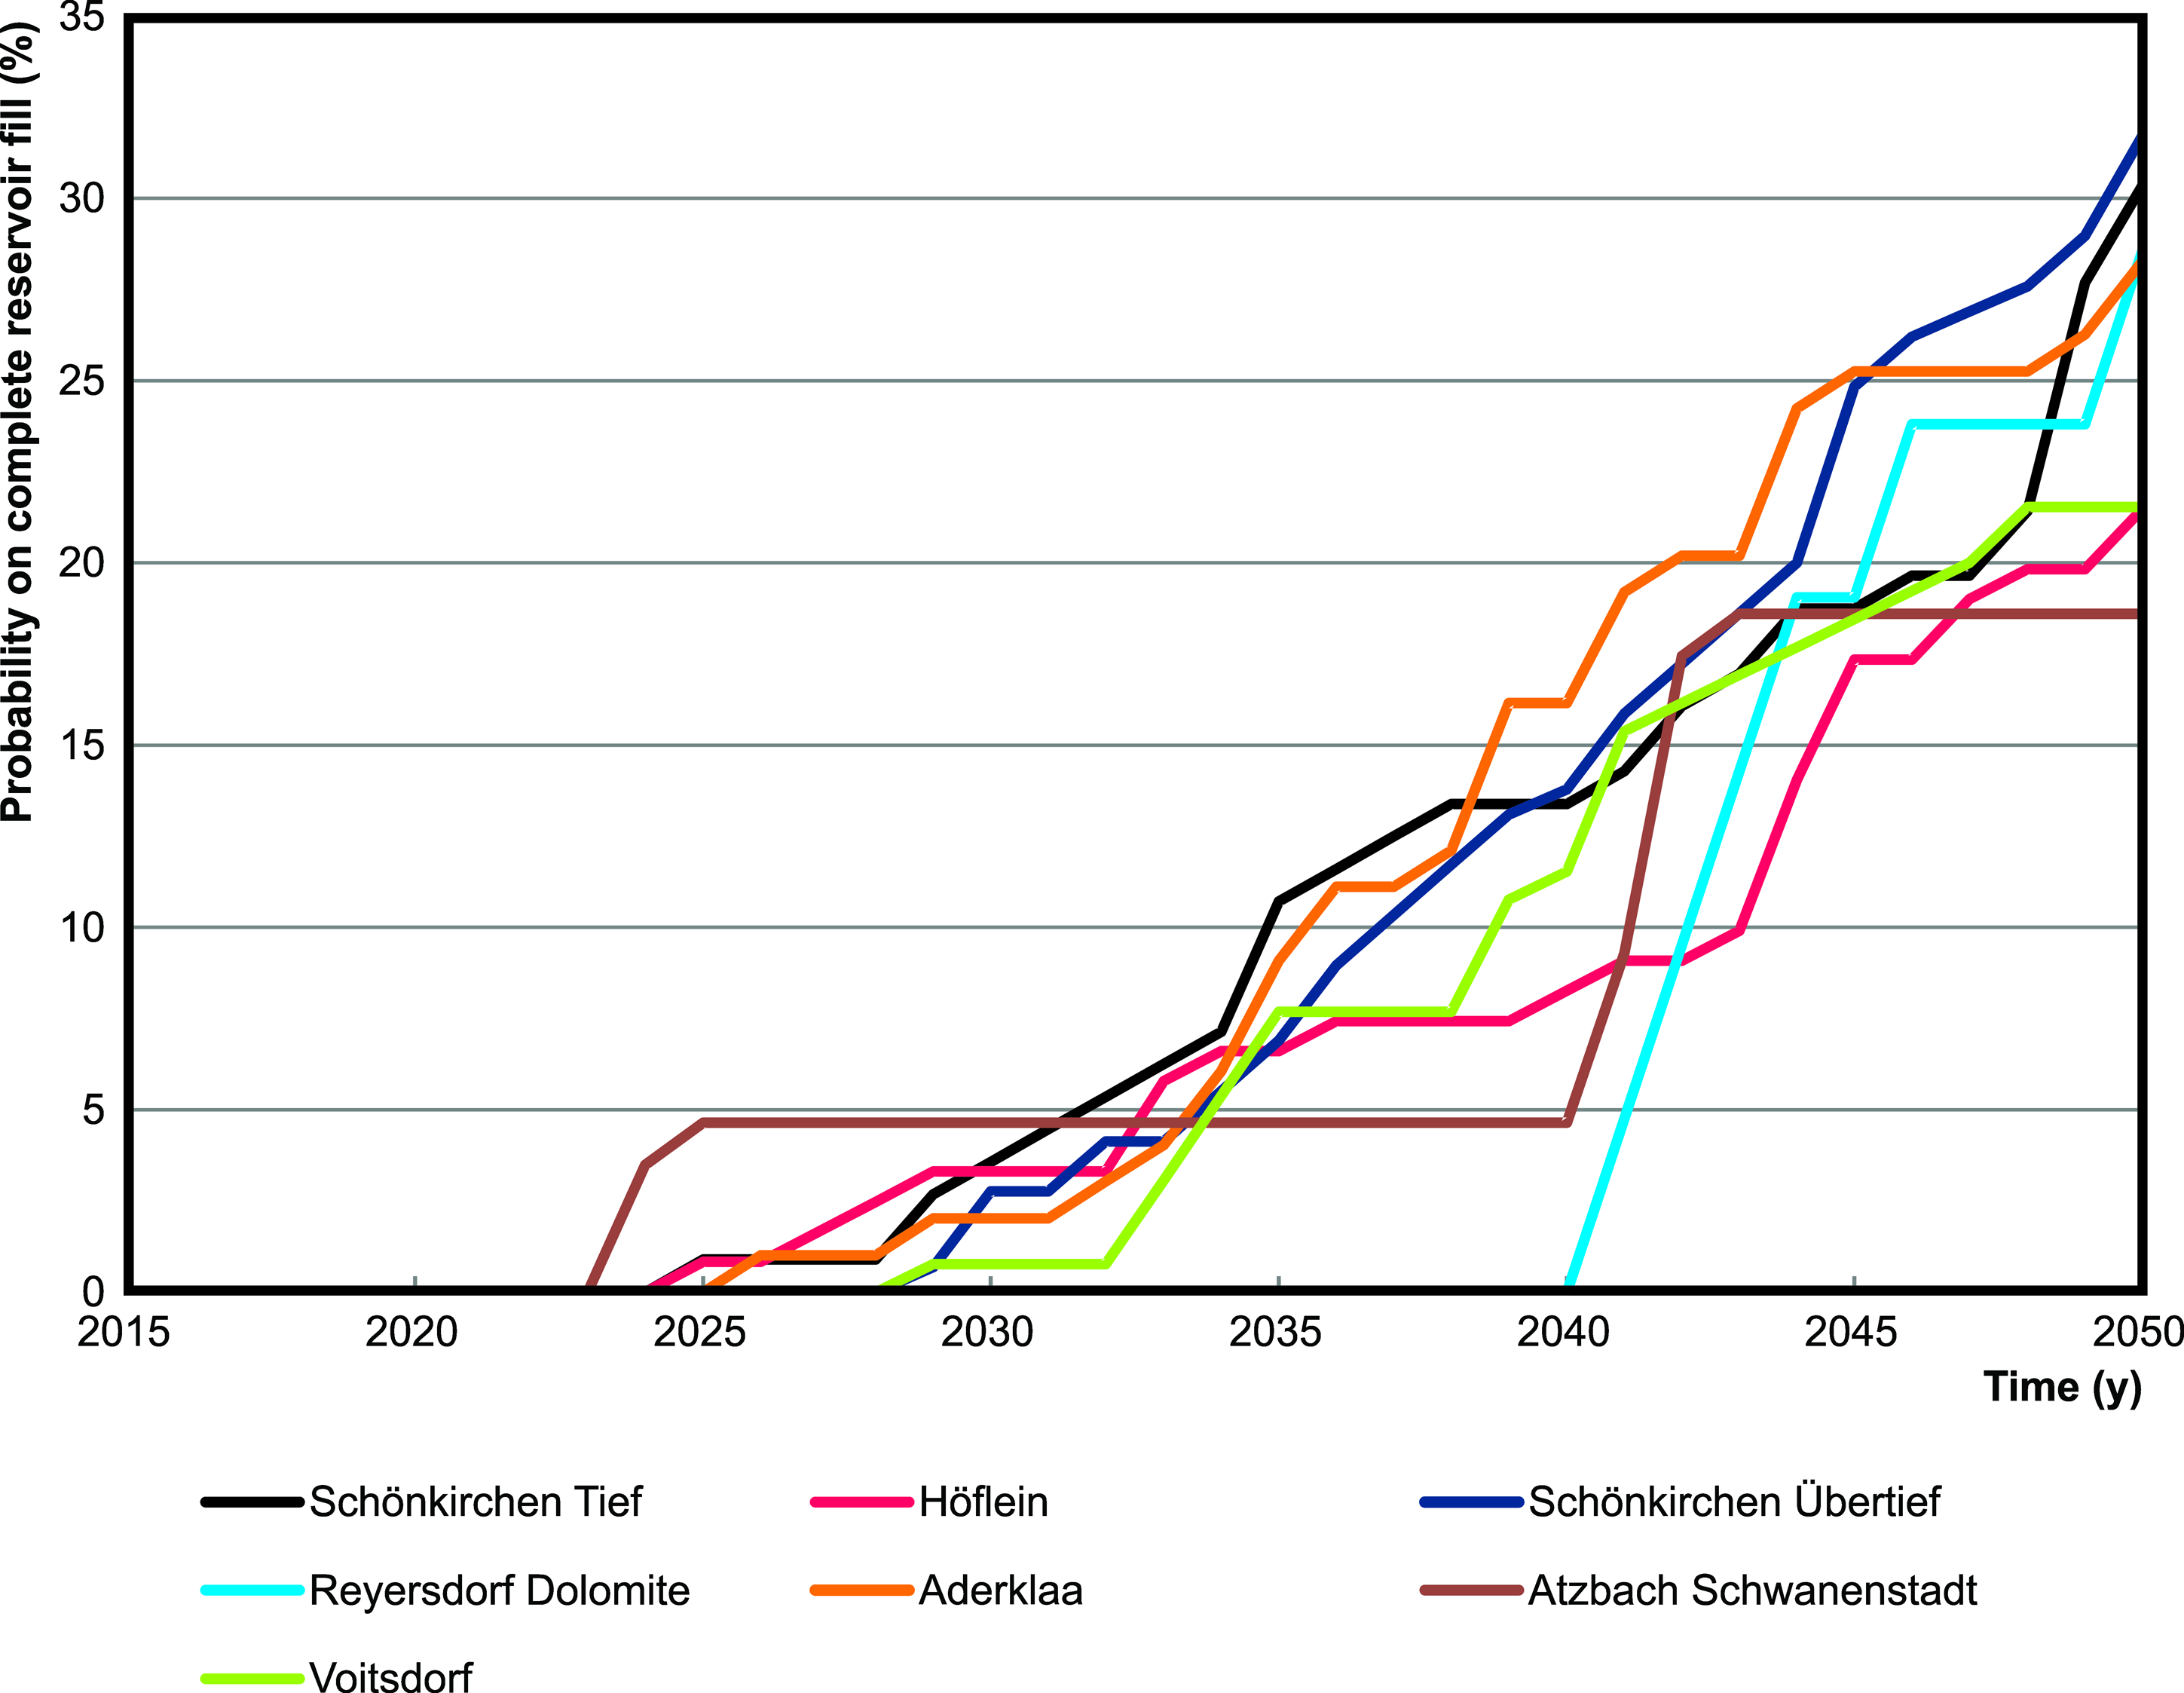
52Figure 8. Probability that the reservoirs are filled completely by a certain moment in time. For some reservoirs, there is a small probability that the matched capacity reaches the practical capacity before 2025. By 2050, this probability lies around 20 to 30% for most reservoirs.
53A second bottleneck to the implementation of CCS is the effect of discounting the rise of the CO2 price curve. The present value of costs at the end of a project’s lifetime is smaller compared to costs incurred at an early stage of the project. The CO2 emission cost is the only driver for CCS to be chosen as an economic option, and a high CO2 price at the end of a project may not compensate for the high upfront costs compared to a cheaper conventional fossil-fuel based technology. In a non-subsidised situation, the same is true for renewable technology. Thus, conventional technologies are more likely to be chosen. A sufficiently high CO2 price early in the project lifetime is needed to justify the additional investment for capture and storage.
54Possible solutions to these bottlenecks are to install capture on smaller sources, or to distribute the CO2 stream to multiple reservoirs. This should be addressed by future research. Another possible application for these smaller reservoirs is to fit CCS into other schemes, such as enhanced oil or gas recovery using anthropogenic CO2 as a solvent and propellant (CO2-enhaced oil/gas recovery, EOR/EGR). In Polak & Grimstad (2009) this EGR possibility was investigated for the Atzbach-Schwanenstadt field. A matched capacity of 8.2 Mt could be achievable using CO2 from a nearby paper mill and fertilizer plant. Though possible, an EGR project might be uneconomic due to a fast CO2 breakthrough and high CO2 reproduction. A sufficiently high EU ETS and gas price can offset the EGR cost, which might be subject to further study. The possibility of geothermal energy production by injecting CO2 in storage reservoirs, in CO2-enhanced geothermal systems (CO2-EGS), is also being studied (e.g. Pruess, 2006; Randolph & Saar, 2011). These schemes provide a return that could make smaller scale projects profitable. In general though, capture of smaller amounts is more expensive, and the implication on the full CCS chain has to be studied.
55The average yearly practical and matched capacity estimates by PSS III are 4.3 and 2.5 MtCO2/y respectively for Austria. Considering the reported emissions from 2011 (6.2 MtCO2 for electricity and 11.3 MtCO2 for iron & steel production), about 14% of these emissions could be stored annually until 2050. This means that the potential for reducing GHG emissions in Austria using CCS is not large, but still significant, even without exporting CO2 to neighbouring countries. When accounting for the whole uncertainty range, there is still a small probability that, under the simulated scenario, up to 10 MtCO2 would be stored annually. As the assessed reservoirs are all (depleted) hydrocarbon reservoirs, the uncertainties associated with storing CO2 are in general smaller compared to other types of reservoirs. These reservoirs have contained oil or gas (in some cases with significant quantities of CO2) for long periods of time, which means that safe containment of injected CO2 is more likely.
56At this moment CCS does not form part of Austria’s climate policy, and storage of CO2 is not allowed except for research purposes (Shogenova et al., 2014). In the light of the latest UNFCCC Conference of Parties in Paris (COP21), where it was agreed to keep global temperature increase well below 2 °C above pre-industrial levels (UNFCCC, 2015), the global deployment of geological storage of CO2 as a mitigation technology becomes more urgent. The global target is very ambitious, and all available measures for emission reduction, including an increase in the rate of renewable energy production deployment, are necessary. Given that context, and with the potential for CCS as proven in this study, it may be necessary to revisit the ban on CO2 storage.
57The results of this study show that the potential for geological storage of CO2 in Austria is relatively high, therefore a more in-depth reservoir-specific assessment should be the next step. Also, production technologies with CO2 capture can be competitive with traditional technologies. Results can help optimal planning of climate and energy policy, and investments in CCS. This includes matching individual sources and sinks, but also assessing the CCS potential of regions and the whole country, as well as anticipating negotiations with other countries regarding cross-border transport of CO2. The actual implementation of CCS relies on an enabling policy framework in Austria, and a sufficiently stringent EU ETS system.
7. Conclusions
58Potential geological reservoirs for storage of CO2 in Austria as a climate mitigation measure are assessed in this research using a methodology based on a techno-economic evaluation with PSS Explorer and the PSS III simulator. An assessment is made of the practical and matched capacity and of the reservoir development probability.
59The results indicate a significant potential for CO2 geological storage in Austria. If it is allowed by policy, the probability of storage in Austria is almost 100%. With a development probability of over 30% and the largest individual practical and matched capacity, the Schönkirchen Tief reservoir is ranked highest in our exploration priority list, and should be a primary target for further exploration if storage is desired. Reservoir selection of course depends on capacity and location match. Other reservoir development probabilities are around 20 to 25%, except for the Reyersdorf Dolomite reservoir, which is not very favourable. The storage capacity of individual reservoirs seems to be a limiting factor for the implementation of capture technology. Possible solutions, which were not assessed in this research, are to install capture on smaller sources or to distribute the CO2 stream to multiple reservoirs. The use of anthropogenic CO2 for enhanced oil or gas recovery, or for geothermal energy production would also enable the use of smaller reservoirs.
60Even without these technologies, CCS is expected to provide storage for, on average, 14% of all CO2 emissions from electricity and iron & steel production, two of the most CO2 intensive industries in Austria, until 2050. A total average practical capacity of almost 120 Mt is assessed to be available. Considering the techno-economic environment, including the European outlooks on the CO2 price, on average 40 MtCO2 of matched capacity would be actually used if storage is allowed. It is important to consider the uncertainty ranges, as more storage capacity is potentially available. A first prerequisite for enabling storage, as well as other low-CO2 technologies, is a CO2 market price which rises quickly.
61These results provide a first detailed assessment of the practical and matched capacity for CO2 storage in Austria, considering the current level of reservoir exploration, the techno-economic environment, and realistic uncertainties. It also enables exploration and infrastructure planning, and our results point out that CCS and domestic geological storage reservoirs in particular can provide a significant contribution to reducing the CO2 emissions of the country, even if Austrian policy and public opinion are currently largely opposed to storage.
8. Acknowledgements
62The PSS simulator methodology was developed during the PSS-CCS projects funded by the Belgian Science Policy Office (contracts SD/CP/04a&b and SD/CP/803) and with internal funding at the Royal Belgian Institute of Natural Sciences – Geological Survey of Belgium (RBINS-GSB). Part of this research was financed by the CGS Europe project exchange programme, funded by the European Union 7th Framework Programme (contract 256725). The authors also wish to thank the experts who willingly provided their reservoir judgements, and Ed Garrett from the RBINS-GSB for providing critical comments. This manuscript benefited from the review comments of Jean-Marc Baele and Jort Rupert.
9. References
63Bachu, S., Bonijoli, D., Bradshaw, J., Burruss, R., Holloway, S., Christensen, N.P. & Mathiassen, O.M., 2007. CO2 storage capacity estimation: Methodology and gaps. International Journal on Greenhouse Gas Control, 1, 430-443.
64BMLFUW, 2009. Erneuerbare Energie 2020: Potenziale und Verwendung in Österreich. Bundesministerium für Land- und Forstwirtschaft, Umwelt und Wasserwirtschaft, 48 p.
65Brix, F. & Schultz, O., 1993. Erdöl und Erdgas in Österreich.Vienna, Ferdinand Berger & Söhne, 714 p.
66Christensen, N.P. & Holloway, S., 2004. Geological Storage of CO2 from Combustion of Fossil Fuel, EU FP5. The GESTCO project, Summary Report, 2nd ed. 32 p. http://www.geus.dk/program-areas/energy/denmark/co2/GESTCO_summary_report_2ed.pdf.
67Dixit, A. & Pindyck, R., 1994. Investment under Uncertainty. Princeton, Princeton University Press, 488 p.
68Ebner F. & Sachsenhofer R., 1991. Die Entwicklungsgeschichte des Steirischen Tertiärbeckens. Mitteilungen der Abteilung für Geologie und Paläontologie am Landesmuseum Joanneum, 49, 96 p.
69E-PRTR, 2015. The European Pollutant Release and Transfer Register (E-PRTR), Member States reporting under Article 7 of Regulation (EC) No 166/2006, database v7. European Environment Agency.
70European Commission, 2013. EU energy, transport and GHG emissions: trends to 2050. Reference scenario 2013. Luxembourg, Publications Office of the European Union 169 p.
71European Council, 1993. 94/69/EC: Council Decision of 15 December 1993 concerning the conclusion of the United Nations Framework Convention on Climate Change. Official Journal L 033, 07/02/1994 P. 0011-0012.
72European Parliament, 2009. Decision No 406/2009/EC of the European Parliament and of the Council of 23 April 2009 of the effort of Member States to reduce their greenhouse gas emissions to meet the Community’s greenhouse gas emission reduction commitments up to 2020. Official Journal of the European Union L 140, 5.6.2009, 136-148.
73Halland, E., Mujezinovic, J. & Riis, F. (eds), 2014. CO2 Storage Atlas of the Norwegian Continental Shelf. Norwegian Petroleum Directorate, Stavanger, Norway, 163 p.
74IEA, 2014. Energy Technology Perspectives 2014, Harnessing Electricity’s Potential. OECD/IEA, Paris, 376 p.
75IEA-ETSAP, 2013. International Energy Agency, Energy Technology Systems Analysis Program. http://www.iea-etsap.org.
76IPCC, 2005. IPCC special report on carbon dioxide capture and storage. Prepared by Working Group III of the Intergovernmental Panel on Climate Change [Metz, B., Davidson, O., de Coninck, H.C., Loos, M., Meyer, L.A. (eds)]. Cambridge University Press, Cambridge, 442 p.
77IPCC, 2014. Climate Change 2014: Mitigation of Climate Change. Contribution of Working Group III to the Fifth Assessment Report of the Intergovernmental Panel on Climate Change. [Edenhofer, O., Pichs-Madruga, R., Sokona, Y., Farahani, E., Kadner, S., Seyboth, K., Adler, A., Baum, I., Brunner, S., Eickemeier, P., Kriemann, B., Savolainen, J., Schlömer, S., von Stechow, C., Zwickel, T. & Minx, J.C. (eds)], Cambridge University Press, Cambridge, 1435 p.
78Keating, G.N., Middleton, R.S., Viswanathan, H.S., Stauffer, P.H. & Pawar, R.J., 2011. How storage uncertainty will drive CCS infrastructure. Energy Procedia, 4, 2393-2400.
79Keeling, R.F., Walker, S.J., Piper, S.C. & Bollenbacher, A.F., 2014. Scripps CO2 Program. Scripps Institution of Oceanography, University of California. http://scrippsco2.ucsd.edu/data/atmospheric_co2.html.
80Markowitz, H.M., 1987. Mean-Variance Analysis in Portfolio Choice and Capital Markets. Wiley, Milton Keynes, 379 p.
81Middleton, R.S., Keating, G.N., Viswanathan, H.S., Stauffer, P.H. & Pawar, R.J., 2012. Effects of geologic reservoir uncertainty on CO2 transport and storage infrastructure. International Journal of Greenhouse Gas Control, 8, 132-142.
82Morgan, M.G. & Keith, D.W., 2008. Improving the way we think about projecting future energy use and emissions of carbon dioxide. Climatic Change, 90, 189-215.
83Neele, F., Mikunda, T., Seebregts, A., Santen, S., van der Burgt, A., Stiff, S. & Hustad, C., 2013. A roadmap towards a European CO2 transport infrastructure. Energy Procedia, 37, 7774-7782.
84Peresson, H. & Decker, K., 1997. The Tertiary dynamics of the northern Eastern Alps (Austria): Changing palaeostresses in a collisional plate boundary. Tectonophysics, 272, 125-157.
85Polak, S. & Grimstad, A.-A., 2009. Reservoir simulation study of CO2 storage and CO2-EGR in the Atzbach-Schwanenstadt gas field in Austria. Energy Procedia, 1, 2961-2968.
86Piessens, K., Welkenhuysen K., Laenen, B., Ferket, H., Nijs, W., Duerinck, J., Cochez, E., Mathieu, Ph., Valentiny, D., Baele, J.-M., Dupont, N. & Hendriks, Ch., 2012. Policy Support System for Carbon Capture and Storage and Collaboration between Belgium-the Netherlands “PSS-CCS”, Final report. Brussels, Belgian Science Policy, Research Programme Science for a Sustainable Development, 335 p. http://www.belspo.be/belspo/ssd/science/Reports/PSS-CCS_FinRep_AD.2.pdf.
87Prey, S., 1980. Die Geologie Österreichs in ihrem heutigen geodynamischen Entwicklungsstand sowie die geologischen Bauteile und ihre Zusammenhänge. In: Oberhauser, R. (ed.), Der geologische Aufbau Österreichs. Geologische Bundesanstalt & Springer-Verlag, Vienna, New York, 79-118.
88Pruess, K., 2006. Enhanced geothermal systems (EGS) using CO2 as a working fluid – A novel approach for generating renewable energy with simultaneous sequestration of carbon. Geothermics, 35, 351-367.
89Randolph, J.B. & Saar, M.O., 2011. Coupling carbon dioxide sequestration with geothermal energy capture in naturally permeable, porous geologic formations: Implications for CO2 sequestration. Energy Procedia, 4, 2206-2213.
90Rupp C., Linner M. & Mandl G.W., 2011. Erläuterungen geologische Karte von Oberösterreich 1:200 000. Geologische Bundesanstalt, Vienna.
91Scharf, C. & Clemens, T., 2006. CO2-sequestration potential in Austrian oil and gas fields (SPE100176). In SPE EUROPEC/EAGE Annual Conference and Exhibition, 12-15 June 2006, Vienna, Austria.
92Seifert, P., 1992. Palinspastic reconstruction of the easternmost Alps between Upper Eocene and Miocene. Geologica Carpathica, 43, 327-331.
93Shogenova, A., Piessens, K., Holloway, S., Bentham, M., Martínez, R., Flornes, K.M., Poulsen, N.E., Wójcicki, A., Sliaupa, S., Kucharič, Dudu, A., Persoglia, S., Hladik, V., Saftic, B., Kvassnes, A., Shogenov, K., Suárez, I., Sava, C., Anghel, S. & Chikkatur, A., 2014. Implementation of the EU CCS Directive in Europe: results and development in 2013. Energy Procedia, 63, 6662-6670.
94Statistics Austria, 2009. Energy balances for Austria and the Laender of Austria. https://www.statistik.at/web_en/statistics/energy_environment/energy/energy_balances/index.html.
95UNFCCC, 2006. Austria’s Initial Report under the Kyoto Protocol. Federal Ministry of Agriculture and Forestry, Environment and Water Management. Vienna, Austria. http://unfccc.int/files/national_reports/initial_reports_under_the_kyoto_protocol/application/pdf/at-initial-report-200611-corr.pdf.
96UNFCCC, 2015. Adoption of the Paris Agreement. United Nations, Framework Convention on Climate Change, Conference of the Parties, FCCC/CP/2015/L.9/Rev.1, 32 p. https://unfccc.int/resource/docs/2015/cop21/eng/l09r01.pdf.
97Umweltbundesamt Österreich, 2014a. Austria’s National Inventory Report 2014. Submission under the United Nations Framework Convention on Climate Change and the Kyoto Protocol. National inventory report 2013. Vienna, Report REP-0475, 553 p.
98Umweltbundesamt Österreich, 2014b. Klimaschutzbericht 2014. Vienna, Report REP-0491, 170 p.
99Vangkilde-Pedersen, T., Allier, D., Anghel, S., Bossie-Cordreanu, D., Car, M., Donda, F. et al., 2009. Assessing European Capacity for Geological Storage of Carbon Dioxide. EU GeoCapacity, D16 WP2 Report, Project no. SES6-518318, 166 p. http://www.geology.cz/geocapacity/publications/D16 WP2 Report storage capacity-red.pdf.
100Welkenhuysen, K., Ramírez, A., Swennen, R. & Piessens, K., 2013. Strategy for ranking potential CO2 storage reservoirs: a case study for Belgium. International Journal of Greenhouse Gas Control, 17, 431-449.
101Wessely, G., 2006. Geologie der Österreichischen Bundesländer, Niederösterreich. Geologische Bundesanstalt, Vienna, 416 p.
102ZEP, 2011. The Costs of CO2 Storage. European Technology Platform for Zero Emission Fossil Fuel Power Plants, Brussels, 42 p. http://www.zeroemissionsplatform.eu/downloads/814.html.
103Manuscript received 03.08.2015, accepted in revised form 30.08.2016, available on line 25.11.2016.
Appendix
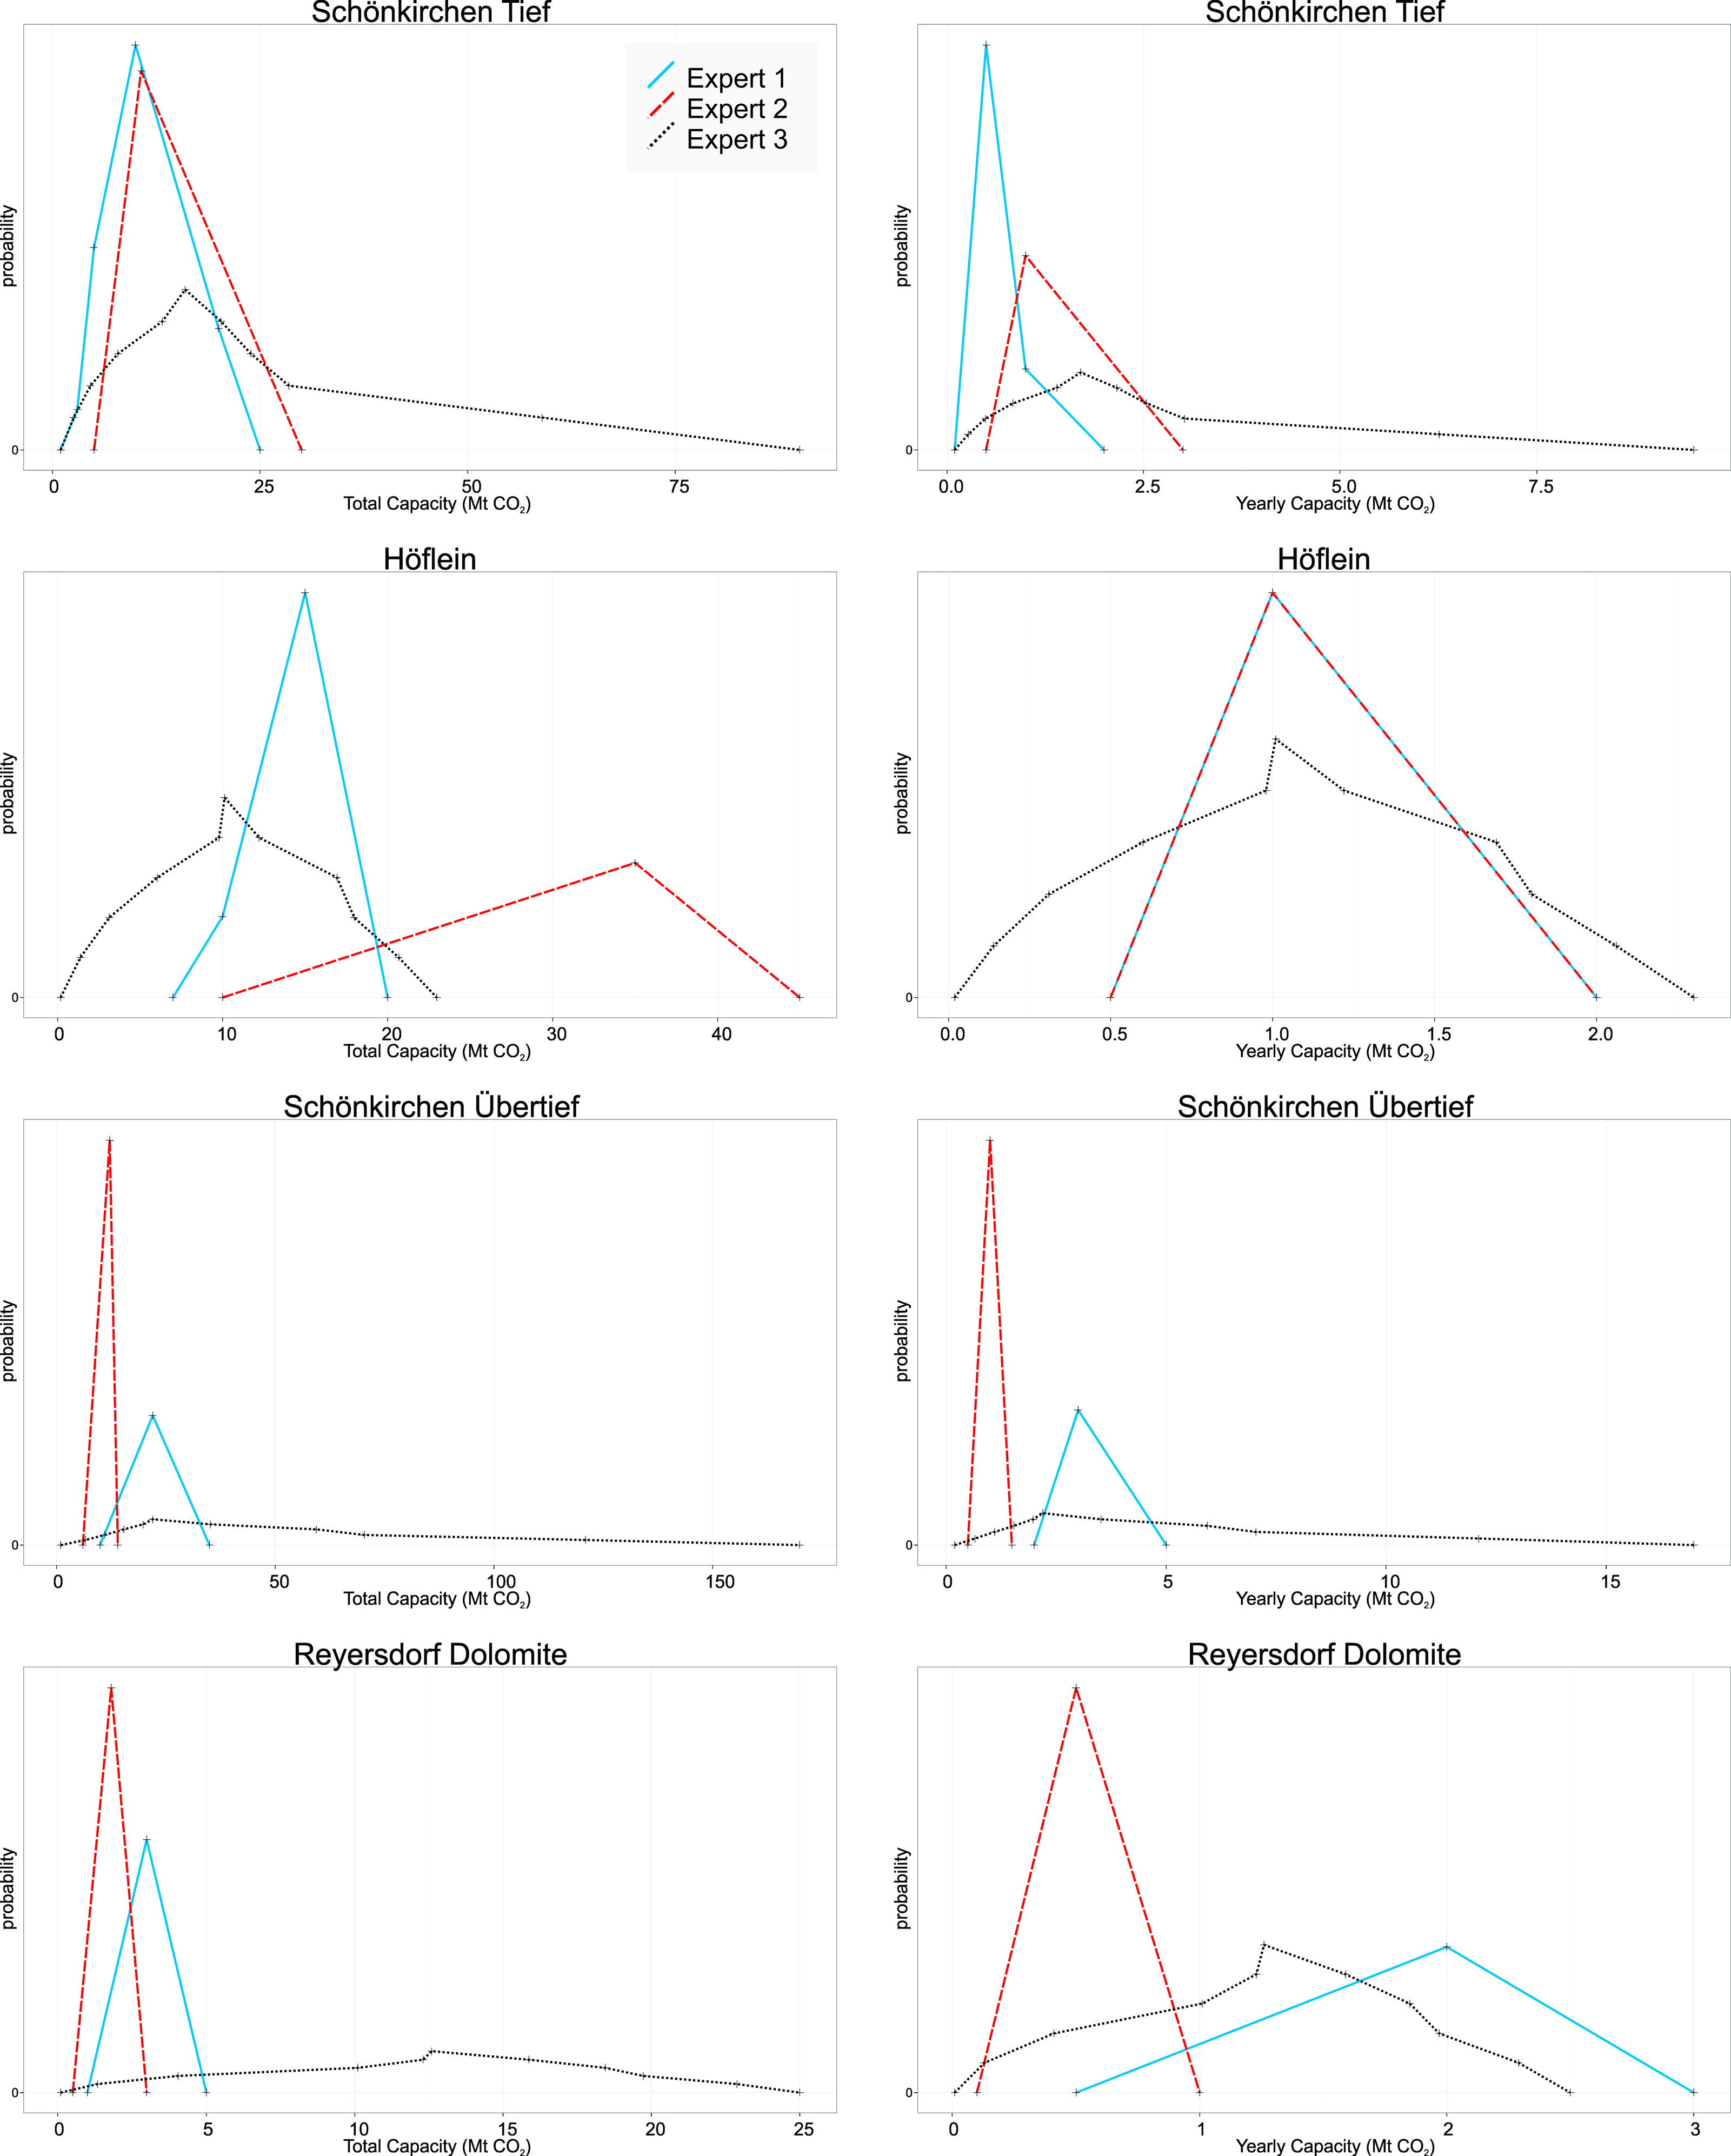
104Figure 9. Expert judgements for each reservoir as total capacity and injectivity probability density functions, and the probability on reservoir failure.
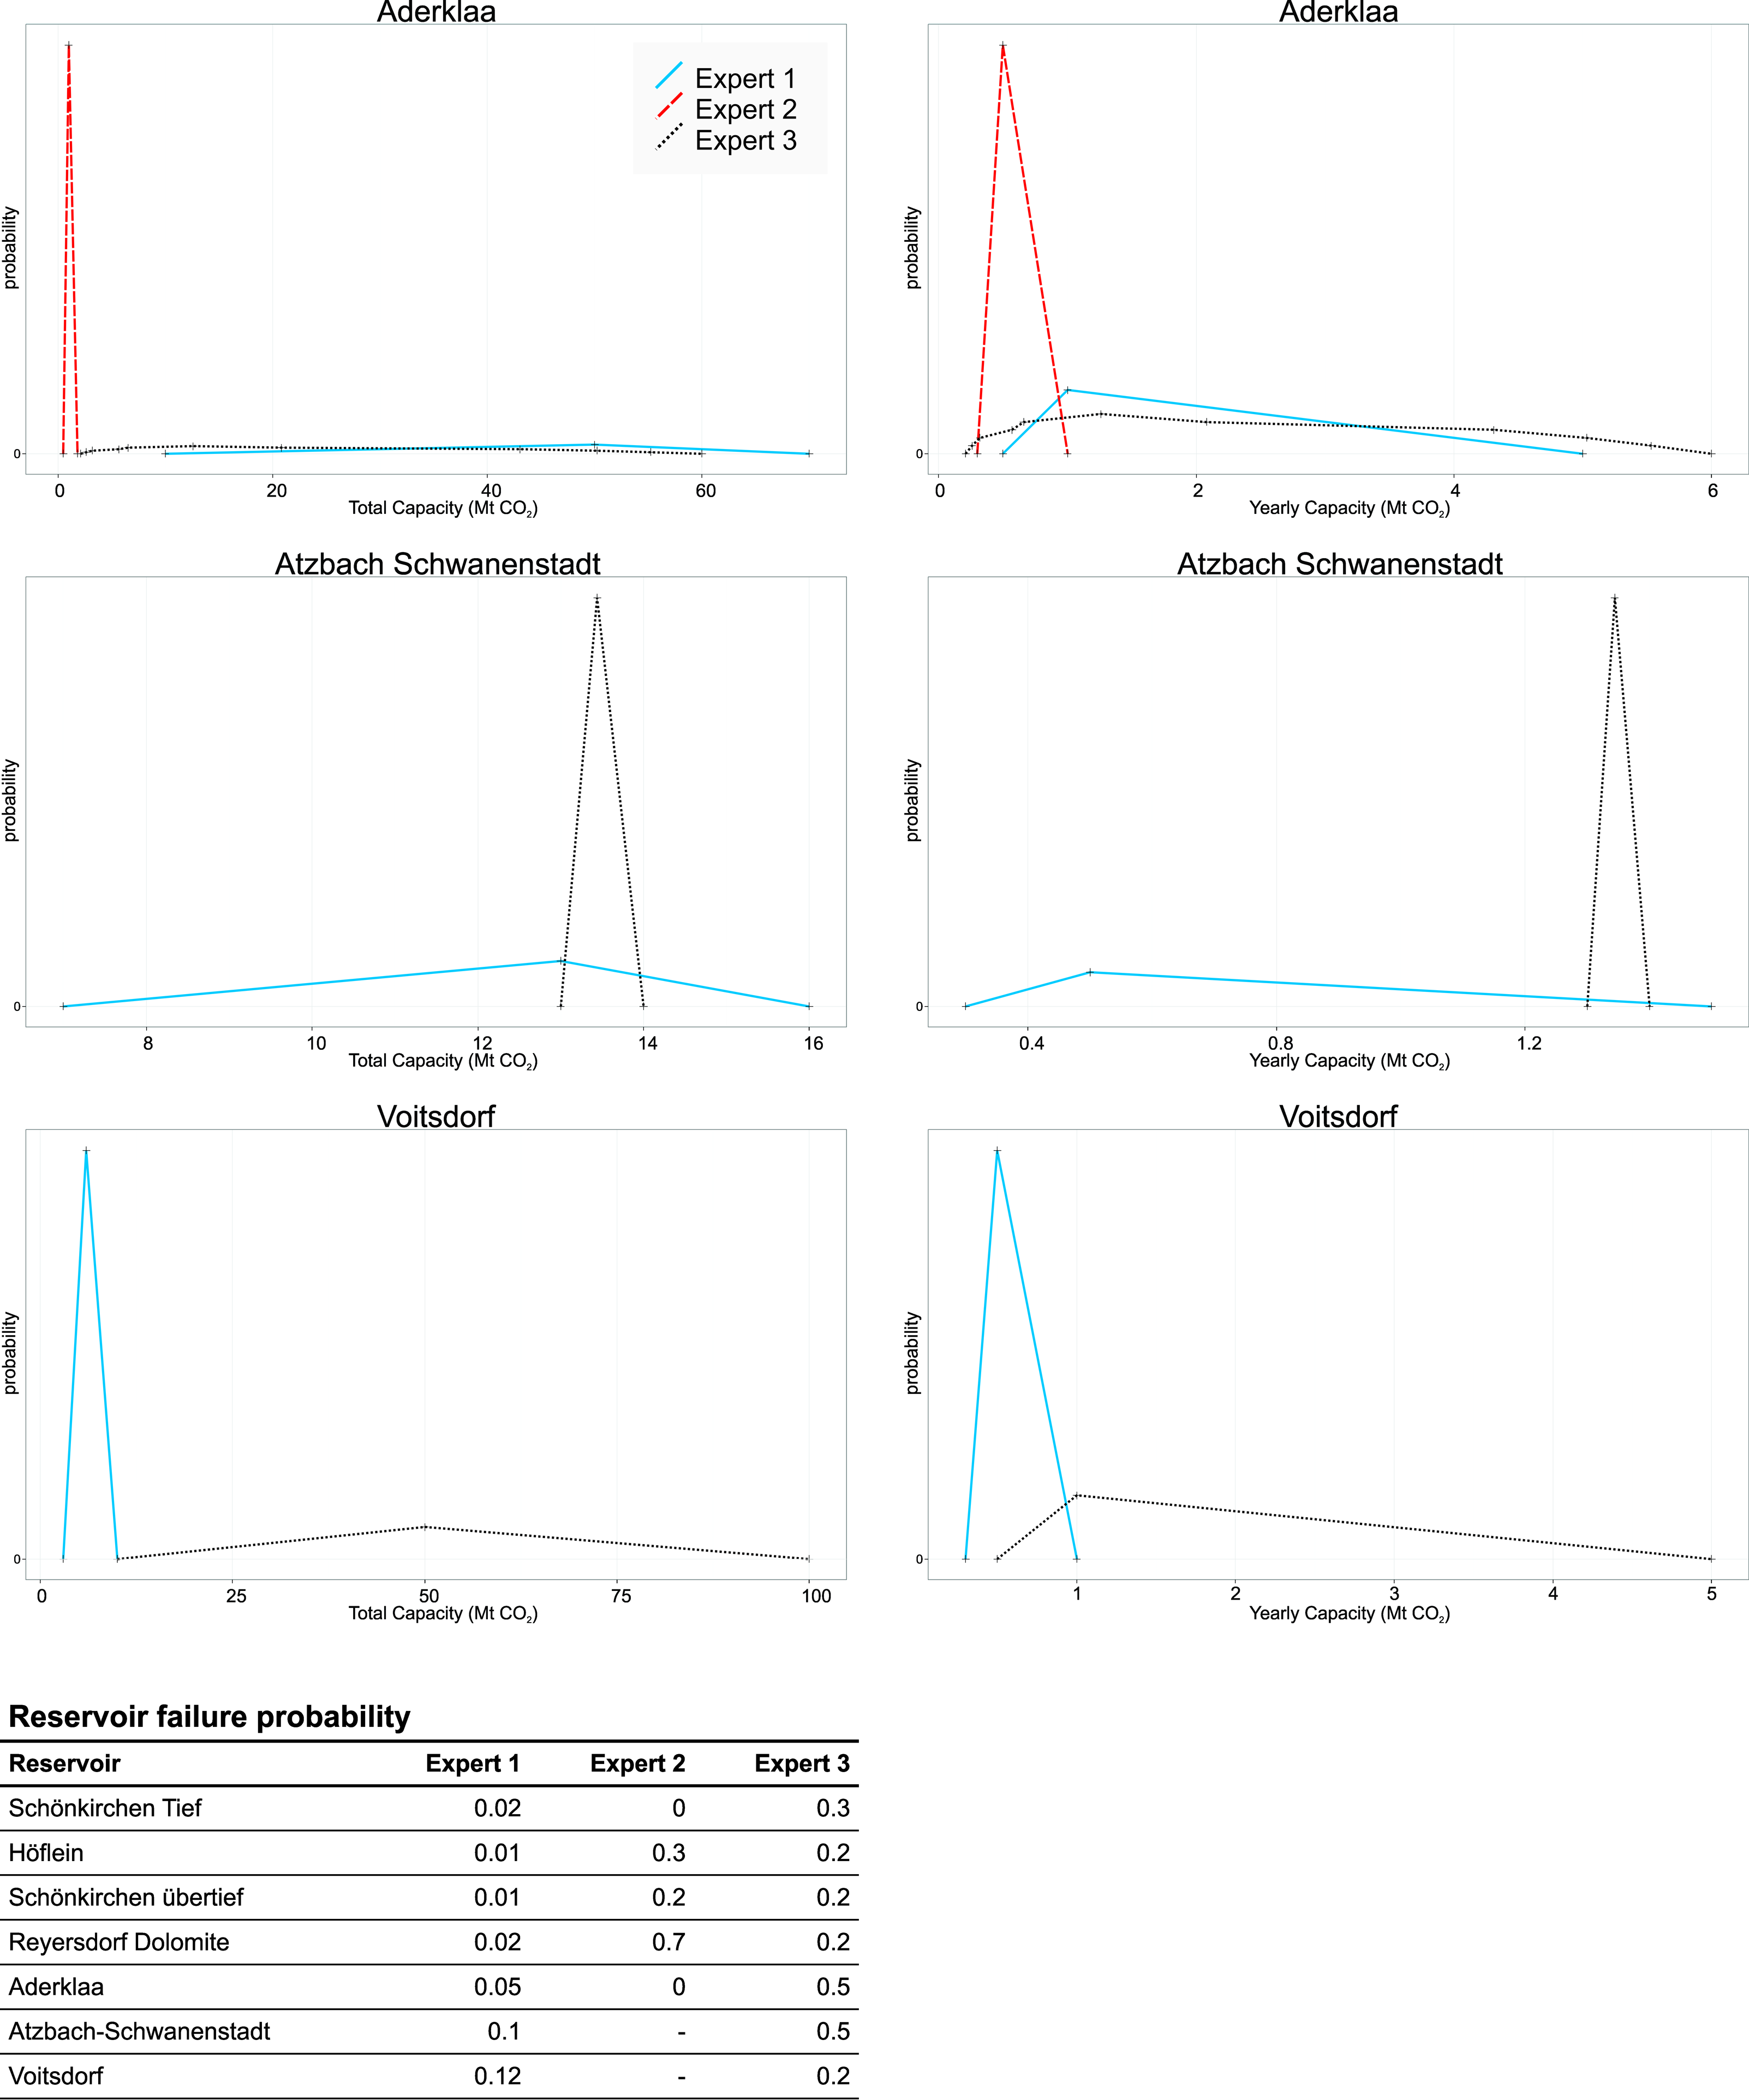
105Figure 9 continued. Expert 2 chose not to evaluate the Atzbach-Schanenstadt and Voitsdorf reservoirs.
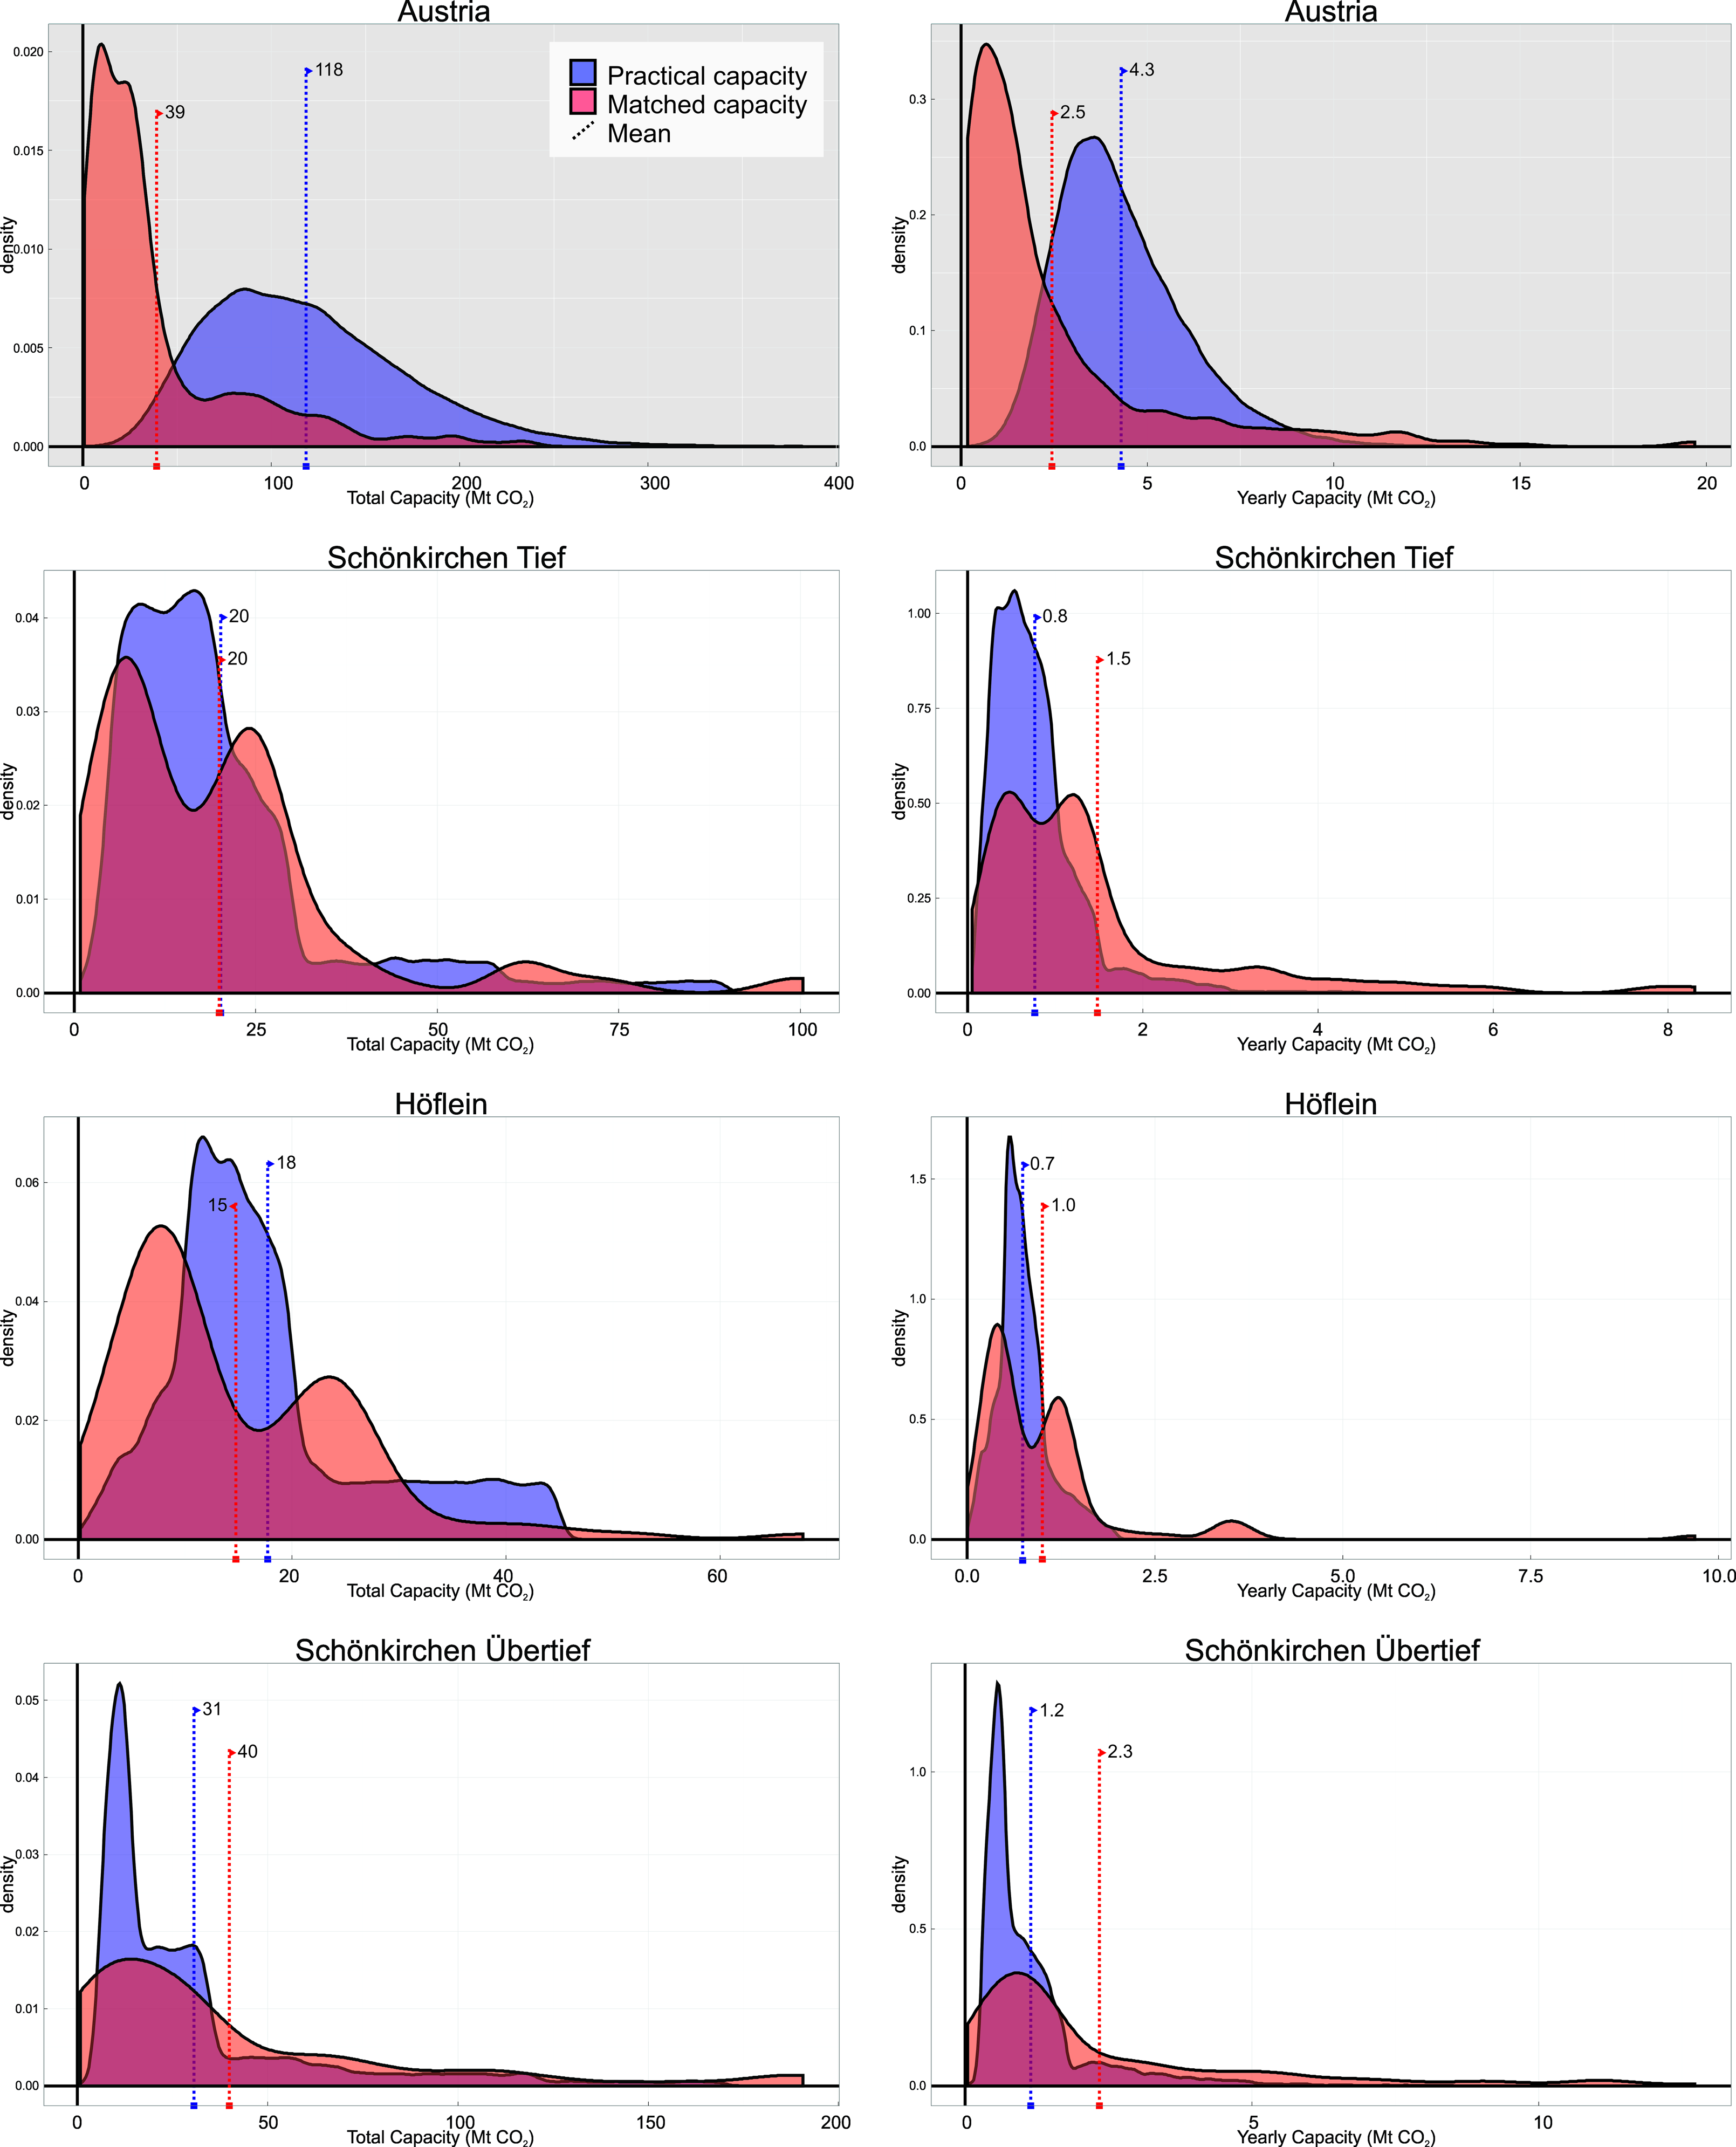
106Figure 10. Practical (blue) and matched (red) capacity probability density functions, as calculated by PSS Explorer and PSS III. Averages values are indicated by the dashed lines. A kernel density estimation with a normal distribution is used to construct these PDF’s from datasets with a finite population.
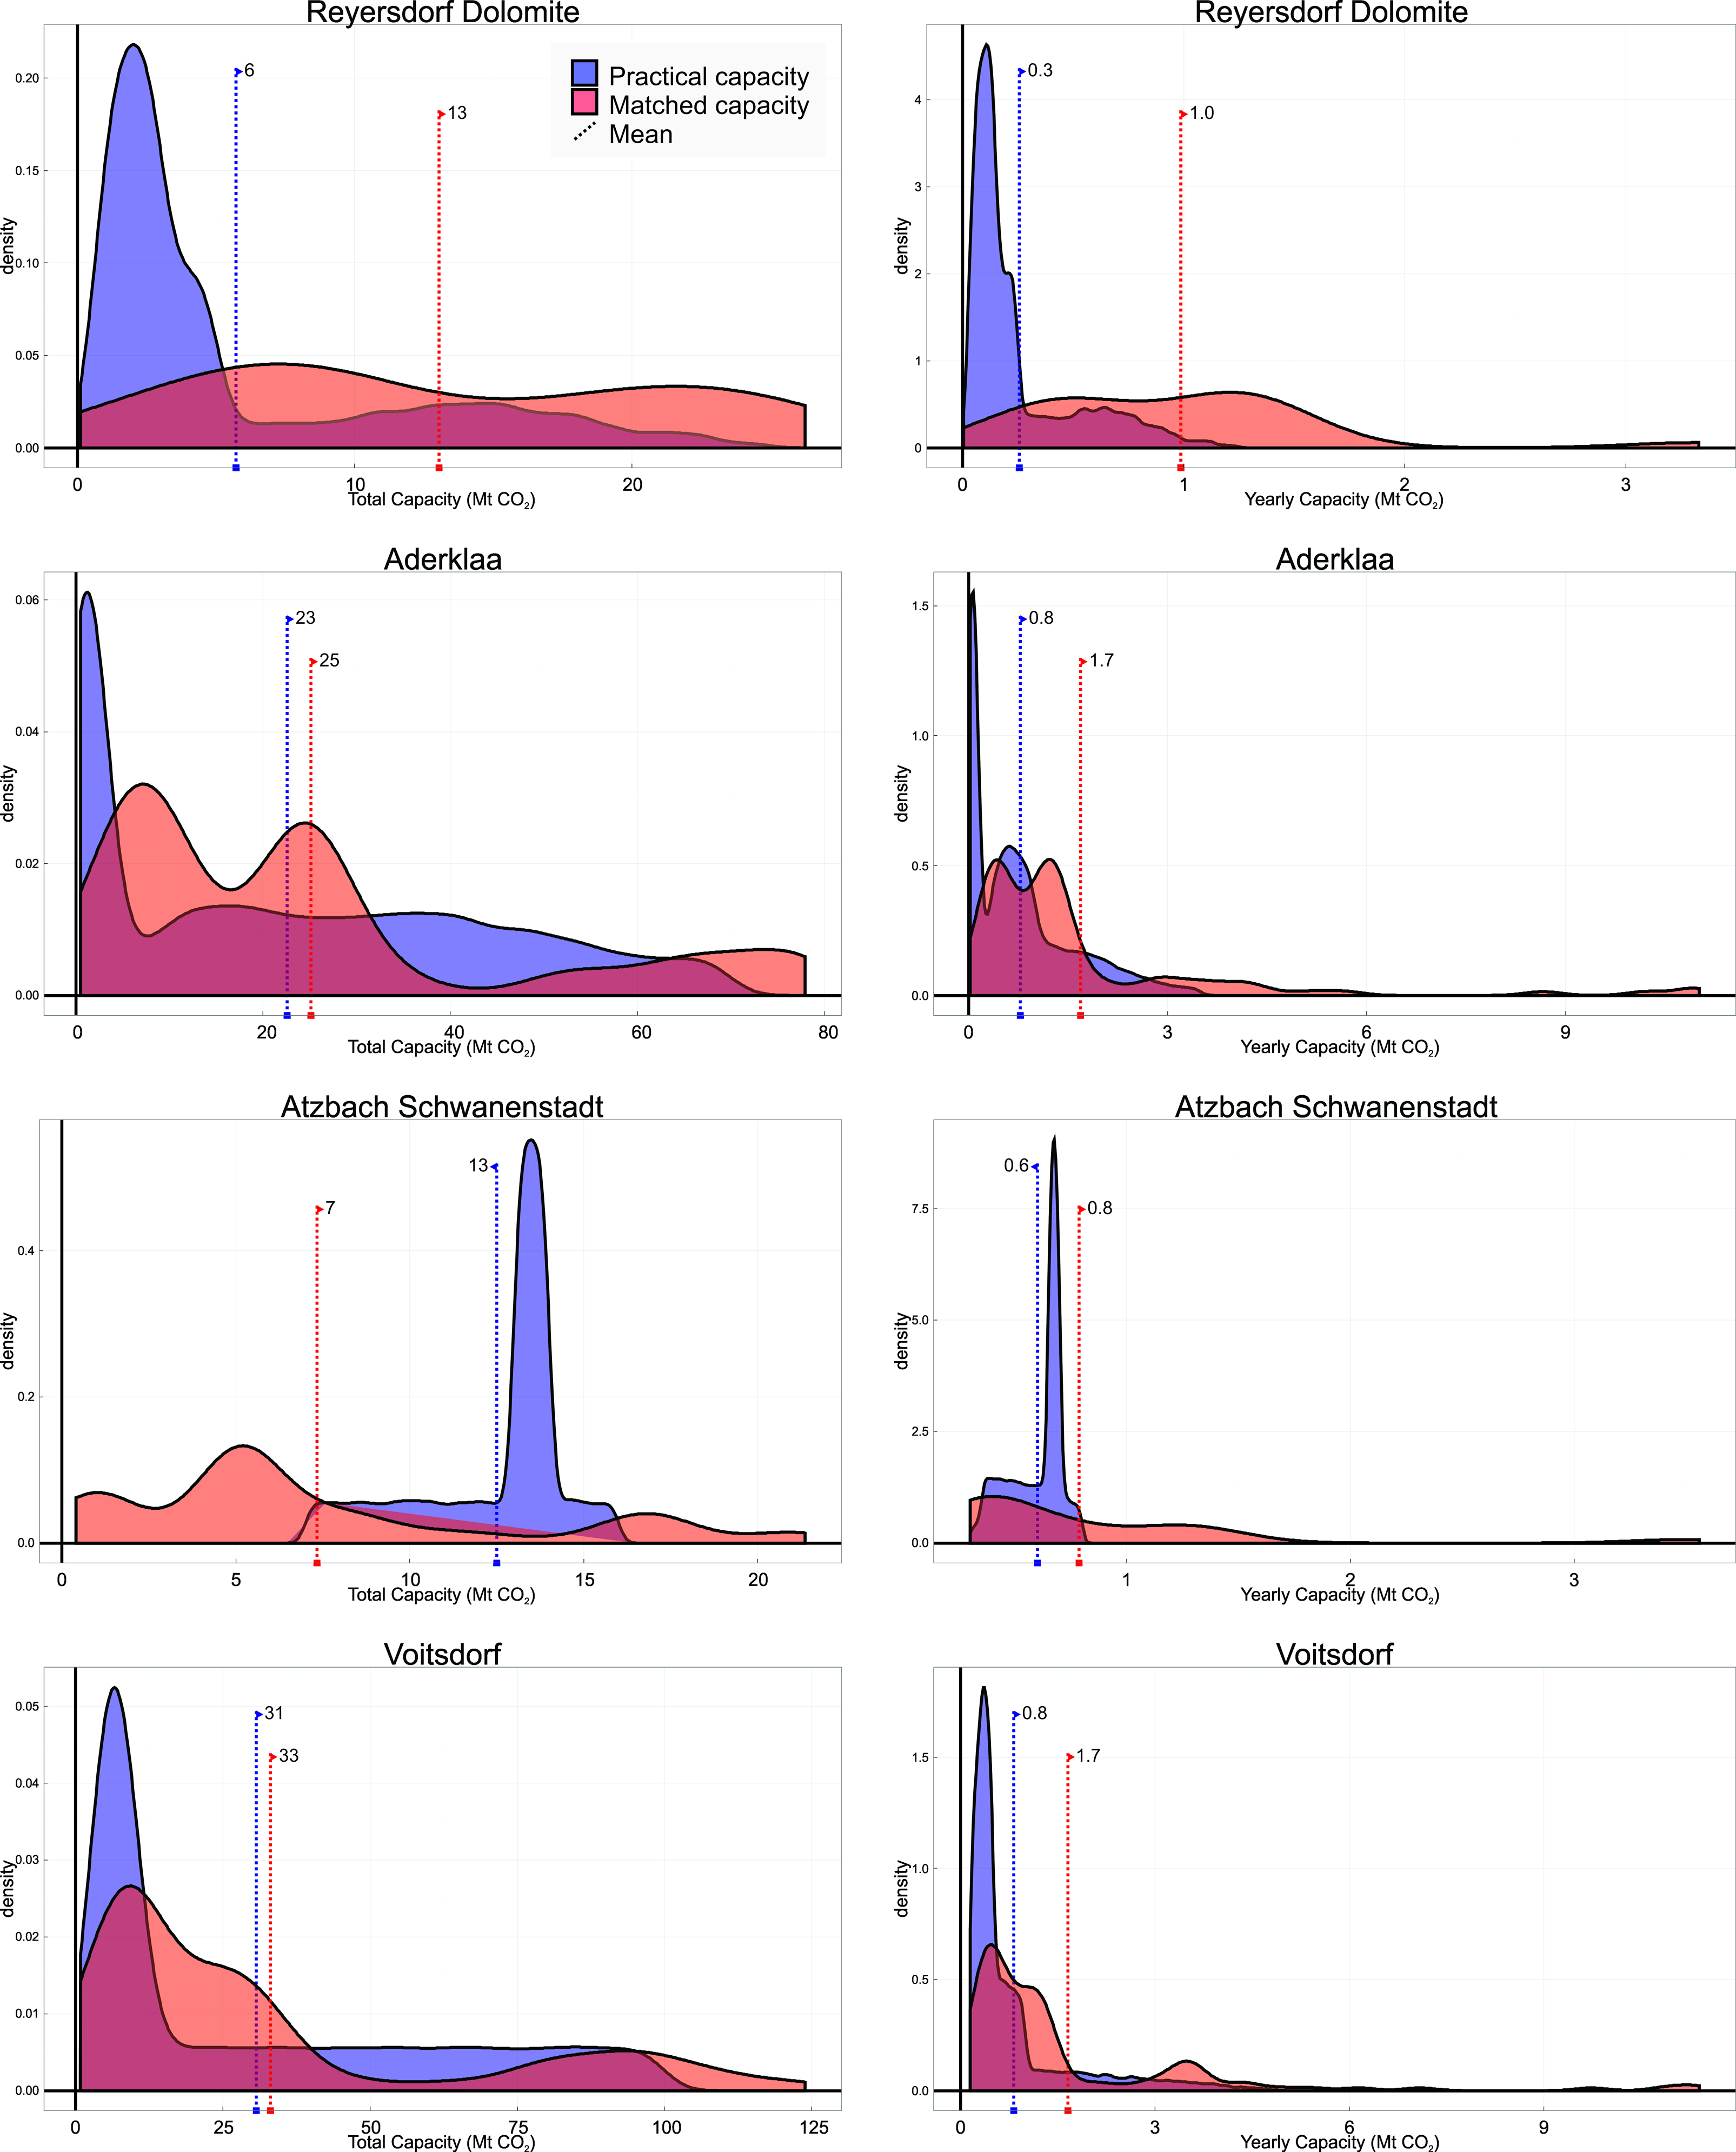
107Figure 10 continued.
To cite this article
