


- Portada
- Volume 20 (2017)
- number 1-2
- Platinum group element mineralization at Musongati (Burundi): concentration and Pd-Rh distribution in pentlandite


Vista(s): 7387 (44 ULiège)
Descargar(s): 543 (4 ULiège)

Platinum group element mineralization at Musongati (Burundi): concentration and Pd-Rh distribution in pentlandite

Abstract
The mafic-ultramafic intrusions of the Karagwe-Ankole belt in Burundi are considered as a new potential source for platinum group elements (PGE). The intrusions have mainly been studied for their PGE potential with regard to PGE concentration, but the mineralogical distribution of PGE has not been examined to the same level. This study focuses on the Pd and Rh distribution in pentlandite of ultramafic rocks of the Musongati layered intrusion. The results are based on whole rock and pentlandite analyses which were incorporated into a mass balance. Palladium proportions in pentlandite vary between 4 and 69%. Rhodium is present in proportions ranging from 1-39% in pentlandite. Other PGE distributions could not be determined in pentlandite due to concentrations below detection limits. The results from this study demonstrate that Pd and Rh are hosted by sulfides since sulfur saturation of the magma occurred early on, perhaps before or simultaneously with the precipitation of silicate minerals. Based on these findings, a preliminary model for the mineralization of PGE in the Musongati intrusion is proposed.
Tabla de contenidos
1. Introduction
1The platinum group elements (PGE: Ru, Rh, Pd, Os, Ir & Pt) are considered as critical metals (European Commission, 2014) and are highly valued for their high-tech applications. They are being recycled and intensely mined, but still deficits are experienced and expected in the coming years (European Commission, 2014). Since the large PGE deposits, such as the Bushveld Complex in South Africa and the Noril’sk-Talnakh deposits in Russia, will become depleted with time, new deposits need to be explored for their PGE potential, to sustain future demand.
2The mafic-ultramafic intrusions in Burundi, which are part of the Kabanga-Musongati alignment, are such potential deposits. They intruded the Mesoproterozoic rocks of the Karagwe-Ankole belt around 1375 Ma and form a SW-NE alignment of nine intrusions in Burundi, with further continuation towards Tanzania (Fig. 1; Fernandez-Alonso et al., 2012). Several drilling campaigns have been executed between 1970 and 1990 to explore the nickel and PGE potential of these intrusions (PNUD-UNDP, 1977; Exploration und Bergbau Gmbh, 1985;Deblond, 1994; Deblond & Tack, 1999). Although some limited data on the concentration of PGE in the boreholes of these campaigns is available (e.g. Klerkx, 1975, 1976), not much is known about the PGE distribution. In addition, the petrogenesis of the intrusions needs further elaboration, expanding on the work of e.g. Bandyayera (1997) and Duchesne et al. (2004).
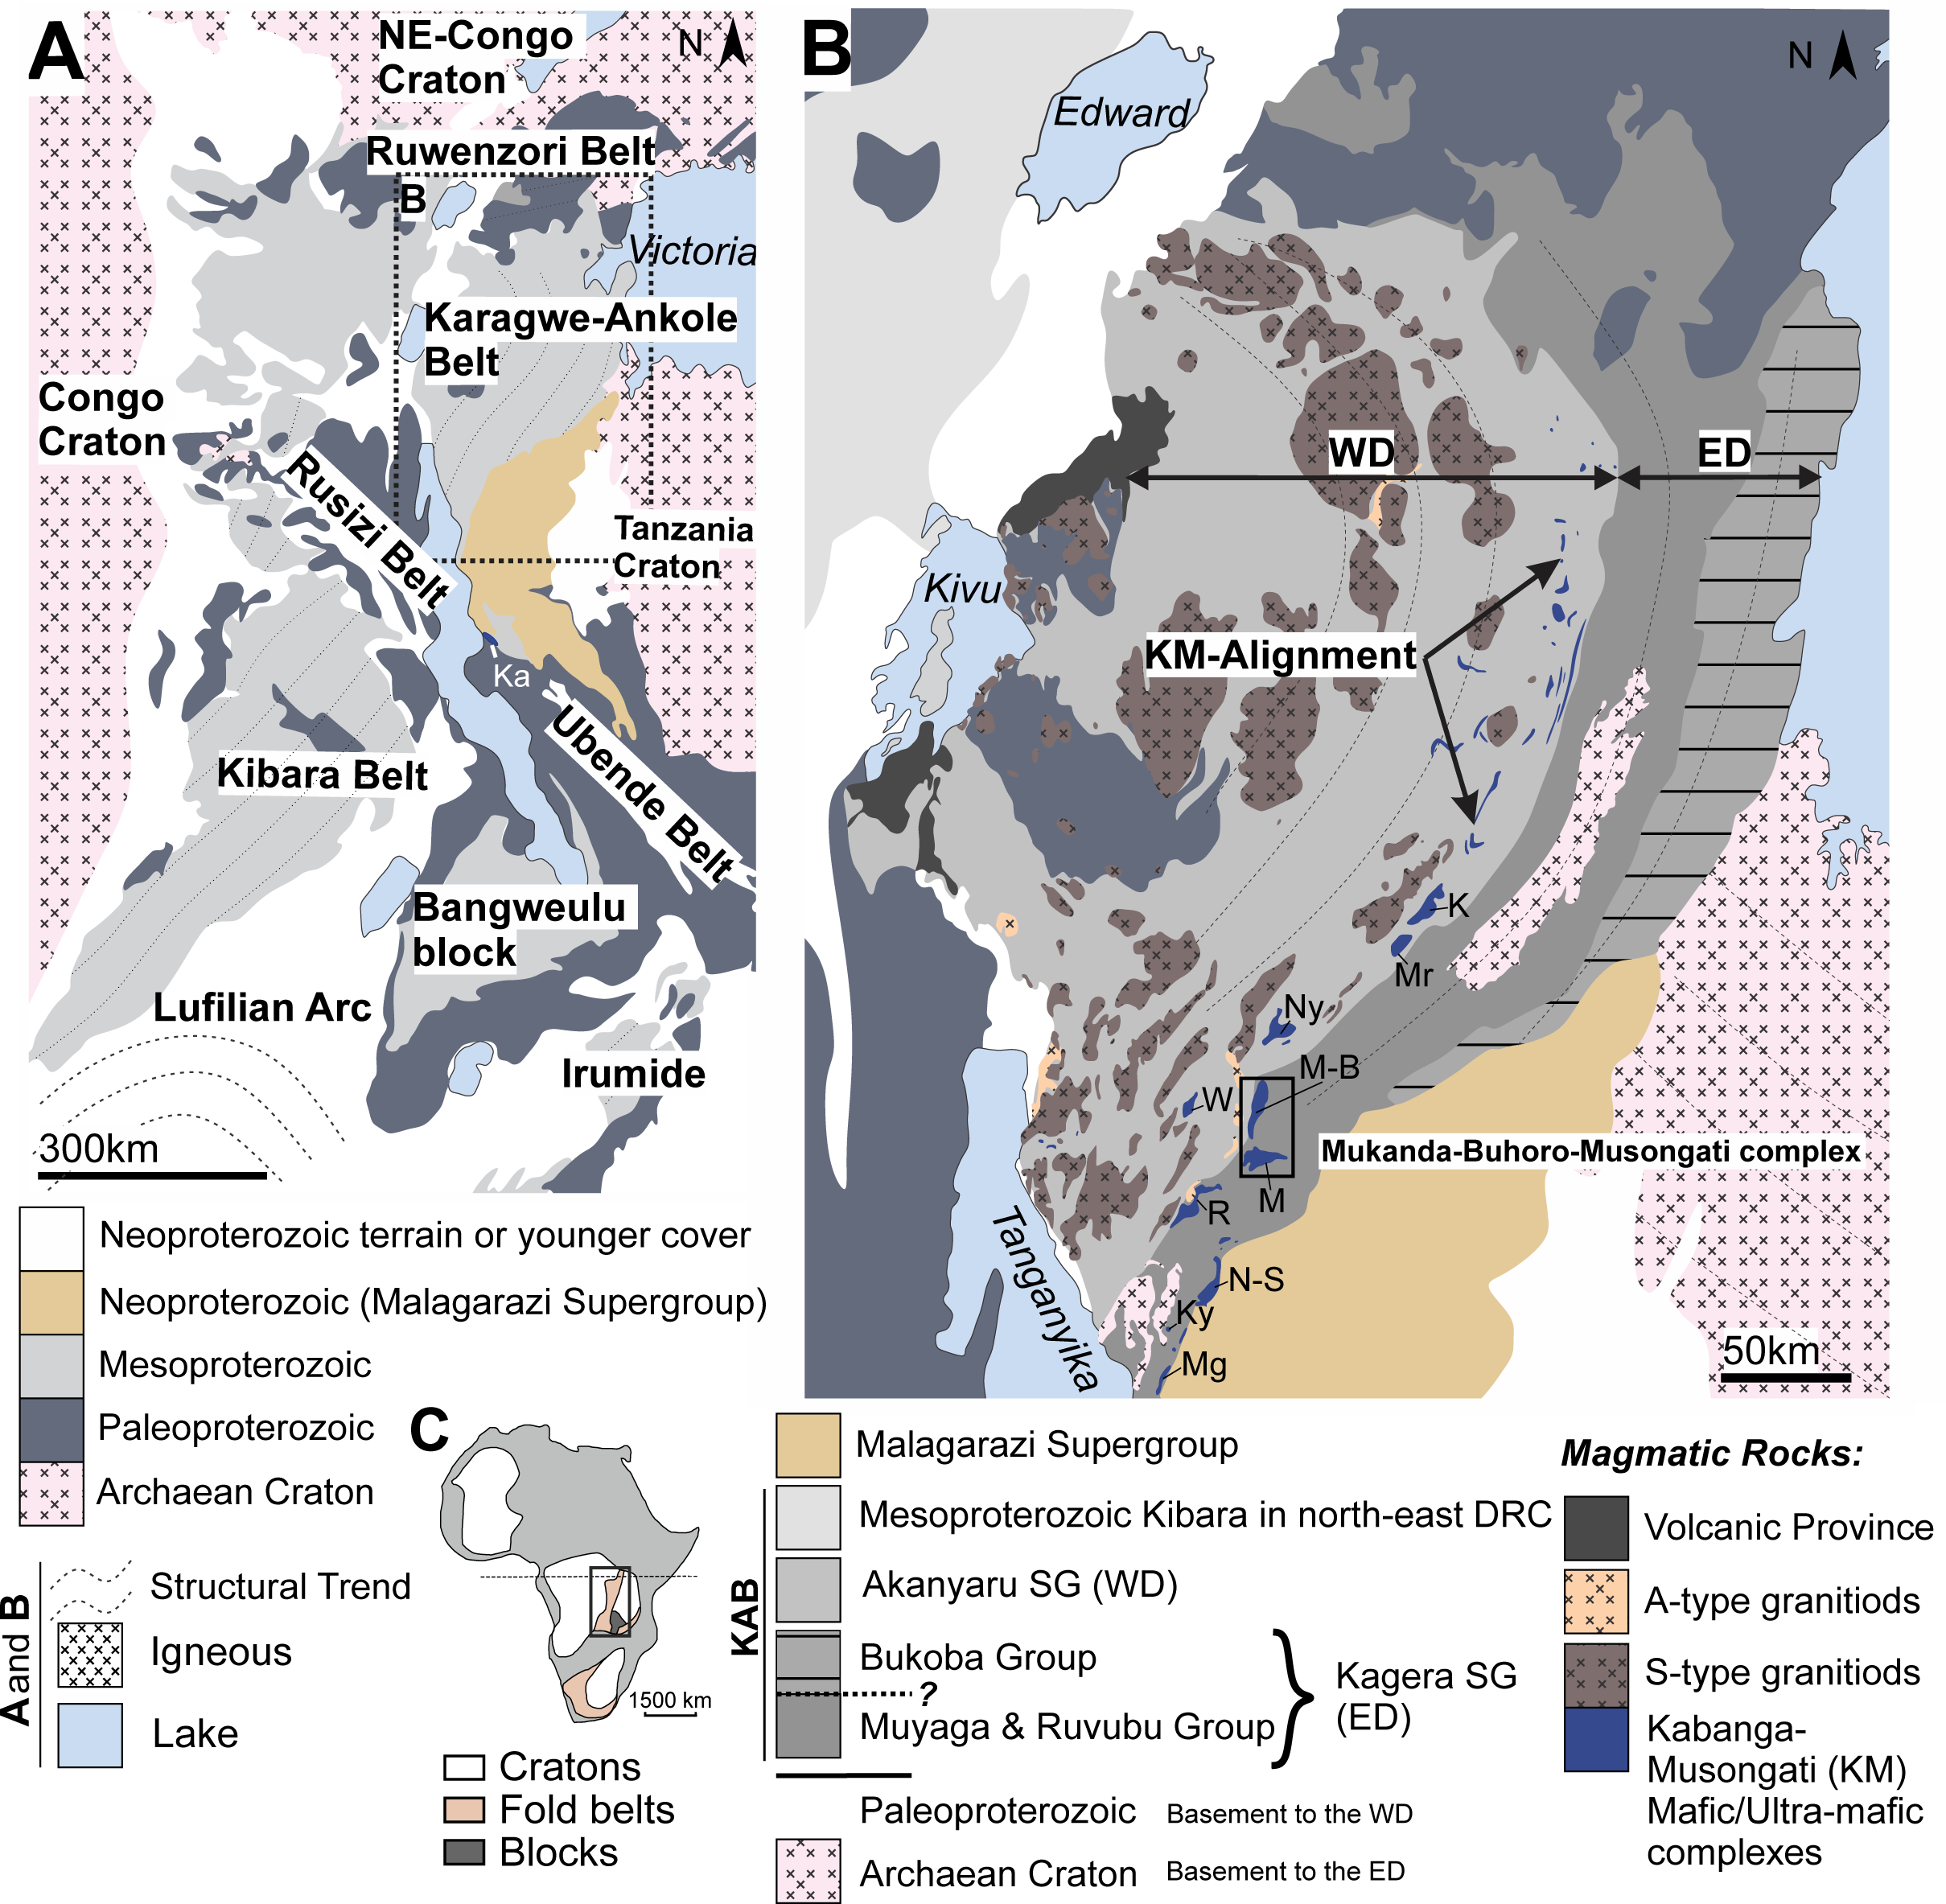
3Figure 1. (A) Regional geology of the Karagwe-Ankole fold belt (KAB) and the Kibara belt (KIB). (B) The KAB consists of the Western Domain (WD) and Eastern Domain (ED) indicated. The Mukanda-Buhoro-Musongati complex in the south of the KAB is. The Supergroups of both domains are shown in the legend. K: Kabanga; M: Musongati; Mr: Muremera; Ny: Nyabikere; M-B: Mukanda-Buhoro; W: Waga; R: Rutovu; N-S: Nyange-Songa, Ky: Kanyinya and Mg: Mugina (modified after Koegelenberg & Kisters, 2014). (C) Location of the KAB between the Congo craton in the West and the Tanzania craton and Bangweulu block in the East (modified after Maier et al., 2007).
4It is well known that PGE are collected during magmatic evolution in the base metal immiscible sulfide liquid along with other elements (Ag, As, Au, Bi, Cd, Co, Cu, Mo, Ni, Pb, Re, Sb, Se, Te and Zn) and form magmatic Ni-Cu-PGE sulfide ore deposits (Barnes & Maier, 1999; Naldrett, 2004). Examples are the Bushveld Complex in South Africa (e.g. Oberthür et al., 2015), the Creighton deposit in Sudbury in Canada (e.g. Franchuk et al., 2015) and the Noril’sk deposit in Russia (e.g. Malitch et al., 2014). The processes which control the distribution of these elements among the mineral phases are, however, not well constrained. Several authors mention that PGE are likely to be distributed in base metal sulfides (BMS; consisting of pyrrhotite, pentlandite and chalcopyrite), platinum group minerals (PGM) or as alloys (e.g. Barnes et al., 2006; Smith et al., 2014; Chen et al., 2015).
5Several formation models are considered for PGE mineralization. Firstly, based on chemical processes, there is the PGE clustering model which involves the formation of stable PGE complexes that can be incorporated into minerals (see further; e.g. Robb, 2005; Kennedy et al., 2013; Kennedy, 2014). A second model is the sulfide fractionation model, which is based on physical and chemical processes where an immiscible sulfide liquid incorporates the major part of PGE (see further; e.g. Dare et al., 2010; Chen et al., 2015). A third, relatively newer model, proposed by e.g. Mungall et al. (2015) is that of flotation of sulfide melt on vapor bubbles, in which the PGE are incorporated during their way up. Knowledge about where and in which phase(s) the PGE occur is, therefore, essential to obtain an insight in the ore-forming processes and hence to assess their recovery from raw materials.
6In this paper, the results of the investigations for the concentration of PGE in mafic-ultramafic rocks and the Pd and Rh distribution in pentlandite from the Musongati intrusion in Burundi will be discussed. The results are based on whole rock and sulfide phase analyses that were incorporated into a mass balance to calculate the Pd and Rh distribution. Based on these data a preliminary model for the PGE mineralization of the Musongati intrusion is proposed.
2. Geological setting
2.1. General setting
7The historical “Kibaran belt” as proposed by Cahen et al. (1984) that extends for ca. 1500 km from the Angola-Zambia-D.R. Congo border triple junction in the SW, through Katanga and Kivu-Maniema (DRC), Rwanda and Burundi, up to SW Uganda and SW Tanzania in the NE was redefined by Tack et al. (2010), since this Mesoproterozoic belt is cross-cut by the Paleoproterozoic Rusizi belt. This redefinition restricts the Kibara belt (KIB) to the parts of the belt occurring SW of the Rusizi belt, while the Karagwe-Ankole belt (KAB) occurs to the NE of the Rusizi belt (Fig. 1A). The Rusizian basement high is in structural continuity with the NW-SE trending Ubende shear belt further south in Tanzania (Tack et al., 2010; Fig. 1A). The apparent paradox of Paleoproterozoic belts cross-cutting Mesoproterozoic fold belts has been interpreted as the result of repeated crustal-scale reactivation along the pre-existing Ubende-Rusizi structures (Klerkx et al. 1998; Fernandez-Alonso et al., 2012).
8There are divergent views on the formation of the KAB and KIB. In the intracratonic model of Maier et al. (2008), Tack et al. (2010) and Fernandez-Alonso et al. (2012), the KAB formed (together with the KIB) at ca. 1.4-1.0 Ga as an intraplate far-field effect of the Rodinia amalgamation along the Southern Irumide belt (Fig. 1A). This intraplate deformation resulted in fold-and-thrust belts in a SW-NE direction. In the model of Kokonyangi et al. (2005, 2006), Koegelenberg & Kisters (2014) and Debruyne et al. (2015), the KAB and KIB formed in a regional subduction setting. The exact position of the suture line and its extension is unclear, though. Debruyne et al. (2015) reported that their whole rock petrochemical data combined with Sr-Nd data reinforces earlier evidence for a subduction setting.
2.2. Geology of the Musongati intrusion
9The Kabanga-Musongati (KM) alignment occurs in the KAB and consists of multiple intrusions of which nine are situated in Burundi, from NE to SW: Muremera, Nyabikere, Mukanda-Buhoro, Waga, Musongati, Rutovu, Nyange-Songa, Kanyinya and Mugina (Figs 1B & 2B; Deblond & Tack, 1999). The Mukanda-Buhoro intrusion is the northern extension of the Musongati intrusion. The Kabanga intrusion in NW Tanzania contains a nickel sulfide deposit (Maier & Barnes, 2010; Maier et al., 2010). The Kapalagulu intrusion in SW Tanzania (‘Ka’ on Fig. 1A) has been interpreted as a southern extension of the KM alignment. Therefore, the potential for mineralized mafic and ultramafic rocks can be argued to be more than 500 km long (Maier et al., 2008). A further description of the Tanzanian KM intrusions is given by Evans et al. (2000).
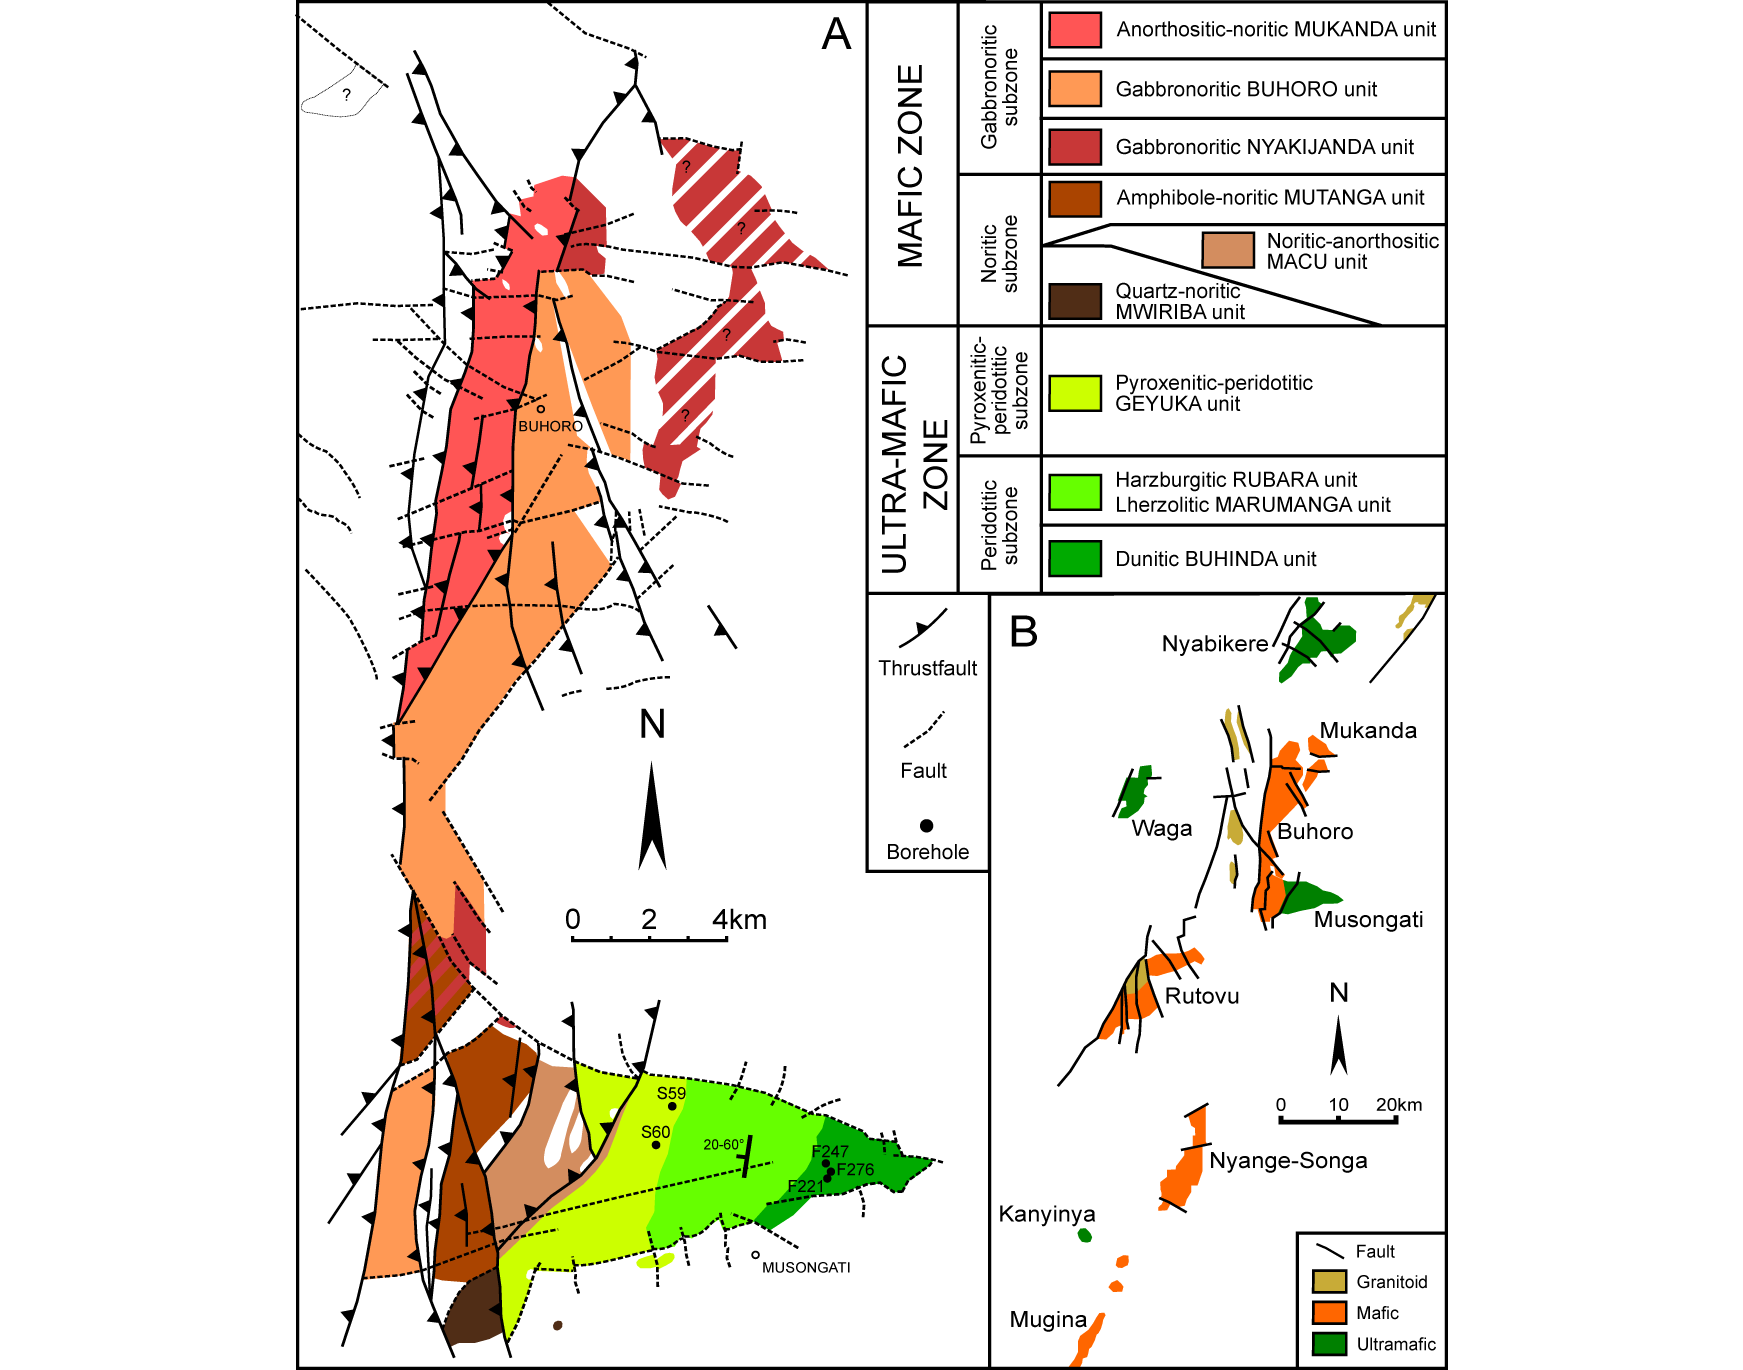
10Figure 2. (A) Simplified geological map of the Mukanda-Buhoro-Musongati complex indicating the boreholes and showing the stratigraphic succession (modified after Deblond, 1994; Duchesne et al., 2004). (B) SE-part of the KM alignment with A-type granitoids of the Gitega-Makebuka-Bukirasazi alignment (modified after Deblond & Tack, 1999; Duchesne et al., 2004).
11On Figure 2A, the Mukanda-Buhoro-Musongati (MBM) complex is illustrated with its mafic and ultramafic units. The units dip to the west – with dips ranging from 20-60°. This orientation is revealed by the layered character of the intrusion at the surface. The stratigraphic units identified within the MBM complex are divided into two zones by Deblond (1994) and Deblond & Tack (1999). Firstly, the ultramafic zone, also called the ultrabasic zone, is subdivided into a peridotitic and a pyroxenitic-peridotitic subzone. Secondly, the mafic zone or basic zone is subdivided into a noritic and a gabbronoritic subzone. From the bottom unit of the ultra-mafic zone up to the upper unit of the mafic zone, a progressive magmatic differentiation is observed (Duchesne et al., 2004).
12The ultramafic zone of the MBM complex consists, from the bottom up, of the dunitic Buhinda unit, the lherzolitic Marumanga unit and the harzburgitic Rubara unit that are grouped into the peridotitic subzone (Maier et al., 2008). They grade upwards into the alternating pyroxenites and peridotites of the Geyuka unit, grouped into the pyroxenitic-peridotitic subzone (Deblond, 1994; Deblond & Tack, 1999). The transition zone between the ultramafic and the mafic zones is characterized by homogeneous laminated orthopyroxenites (Deblond & Tack, 1999).
13The mafic zone is divided in a noritic subzone and a gabbronoritic subzone. The noritic subzone consists of three units. The anorthositic-noritic Macu unit, together with the quartz-noritic Mwiriba unit, overlay the transition zone. Further up, the amphibole-noritic Mutanga unit is characterized by a similar facies as the previous two units. The gabbronoritic subzone consists of three units which are interpreted as the result of at least three magma pulses (Deblond & Tack, 1999). The first gabbronoritic Nyakijanda unit can be seen as an early magma pulse or as a reheated border facies of the gabbronoritic subzone (Deblond & Tack, 1999). The gabbronoritic Buhoro and anorthositic-noritic Mukanda units complete the section.
3. Petrography
14A total of 23 thin sections and 42 polished sections were prepared and examined by plane polarized light (PPL) and crossed polarized light (CPL). The samples originate from different depths within several boreholes: F221, F247, F276, S59 and S60 (Fig. 2A). The first three boreholes were drilled during a drilling campaign by ‘Exploration und Bergbau Gmbh’ during 1983-1984 (Exploration und Bergbau Gmbh, 1985), while the latter two boreholes are part of a drilling campaign executed during 1973-1974 by the ‘United Nations Development Program’ (PNUD-UNDP, 1977). The depth of a sample is displayed behind the borehole number as a single number in the case when it represents the center, or as two numbers when it represents a range of depths. All samples are of uniform downhole length. Most samples were magnetic, as was observed in the hand specimens. The magnetism is due to the presence of magnetite and in some cases pyrrhotite, as the latter can also be magnetic if enough iron vacancies are present (Sagnotti, 2007).
15The thin sections of the samples were used to describe the different rock types, applying the IUGS classification (Le Bas & Streckeisen, 1991). Ultramafic rock compositions were observed ranging from peridotites (dunite, harzburgite, lherzolite, wehrlite) to pyroxenites (olivine orthopyroxenite, olivine clinopyroxenite). Mafic rocks (e.g. gabbronorite) were also observed, but to a lesser extent since the boreholes have mainly been executed in the ultramafic zone of the Musongati intrusion (see Fig. 2A). Rocks from boreholes F221, F247 and F276 are mainly dunites, containing more than 90% olivine and minor amounts (~10%) of clino- and orthopyroxene (Plate 1A). Rocks from boreholes S59 and S60 are more pyroxenitic although some have increased olivine content (Plate 1B). The latter rocks also contain 2-3% biotite. Some of the biotite grains have been retromorphosed to chlorite. Most rocks are cumulates and show indications of serpentinization, which can be very intense. Some rocks host minor amounts of carbonates (usually magnesite), occurring as alteration products of pyroxenes or replacing serpentine in veins (cf. Bandyayera, 1997). The Fo content in olivine ranges from 90% in the dunitic Buhinda unit over 88% in the lherzolitic/harzburgitic Marumanga/Rubara units, down to 83% in the upper part of the pyroxenitic-peridotitic Geyuka unit (Duchesne et al., 2004). The Mg# in Ca-rich pyroxenes ranges from the Buhinda unit up to the anorthositic-noritic Mukanda unit (Duchesne et al., 2004). Modal proportions of minerals and detailed Fo content in olivine and Mg# in pyroxenes can be found in detail in Deblond & Tack (1999) and Duchesne et al. (2004).
16The polished sections were used to describe the ore minerals present in the samples, which are mainly sulfides such as pyrrhotite, pentlandite and minor chalcopyrite. Oxides such as chromite, magnetite and other Fe-oxides (hematite, goethite) were also observed. The minerals pentlandite and pyrrhotite are the most important, accounting for ~85-90% of the sulfides. A minor amount of chalcopyrite (~10%) is also present. In dunitic rocks from boreholes F221, F247 and F276, pentlandite is more abundant than pyrrhotite. In the pyroxenitic rocks of boreholes S59 and S60, the opposite is the case. In all investigated samples, the base metal sulfides mainly occur interstitial to cumulate minerals. This indicates the classic texture associated with magmatic sulfides (Naldrett & Wilson, 1990). This texture, however, has sometimes been modified due to weathering. The sulfides do not occur as veins. Only in samples MU14BP14 (F247) and MU14BP31 (S59; Plate 1C), disseminations of sulfides and Fe-oxides were observed. The massive sulfide grains show many ‘pits’ and ‘troughs’ (Plate 1D). Very often the sulfides are surrounded by alteration zones which can consist of Fe-oxides such as magnetite, hematite and maghemite or sulfides such as violarite and bravoite (Plate 1E).
17Aside from the sulfides, spinel minerals make up most of the other reflecting minerals. They can be more iron-rich (magnetite) or chromium-rich (chromite). In sample MU14BP26, nice outlined spinel grains with high relief can be seen (Plate 1F). Both sulfide and spinel minerals are often located at the boundaries of olivine grains (Plate 1E). A contact on one side with a clino- or orthopyroxene grain is also common (especially in samples from the pyroxenitic rocks). No platinum group minerals (PGM) have been observed by optical microscopy in the polished sections. According to Jedwab (1987), electron microscopy should provide better results to confirm the presence or absence of PGM. Jedwab (1987) confirmed the presence of multiple PGM (e.g. sperrylite (Pt(As, Sb)2 and froodite (PdBi2)) which “display a clear paragenetic affinity for Fe-Ni sulfides and silicates, while they show a definite antipathy for chromite”.
4. Methodology
18For the determination of the concentration and the distribution of PGE, multiple techniques were used. The nickel sulfide fire assay (NiS FA) with tellurium co-precipitation method, followed by inductively coupled plasma – mass spectroscopy (ICP-MS), was used to determine whole rock PGE concentrations. Major and minor element concentrations (Co, Cr, Cu, Fe, Mn, Ni, Ti, S, V and Zn) were analyzed in whole rock samples by inductively coupled plasma – optical emission spectroscopy (ICP-OES) after so-called ‘near-total four acid’ digestion. The concentrations of PGE and other elements (Co, Cr, Cu, Fe, Ni and S) in pentlandite were analyzed by field emission gun – electron probe micro analysis (FEG-EPMA) and by laser ablation – inductively coupled plasma – mass spectroscopy (LA-ICP-MS). The data gathered from these analyses were used to calculate a mass balance describing the distribution of PGE between the different phases: sulfides, PGM or alloys. For accuracy and reproducibility data of the methods used in this study, one is referred to the Appendix (section 9). Detection limits are defined as three times the standard deviation of the analyzed blanks of the corresponding method.
4.1. Sample preparation
19All samples were carefully chosen based on a minimal degree of weathering and – especially due to small sample size – their weight. Fifteen grams is the required minimum amount for the NiS FA technique. Figure 3 shows the position of the samples selected from boreholes F247, S59 and S60. Furthermore, one sample from F221 and one from F276 were taken. The samples were crushed with a hammer on an iron plate to ensure that the particles were fine enough to be ground in an agate mortar that was cleaned between samples by grinding pure quartz sand. After being ground in the mortar, the samples were transferred into agate containers and put into a ball mill, i.e. a Philips MiniMill at speed 6 for eight minutes or a Fritsch Pulverisette 7 at 580 rpm for the same period of time. The resulting surface area of the sample should then be high enough for efficient fusion of the fire assay (Gros et al., 2002).
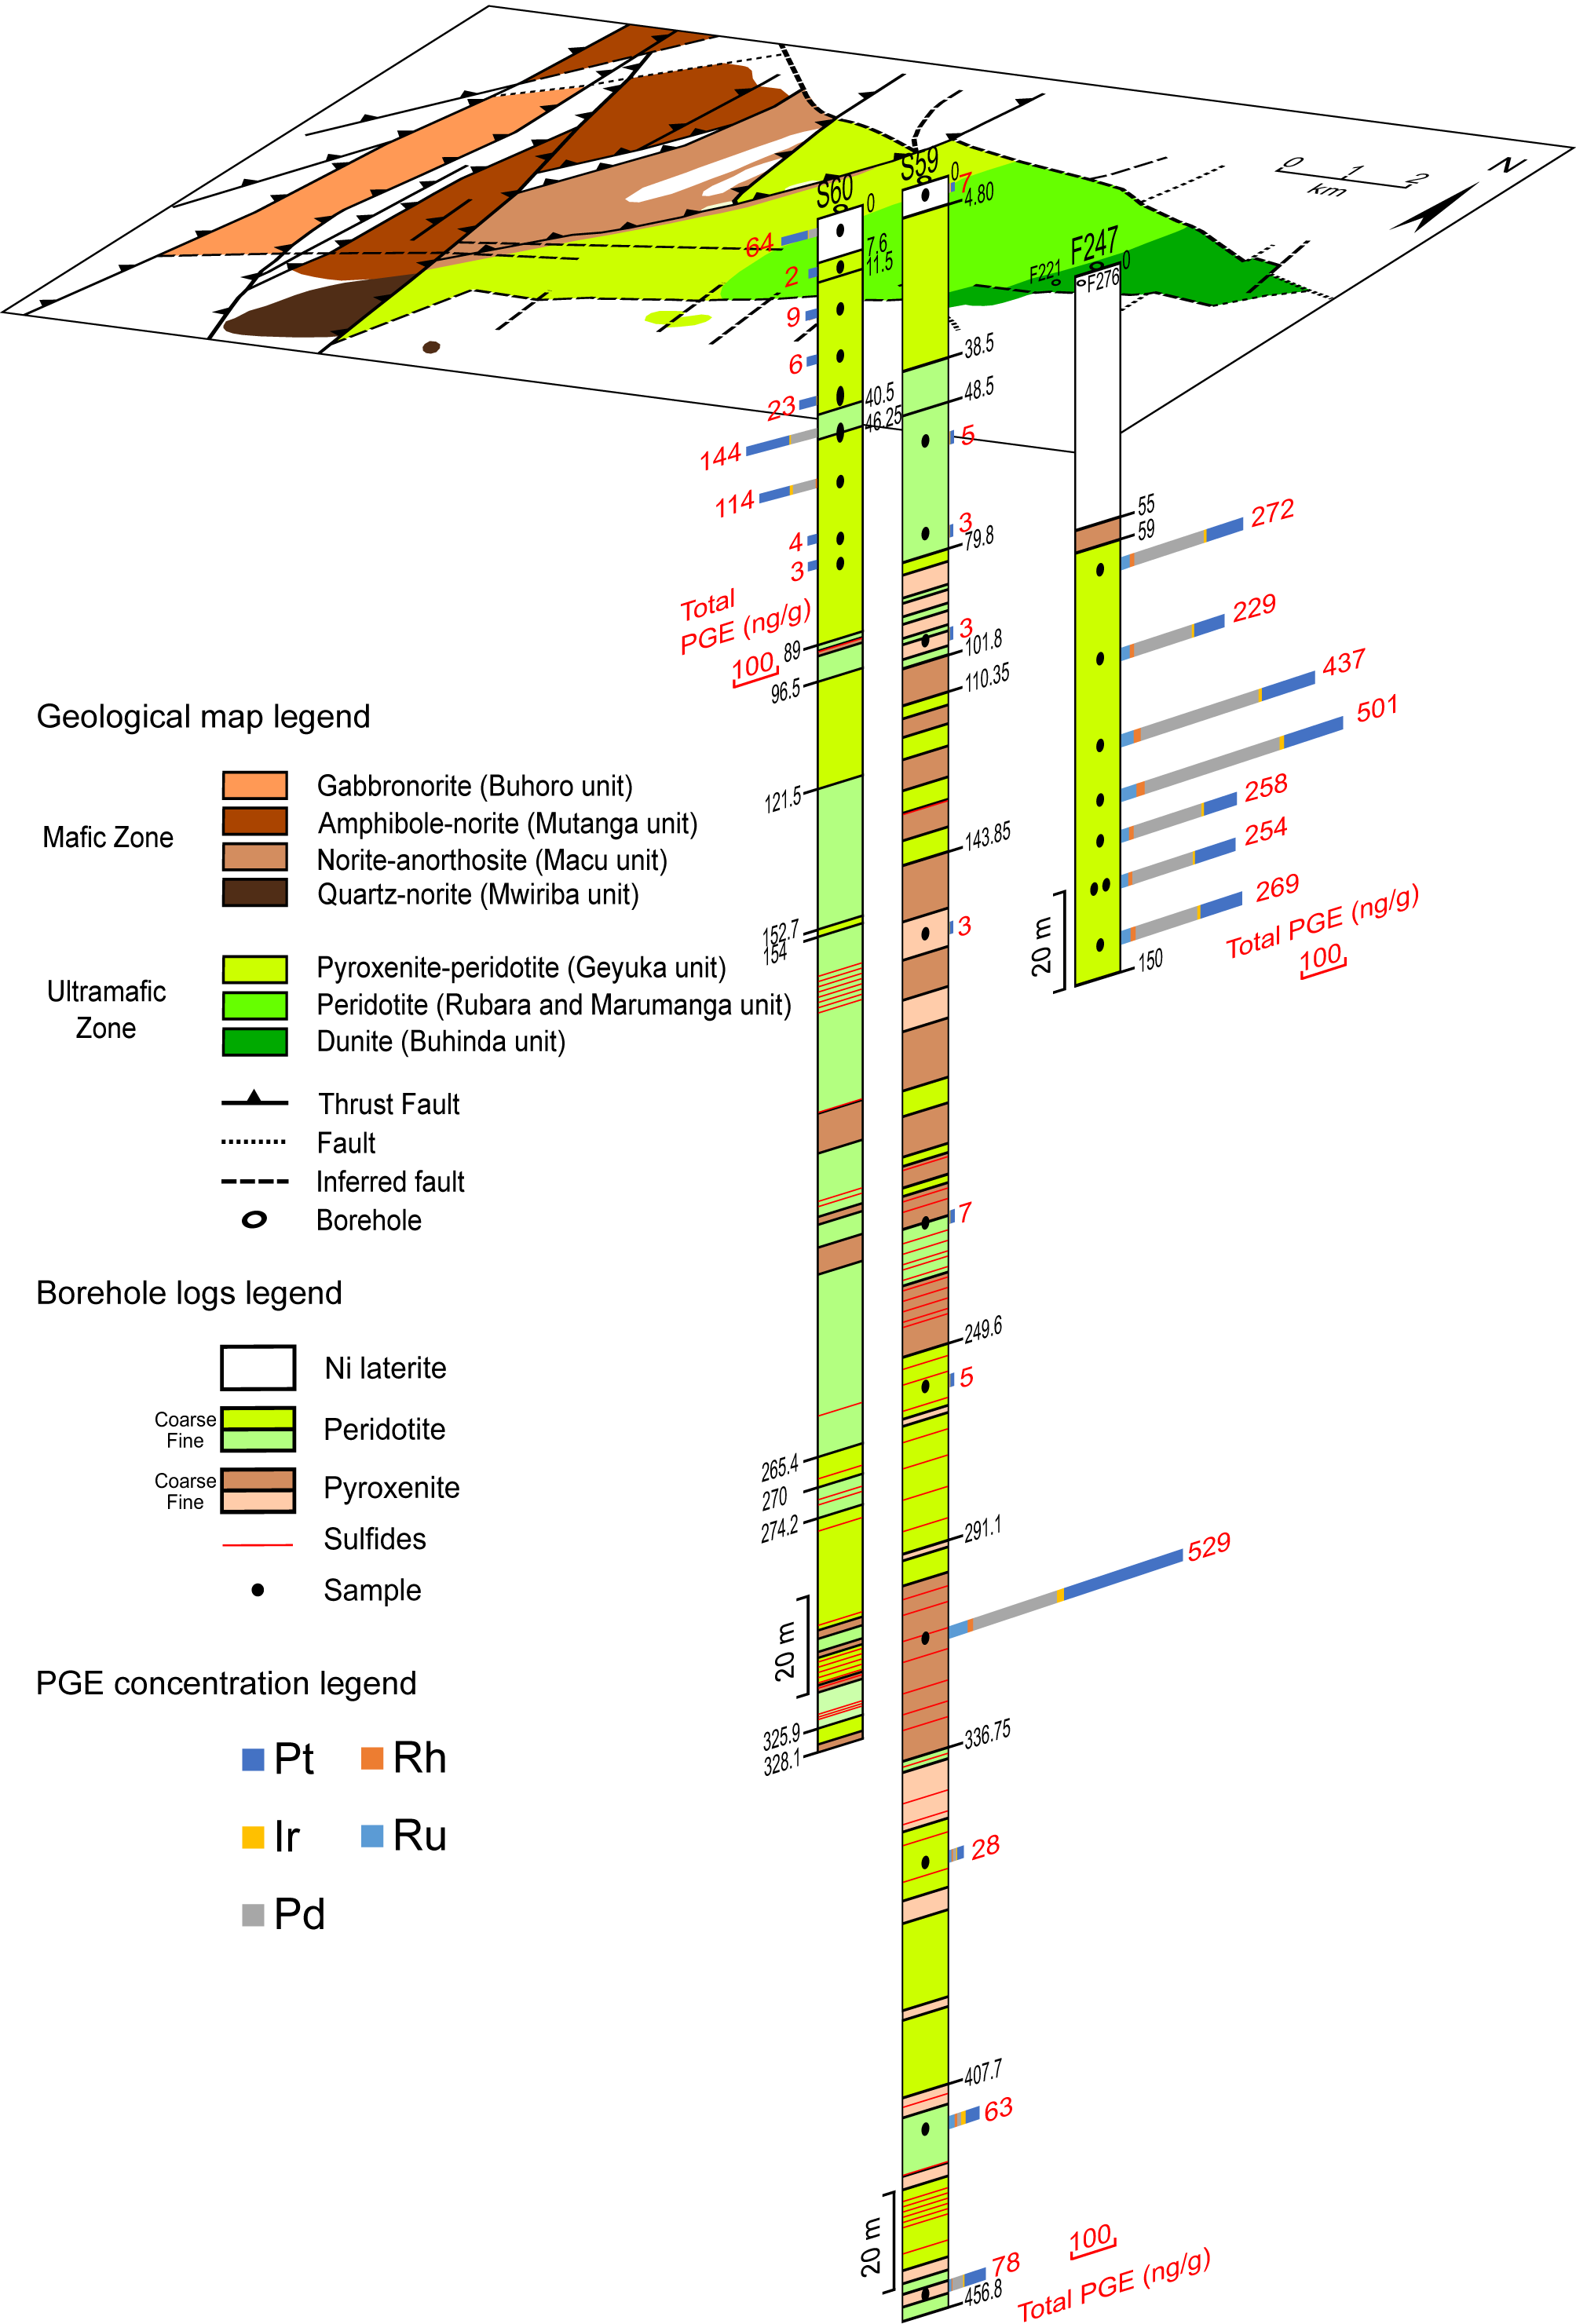
20Figure 3. Simplified geological map of the Musongati intrusion indicating the boreholes of which the samples are discussed in this paper (modified after Deblond, 1994; Bandyayera, 1997; Maier et al., 2008). Borehole logs of ‘sondages’ 59 and 60 (S59 & S60) and of ‘forage’ 247 (F247) are also depicted. Sulfide mineralization (pentlandite, pyrrhotite and chalcopyrite) is shown in red; documentation for sulfides in F247 could not be found. Logs of S59 and S60 are based on descriptions from the UNDP program by PNUD-UNDP (1977) and Klerkx (1975, 1976). Description of F247 is from Bandyayera (1997). The total PGE concentrations in ng/g are also marked for the samples of boreholes F247, S59 and S60 with relative subdivision for each PGE.
4.2. Nickel Sulfide Fire Assay with Tellurium co-precipitation
21For the determination of the PGE concentration in the whole rock samples, the NiS FA method with tellurium co-precipitation was used. The procedure that was followed during our research was based upon the methodologic approaches described in Oguri et al. (1999), Huber et al. (2001), Gros et al. (2002) and Juvonen et al. (2002). NiS FA was chosen as the decomposition step since complex geological samples of large sample masses were to be analyzed and all PGE, except Os, had to be extracted quantitatively. The pre-concentration step by Te co-precipitation was necessary to ensure a quantitative collection and to exclude as many as possible interferences coming from associated base metals. The least possible number of steps was targeted to minimize contamination and thus keeping reagent blank levels as low as possible. Cleaning of all used glass work with ‘aqua regia’ also proved to be of importance. Although this method has higher costs, its cost-effectiveness is better than other methods because of its good recoveries and adequate detection limits (Rao & Reddi, 2000; Balcerzak, 2002). Only Os cannot be determined accurately since it forms volatile osmium tetra‑oxide with HNO3 during the final dissolution step (Juvonen et al., 2002).
22Fifteen grams of crushed sample were mixed with 20 g Na2B4O7, 10 g Na2CO3, 3 g SiO2, 3 g S and 5 g Ni. After the mixture had been transferred into a fire clay crucible, it was put into a muffle furnace at 1000 °C for at least 75 minutes to be completely molten. After cooling, the crucible was broken and the nickel sulfide button that formed was taken out for dissolution in 12M hydrochloric acid. After the nickel sulfide button was completely dissolved, Sn and Te solutions were added to induce the precipitation of PGE. This step resulted in the formation of a black precipitate which was filtered off in a next step in a vacuum pump system setup by using a mix cellulose ester membrane. This membrane with the precipitate was then dissolved in HNO3 and HCl to obtain the final solution for ICP-MS analysis.
4.3. Analysis of NiS fire assay solutions
23All samples were measured by ICP-MS at the Department of Chemical Engineering of the KU Leuven. The ICP-MS apparatus used was a Thermo Elemental X-series with collision cell technology (CCT). The isotopes 101Ru, 103Rh, 105Pd, 193Ir and 195Pt were measured and used to calculate concentrations, automatically correcting for natural abundances. To monitor the instrumental drift, 69Ga, 115In and 205Tl were used as internal standards. Calibration solutions for ICP-MS were prepared from a certified ‘multi-element Solution 3’ (Spex certiprep, USA), containing Ru, Rh, Pd, Ir and Pt.
4.4. Analysis of four acid digestion solutions
24All samples were analyzed for chalcophile and other elements (Co, Cr, Cu, Fe, Mn, Ni, Ti, S, V, Zn) by ICP-OES. A Varian 720-ES (ICP-OES with axially viewed plasma), supplied with a double-pass glass cyclone spray chamber, a concentric glass SeaSpray nebulizer and an extended high solids torch, was used. Calibration solutions for ICP-OES were prepared from certified Plasma HIQU single element solutions (Chem-Lab, Belgium). Sensitivity, linear dynamic range and freedom from spectral interferences were taken into consideration during wavelength selection for each element. The sample solutions were prepared by using so-called ‘near-total four acid’ digestion with concentrated HCl, HNO3, HClO4 and HF.
4.5. FEG-EPMA of sulfides
25Eight samples were chosen based on their high PGE concentrations determined by ICP-MS to be analyzed by non-destructive FEG-EPMA. A FEG-EPMA comprises a suite of techniques, but for this study only the electron microscope and the wavelength dispersive spectrometers (WDS) of the JEOL JXA-8530F located at the Department of Materials Engineering of the KU Leuven were used. The FEG is a high brightness Schottky field emission electron gun which allowed for very high X-ray spatial resolutions (down to 0.1 μm).
26Sulfide minerals in the polished sections were marked by carving 1-4 mm circles around them with a diamond crystal for relocation during the electron microscopy. Afterwards, a carbon coating of 25 nm was applied by a Quorum Q150T E carbon evaporation system. The pulse current and duration were 65 mA and 5 s, respectively. Before mounting the samples in a sample holder, aluminum foil was wrapped around the polished sections to ensure electric conductivity.
27The setup of the PGE measurements by FEG-EPMA was based on Junge et al. (2015). An acceleration voltage of 20 kV, a 120 nA beam current, a beam diameter of 2‑3 μm and 180 s measuring time with 60 s background, before and after the analysis, were used. The setup for the calibration standards had an acceleration voltage of 20 kV, a beam current of 20 nA, a beam diameter of 3-5 μm and a measuring time of 10 s, with 5 s before and after the analysis for the measurement of the background signal. Pentlandite was used as the standard for Ni and Co, software standards supplied by JEOL for Cu, Fe and S and pure metals for the PGE. The working distance ranged between 10.8‑11.0 mm.
28The diffraction crystals used for the WDS system were LiF (lithium fluoride) for Fe, Ni, Co and Cu and PET (Pentaerythritol) for the PGE and S. The ability of the software to adjust the position of the peak was enabled (‘auto-peaking’) since this provided better results, in order to obtain a 100% mass balance. The slight deviation from theoretical peak positions could be due to the orientation of the analyzed mineral (P. L’hoëst 2015, pers. comm.).
4.6. LA-ICP-MS analysis of sulfides
29The PGE and other element concentrations were measured by LA-ICP-MS at the Royal Museum for Central Africa (Tervuren, Belgium). The ICP-MS apparatus used was a Thermo Scientific X-Series 2 with CCT. The laser ablation apparatus was a New Wave Research UP‑193 FX Fast Excimer.
30During all measurements the laser beam had a diameter of 100 μm, a fluence of 8‑9 J/cm², an irradiance of ~2 GW/cm² and a laser pulse rate of 30 Hz. The large beam diameter was necessary to allow PGE to be detected at very low levels. Measurements were carried out in a helium atmosphere, with a gas flow of 0.65 l/min. Before entering the ICP‑MS, the gas was mixed with a 0.56 l/min flow of argon. Blank gas levels were measured for 15 s, before the sample was measured for 40 s. The following isotopes were measured in time-resolved mode with a dwell time of 10 ms/peak per isotope: 33S, 56, 57Fe, 59Co, 60, 62Ni, 63, 65Cu, 103Rh, 105Pd, 193Ir and 194, 195Pt.
31A total of 18 spot analyses were performed on 9 different pentlandite grains (zones) of three samples. A specific time resolved spectrum was chosen to exclude inclusions of accessory minerals before calculating the average signal. 57Fe was chosen as the internal standard using Fe values for the pentlandite grains determined by FEG-EPMA. The weight percentages measured by FEG-EPMA were recalculated to 100% for the recalibration with 57Fe of the LA-ICP-MS results.
32Data reduction was carried out using the PlasmaLab software (Thermo Elemental) by subtracting gas background from each of the analyzed isotopes. The isotopes used for the concentration of the elements were 56Fe, 59Co, 62Ni, 63Cu, 103Rh, 105Pd, 193Ir and 195Pt. Corrections for natural abundances were applied automatically. No corrections for possible interferences were made, although the isotopes measured were chosen in such a manner to avoid interferences (Barnes et al., 2008).
5. Results
5.1. Whole rock analysis
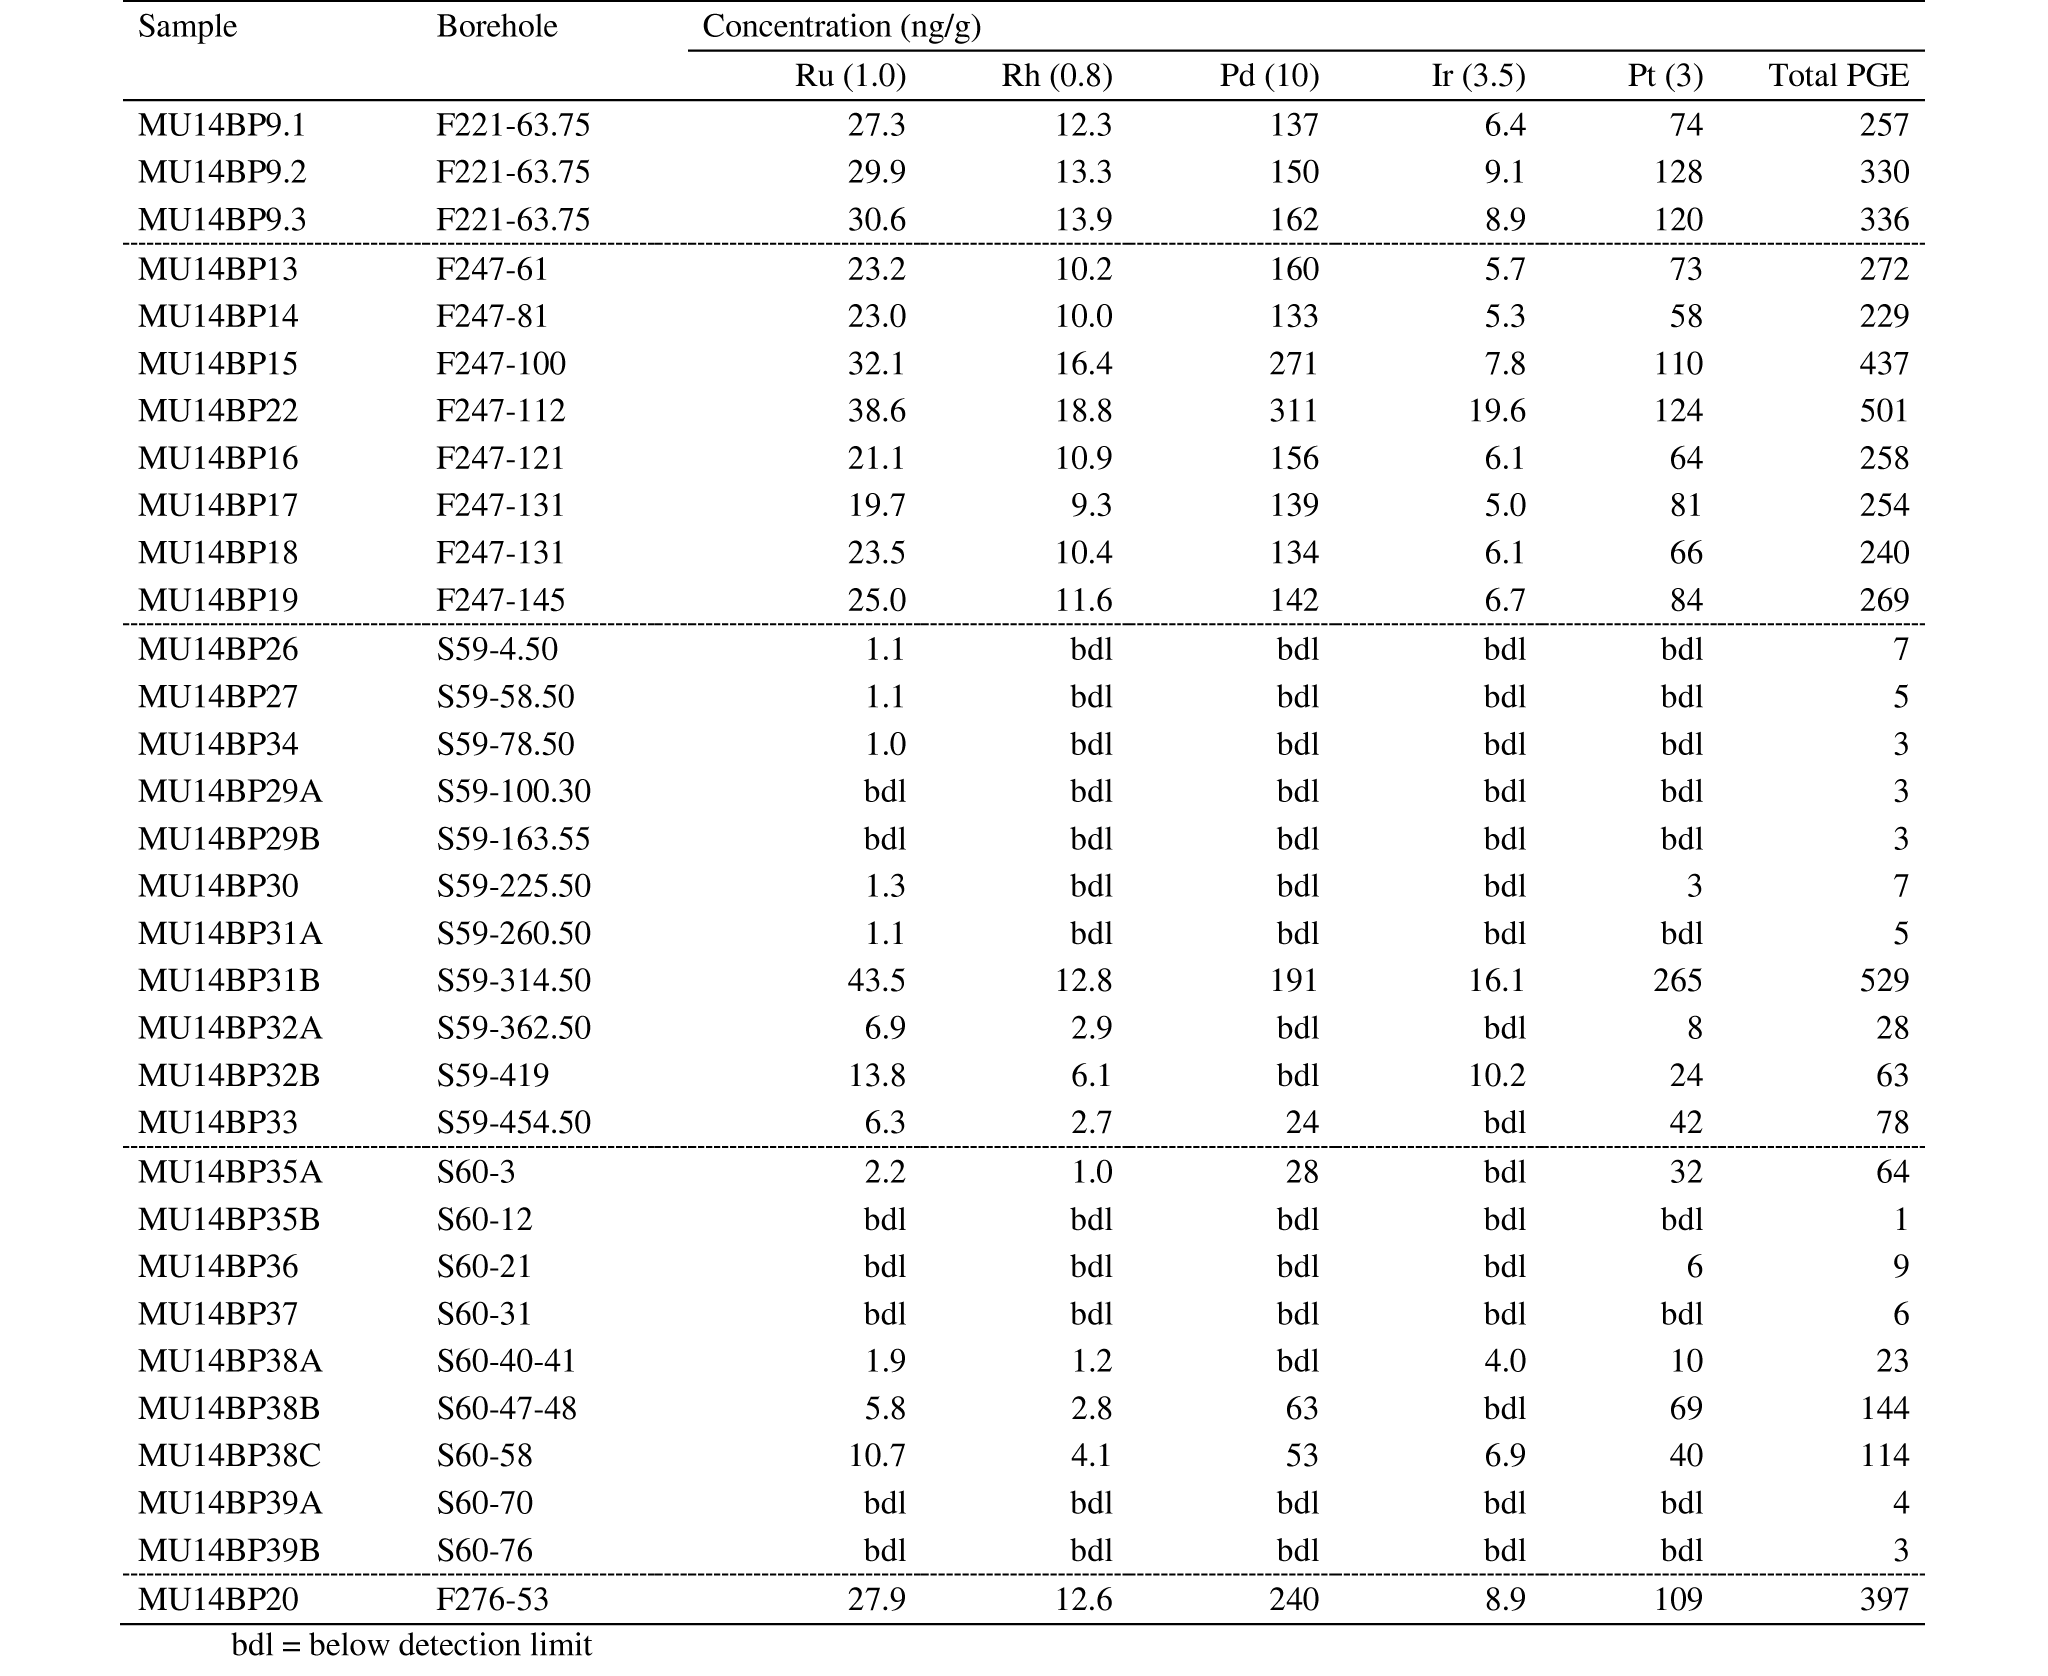
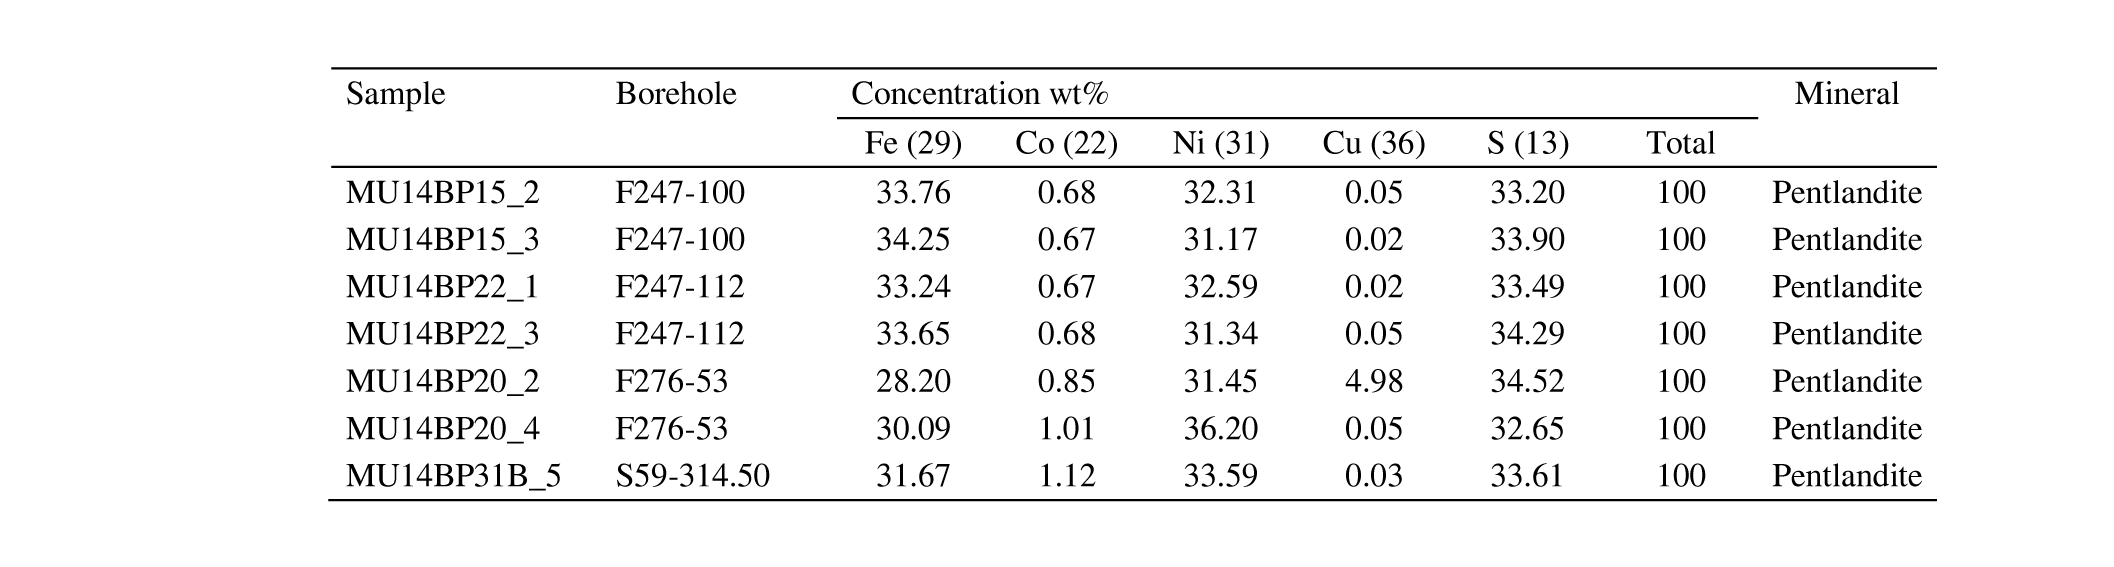
33The concentrations of the elements measured by ICP-OES are shown in Table 1. Cobalt, Fe, Mn and Zn concentrations show little variation, while Mg, Al, Ca, Cu, S and Ti show larger variation. The variation in Ni content between samples is large as concentrations range from 300-5300 μg/g.
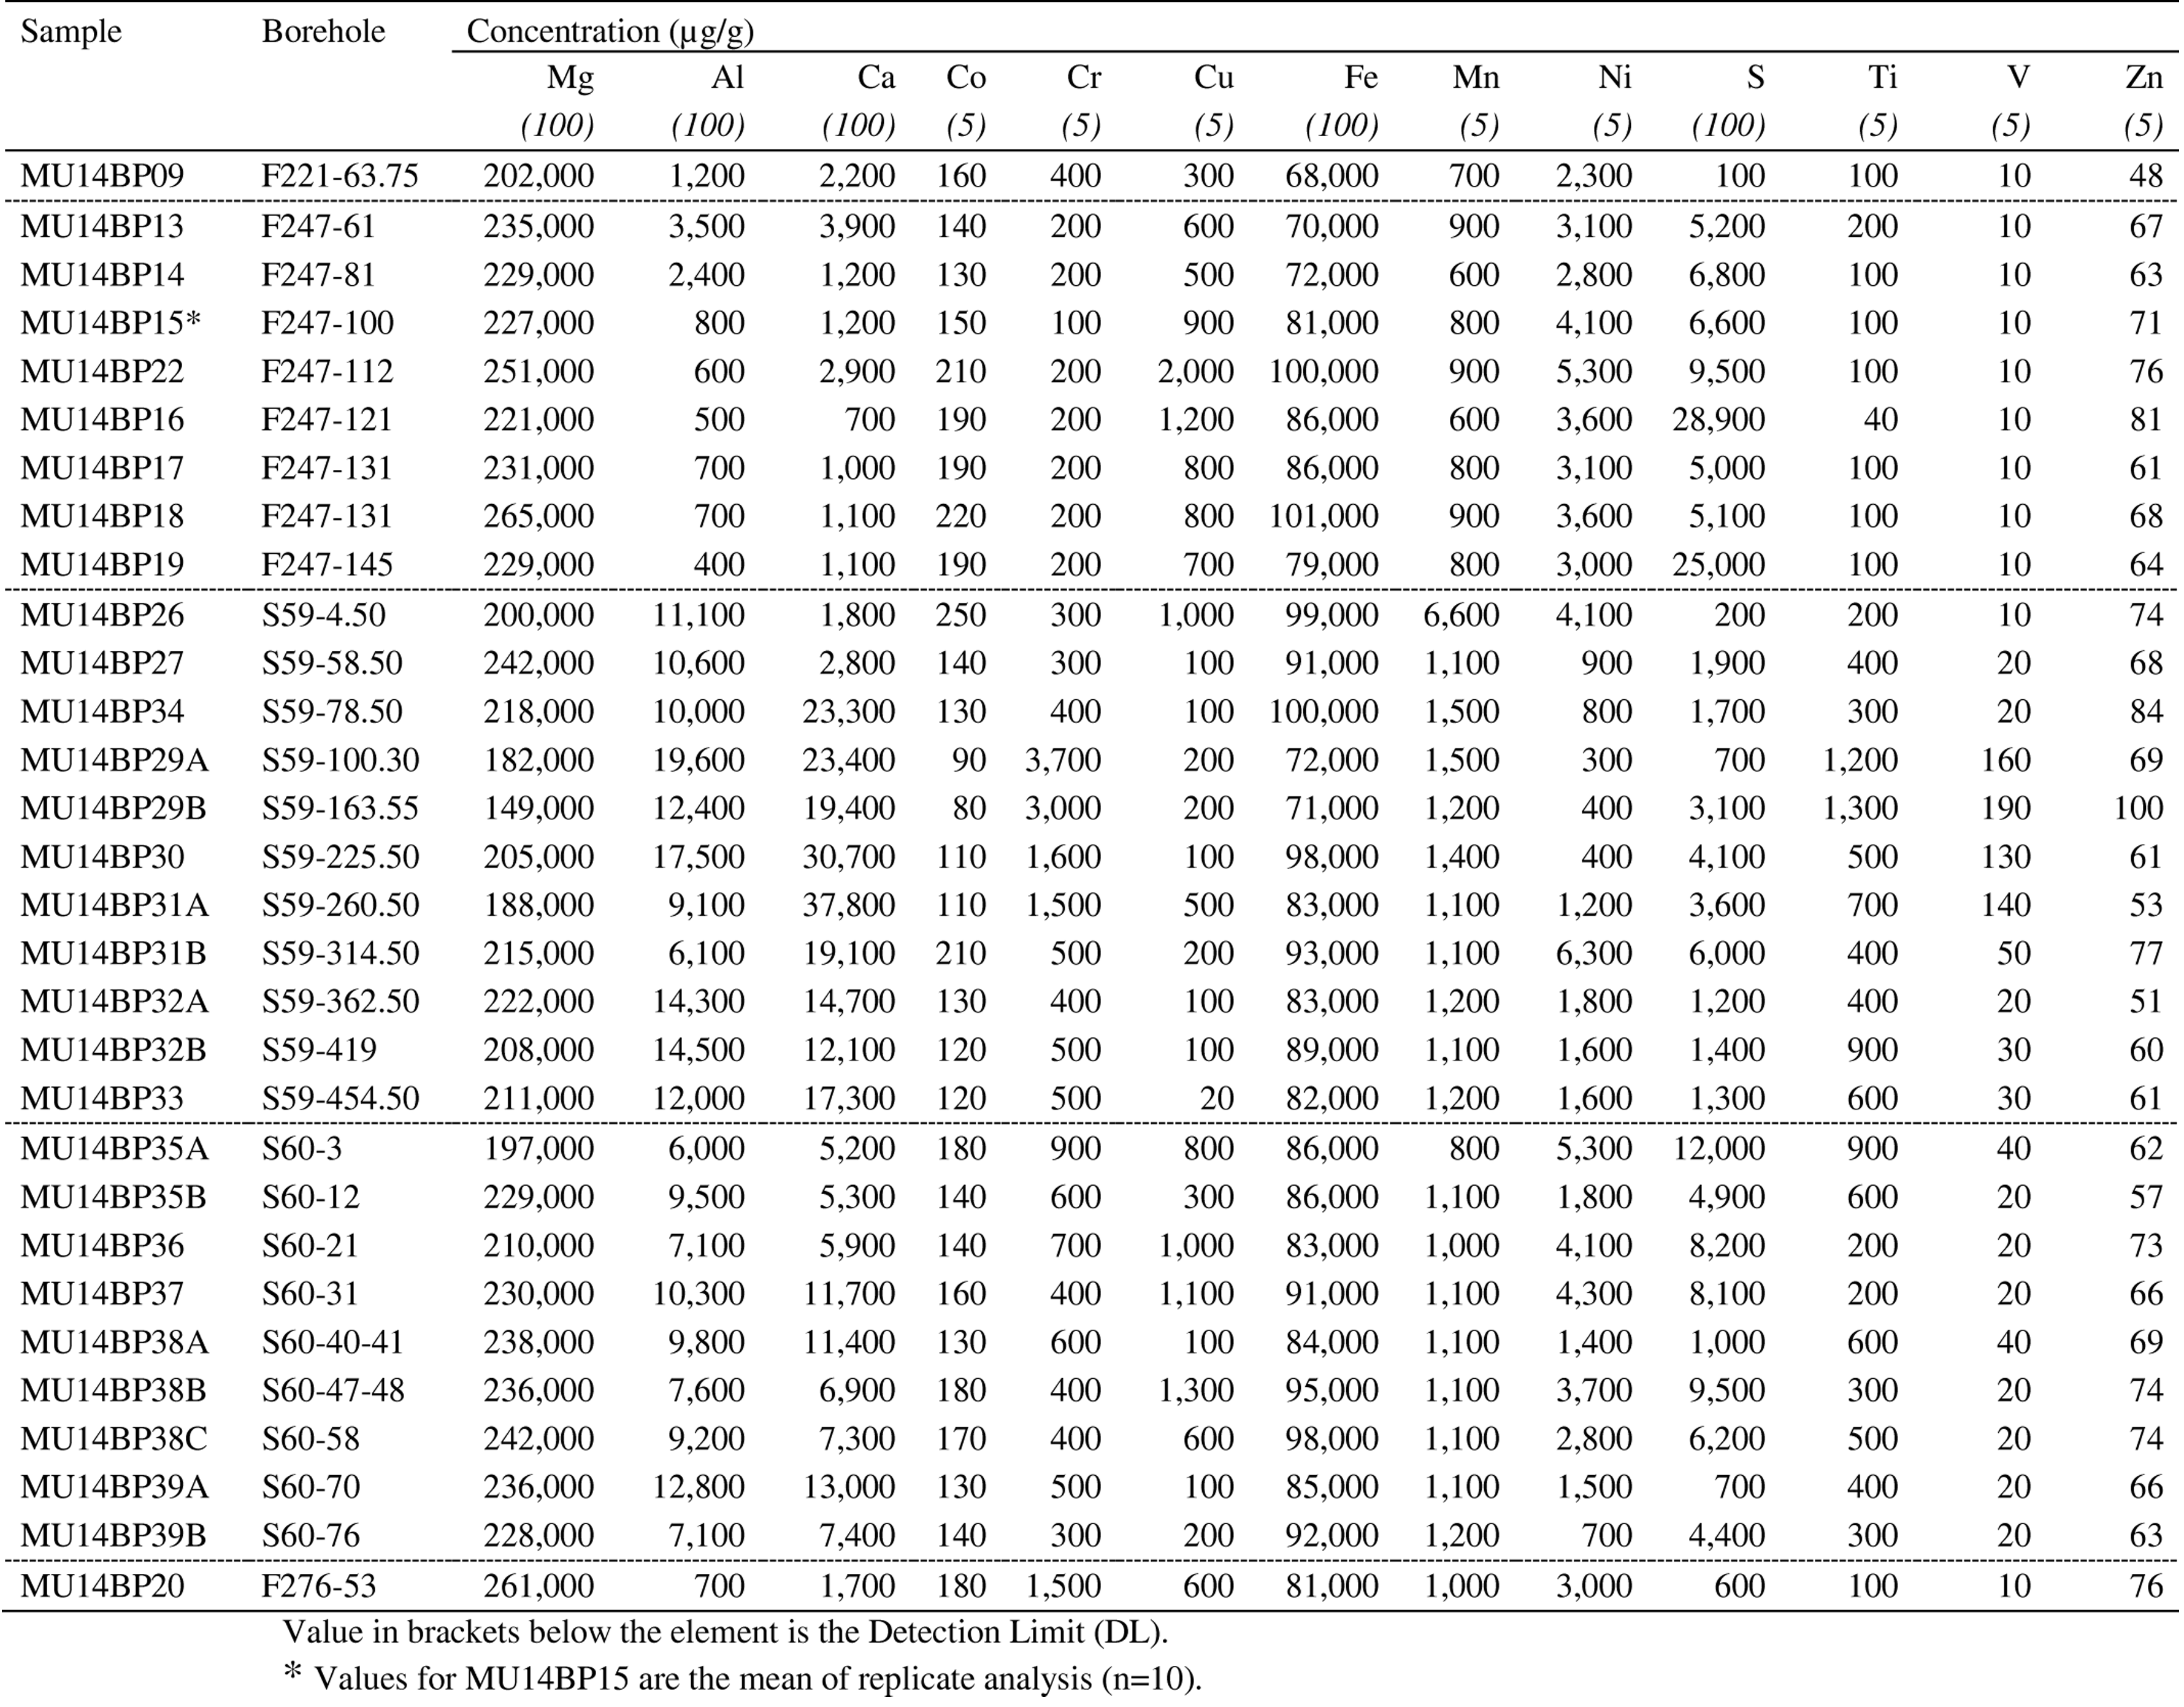
34Table 1. Whole rock concentrations, determined by ICP-OES after acid digestion.
35In Figure 4, the Ni-S ratio line for pentlandite can be used as a reference line. The whole-rock Ni values plotted include a major component that is present in olivine (~2000 µg/g; see below) and a minor component in pyroxene (~500 µg/g; see below). The remainder of the Ni can be presumed to be included in the sulfides, possibly in magnetite or in other alteration products. Both Bandyayera (1997) and Deblond (1993) mention that pentlandite is dominant in rocks from the Buhinda unit, whereas pyrrhotite is the dominant sulfide of Geyuka samples. The different proportions of these two sulfides will result in different trends on the Ni-S diagram. The combination of the Ni in silicates and Ni in sulfides results in the samples plotting close to or even below the pentlandite Ni-S reference line.
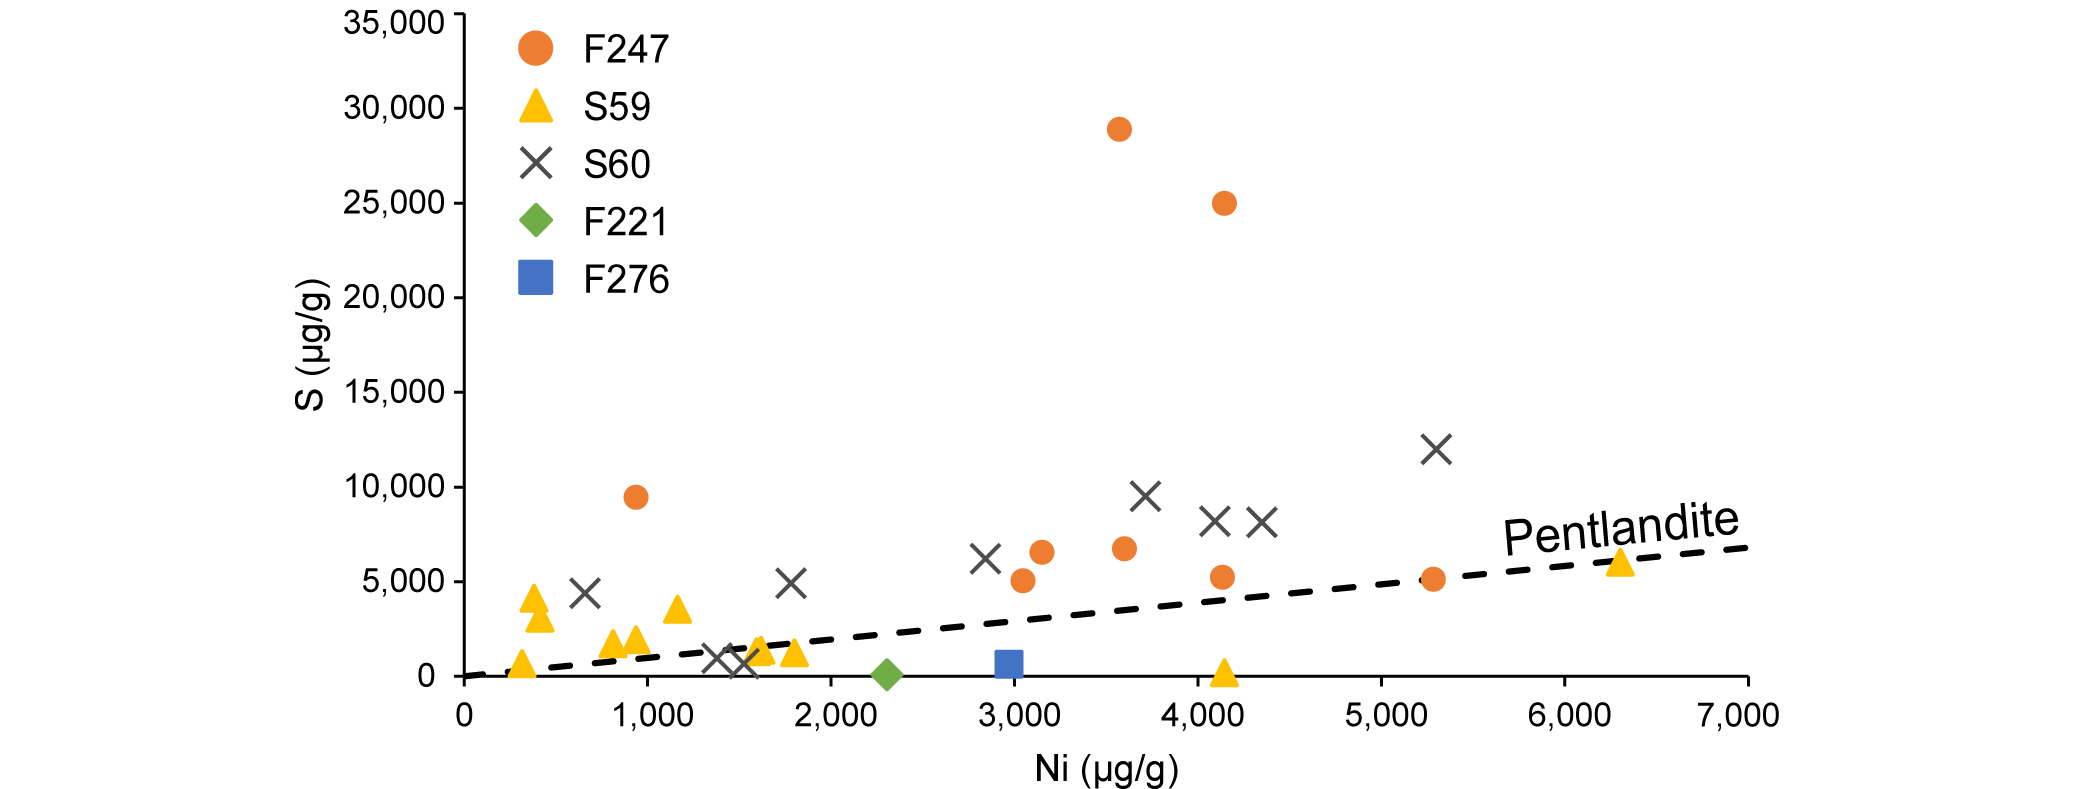
36Figure 4. Ni whole rock content plotted against the S whole rock content (both in µg/g; determined by ICP-OES). The line represents the Ni/S ratio in pentlandite (Fe,Ni)9S8 with Fe/Ni = 1.
37Two samples (F247, 121 m and 145 m in depth) are strongly enriched in S compared to the pentlandite reference line, while samples F221-63.75 and F276-53 are strongly depleted in S. The phenomenon of enrichment of S can also be noted in the data of Bandyayera (1997) and in the original assays by Exploration und Bergbau Gmbh (1985). A possible explanation is the secondary remobilization of S, possibly from the weathered zone, and re-precipitation as secondary sulfides (e.g. marcasite, bravoite). This remobilization of S does not seem to have affected the PGE, as can be seen by the chondrite-normalized patterns of the two S-enriched (F247-121 and F247-145) and two S-depleted (F221-63.75 and F276-53) samples. These chondrite-normalized patterns match well with the “normal” Buhinda unit’s samples (see Fig. 6).
38The whole rock PGE concentrations for all samples analyzed in this study by ICP-MS are listed in Table 2. PGE concentrations are relatively high over the entire depth of the F247 borehole compared to S59 and S60 (see also Fig. 3). The total PGE concentration of borehole F247 ranges from 240 to 501 ng/g. Samples from the two other boreholes from the dunitic Buhinda unit (F221 and F276) confirm that PGE concentrations are relatively high in this part of the Musongati intrusion, compared to the more central boreholes S59 and S60 in the pyroxenitic-peridotitic Geyuka unit. In the latter two boreholes, PGE concentrations are usually below the detection limit, but increased concentrations appear at 314.50 m for S59 and between 47‑58 m for S60 (peak levels). Their total PGE contents are 529 ng/g and 114-144 ng/g, respectively. Concentrations of all PGE are higher beneath the peak level in S59 compared to above this peak level. Palladium and Pt concentrations are much higher than Ru, Rh and Ir in all boreholes (Table 2).
39Table 2. Whole rock PGE concentrations, determined by ICP-MS after NiS FA. Detection limits between brackets.
40The PGE were successfully recovered from the standard reference materials, as expected from the established NiS FA method, except when concentrations were below the detection limit (see Table 6). Good similarities were seen when comparing the results from this study to other studies which have analyzed whole rock PGE concentrations: Bandyayera (1997) by instrumental neutron activation analysis (INAA), Deblond & Tack (1999) by lead fire assay with direct coupled plasma (DCP) and by NiS FA with ICP-MS and Maier et al. (2008) by INAA.
41For the regression analysis (Fig. 5), a linear Pearson method was used since this provided generally the best fit (see Table 9). Excluding the samples where most of the PGE are below detection, the analysis revealed two groups which correspond to two different geochemical groups. A first group is formed by the F-samples of boreholes F221, F247 and F276, which have consistently high total PGE and a negative Pt anomaly with regard to Rh and Pd on the chondrite-normalized diagram (Fig. 6). A second group consisting of the S-samples of boreholes S59 and S60 mostly have lower absolute values and generally have no negative Pt anomaly. These two groups are also distinct in element-element plots (Fig. 5) and show two separate parallel alignments.
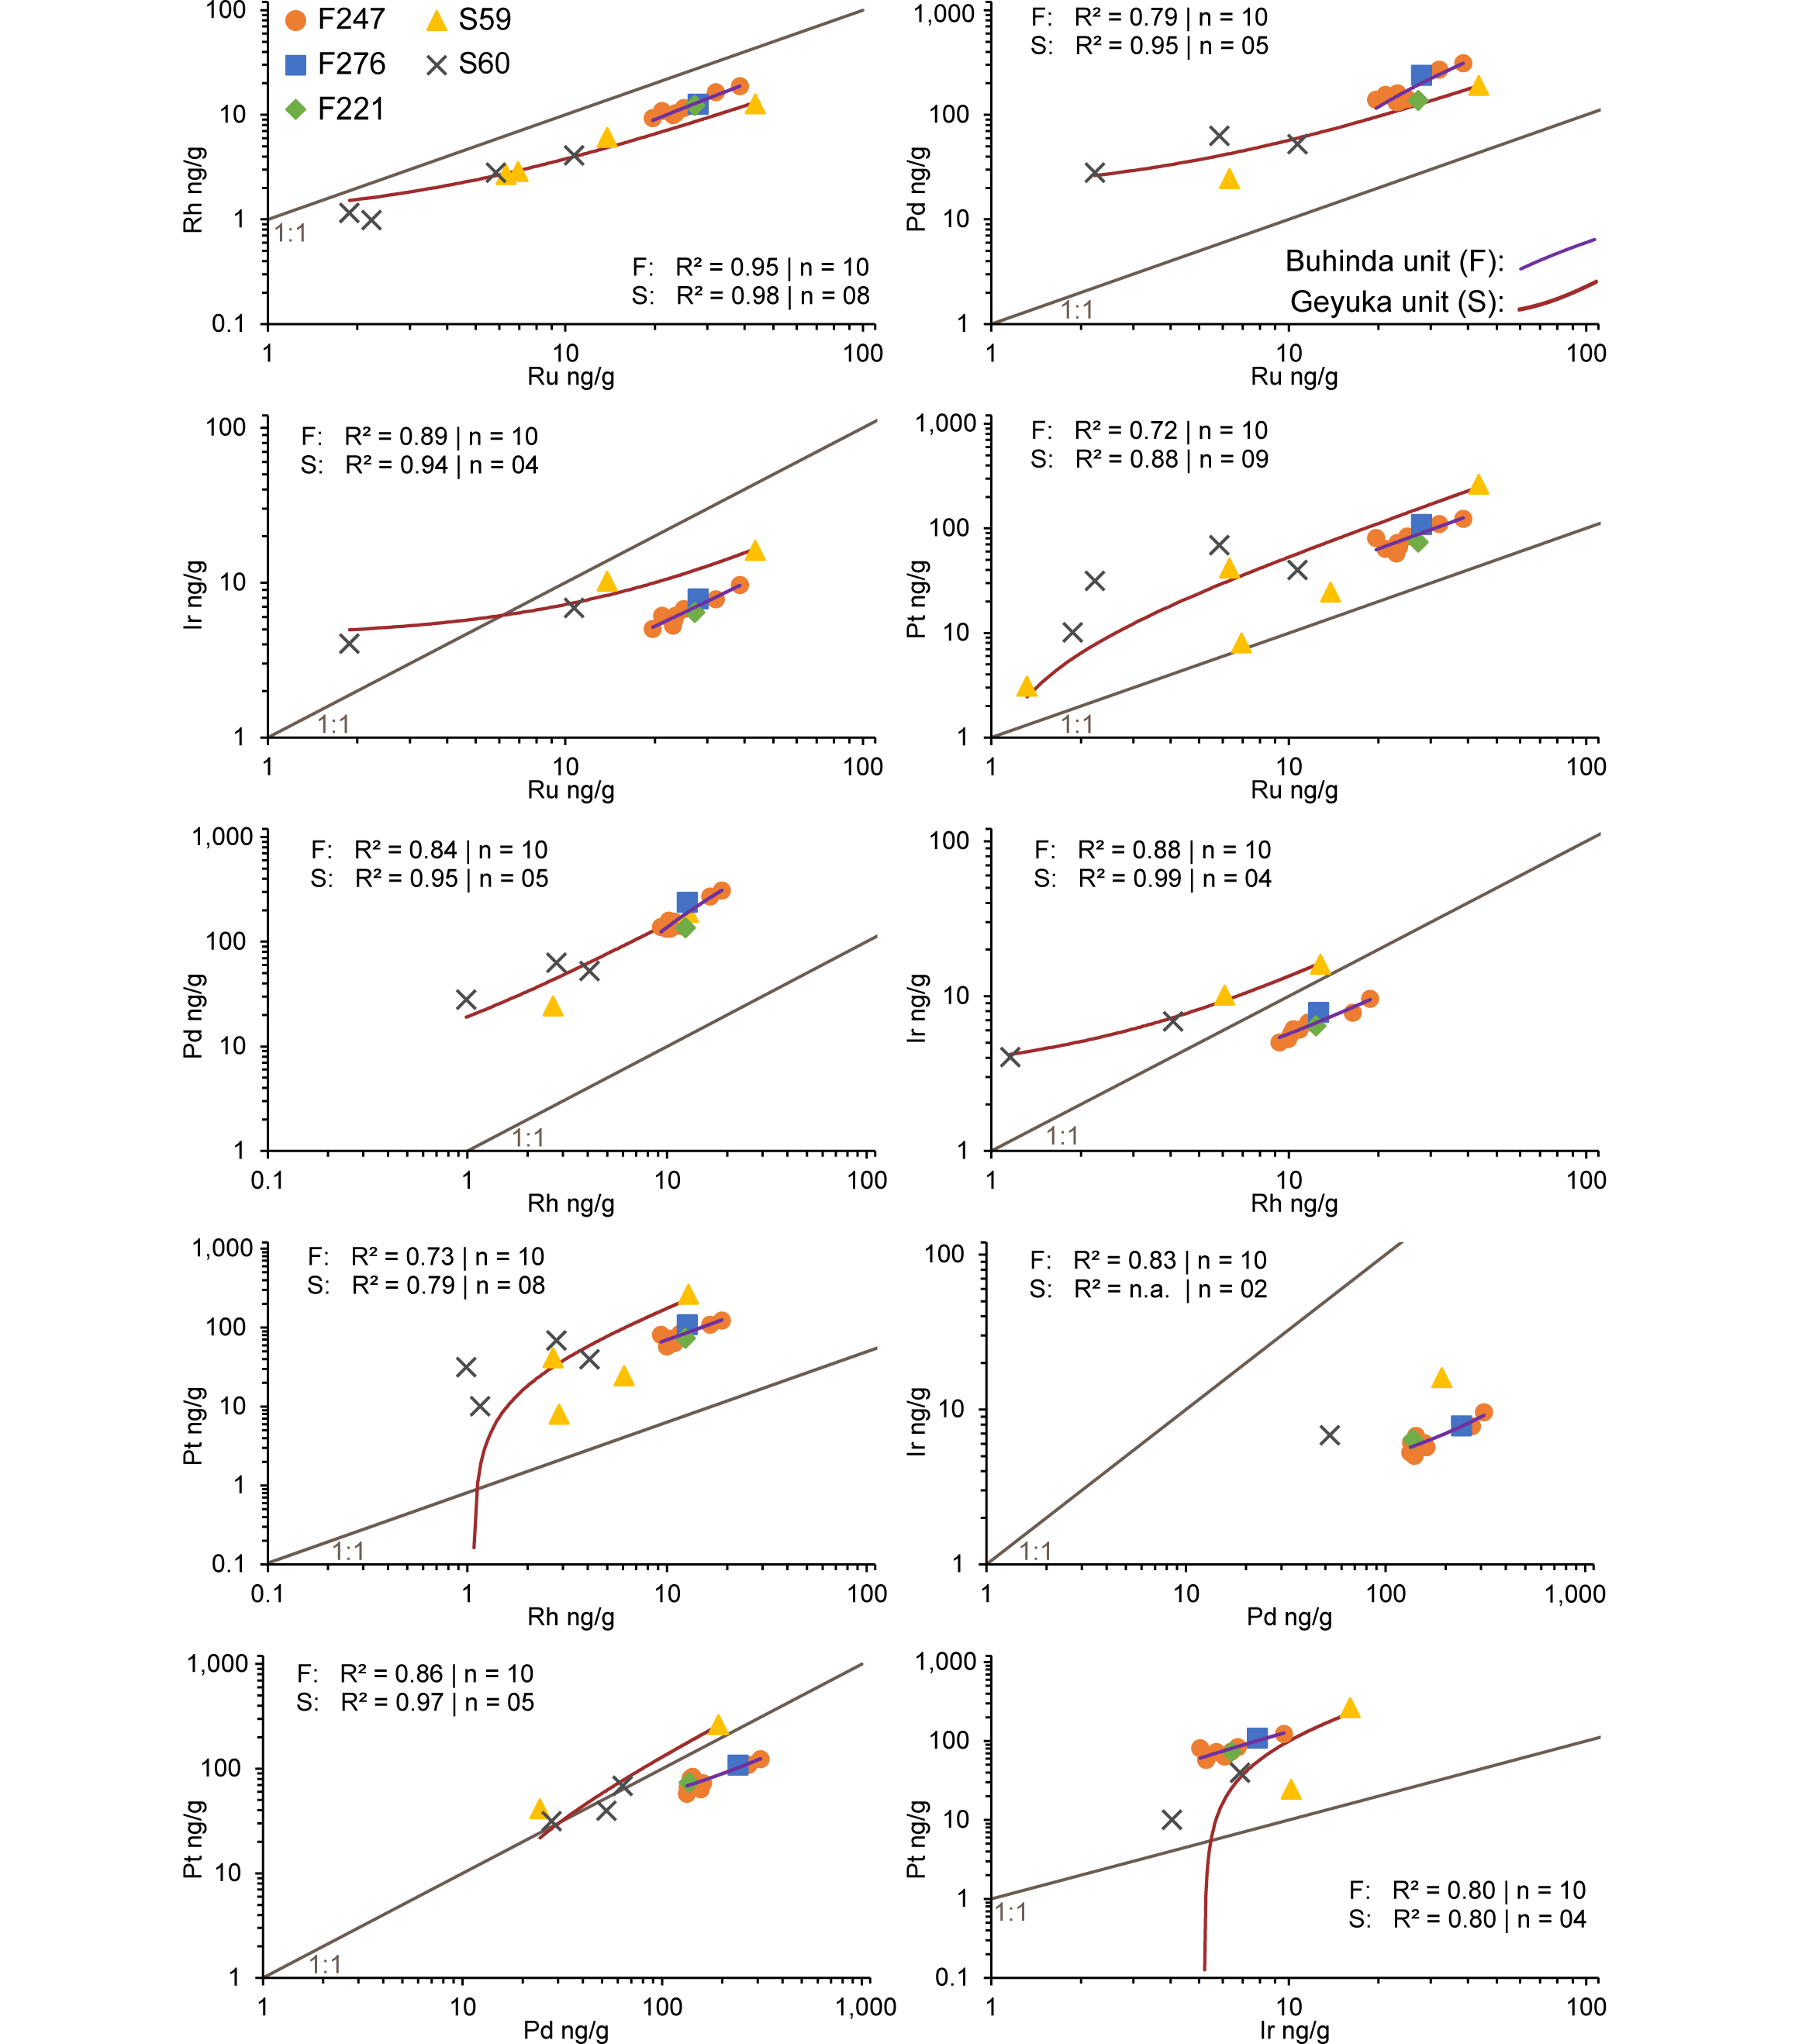
42Figure 5. Regression plots for whole rock PGE determined by ICP-MS in log10 ng/g. The linear trends and according R² parameters are for n samples combined; n is the total number of samples in a collection (F or S) that were chosen for the regression analysis. If an element in a sample was below the detection limit, the measurement was discarded from the regression analysis.
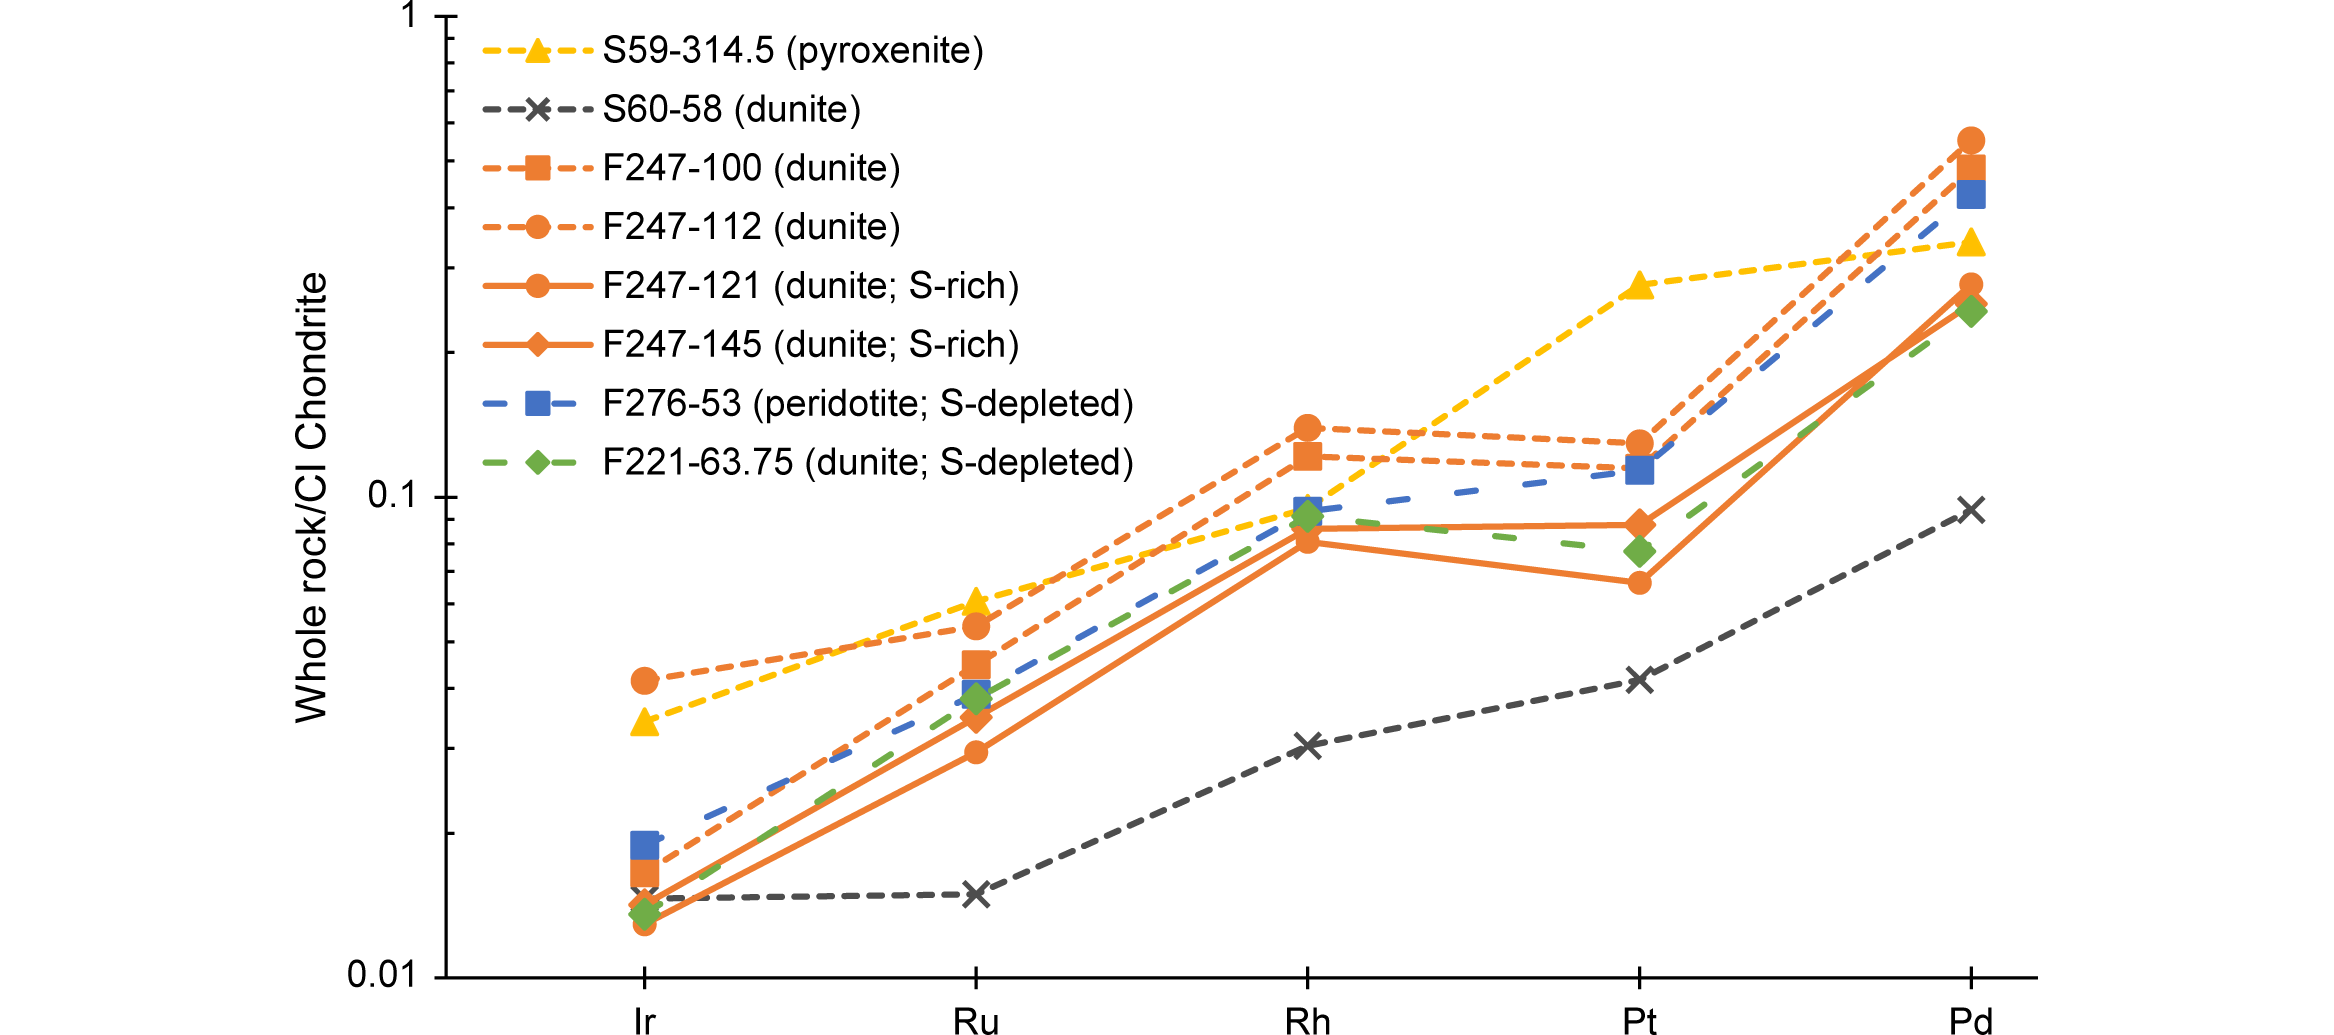
43Figure 6. Chondrite CI-normalized PGE patterns for samples S59-314.5, F247-100, 112, 121 and 145, F276-53, F221-63.75 and S60-58. The rock type and relation to sulfur (enriched or depleted; left blank if “normal”) of each sample are indicated in brackets. (Chondrite (CI) values from Tagle & Berlin, 2008).
44In the case of the Pearson linear regression method, all PGE are positively correlated to one another, implying that when one element increases the other element also increases and vice versa. The R² parameter indicates how much of the variation in the response data can be explained by the regression model. The according p-values were also calculated and point out that all linear relationships are statistically significant (see Table 9).
45All samples show a depleted pattern compared to the CI chondrite (Fig. 6). The patterns of the samples are very similar except for sample S60‑58 that is more depleted, which reflects its much lower PGE concentration compared to the other samples. Differences in pattern as a function of rock type are not pronounced, except maybe for Pt. The value of Pt in the pyroxenitic sample S59‑314.5 is higher than in all other samples and moreover has a positive anomaly relative to Rh and Pd. All samples show an upward trend from the most refractory element Ir to the least refractory element Pd. This upward trend does not remain for samples from the Buhinda unit, however, as Pt shows a negative anomaly relative to Rh and Pd, indicating relatively lower concentrations of Pt in these samples.
5.2. Pentlandite analysis
46Pentlandite grains were analyzed by FEG-EPMA and LA-ICP-MS. Although Co, Cu, Fe, Ni and S could be quantified by FEG-EPMA (Table 3), PGE could not. The same suite of elements (except for S) was also quantified by LA-ICP-MS along with PGE of which only Rh and Pd yielded concentrations above detection limits for all analyzed samples. Palladium concentrations are always higher than Rh. The Fe, Ni and S concentrations clearly indicate that the measured grains are all pentlandite. The grains show high Co concentrations (>8000 µg/g). Zone 2 of sample MU14BP20 shows an enriched Cu content (Table 3), which could be an indication of possible chalcopyrite overlap. This data was consequently not used for the mass balance calculation.
47Table 3. Concentrations of elements in sulfides measured with wavelength dispersive spectroscopy (WDS) by FEG-EPMA. All concentrations recalculated to 100% total.
48The 57Fe% correction in Table 4 specifies the correction for the LA-ICP-MS data based on the FEG-EPMA data, since the FEG-EPMA data of Fe was used as the internal standard for the LA-ICP-MS data. The Fe concentrations determined by LA-ICP-MS were replaced by the FEG-EPMA data and the concentrations of the other elements were changed accordingly to the Fe concentration ratio of FEG-EPMA:LA-ICP-MS. Values higher than 100% signal that the concentrations determined by LA-ICP-MS were underestimated with regard to those determined by FEG-EPMA and vice versa.
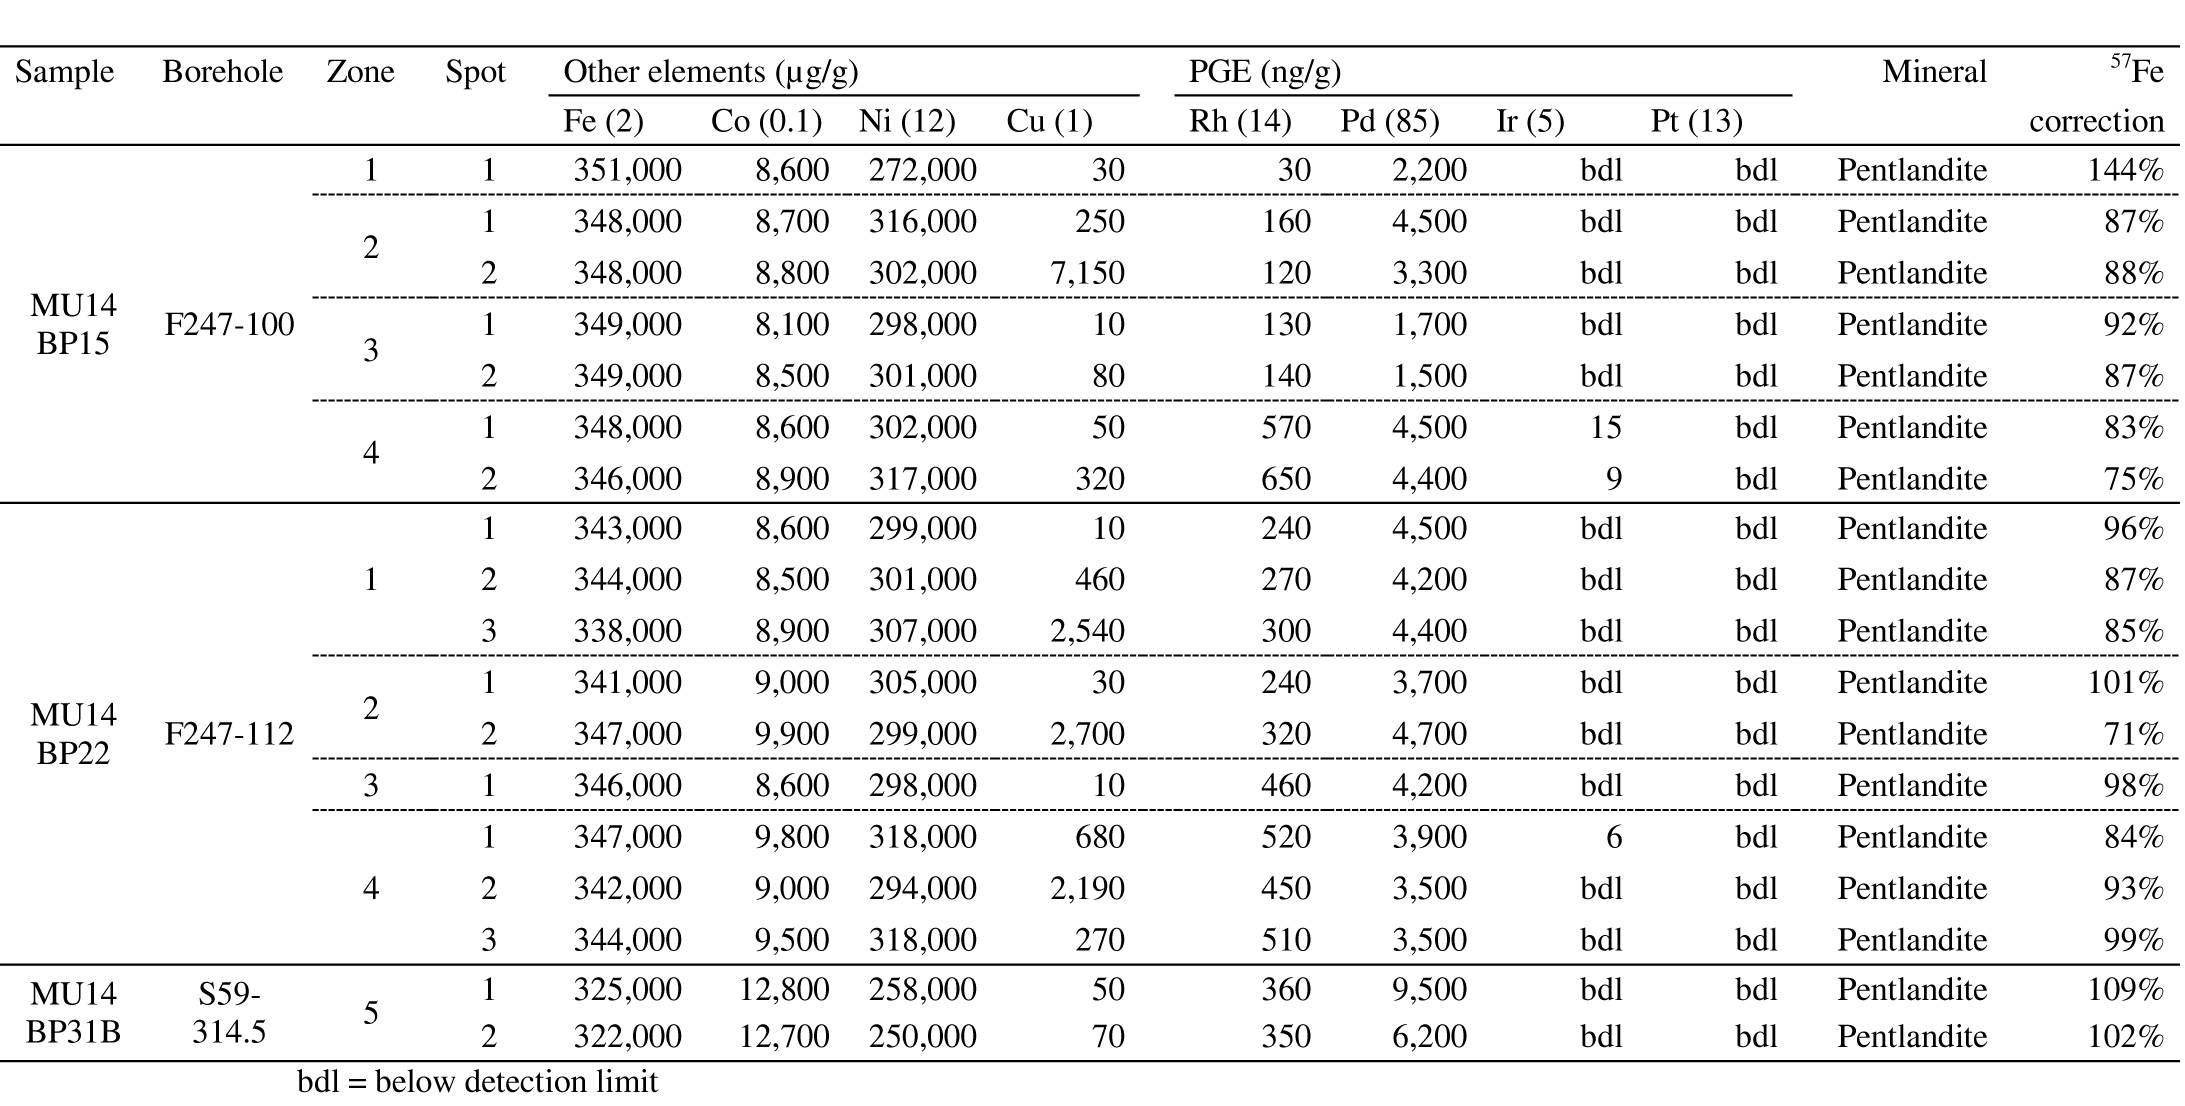
49Table 4. PGE and other element concentrations in pentlandite, determined by LA-ICP-MS, corrected by FEG-EPMA measurements of 57Fe. A ‘zone’ is a marked area on a polished section of a sample while a’ spot’ is one measurement spot inside a zone (see Plate 1C & D). Detection limits between brackets.
50As opposed to the FEG-EPMA measurements, the PGE could be detected and quantified with LA-ICP-MS. Iridium and Pt were almost always below the detection limit (DL) though and hence provide rather unreliable results. Rhodium and Pd, however, were always above the DL and could be quantified reliably. Rhodium ranges from the DL of 30 ng/g to 650 ng/g in spot 2 of zone 4 of sample MU14BP15. Palladium ranges from the DL of 1500 ng/g to 9500 ng/g in spot 1 of zone 5 of sample MU14BP31. In sample MU14BP15 the ranges for Rh and Pd are 30‑650 ng/g and 1500‑4500 ng/g, respectively. Sample MU14BP22 has a much lower variation since Rh ranges from 240‑520 ng/g and Pd from 3500‑4700 ng/g.
5.3. Mass balance
51Based on the concentration data from the whole rock and pentlandite analyses, a mass balance could be calculated (Table 5). The following formula was used to calculate the proportion (PsulPGE) of a PGE in a sulfide mineral:
52(PsulPGE) = (FsulCsulPGE/CwrPGE) x 100
53where CsulPGE is the concentration of a PGE in a sulfide mineral (as analyzed by LA-ICP-MS) and CwrPGE is the concentration of a PGE in the whole rock (as analyzed by ICP-MS) (Osbahr et al., 2014). The factor 100 is applied to obtain percentages. The Fsul is the weight fraction of a certain sulfide compared to whole rock. The weight fraction of pentlandite was calculated in the following way:
54Fsul = CwrNi/CpnNi
55where CwrNi is the whole rock Ni content (as analyzed by ICP-OES) and CpnNi is the Ni content of the measured pentlandite grain (as analyzed by LA-ICP-MS).
56The Ni whole rock content in the calculation of the fraction of pentlandite was corrected for the Ni content of olivine and pyroxene. Based on results from Bandyayera (1997) and Maier et al. (2008) different corrections were performed per sample. The Ni content of samples MU14BP15, MU14BP22 and MU14BP31B is 2220 µg/g, 1910 µg/g and 1780 μg/g in olivine and 500 µg/g, 500 µg/g and 400 μg/g Ni in pyroxene, respectively. The Ni contents for pyroxene are estimated based on the data of Bandyayera (1997). Based on modal compositions of the minerals, 90% of the olivine Ni content and 10% of the pyroxene Ni content were used for the Ni correction. This resulted in the following Ni corrections: 2048 µg/g, 1769 µg/g and 1642 µg/g for samples MU14BP15, MU14BP22 and MU14BP31B, respectively.
57Based on the mass balance calculations, 11.9% Rh and 7.6% Pd are hosted on average by pentlandite grains in sample MU14BP15. Pentlandite grains in sample MU14BP22 host an average 21.4% Rh and 14.4% Pd. Sample MU14BP31B’s pentlandite grains host 38.6% Rh and 56.9% Pd on average. The highest proportion of a PGE in pentlandite is 69.1% for Pd in sample MU14BP31B zone 5 spot 1.
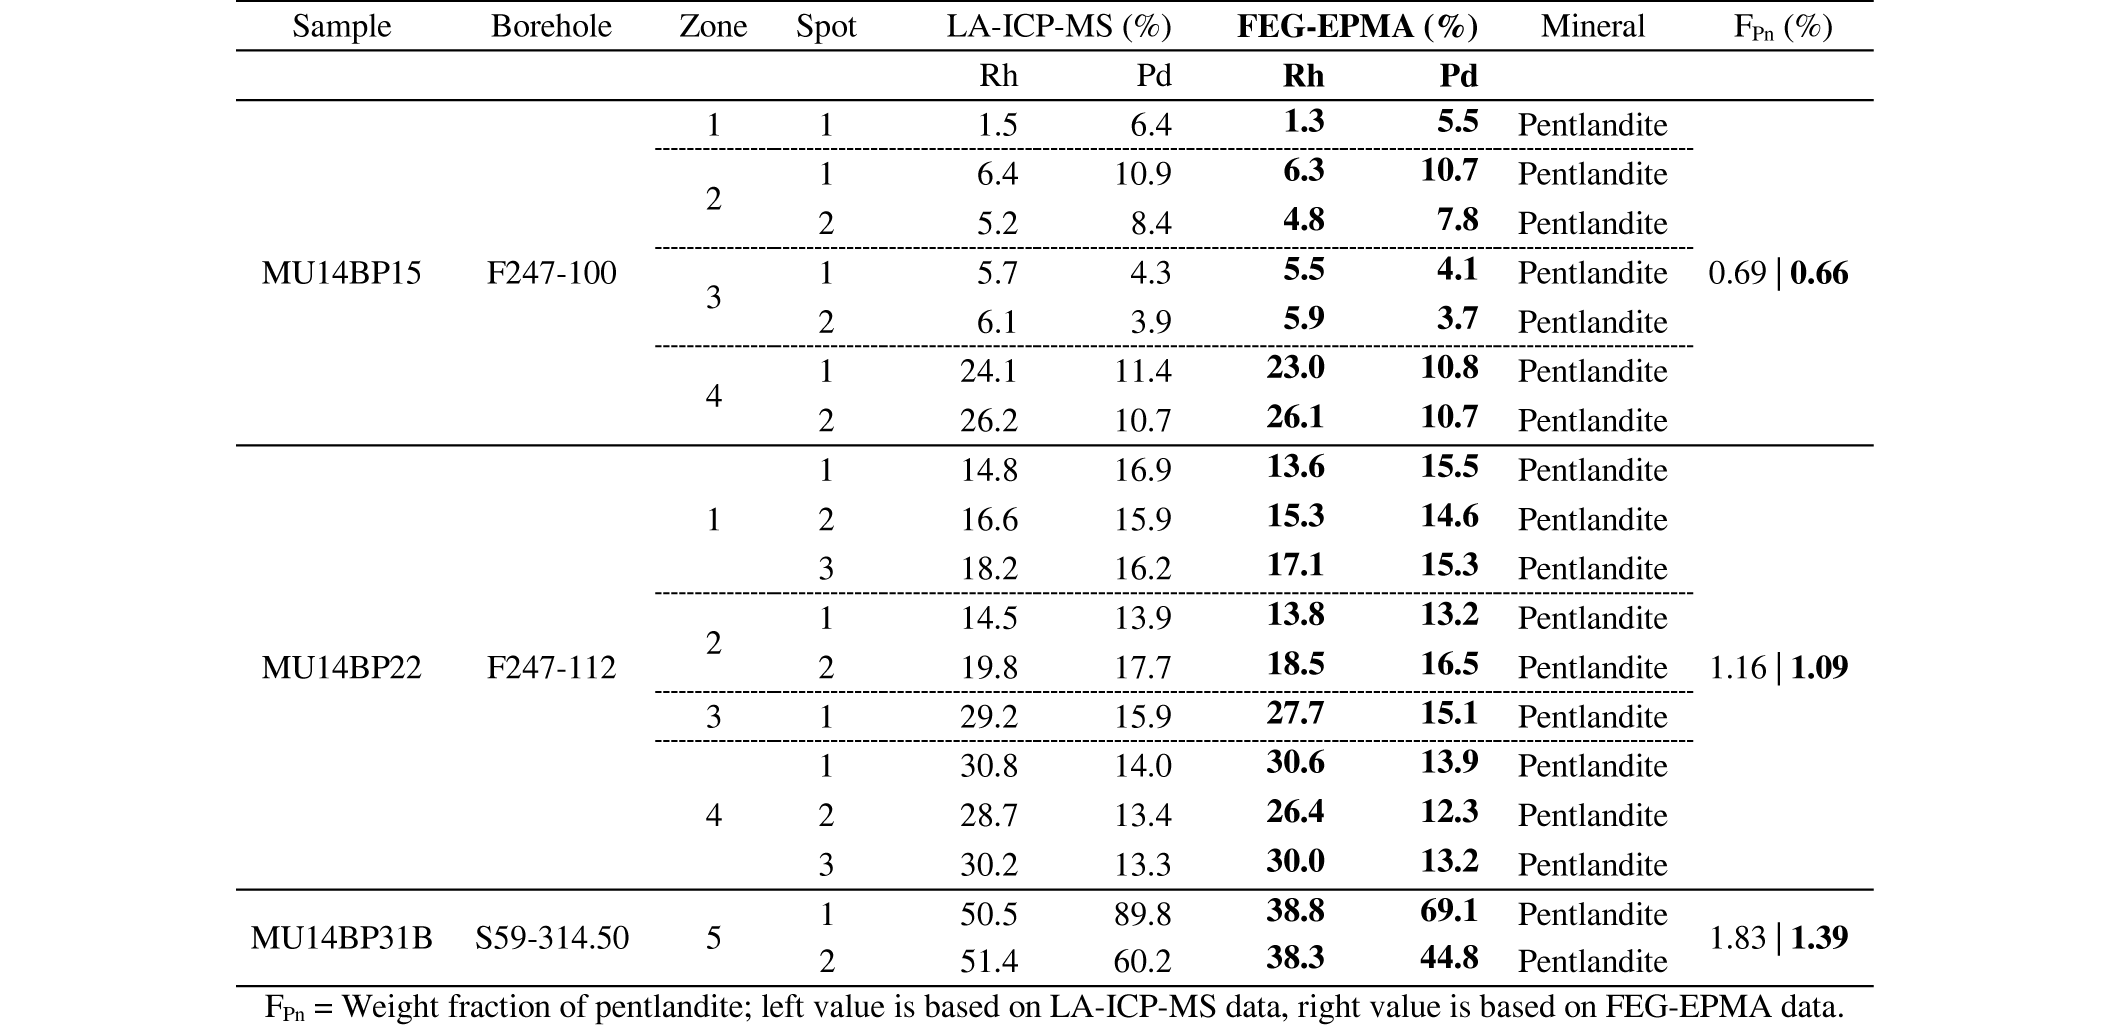
58Table 5. Proportions of Pd and Rh in pentlandite with regard to whole rock distribution of three samples. Proportions were calculated according to the formula discussed in 5.3. For the calculation of the weight proportion of pentlandite both the Ni content in pentlandite as analyzed by LA-ICP-MS and FEG-EPMA can be used. The results of the FEG-EPMA are preferred (in bold) and used in the text but both results of the calculation are shown below.
6. Discussion
6.1. PGE concentration
59The peridotitic Buhinda unit has higher overall PGE concentrations than the pyroxenitic-peridotitic Geyuka unit (Fig. 3). Nevertheless, a direct relationship to certain geological layers is not observed. The S59 and S60 boreholes do not have high average PGE concentration over their entire depth range, but show peak concentrations at certain depths. These peaks in PGE content could not be related precisely to a specific recognizable layer, but have been noticed in the past (Fig. 3). The peak at shallow depth in S60, however, is due to PGE enrichment in the Ni-lateritic cover (Bandyayera, 1997). The difference in PGE content between the Buhinda and Geyuka units could be due to two different magma sources or due to sulfide extraction from the magma during the crystallization of the intrusion, as pentlandite carries a significant amount of PGE as indicated by the calculations of the mass balance.
60In their report of 1977, the UNDP reported a total concentration of Pt, Pd and Rh of 4.25 µg/g in the S59 borehole between 411-418 m depth. They also reported enriched PGE concentrations for other boreholes of the pyroxenitic-peridotitic Geyuka unit. In this study, along with previous studies of Bandyayera (1997) and Deblond (1993), this enrichment occurrence could not been confirmed. This study, however, revealed increased PGE concentrations in the same borehole at a depth of 314.5 m. Many studies such as Bandyayera (1997), Deblond (1993) and Maier et al. (2008) have confirmed the anomalous PGE concentrations in the Buhinda samples. From an economic point of view, the Buhinda unit is, therefore, more promising for PGE exploitation than the Geyuka unit. The ore-grade PGE concentrations at greater depth in the S59 borehole could be related to the Buhinda unit since the dip of the layered intrusion is to the west (see 2.2).
6.2. Element mobility
61Differences in sulfur content could be explained by element mobility during weathering (Maier et al., 2008). A lack of S (samples F221-63.75, F276-53 and S59-4.50) could be explained by removal of S out of the system, for example during hydrothermal alteration (cf. serpentinization). However, since almost all olivine-rich rocks are partly serpentinized, a more likely explanation would be the oxidation of S at or near the base of the weathering profile. An excess in S (samples F247-121 and F247-145) can be explained by the presence of S in pentlandite, but also in other base metal sulfides (such as pyrrhotite and chalcopyrite) or in other minerals present below the base of oxidative weathering in addition to pentlandite. The well-developed positive correlations between the individual PGE (Fig. 5) could suggest that all PGE behaved in a relatively immobile manner and that the element mobility would have mainly affected sulfur (Maier et al., 2008). This is in agreement with the CI-normalized patterns of both S-poor and S-rich samples at Buhinda, which are very similar to the “normal” samples (Fig. 6).
6.3. Pt anomaly
62The presence of negative Pt anomalies for all the Buhinda samples and a much less marked or positive Pt anomaly for the two samples at Geyuka that have assays above the detection limit, can suggest that there are two different magma sources (Franchuk et al., 2015) or transport routes for the cumulate rocks and sulfide-PGE mineralization at Buhinda and at Geyuka.
63Silicate crystal fractionation as an explanation for the Pt anomaly seems unlikely for two reasons. Firstly, the ubiquitous sulfides in all samples (except those that are weathered) prove that the magma was sulfur saturated. Secondly, silicate crystal fractionation may separate Os, Ir and Ru from Pt and Pd, but is unlikely to give the pronounced negative Pt anomaly relative to Rh and Pd, unless the magma was very oxidized such as a volcanic-arc andesite, which is not the case here (Park et al., 2015).
64The lack of a negative Pt anomaly in the chondrite-normalized pattern of S59-314.5 can confirm that magmatic differentiation did not play a significant role in the distribution of the PGE. The peridotites and pyroxenites of this interval of the Geyuka subunit (S59 and S60 boreholes) contain abundant disseminated sulfides (~4500 µg/g = 1.2 wt% sulfides in S59 314.5 m) and these sulfides control the behavior of the PGE. Magmatic differentiation, either on the scale of a borehole (S59) or from the lowermost Buhinda subunit to the Geyuka subunit, will not have a great influence on the Pt/Pd ratio. This ratio is rather controlled by deeper processes such as partial melting (Alard et al., 2000; Garuti et al., 1997).
6.4. PGE compatibility
65From the regression analysis it became clear that there is a prevalence of strong (R² > 0.70) to very strong (R² > 0.90) positive linear correlations (equations in the form of Y = A*X + B) between the PGE in samples both from the Buhinda and Geyuka units (Fig. 5). This indicates a similar behavior of PGE in terms of compatibility in both geochemical populations towards the immiscible sulfide liquid. If power-law relations (in the form of A*XB) would have prevailed, it could be argued that there are some differences in terms of compatibility towards the immiscible sulfide liquid between the PGE.
66Platinum and Pd are less compatible in sulfide liquid than Ir, Os and Ru (Mungall & Brenan, 2014). As far as can be measured experimentally, all the PGE have very high distribution coefficients from silicate magma into sulfide melt (Mungall & Brenan, 2014). There is no fractionation of Pt and Pd from Os-Ir-Ru after S saturation occurs (Barnes & Maier, 1999). The fractionation of Pt-Pd from Os-Ir-Ru occurs before S-saturation, due to the preferential affinity (perhaps due to metal clustering) of Os-Ir-Ru for the early cumulate minerals olivine and chromite (Barnes & Maier, 1999).
6.5. Sulfur saturation and sulfide fractionation
67Arndt et al. (2005) pointed out that the formation of an immiscible sulfide liquid is considered as a normal segregation product in a mafic-ultramafic system. It does, however, usually only segregate in small amounts due to a limited abundance of S in the magma. It also occurs at a late stage during the crystallization of the magma. The timing of sulfur saturation is of importance with regard to the formation of a PGE deposit. When sulfur saturation is only achieved at a late stage in the crystallization of the magma, most PGE will have already been extracted from the residual silicate melt in which the sulfide liquid forms. Sulfur saturation early in the crystallization history of an intrusion is thus considered advantageous for the development of a wide range of magmatic sulfide deposits (Robb, 2005). Determining if such immiscible sulfide liquid formation occurred at Musongati and whether early or late, is essential to better interpret if the PGE abundances were controlled by this liquid or by the silicate melt.
68Barnes & Maier (2002) point out that when sulfides do extract PGE from the silicate melt, only the sulfides that form early will be enriched. This is due to the high distribution coefficients of the PGE for the sulfide liquid. The first sulfides that form will thus extract most of the PGE from the silicate melt, leaving few PGE for sulfides that form later (Barnes & Maier, 2002). This can be confirmed from the data of this study, as the Buhinda unit has more and higher PGE-enriched sulfides than the Geyuka unit and formed earlier during the crystallization of the intrusion.
69Upwards through the geological units of the layered intrusion, all PGE concentrations decrease, indicating compatible behavior of all PGE in the immiscible sulfide liquid. A probable explanation for this upward depletion of PGE may be sulfur saturation and sulfide extraction from the magma. Sulfur saturation would mean the onset of sulfides forming in the magma and sulfide extraction from the magma could mean that the sulfides with the PGE would have settled in the crystal mush which was crystalizing the silicate minerals. If the PGE behave similarly in terms of compatibility towards the sulfide phase, all PGE should have been incorporated in a similar way into the sulfides.
70Since the sulfides mainly occur interstitial to the cumulate minerals (Plate 1C, D, E), it can be argued that the sulfides precipitated early on due to sulfur-saturation, but remained as molten liquid droplets after olivine and pyroxene started to crystallize, thereby molding themselves to the shape of the solid cumulate grains. This can be the case, since sulfide droplets have a lower solidification temperature (1180 to 1150 °C) than the crystallization temperature of olivine, chromite or orthopyroxene (Robb, 2005). So in a cumulate, the droplets will mold themselves around accumulating crystals and thus take an interstitial shape. Later on, the sulfides started to alter to Fe-oxides and other sulfide minerals, as mentioned in section 3. Most likely the spinel minerals formed together with the host rock since their outlines are not constrained to the boundaries of for example olivine grains.
71Since Pt, Pd (and Cu) are incompatible in the early-formed silicate minerals, they will build up in the residual magma. Late sulfur saturation in a Pt-Pd-Cu rich residual magma can result in mineralized reefs, such as Stella (Bushveld) or Platinova (Skaergaard). Such reefs are, however, not observed at Musongati, indicating an early sulfur saturation of the magma.
72Another indication that sulfur saturation occurred in an early stage of the crystallization of the layered Musongati intrusion are the high modal proportions of sulfide (0.5-2%) in the Buhinda dunites, which occur near the base of the stratigraphic sequence. The sulfur contents that were determined in the whole rock samples are ~6500 μg/g in samples MU14BP14 and 15, ~6000 μg/g in sample MU14BP31B, ~9500 μg/g in sample MU14BP22 and only 630 μg/g in sample MU14BP20 (Table 1). These are relative low values, compared to the S contents of ~25,000 μg/g in samples MU14BP16 and 19 from borehole F247, but all values are well above the saturation limit of S in a basaltic melt (Ripley & Li, 2013).
73All arguments presented, suggest that the rocks of the Musongati intrusion formed by an accumulation of silicate rock-forming minerals, spinel and sulfide droplets and that the magma was saturated in sulfur at the moment minerals started to crystallize.
6.6. PGE distribution
74In general, pyrrhotite and pentlandite are the sulfides which host most of the PGE, except Pt which forms Pt minerals (Dare et al., 2011). Chalcopyrite contains very minor PGE. Recent studies, however, show that pyrite can host a significant amount of Pt and Pd (Piña et al., 2010, 2016; Dare et al., 2011; Duran et al., 2015). Since only pentlandite grains were measured and correctly quantified during the LA-ICP-MS measurements, the mass balance can only account for pentlandite. Initially, PGE concentrations in sulfides were measured by wavelength dispersive spectroscopy (WDS) FEG-EPMA, but they could not be determined. As was later confirmed by LA-ICP-MS, the concentrations were all below the detection limits of the FEG-EPMA (<10-20 ng/g).
75For Musongati, the average PGE proportion in pentlandite in samples F247-100 and F247-112 of the Buhinda unit are 10.4% and 21.4% for Rh and 7.6% and 14.4% for Pd respectively. For sample S59-314.5 of the Geyuka unit, this is 38.6% for Rh and 56.9% for Pd. It must be mentioned though that the average value of S59-314.5 is based on only two measurements (Table 5). Wilhelmij & Cabri (2015) reported that 13.5% to 21.0% of the total Pd is present in pentlandite for the Kapalagulu intrusion (Fig. 1A). Kapalagulu is often seen as an equivalent to Musongati (e.g. Maier et al., 2008). The Rh and Pd proportions at Musongati are very similar to e.g. ~20-50% proportions of Pd in pentlandite in the Bushveld Complex (Osbahr et al., 2014) or PGE proportions in other PGE deposits worldwide (Lightfoot & Evans-Lamswood, 2015). These results demonstrate that a significant amount of PGE are hosted by sulfides. The remaining part could be hosted by platinum group minerals. The occurrence of Pd in discrete PGM at Musongati has been demonstrated by Jedwab (1987).
6.7. PGE mineralization model for Musongati intrusion
76Based on the distribution data obtained in this study, a preliminary formation model for the PGE mineralization for the Musongati layered intrusion can be proposed. This model incorporates two PGE mineralization models: sulfide fractionation (e.g. Chen et al., 2015) and PGE clustering (e.g. Kennedy et al., 2013). The PGE clustering can be applied to the magma evolution before it reaches the Musongati magma chamber, while the sulfide fractionation model can be applied after this point. The PGE mineralization model, however, needs further elaboration and verification for all KM intrusions, by determining the PGE distribution in all base metal sulfides and platinum group minerals.
77The primitive picritic magma (MgO > 12%; Duchesne et al., 2004; Maier et al., 2008) was likely S-undersaturated when it was generated in the source mantle, and for much of its journey up into the upper crust. The magma was possibly enriched in PGE and Ni due to high degrees of partial melting. Consequently, PGE clustering was the main process distributing the PGE into the silicate and possibly oxide (spinel) phases at this stage. PGE clustering basically involves the formation of stable molecular clusters of PGE with Fe, S and As (Robb, 2005; Kennedy, 2014). If the magma is undersaturated in sulfur, the clusters will be incorporated in olivine and chromite. If the magma is saturated in sulfur, the clusters will be captured by the sulfide melt (Ballhaus & Sylvester, 2000). During this phase, the PGE could have crystallized as refractory PGM, mainly Ru, Ir, Os and some Rh (Robb, 2005).
78However, the evidence from this paper and previous work (e.g. Maier et al., 2008) suggests that the magma crystallizing within the Musongati intrusion itself was already S-saturated. So from the moment the magma became sulfur saturated, which occurred before entering the Musongati magma chamber, the formation of an immiscible sulfide liquid occurred (cf. Arndt et al., 2005). Sulfur saturation of the magma chamber could be due to the compositional evolution of the magma in response to fractional crystallization, due to S or SiO2 addition during interaction with its surroundings (sediment assimilation; Maier et al., 2008) or due to magma mixing, as illustrated by the petrochemical evidence for (at least) two different magma pulses (e.g. Duchesne et al., 2004).
79At the moment of sulfur saturation, the chemical process of sulfide fractionation took over the PGE distribution (Zientek, 2012). All remaining PGE in the residual silicate melt would now be preferentially incorporated into the newly formed sulfide liquid in a similar manner due to their similar compatibility towards the immiscible sulfide liquid (Barnes & Maier, 1999).
80Thus, when the crystallization of olivine and a first series of refractory spinel minerals started, there was already an immiscible sulfide liquid present containing the PGE. Due to their relative higher density, the silicate minerals sank to the bottom of the magma chamber forming a cumulate, what is now called the dunitic Buhinda unit. In this cumulate, some droplets of sulfide liquid became trapped which would later result in PGE enriched BMS.
81As soon as S-saturation of the magma occurs, immiscible liquid sulfide droplets are formed in the magma (Junge et al., 2014), with a particular chemistry representative of the magma at that time. These then coalesce and settle, or are swept along by magmatic currents, together with the crystallizing olivine and chromite, to be deposited elsewhere in the magmatic plumbing system. This is a very dynamic system, and the abundance of sulfides in a given cumulate rock is due to a complex interplay of flow energy (turbulent versus laminar flow), density of crystal mush and direction of flow (Arndt et al., 2005).
82During cooling of the magma chamber, the sulfide liquid would fractionate into monosulfide solid solution (MSS; between 1190 and 1100 °C) and later on into intermediate solid solution (ISS; between 1000 and 850 °C) (Chen et al., 2015). Below 650 °C, MSS would crystallize pentlandite and pyrrhotite and ISS would crystallize chalcopyrite (Chen et al., 2015). Therefore the amount of Rh and Pd in pentlandite should be related to these sub-solidus processes. The Pd diffusion from the residual sulfide liquid into pentlandite which Chen et al. (2015) mention, could be included into our mineralization model because of the proportions of Pd in pentlandite, although this needs further verification. The residual (Cu-Pd-rich) sulfide liquid could also have escaped from the system at sub-solidus temperatures.
7. Conclusion
83This study looked at the PGE concentration and Pd and Rh distribution in different ultramafic samples from boreholes in the Musongati layered intrusion of the Kabanga-Musongati alignment in Burundi. In this light, it could be assessed if Musongati can serve as an economic PGE deposit and a preliminary PGE mineralization model could be proposed.
84Differences in PGE concentrations between the boreholes studied and at different depths in a borehole are present. Samples from boreholes in the peridotitic Buhinda unit (F221, F247 and F276) of the Musongati intrusion show a higher average PGE content over the entire depth of the borehole. Samples from boreholes in the pyroxenitic-peridotitic Geyuka unit (S59 and S60) have lower average PGE content, but show peaks in PGE concentration at certain depths. The latter could indicate the importance of periodic magma replenishment events. Upwards throughout the boreholes, all PGE concentrations decrease, indicating compatible behavior of all PGE. The PGE content of the Buhinda unit and the peaks in PGE content in the boreholes of the Geyuka unit are all ore-grade concentrations, indicating the potential for Musongati as a PGE deposit.
85Proportions of PGE in the analyzed pentlandite grains are between 4 and 69%, which are comparable to ~20-50% proportions in other PGE deposits such as the Bushveld Complex. The occurrence of BMS between the boundaries of rock-forming minerals, such as olivine and pyroxenes, is indicative of an early sulfur saturation stage. Such early sulfur saturation would have resulted in the PGE to be mainly extracted by the immiscible sulfide liquid during crystallization of the intrusion. These results demonstrate that a significant amount of PGE are hosted by sulfides. PGE clustering could have played a role in the PGE distribution before the magma entered the Musongati magma chamber. Nonetheless, sulfide fractionation played the major role in the PGE mineralization of the Musongati intrusion as supported by the data of this study and others. The preliminary model proposed in this paper needs further verification and elaboration to include all intrusions of the KM alignment.
8. Acknowledgments
86We would like to thank Dr. Elvira Vassilieva for performing the setup for the NiS FA analysis, the ICP-OES measurements and her advice throughout the study. Herman Nijs prepared excellent polished and thin sections for which we are grateful. We thank Pieter L’hoëst of the Materials Engineering Department of the KU Leuven and Laurence Monin of the RMCA for assistance with the FEG-EPMA and LA-ICP-MS, respectively. Miss Elisa Maupas is thanked for assistance with the FEG-EPMA. Prof. Dr. Ir. Tom Van Gerven of the Chemical Engineering Department of the KU Leuven is acknowledged for the arrangements involving the ICP-MS analyses and Michelle Vanroelen is thanked for carrying out the analyses. We would like to express our gratitude to Dr. Niels Hulsbosch and Dr. David Debruyne for their helpful comments and suggestions. We thank Prof. Dr. Jean-Clair Duchesne and one anonymous reviewer for their comments which helped improve the manuscript. Finally, we thank Dr. Annick Anceau for the excellent editorial handling.
9. Appendix
9.1. Replicate analyses
9.1.1. ICP-MS analysis
87The standard reference materials (SRM) used for the ICP-MS analysis were UMT-1 (Ultra Mafic ore Tailings; Canadian certified reference materials project) and WGB-1 (gabbro powder). Since PGE concentrations in WGB-1 were often below detection, however, the recoveries of UMT-1 provide a better knowledge of the recoveries. The recoveries of Rh and Pd, which will be of most interest for this study, were 106% and 99%, respectively (Table 6).
88Thirty samples were analyzed in three batches, with one blank and two SRM accompanying them per set. Although the solutions were prepared in different batches over a timespan of one month, the SRM showed no significant differences in concentrations due to aging of the samples. This aging, as can be seen with some rare earth elements (REE), is caused by the formation of complexes of certain elements which stick to the wall of the test tubes (Mareels 2004).
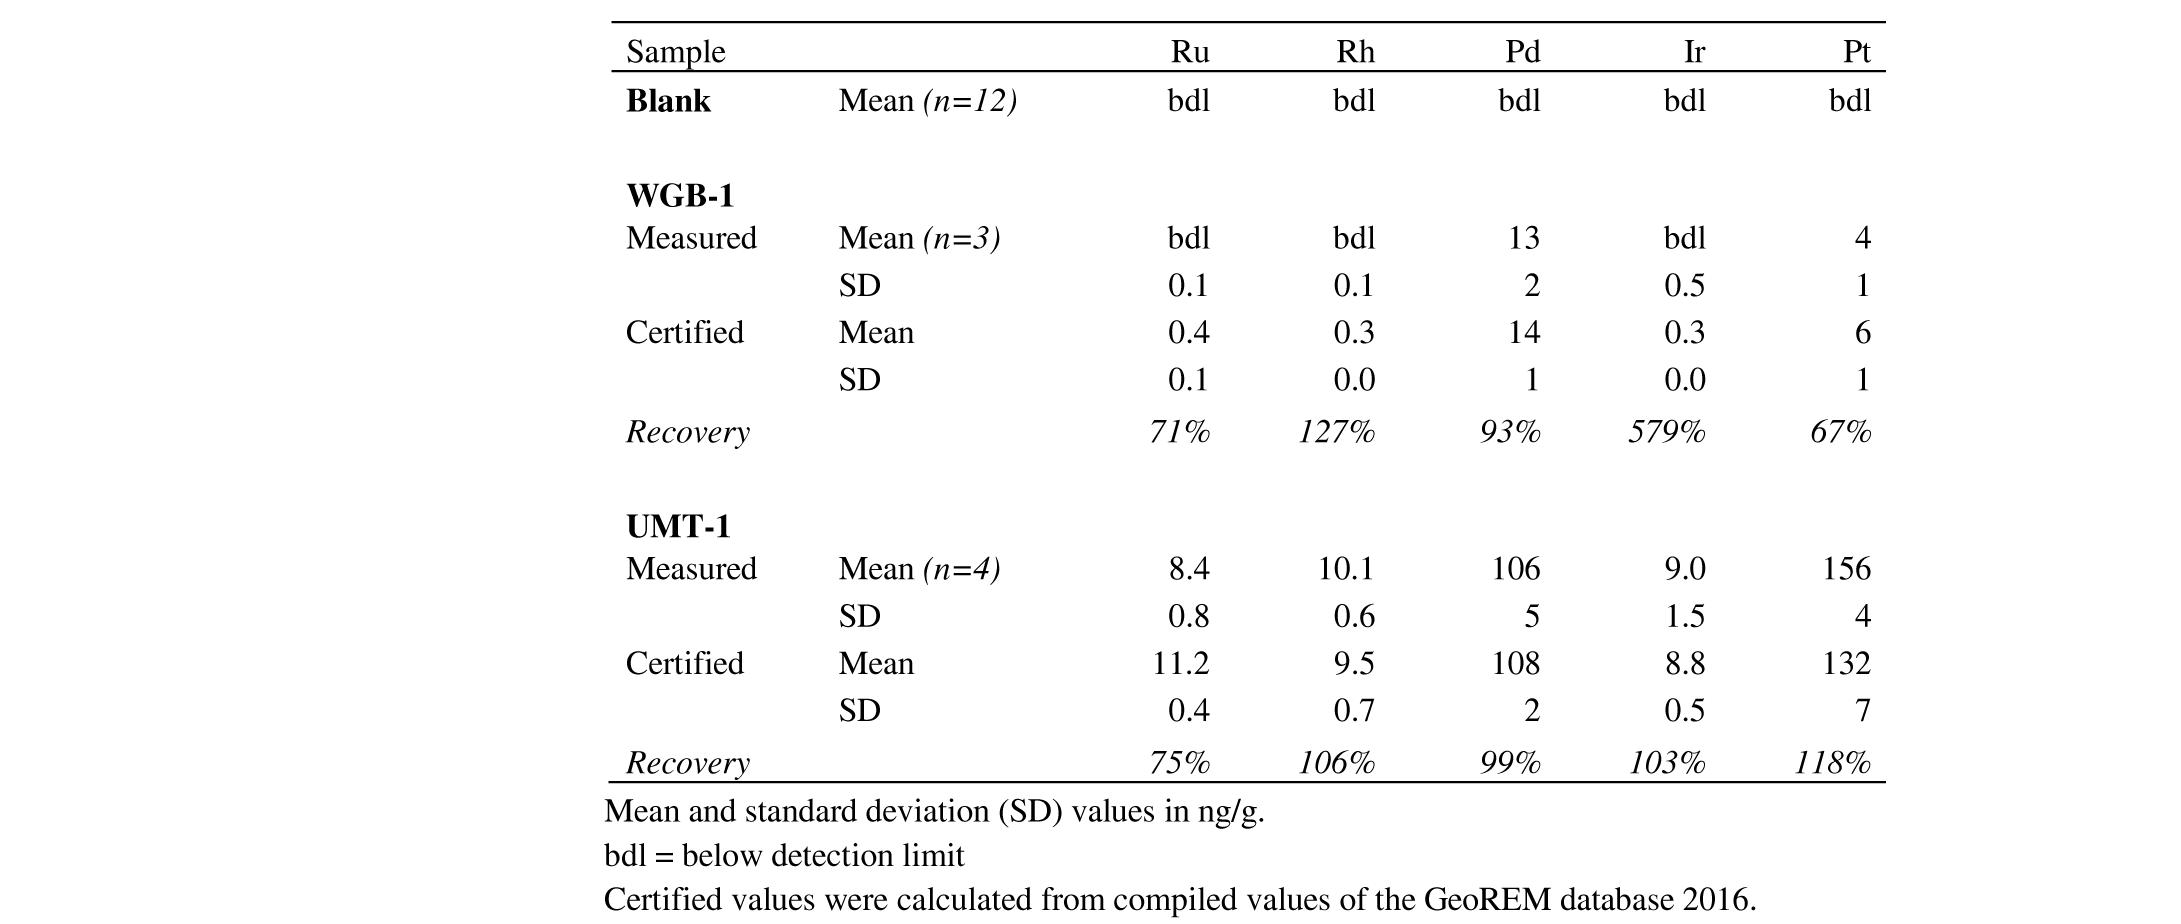
89Table 6. Results of replicate analyses of the standard reference materials WGB-1 and UMT-1 by ICP-MS.
9.1.2. ICP-OES analysis
90Two blanks and one SRM (DTS-1, dunite powder; United States Geological Survey) were included in the ICP-OES analysis. The recoveries for each of the elements for DTS-1 are displayed in Table 7. They range from 66% for Ca and 118% for Zn except for Al, Cr, and V which are known to be not quantitatively dissolved by the ‘four-acid digestion’ resulting in very low recoveries (5%, 19% and 13%, respectively). Therefore these three elements are not reported in the results. An extreme sulfur recovery of 250% can be explained by the combination of two facts: expected S concentrations in DTS-1 were below the detection limit and a slight sulfur contamination due to co-analysis of other enriched S samples.
91A replicate analysis of sample MU14BP15 was also performed to assess reproducibility. The standard deviations (SD) and percentage standard deviations (SD%) are reported in Table 7. The SD% ranged between 0.29-0.75 for each element with the exception of vanadium with a SD% of 6.09, due to its very low concentration in the sample.
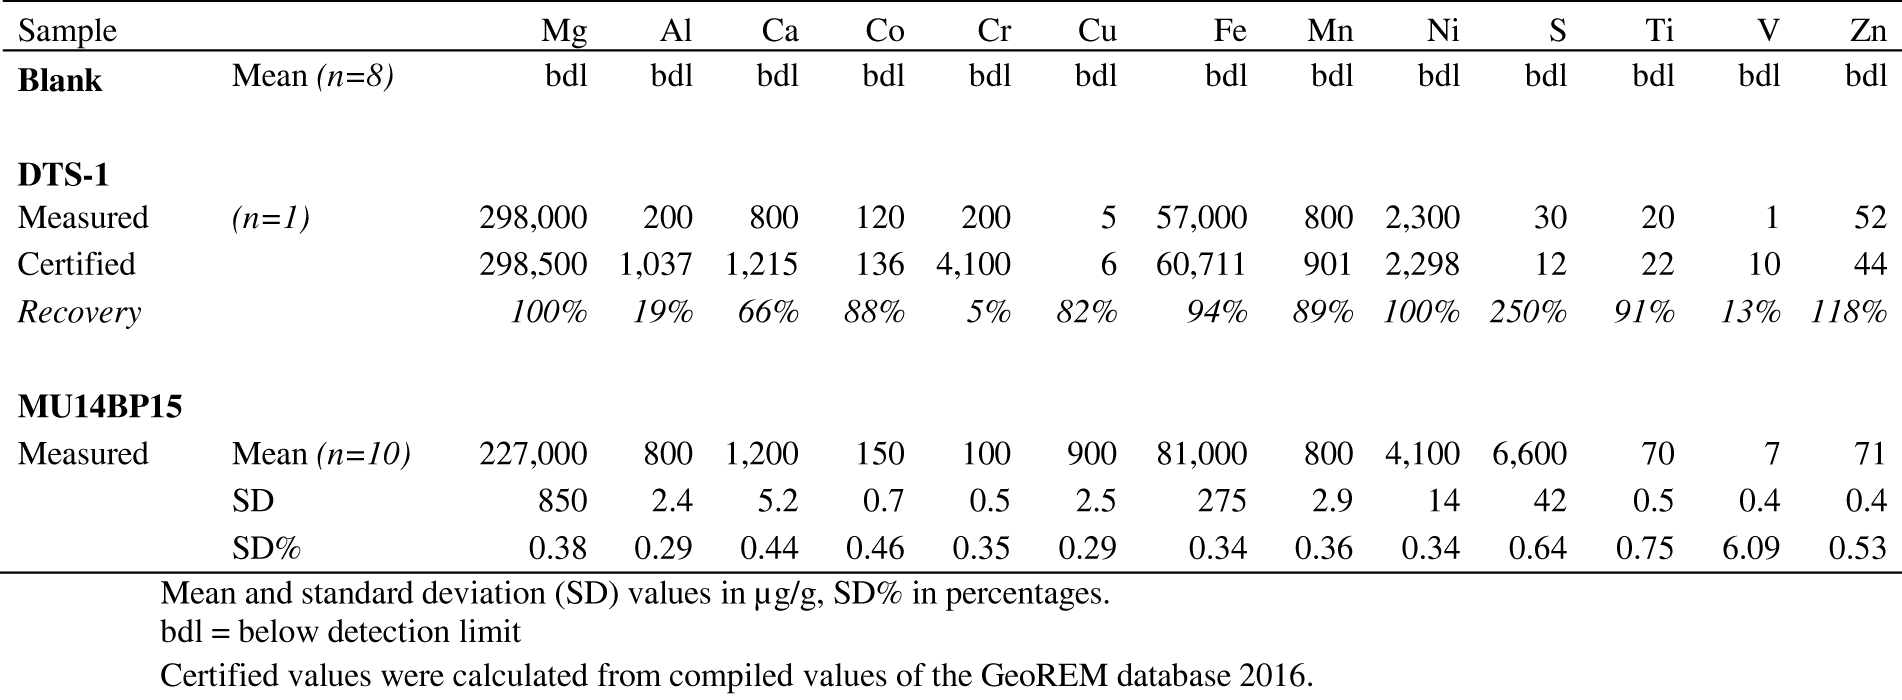
92Table 7. Results of replicate analyses of the standard reference material DTS-1 and sample MU14BP15 by ICP-OES.
9.1.3. LA-ICP-MS analysis
93Quality control was ensured by analyzing two SRM’s together with the samples. The SRM’s NIST610 and NIST612 (National Institute of Standards and Technology) were used as external standards for all elements except S, which was not quantified. They were analyzed three times at the start, two times in the middle and three times at the end of the LA-ICP-MS analysis to monitor instrumental drift. Results of the quality control can be found in Table 8 and show good recoveries for all PGE for NIST 610. The recoveries of NIST 612 are somewhat lower due to close-to detection limit PGE concentrations.
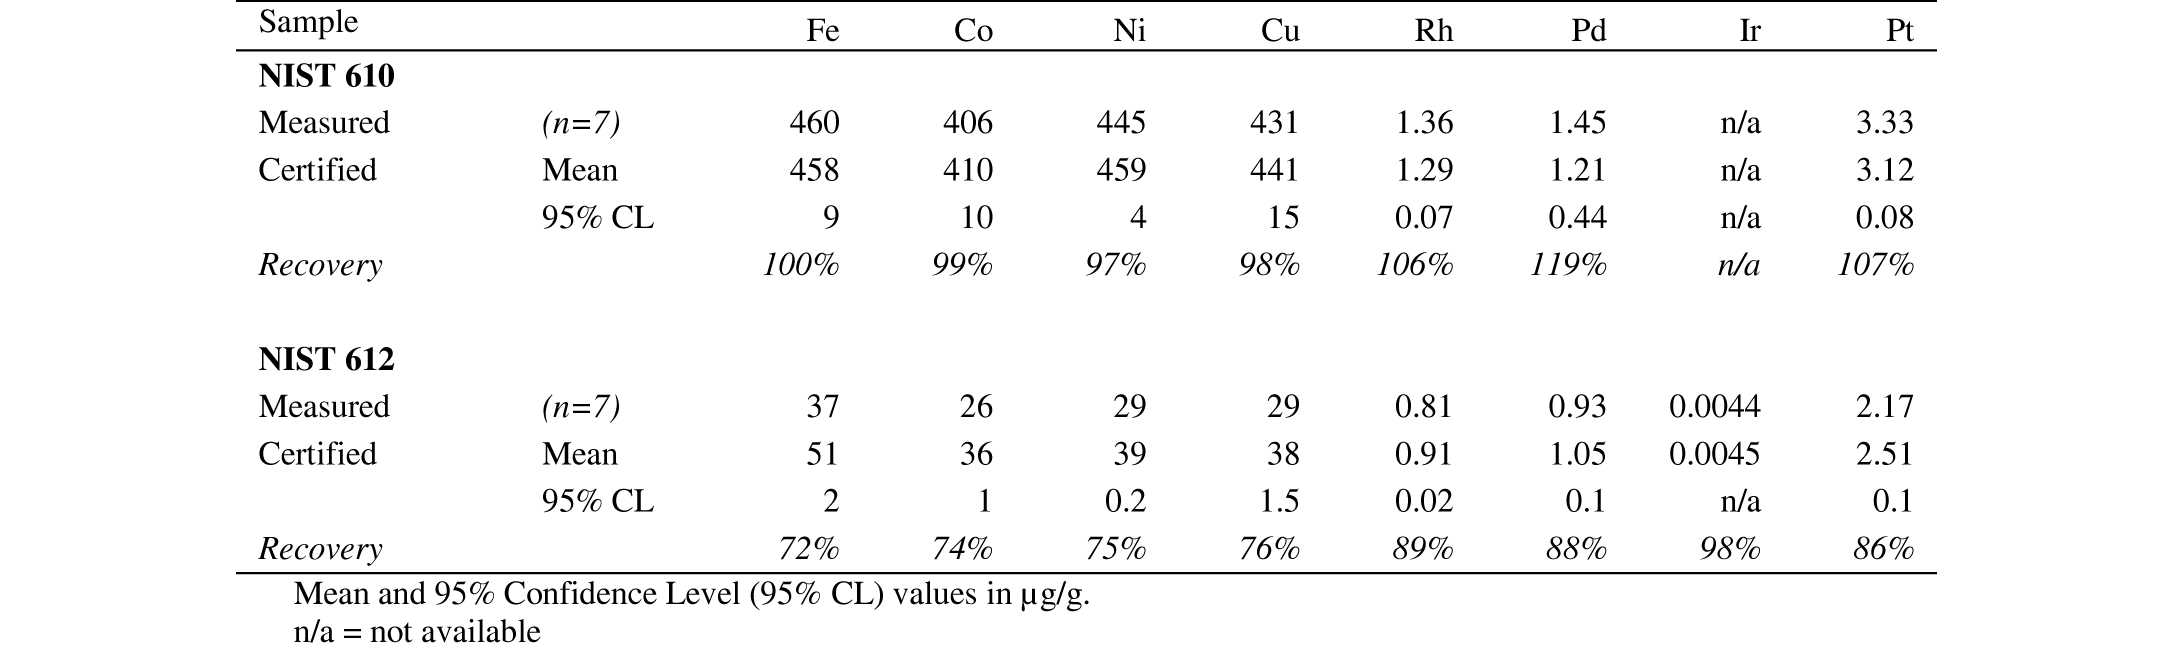
94Table 8. Results of replicate analyses of the standard reference materials NIST 610 and NIST 612 by LA-ICP-MS.
9.2. Regression analysis’ parameters
95Table 9 shows the parameters of the regression analysis, namely the R²-values and according p-values for linear and power-law regression on the population of samples from the Buhinda and Geyuka samples combined and separately.
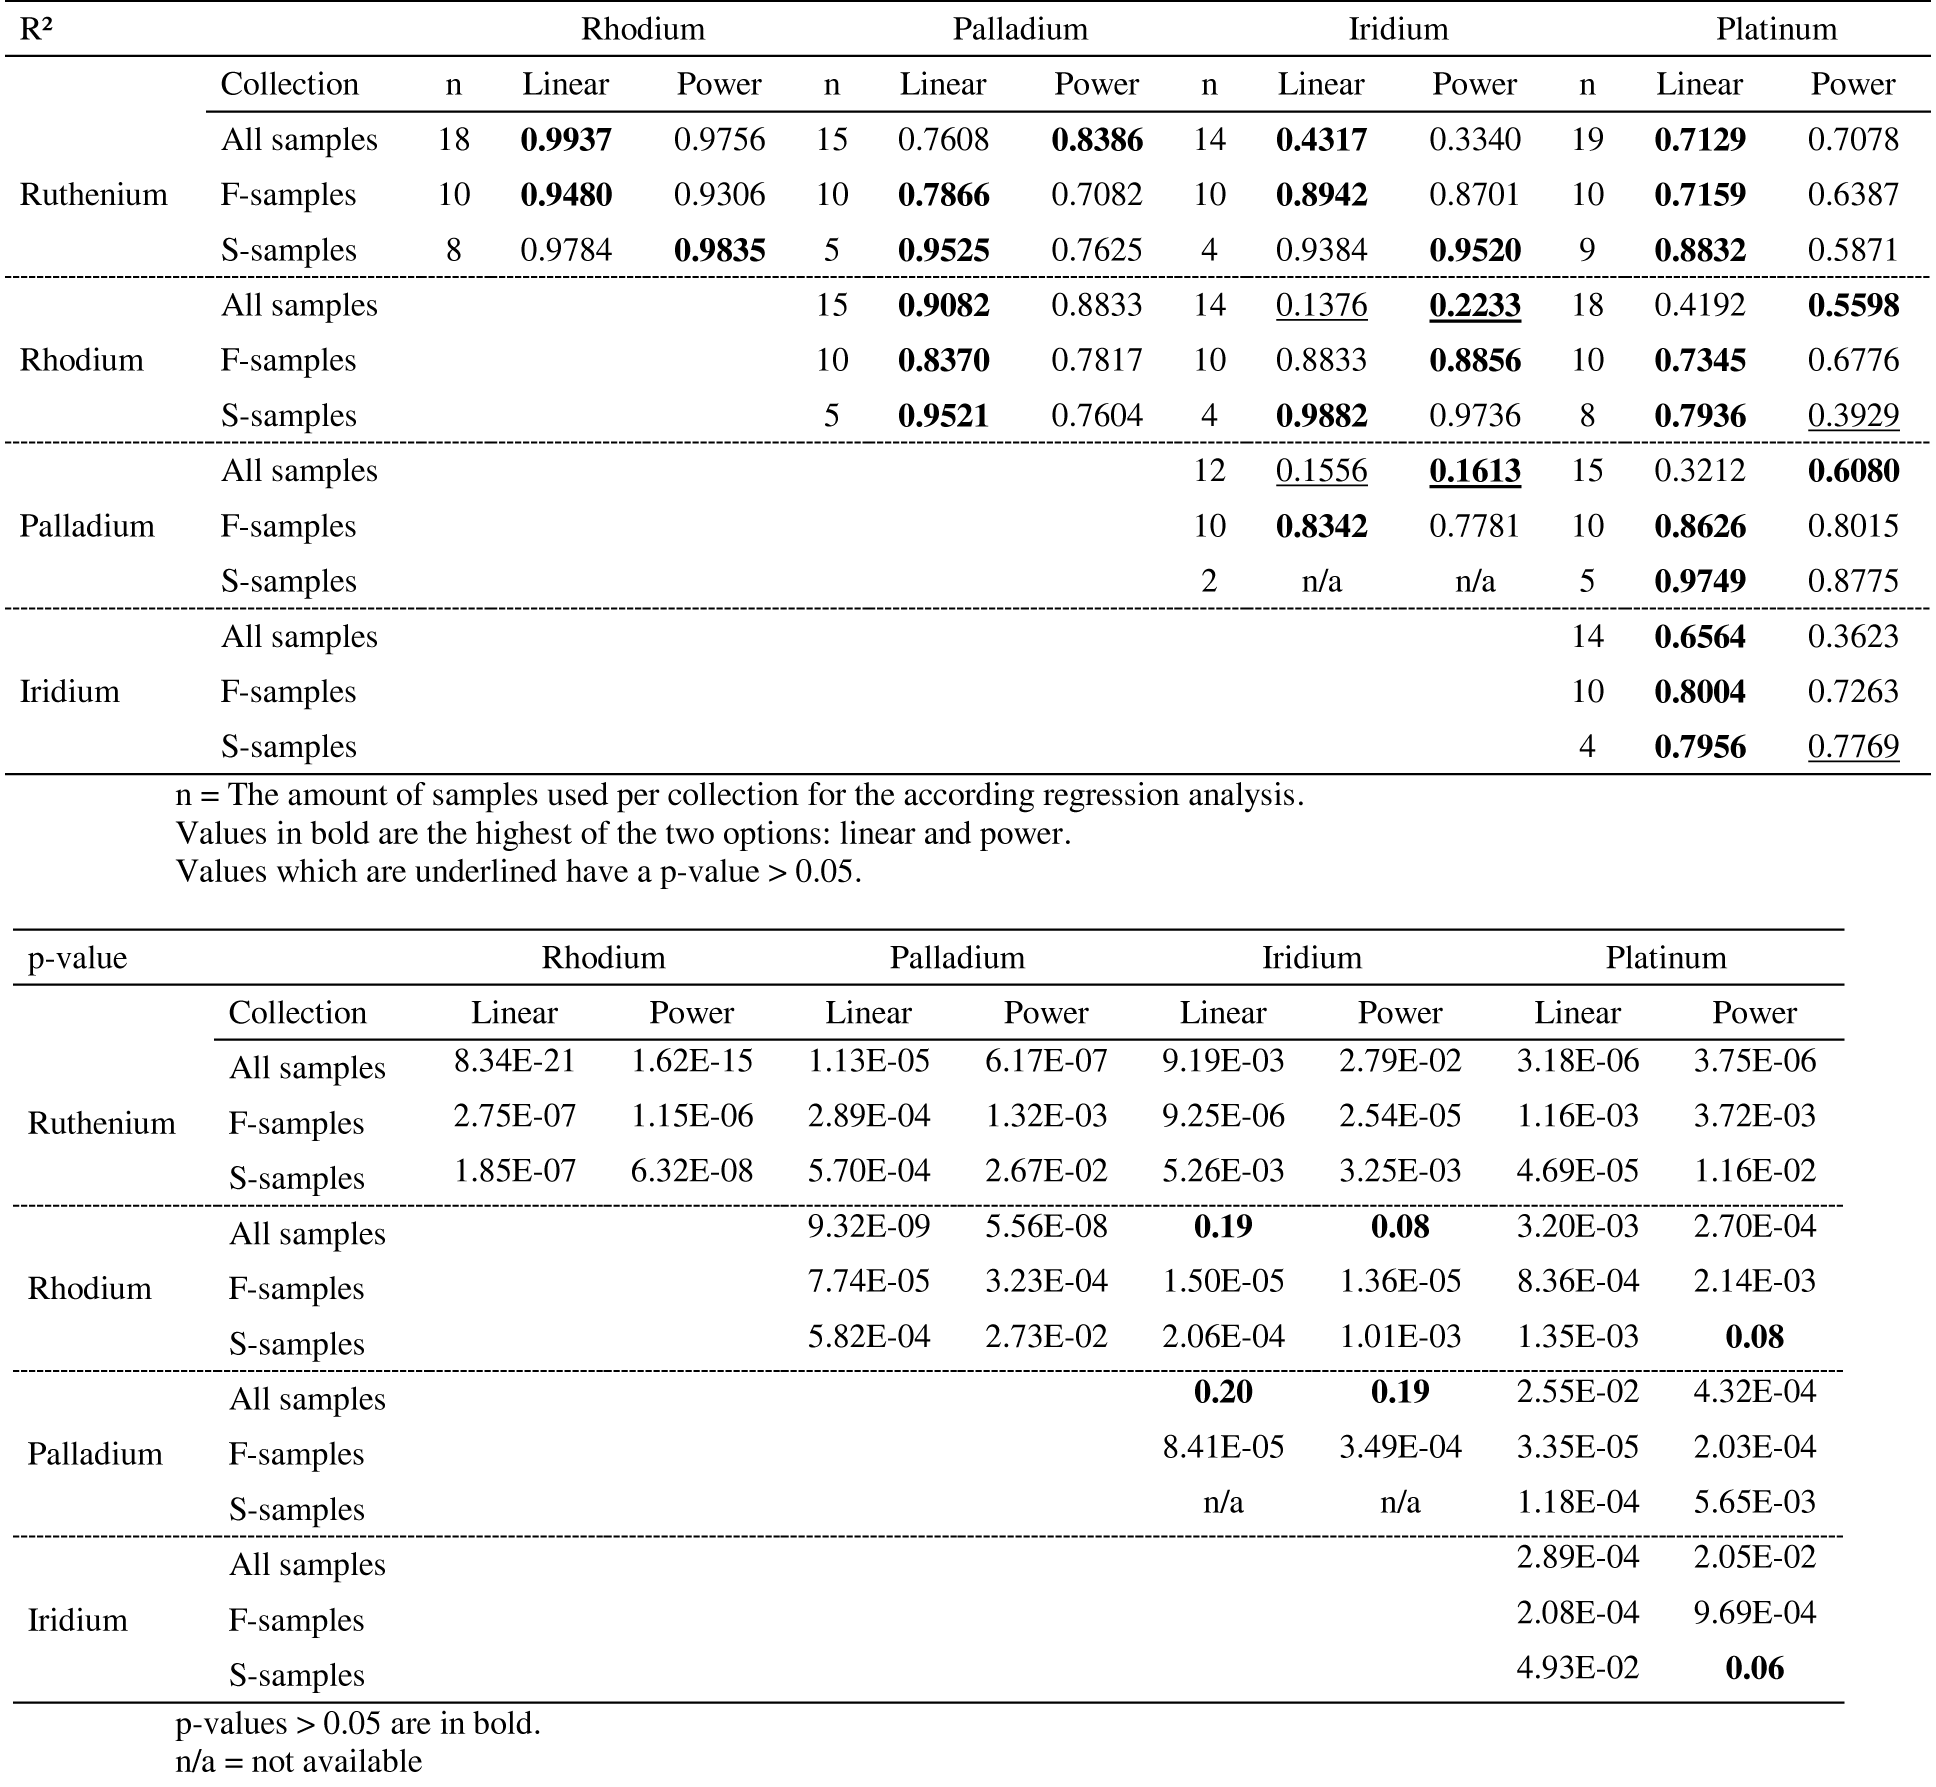
96Table 9. Parameters of Pearson regression analysis displayed in Figure 3. F-samples are from boreholes F221, F247 and F276 (Buhinda unit) and S-samples are from boreholes S59 and S60 (Geyuka unit). Linear regression is of the form: Y = A*X + B. Power law regression is of the form: Y = A*XB.
10. References
97Alard, O., Griffin, W.L., Lorand, J.-P., Jackson, S.E. & O’Reilly, S.Y., 2000. Non-chondritic distribution of the highly siderophile elements in mantle sulphides. Nature, 407, 891-894.
98Arndt, N., Lesher, C.M. & Czamanske, G.K., 2005. Mantle-derived magmas and magmatic Ni-Cu-(PGE) deposits. Economic Geology, 100, 5-24.
99Balcerzak, M., 2002. Sample digestion methods for the determination of traces of precious metals by spectrometric techniques. Analytical sciences, 18, 737-750.
100Ballhaus, C. & Sylvester, P., 2000. Noble metal enrichment processes in the Merensky Reef, Bushveld Complex. Journal of Petrology, 41, 545-561.
101Bandyayera, D., 1997. Formation des latérites nickélifères et mode de distribution des éléments du groupe du platine dans les profils latériques du complexe de Musongati, Burundi. Unpublished PhD thesis. Université du Québec à Chicoutimi, Canada, 494 p.
102Barnes, S.-J. & Maier, W.D., 1999. The fractionation of Ni, Cu and the noble metals in silicate and sulphide liquids. In Keays, R.R., Lesher, C.M., Lightfoot, P.C. & Farrow, C.E.G. (eds), Dynamic processes in magmatic ore deposits and their application in mineral exploration. Geological Association of Canada, Short Course, 13, 69-106.
103Barnes, S.-J. & Maier, W.D., 2002. Platinum-group element distributions in the Rustenburg Layered Suite of the Bushveld Complex , South Africa. In Cabri, L.J. (ed.), The Geology, Geochemistry, Mineralogy and Mineral Beneficiation of Platinum-Group Elements. Canadian Institute of Mining, Metallurgy and Petroleum, Westmount, Special volume 54, 431-458.
104Barnes, S.J., Cox, R.A. & Zientek, M.L., 2006. Platinum-group element, gold, silver and base metal distribution in compositionally zoned sulfide droplets from the Medvezky Creek Mine, Noril’sk, Russia. Contributions to Mineralogy and Petrology, 152, 187-200.
105Barnes, S.-J., Prichard, H.M., Cox, R.A., Fisher, P.C. & Godel, B., 2008. The location of the chalcophile and siderophile elements in platinum-group element ore deposits (a textural, microbeam and whole rock geochemical study): Implications for the formation of the deposits. Chemical Geology, 248, 295-317.
106Cahen, L., Delhal, J., Vail, J.R., Bonhomme, M. & Ledent, D., 1984. The geochronology and evolution of equatorial Africa. Clarendon Press, Oxford, 495 p.
107Chen, L.-M., Song, X.-Y., Danyushevsky, L. V., Wang, Y.-S., Tian, Y.-L. & Xiao, J.-F., 2015. A laser ablation ICP-MS study of platinum-group and chalcophile elements in base metal sulfide minerals of the Jinchuan Ni–Cu sulfide deposit, NW China. Ore Geology Reviews, 65, 955-967.
108Dare, S.A.S., Barnes, S.-J. & Prichard, H.M., 2010. The distribution of platinum group elements (PGE) and other chalcophile elements among sulfides from the Creighton Ni–Cu–PGE sulfide deposit, Sudbury, Canada, and the origin of palladium in pentlandite. Mineralium Deposita, 45, 765-793.
109Dare, S.A.S., Barnes, S.J., Prichard, H.M. & Fisher, P.C., 2011. Chalcophile and platinum-group element (PGE) concentrations in the sulfide minerals from the McCreedy East deposit, Sudbury, Canada, and the origin of PGE in pyrite. Mineralium Deposita, 46, 381-407.
110Deblond, A., 1993. Géologie et pétrologie des massifs basiques de la ceinture Kabanga-Musongati au Burundi. Unpublished PhD thesis. University of Liège, 235 p.
111Deblond, A., 1994. Géologie et pétrologie des massifs basiques et ultrabasiques de la ceinture Kabanga-Musongati au Burundi. Annales du Musée Royal de l’Afrique Centrale, Tervuren, Sciences Géologiques, 99, 1-123.
112Deblond, A. & Tack, L., 1999. Main characteristics and review of mineral resources of the Kabanga-Musongati mafic-ultramafic alignment in Burundi. Project summary report. Journal of African Earth Sciences, 29, 313-328.
113Debruyne, D., Hulsbosch, N., Van Wilderode, J., Balcaen, L., Vanhaecke, F. & Muchez, P., 2015. Regional geodynamic context for the Mesoproterozoic Kibara Belt (KIB) and the Karagwe - Ankole Belt: evidence from geochemistry and isotopes in the KIB. Precambrian Research, 264, 82-97.
114Duchesne, J.C., Liégeois, J.P., Deblond, A. & Tack, L., 2004. Petrogenesis of the Kabanga-Musongati layered mafic-ultramafic intrusions in Burundi (Kibaran Belt): Geochemical, Sr-Nd isotopic constraints and Cr-Ni behaviour. Journal of African Earth Sciences, 39, 133-145.
115Duran, C.J., Barnes, S.-J. & Corkery, J.T., 2015. Chalcophile and platinum-group element distribution in pyrites from the sulfide-rich pods of the Lac des Iles Pd deposits, Western Ontario, Canada: Implications for post-cumulus re-equilibration of the ore and the use of pyrite compositions in exploration. Journal of Geochemical Exploration, 158, 223-242.
116European Commission, 2014. Report on critical raw materials for the EU, Report of the Ad hoc Working Group on defining critical raw materials. Brussels, Belgium, 41 p.
117Evans, D.M., Boadi, I., Byemelwa, L., Gilligan, J., Kabete, J. & Marcet, P., 2000. Kabanga magmatic nickel sulphide deposits, Tanzania: morphology and geochemistry of associated intrusions. Journal of African Earth Sciences, 30, 651-674.
118Exploration und Bergbau Gmbh, 1985. Final report on exploration of the Buhinda nickel deposit at Musongati, Burundi. Düsseldorf, Germany, Project summary report, 1, 46 p.
119Fernandez-Alonso, M., Cutten, H., De Waele, B., Tack, L., Tahon, A., Baudet, D. & Barritt, S.D., 2012. The Mesoproterozoic Karagwe-Ankole Belt (formerly the NE Kibara Belt): The result of prolonged extensional intracratonic basin development punctuated by two short-lived far-field compressional events. Precambrian Research, 216–219, 63-86.
120Franchuk, A., Lightfoot, P.C. & Kontak, D.J., 2015. High tenor Ni-PGE sulfide mineralization in the south Manasan ultramafic intrusion, Paleoproterozoic Thompson Nickel Belt, Manitoba, Canada. Ore Geology Reviews, 72, 434-458.
121Garuti, G., Oddone, M. & Torres-Ruiz, J., 1997. Platinum-group-element distribution in subcontinental mantle: evidence from the Ivrea Zone (Italy) and the Betic – Rifean cordillera (Spain and Morocco). Canadian Journal of Earth Sciences, 34, 444-463.
122Gros, M., Lorand, J.-P. & Luguet, A., 2002. Analysis of platinum group elements and gold in geological materials using NiS fire assay and Te coprecipitation; the NiS dissolution step revisited. Chemical Geology, 185, 179-190.
123Huber, H., Koeberl, C., McDonald, I. & Reimold, W.U., 2001. Geochemistry and petrology of Witwatersrand and Dwyka diamictites from South Africa: search for an extraterrestrial component. Geochimica et Cosmochimica Acta, 65, 2007-2016.
124Jedwab, J., 1987. Bref aperçu des minéraux de Pt, Pd et Ir trouvés par microsonde dans les roches du massif ultrabasique de Musongati (Burundi). Musée Royal de l’Afrique Centrale, Département Géologie et de Minéralogie, Rapport Annuel 1985-l986, Tervuren, Belgium, 83-87.
125Junge, M., Oberthur, T. & Melcher, F., 2014. Cryptic variation of chromite chemistry, platinum group element and platinum group mineral distribution in the UG-2 chromitite: an example from the Karee Mine, western Bushveld Complex, South Africa. Economic Geology, 109, 795-810.
126Junge, M., Wirth, R., Oberthür, T., Melcher, F. & Schreiber, A., 2015. Mineralogical siting of platinum-group elements in pentlandite from the Bushveld Complex, South Africa. Mineralium Deposita, 50, 41-54.
127Juvonen, R., Lakomaa, T. & Soikkeli, L., 2002. Determination of gold and the platinum group elements in geological samples by ICP-MS after nickel sulphide fire assay: difficulties encountered with different types of geological samples. Talanta, 58, 595-603.
128Kennedy, B., 2014. Investigation of the possibility of platinum-group element clusters in magmatic systems, using synthetic sulphide melts. Unpublished PhD thesis. University of the Free State, South Africa, 190 p.
129Kennedy, B., Tredoux, M., Ballhaus, C., Coetsee, E. & Steyl, G., 2013. The possible influence of PGE clusters on phase associations in Ni-Cu-S deposits , as deduced from synthetic sulphide systems. In Jonsson, E. et al. (eds), 12th SGA Biennial Meeting "Mineral deposits research for a high-tech world". Uppsala, Sweden, 12-15 August 2013, Abstract Volume, 159-161.
130Klerkx, J., 1975. Rapport préliminaire de l’étude pétrographique et minéralogique du sondage n° 59 de Musongati. Unpublished report. Tervuren, Belgium, 13 p.
131Klerkx, J., 1976. Etude pétrographique et minéralogique du sondage S 60 Musongati. Unpublished report. Tervuren, Belgium, 10 p.
132Klerkx, J., Theunissen, K. & Delvaux, D., 1998. Persistent fault controlled basin formation since the Proterozoic along the Western Branch of the East African Rift. Journal of African Earth Sciences, 26, 347-361.
133Koegelenberg, C. & Kisters, A.F.M., 2014. Tectonic wedging, back-thrusting and basin development in the frontal parts of the Mesoproterozoic Karagwe-Ankole belt in NW Tanzania. Journal of African Earth Sciences, 97, 87-98.
134Kokonyangi, J.W., Kampunzu, A.B., Poujol, M., Okijdaira, T., Yoshida, M. & Shabeer, K.P., 2005. Petrology and geochronology of Mesoproterozoic mafic–intermediate plutonic rocks from Mitwaba (D. R. Congo): implications for the evolution of the Kibaran belt in central Africa. Geological Magazine, 142, 109-130.
135Kokonyangi, J.W., Kampunzu, A.B., Armstrong, R., Yoshida, M., Okudaira, T., Arima, M. & Ngulube, D.A., 2006. The Mesoproterozoic Kibaride belt (Katanga, SE D.R. Congo). Journal of African Earth Sciences, 46, 1-35.
136Le Bas, M.J. & Streckeisen, A.L., 1991. The IUGS systematics of igneous rocks. Journal of the Geological Society, London, 148, 825-833.
137Lightfoot, P. & Evans-Lamswood, D., 2015. Structural controls on the primary distribution of mafic-ultramafic intrusions containing Ni-Cu-Co-(PGE) sulphide mineralization in the roots of large igneous provinces. Ore Geology Reviews, 64, 354-386.
138Maier, W.D. & Barnes, S.J., 2010. The Kabanga Ni sulfide deposits, Tanzania: II. Chalcophile and siderophile element geochemistry. Mineralium Deposita, 45, 443-460.
139Maier, W.D., Peltonen, P. & Livesey, T., 2007. The ages of the Kabanga North and Kapalagulu intrusions, Western Tanzania: A reconnaissance study. Economic Geology, 102, 147-154.
140Maier, W.D., Barnes, S.J., Bandyayera, D., Livesey, T., Li, C. & Ripley, E., 2008. Early Kibaran rift-related mafic-ultramafic magmatism in western Tanzania and Burundi: Petrogenesis and ore potential of the Kapalagulu and Musongati layered intrusions. Lithos, 101, 24-53.
141Maier, W.D., Barnes, S.J., Sarkar, A., Ripley, E., Li, C. & Livesey, T., 2010. The Kabanga Ni sulfide deposit, Tanzania: I. Geology, petrography, silicate rock geochemistry, and sulfur and oxygen isotopes. Mineralium Deposita, 45, 419-441.
142Malitch, K.N., Latypov, R.M., Badanina, I.Y. & Sluzhenikin, S.F., 2014. Insights into ore genesis of Ni-Cu-PGE sulfide deposits of the Noril’sk Province (Russia): Evidence from copper and sulfur isotopes. Lithos, 204, 172-187.
143Mareels, J., 2004. ICP - MS Analysis, Geochemistry and Petrogenesis of Granites from the Variscan Northern Vosges (France). Unpublished PhD thesis. KU Leuven, 355 p.
144Mungall, J.E. & Brenan, J.M., 2014. Partitioning of platinum-group elements and Au between sulfide liquid and basalt and the origins of mantle-crust fractionation of the chalcophile elements. Geochimica et Cosmochimica Acta, 125, 265-289.
145Mungall, J.E., Brenan, J.M., Godel, B., Barnes, S.J. & Gaillard, F., 2015. Transport of metals and sulphur in magmas by flotation of sulphide melt on vapour bubbles. Nature Geoscience, 8, 216-219.
146Naldrett, A.J., 2004. Magmatic Sulfide Deposits: Geology. Geochemistry and Exploration. Springer-Verlag, Berlin, 728 p.
147Naldrett, A.J. & Wilson, A., 1990. Horizontal and vertical variations in noble-metal distribution in the Great Dyke of Zimbabwe: A model for the origin of the PGE mineralization by fractional segregation of sulfide. Chemical Geology, 88, 279-300.
148Oberthür, T., Junge, M., Rudashevsky, N., de Meyer, E. & Gutter, P., 2015. Platinum-group minerals in the LG and MG chromitites of the eastern Bushveld Complex, South Africa. Mineralium Deposita, 50, 1-17.
149Oguri, K., Shimoda, G. & Tatsumi, Y., 1999. Platinum-group elements in geological samples using improved NiS fire-assay and tellurium coprecipitation with inductively coupled plasma-mass spectrometry (ICP-MS). Chemical Geology, 157, 189-197.
150Osbahr, I., Oberthür, T., Klemd, R. & Josties, A., 2014. Platinum-group element distribution in base-metal sulfides of the UG2 chromitite, Bushveld Complex, South Africa – a reconnaissance study. Mineralium Deposita, 49, 655-665.
151Park, J.W., Campbell, I.H., Kim, J. & Moon, J.W., 2015. The role of late sulfide saturation in the formation of a Cu- and Au-rich magma: Insights from the platinum group element geochemistry of Niuatahi–Motutahi lavas, Tonga Rear Arc. Journal of Petrology, 56, 59-81.
152Piña, R., Gervilla, F., Barnes, S.-J., Ortega, L., Martinez-Frias, J. & Lunar, R., 2010. Platinum-group element concentrations in pyrrhotite, pentlandite, chalcopyrite and pyrite from the Aguablanca Ni-Cu ore deposit (southwest Spain). In Brown, G.H., Jugo, P.J., Lesher, C.M. & Mungall, J.E. (eds), 11th International Platinum Symposium, Sudbury, Ontario, Canada, 21-24 June 2010. Ontario Geological Survey, Miscellaneous Release-Data 269, 4 p.
153Piña, R., Gervilla, F., Barnes, S.J., Oberthür, T. & Lunar, R., 2016. Platinum-group element concentrations in pyrite from the Main Sulfide Zone of the Great Dyke of Zimbabwe. Mineralium Deposita, 1-20.
154PNUD-UNDP, 1977. Programme des Nations Unies pour le Développement-United Nations Development Program. Recherches minières. Rapport technique. Gisements latéritiques de Nickel au Burundi. Préparé pour le Gouvernement Burundais par l’Organisation des Nations Unies, 39 p.
155Rao, C.R. & Reddi, G., 2000. Platinum group metals (PGM): occurrence, use and recent trends in their determination. Trends in Analytical Chemistry, 19, 565-586.
156Ripley, E.M. & Li, C., 2013. Sulfide saturation in mafic magmas: Is external sulfur required for magmatic Ni-Cu-(PGE) ore genesis? Economic Geology, 108, 45-58.
157Robb, L., 2005. Introduction to Ore-Forming Processes. Blackwell Publishing Ltd , Oxford, 384 p.
158Sagnotti, L., 2007. Iron sulfides. In Gubbins, D. & Herrero-Bervera, E. (eds), Encyclopedia of Geomagnetism and Paleomagnetism. Springer, Dordrecht, 454-459.
159Smith, J.W., Holwell, D.A. & McDonald, I., 2014. Precious and base metal geochemistry and mineralogy of the Grasvally Norite–Pyroxenite–Anorthosite (GNPA) member, northern Bushveld Complex, South Africa: implications for a multistage emplacement. Mineralium Deposita, 49, 667-692.
160Tack, L., Wingate, M.T.D., De Waele, B., Meert, J., Belousova, E., Griffin, B., Tahon, A. & Fernandez-Alonso, M., 2010. The 1375 Ma “Kibaran event” in Central Africa: Prominent emplacement of bimodal magmatism under extensional regime. Precambrian Research, 180, 63-84.
161Tagle, R. & Berlin, J., 2008. A database of chondrite analyses including platinum group elements, Ni, Co, Au, and Cr: Implications for the identification of chondritic projectiles. Meteoritics & Planetary Science, 43, 541-559.
162Wilhelmij, H.R. & Cabri, L.J., 2015. Platinum mineralization in the Kapalagulu Intrusion, western Tanzania. Mineralium Deposita, 51, 343-367.
163Zientek, M.L., 2012. Magmatic ore deposits in layered intrusions – Descriptive model for reef-type PGE and contact-type Cu-Ni-PGE deposits. USGS Open-File Report, 1010, 54 p.
164Manuscript received 23.02.2016, accepted in revised form 26.10.2016, available online 19.02.2017.
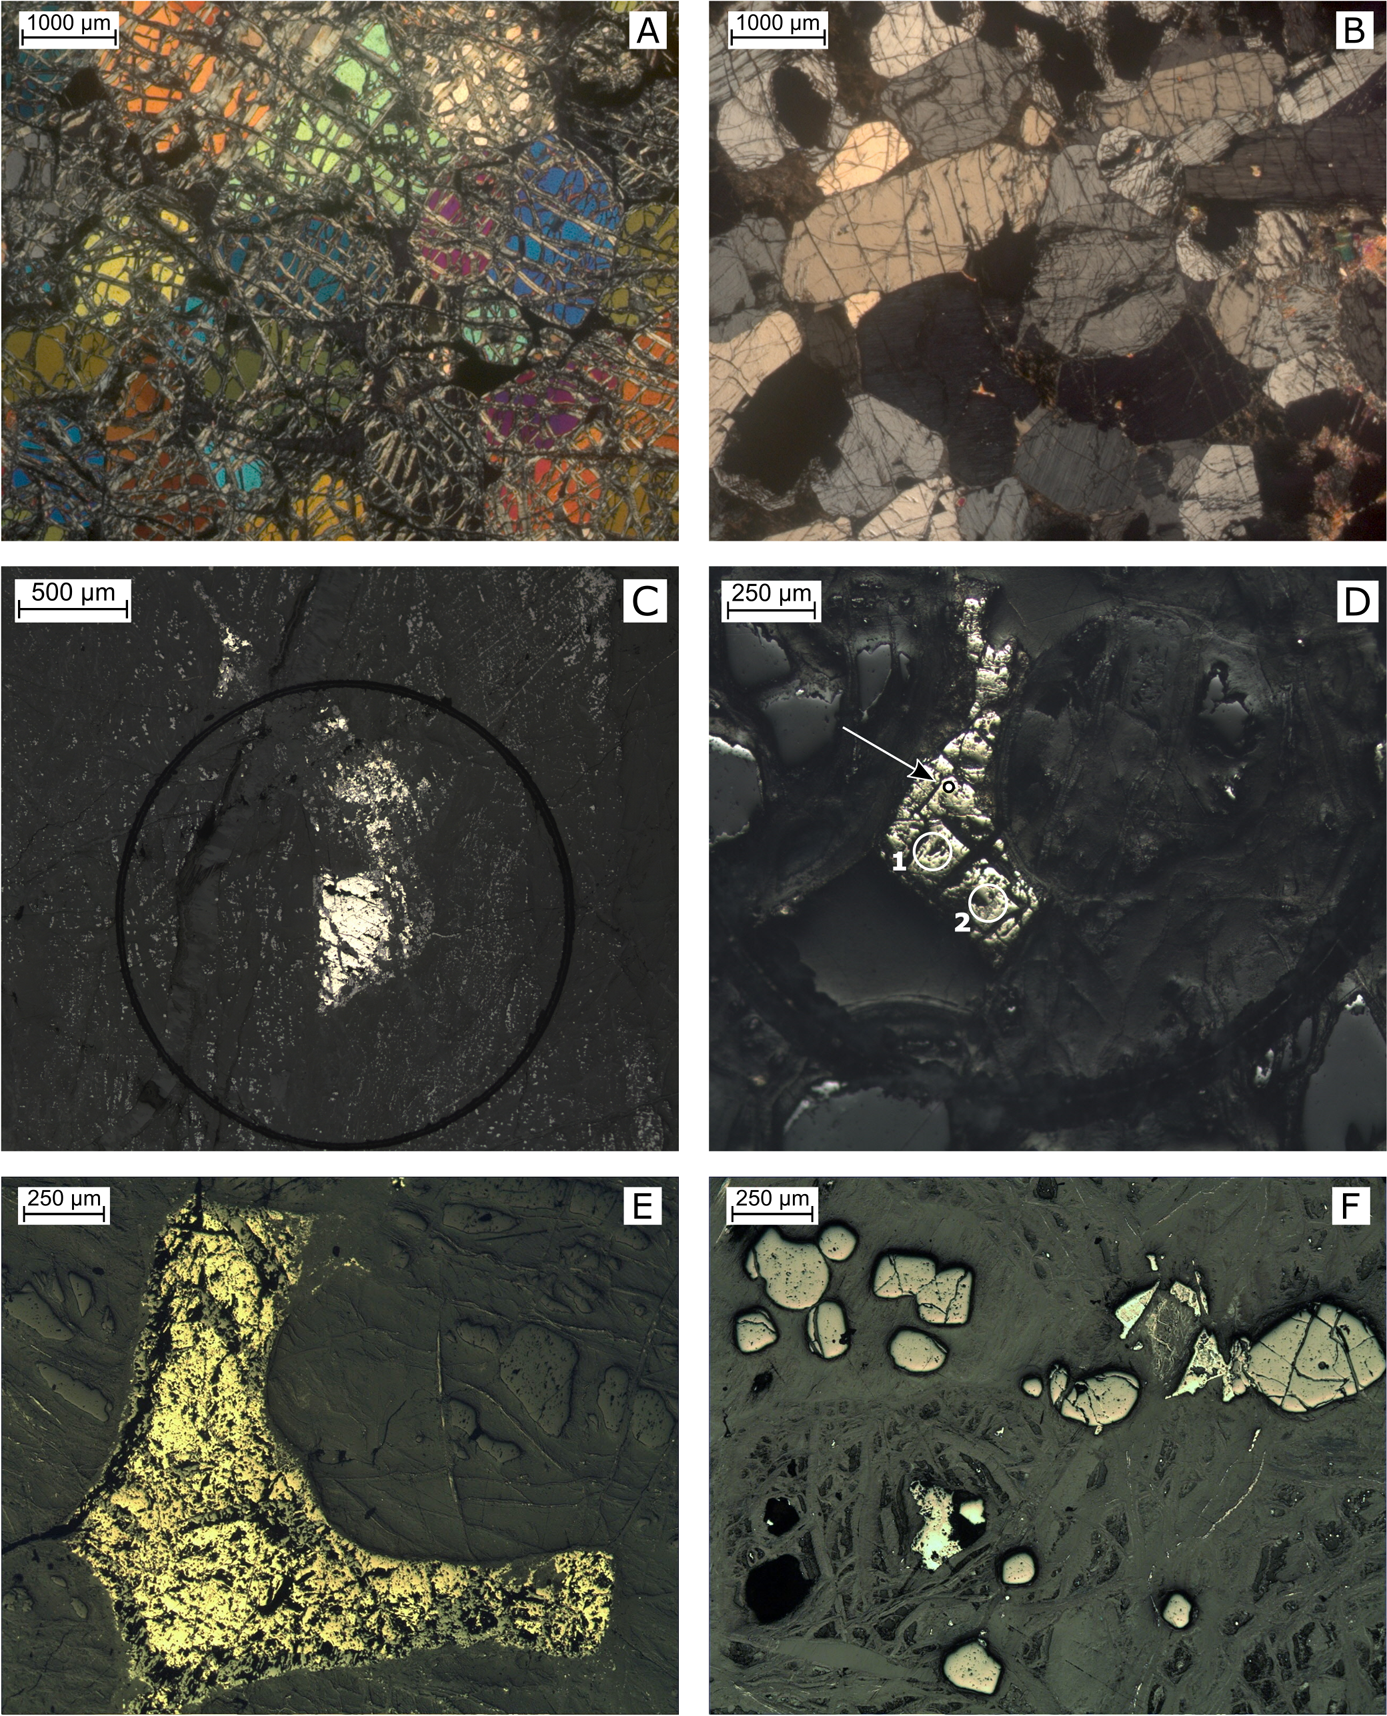
165Plate 1. (A) MU14BP13 / F247-61: Olivine grains with high interference colors (crossed polars). (B) MU14BP29 / S59-100.3 m: Orthopyroxene grains with low interference colors (crossed polars). (C) MU14BP31B_5 / S59‑314.5: Disseminated sulfides and Fe-oxides. Black circle is the carved line to mark the measurement zone. (D) MU14BP15_3 / F247-100: Pentlandite grain showing one FEG-EPMA and two LA-ICP-MS measurement spots in small and big white circles, respectively. Black circle idem as C. (E) MU14BP33 / S59‑428‑456: Pyrrhotite and pentlandite surrounded and intertwined by grey colored Fe-oxides. The Y-shape is probably due to the sulfides and oxides being present at the boundaries between various olivine grains. (F) MU14BP26 / S59‑4.5: Spinel grains (high relief is due to polishing method).
