


- Accueil
- Volume 21 (2018)
- number 1-2
- A new geological map of the outcrop areas of the Brabant Massif (Belgium)


Visualisation(s): 9207 (167 ULiège)
Téléchargement(s): 2383 (72 ULiège)

A new geological map of the outcrop areas of the Brabant Massif (Belgium)

Document(s) associé(s)
Annexes
Abstract
As a result of the “new geological map of Wallonia” program undertaken by the Walloon Government since 1990, all the maps at 1/25 000 scale covering the outcrop areas of the Brabant Massif have been finalised. During the long period of mapping (1993-2017) our understanding of the stratigraphy and tectonics of the Brabant Massif has evolved significantly and this led to several inconsistencies between different maps. We present here an overarching geological map of the outcrop areas of the Brabant Massif, resulting from the merging of these 21 maps, updated according to the most recent findings and insights. The resulting map, at a scale of ~1/200 000, shows a coherent image of the outcrop areas of the Brabant Massif. This map better illustrates the geological history and structural architecture of the Brabant Massif compared to previous maps (e.g. Fourmarier, 1921; Legrand, 1968) and allows for a better understanding of the geology of the Brabant Massif. Also, it fully complements the subcrop map of the Brabant Massif of Piessens et al. (2005, in prep.).
Table des matières
1. Introduction
1As a result of the “new geological map of Wallonia” program undertaken by the Walloon Government since 1990, the maps covering the entire southern outcropping part of the Brabant Massif (BM) have been finalised (Fig. 1). These 19 maps at 1/25 000 scale (12 full and 7 partial, Fig. 2; Annex 1), were realized between 1993 and 2017 by several teams of the universities of Brussels (ULB), Louvain (UCL) and Mons (Umons), with occasional input from experts from UGent and KULeuven. During the last two decades the authors’ research has been heavily focused on the geology of the Brabant Massif and they have contributed to the realization of half of these maps, particularly those that cover the Dyle and the Senne valleys (e.g. Verniers et al., 2005; Debacker et al., 2005b, 2011; Herbosch et al., 2008a; Herbosch & Verniers, 2013, 2014, 2015; see also Annex 1).
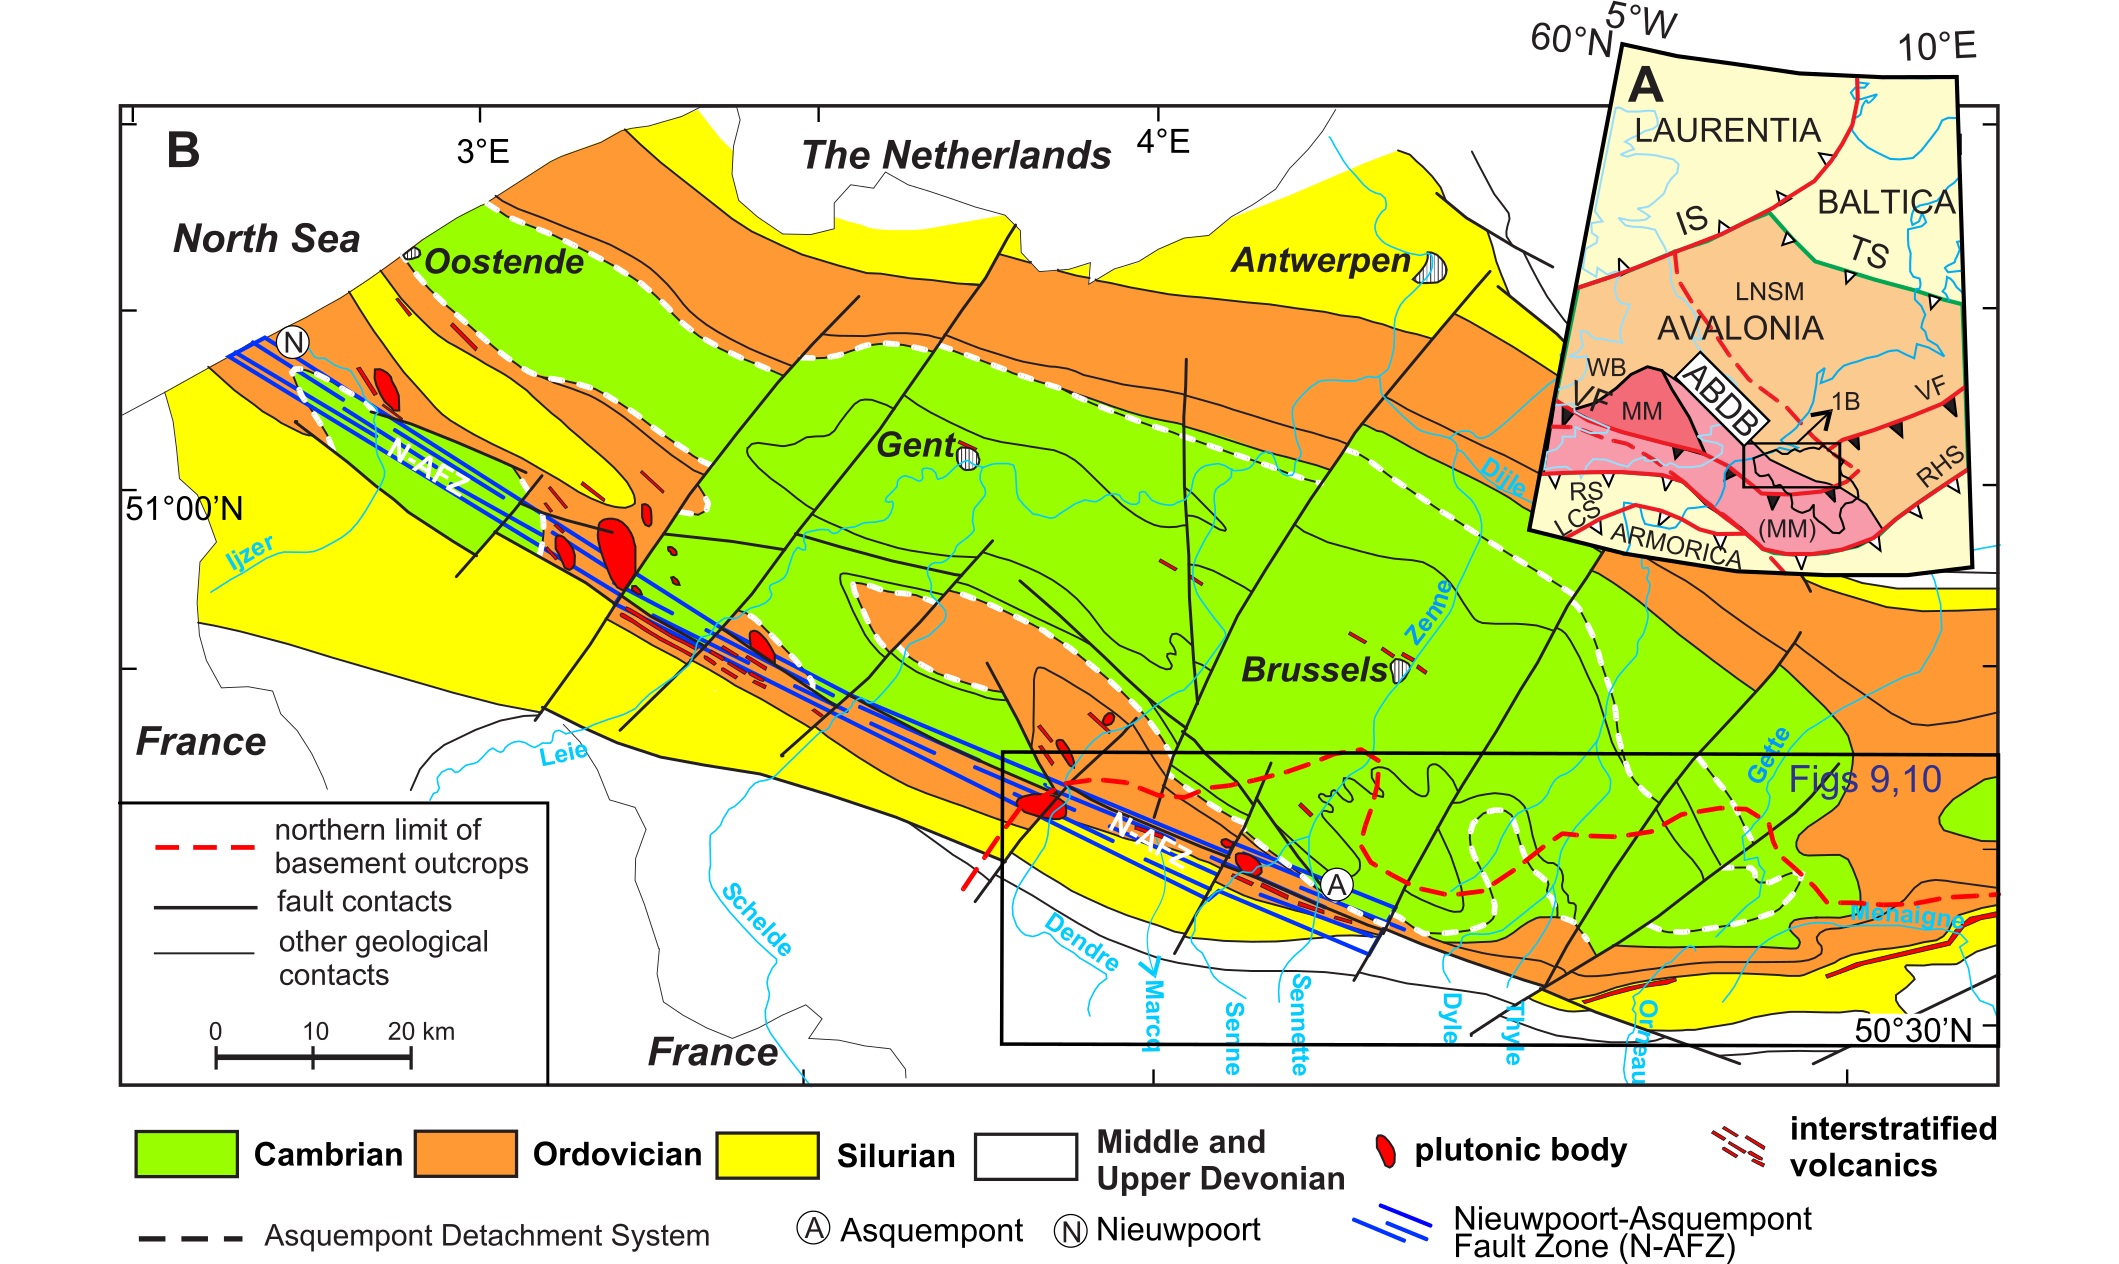
2Figure 1. (A) Position of the Brabant Massif within the Anglo-Brabant Deformation Belt (ABDB) along the NE-side of the Midland Microcraton (MM) in the context of Laurentia, Baltica, Avalonia and Armorica (modified after Winchester & PACE TMR Network team, 2002; Sintubin et al., 2009). Abbreviations: IS: Iapetus Suture; LCS: Le Conquet Suture; LNSM: Lüneberg-North Sea Terrane; (MM): extension of the Midland Microcraton to the southeast under the Variscan Front; TS: Tornquist Suture; RHS: Rhenohercynian Suture; RS: Rheic Suture; VF: Variscan Front; WB: Welsh Basin. (B) Geological subcrop map of the Brabant Massif, after De Vos et al.(1993) and Van Grootel et al.(1997), with the mapped outcrop area as presented herein indicated (see also Figs 2, 3). The trace of the Asquempont Detachment System is taken from Debacker et al. (2004a, 2005b).
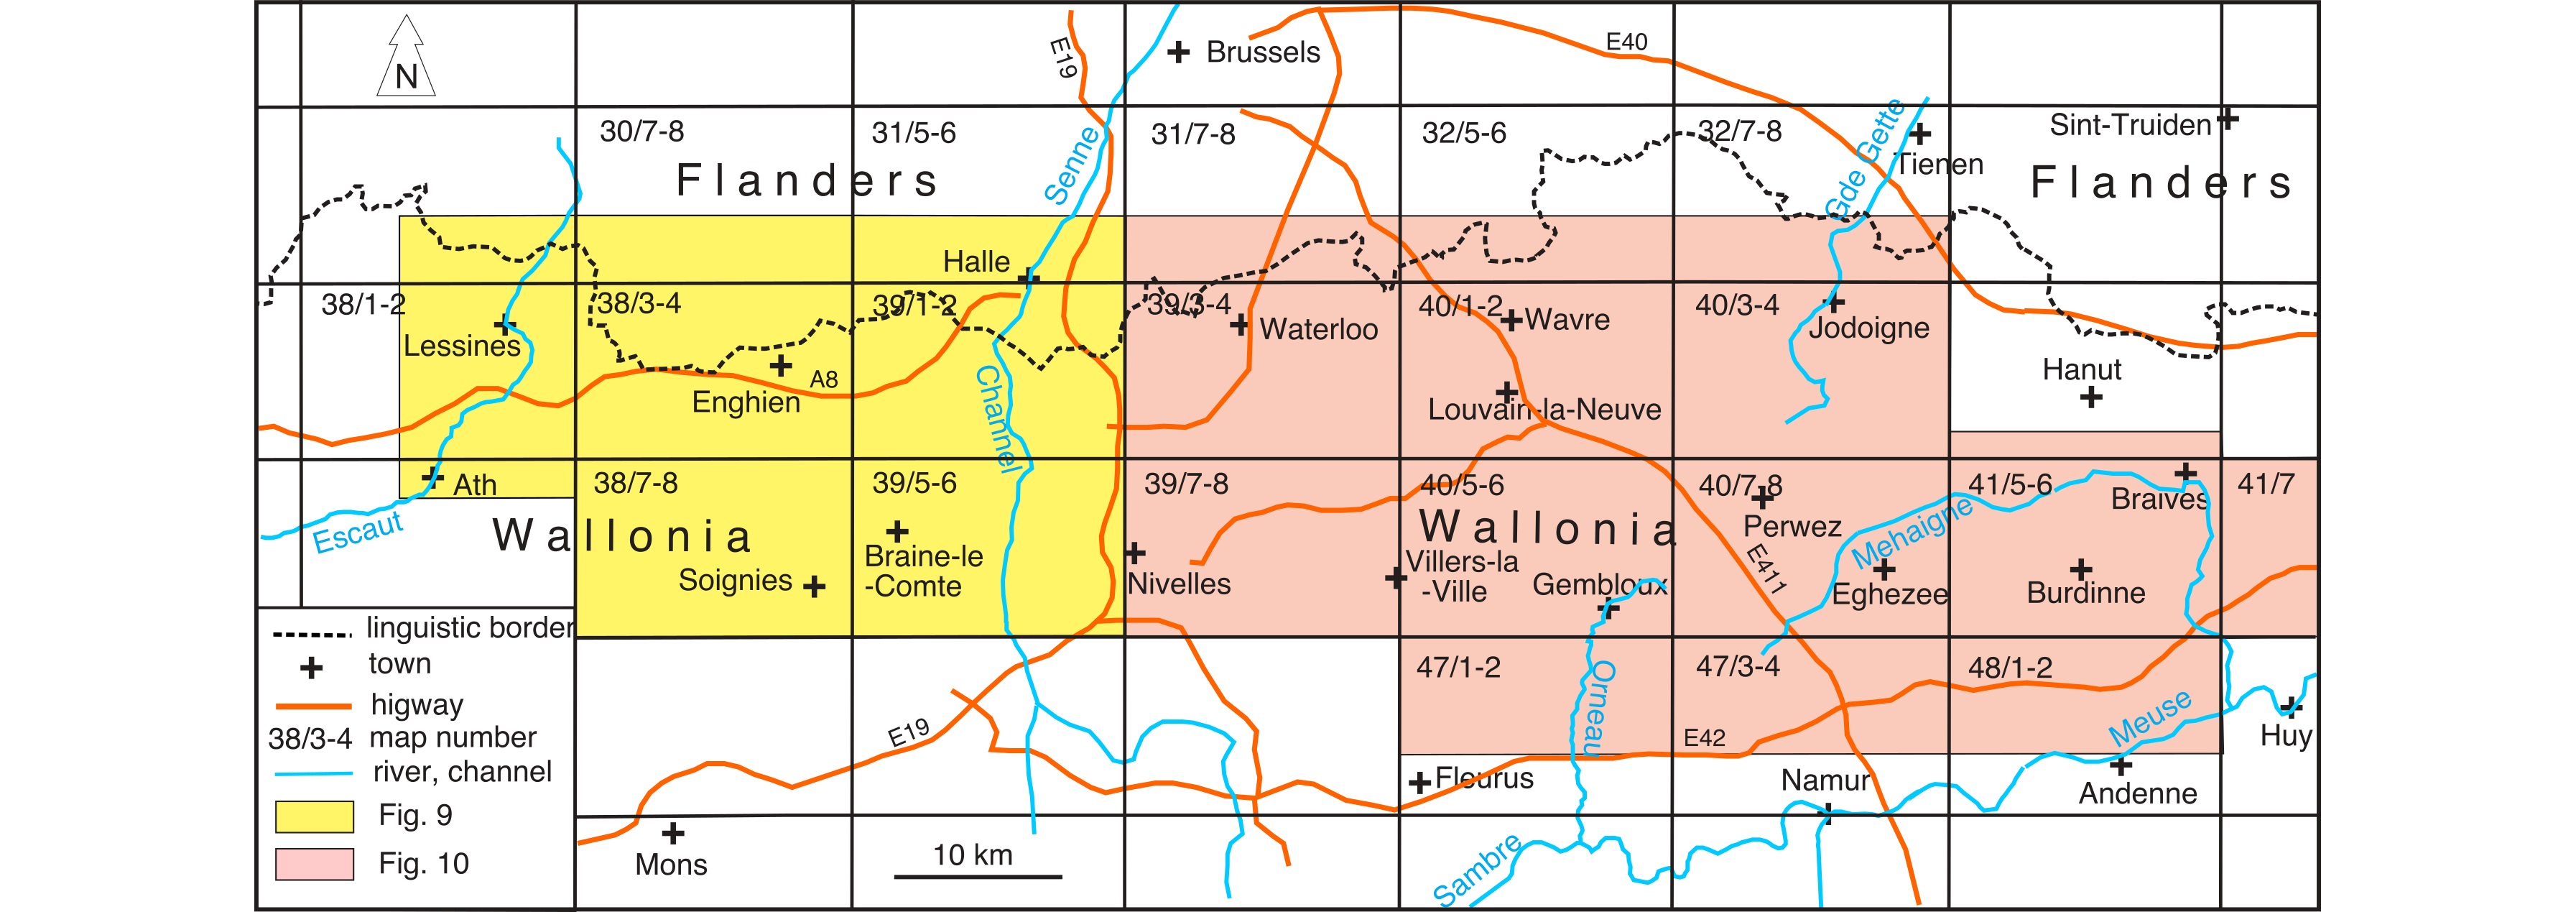
3Figure 2. Simplified administrative map covering the outcrop areas of the Brabant Massif. For clarity and resolution improvement, the map of the outcrop areas is presented in two parts, a western part (indicated in yellow; see also Fig. 9) and an eastern part (indicated in pink; see also Fig. 10).
4With the individual maps being finalised, the time has come for a larger scale synthesis of the area extending the observations laterally below the Mesozoic-Cenozoic cover. Moreover, during the long period of mapping (1993-2017) our understanding of the stratigraphy and tectonics of the Brabant Massif has evolved significantly. This gives rise to several inconsistencies between different maps, which need to be addressed. The present contribution proposes a synthetic subcrop map of the southern part of the Brabant Massif which overcomes this lack of consistency and is in agreement with the most recent tectonic models.
5In addition, the map presented here complements the new subcrop map of the Flemish parts of the Brabant Massif, which was produced in 2005 (Piessens et al., 2005), has been updated regularly since then, is available at Flanders Soil and Subsoil Database (Databank Ondergrond Vlaanderen, DOV-Vlaanderen: www.dov.be) and is now submitted for publication. Although the new subcrop map of the Flemish parts of the Brabant Massif also uses information from the outcrop areas and is based on the same structural concepts, it focusses on the unexposed Flemish parts to the north of outcrop areas.
2. Geology of the Brabant Massif
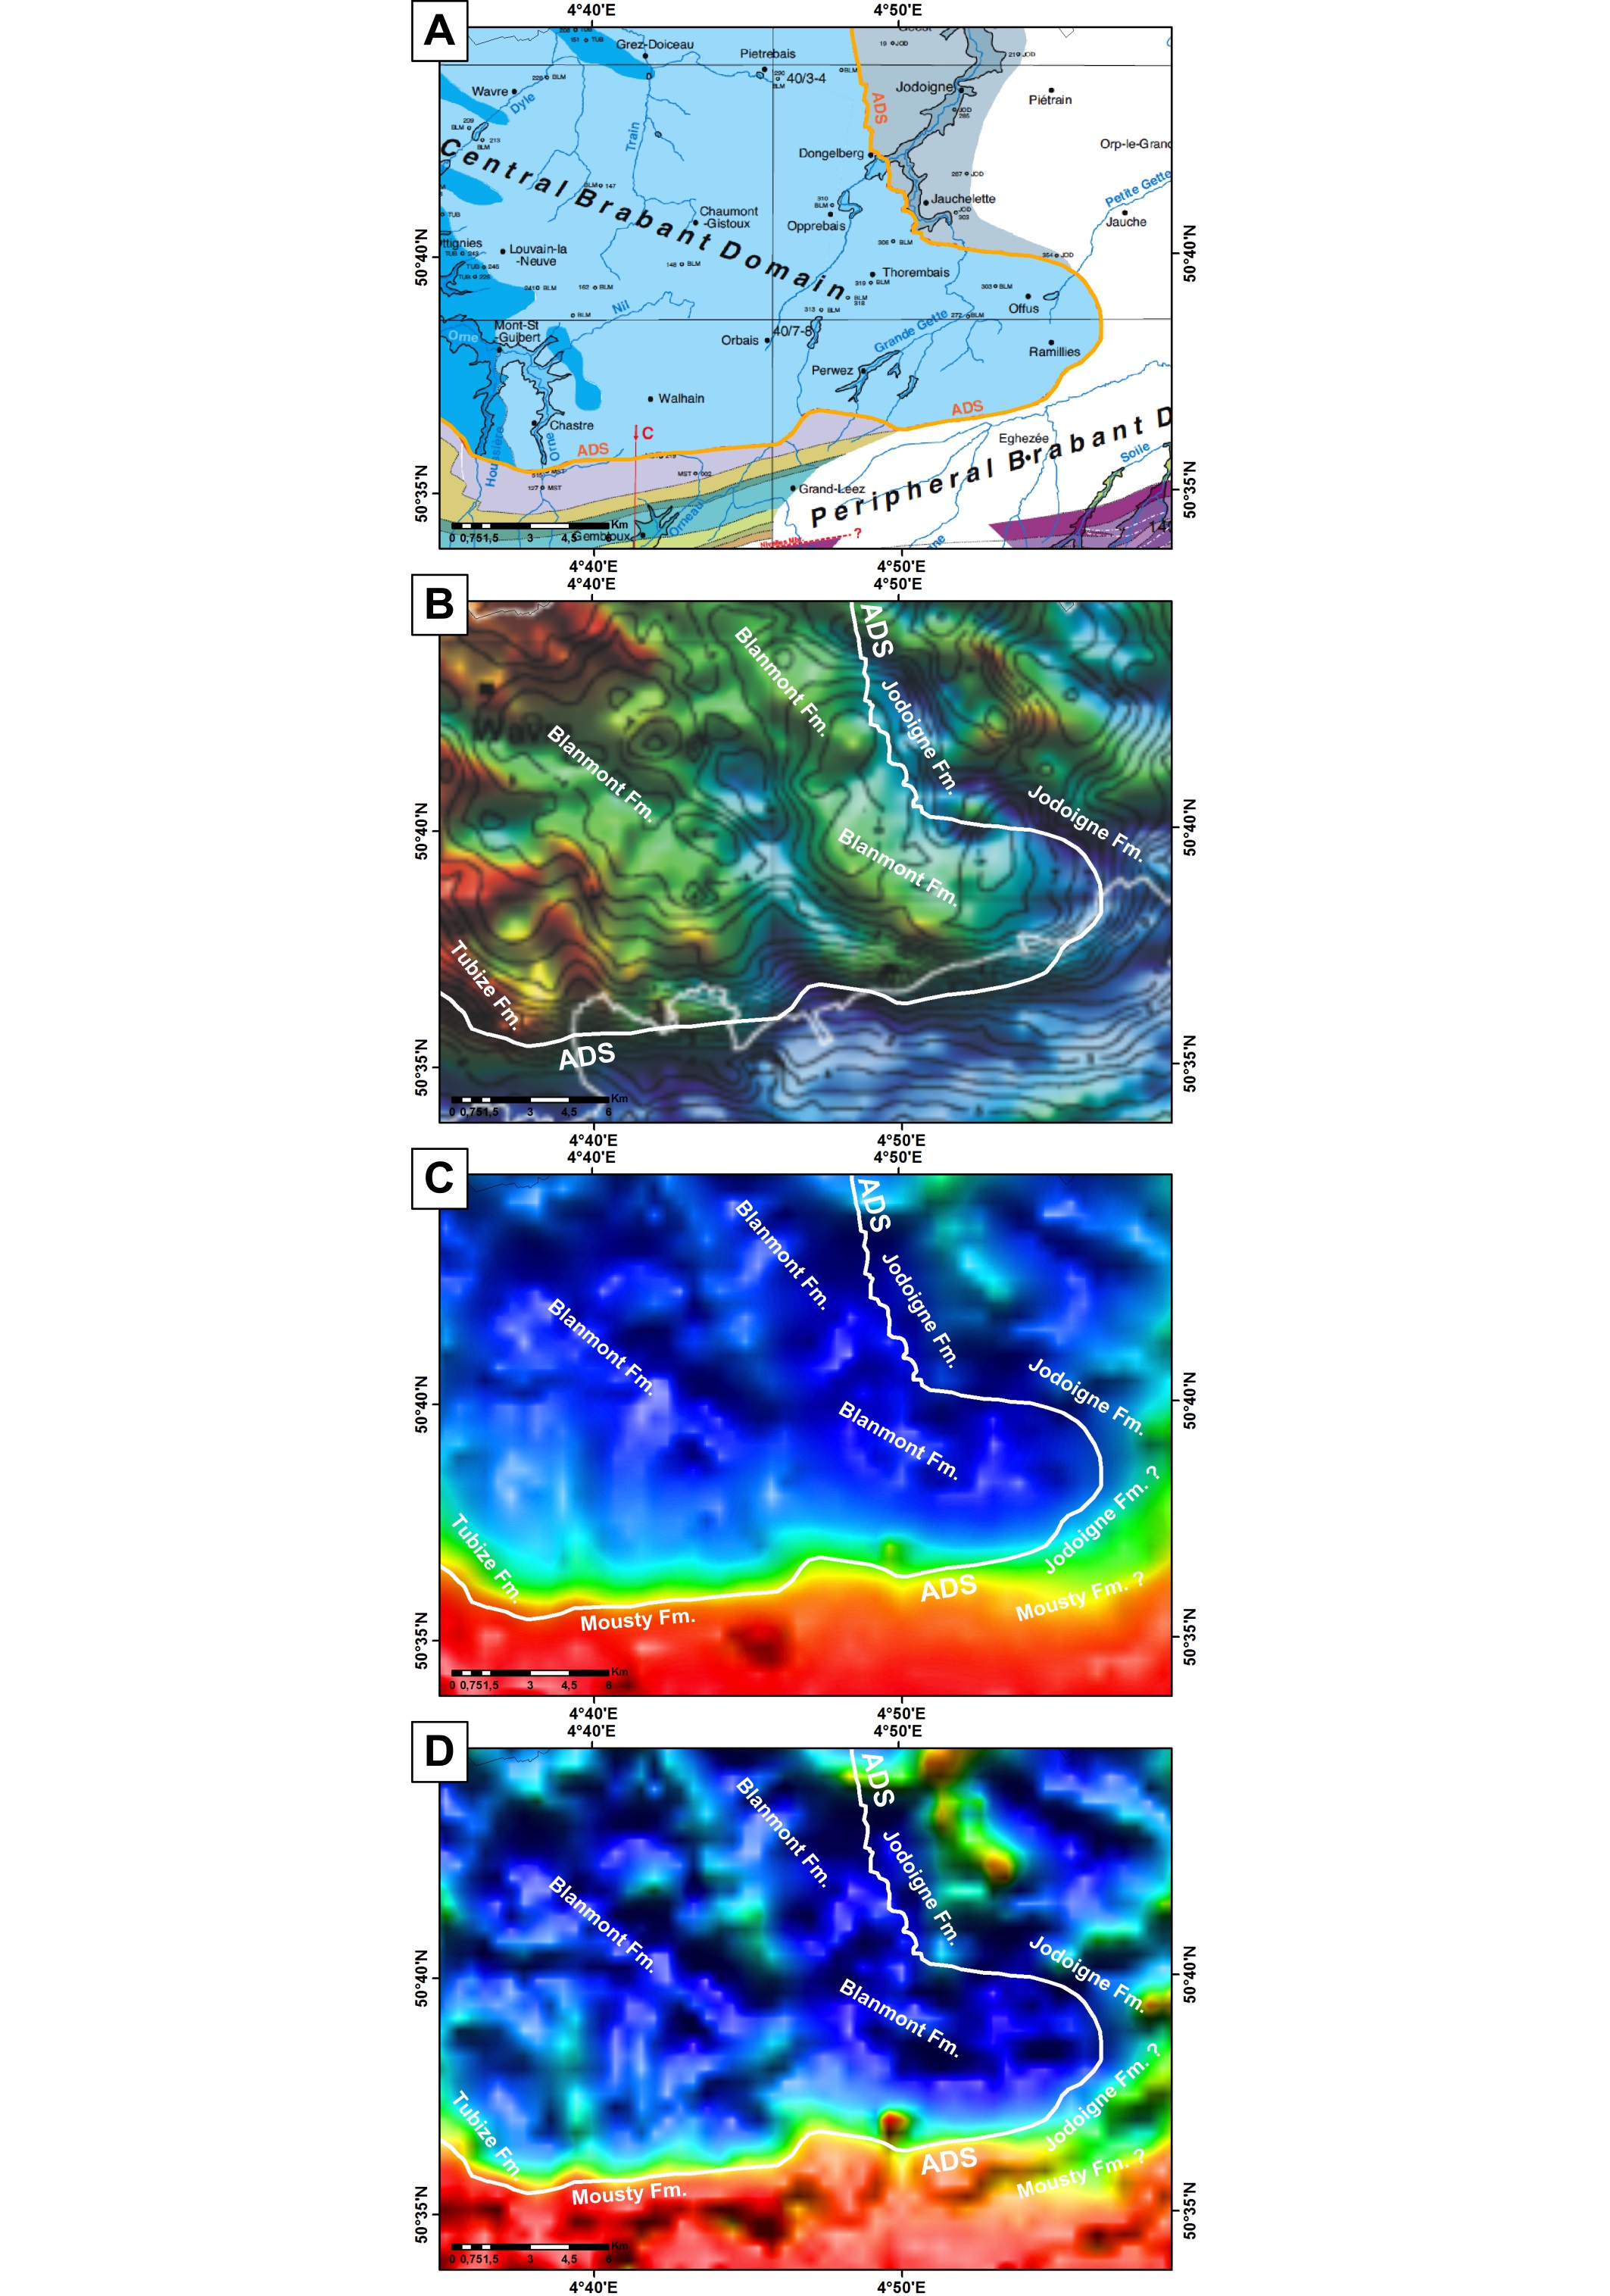
6The Brabant Massif consists of a largely concealed WNW-ESE trending, very low to low-grade metamorphic slate belt developed during Early Palaeozoic times, in the sub-surface of central and north Belgium (Fig. 1) (Fourmarier, 1921; Legrand, 1968; De Vos et al., 1993; Van Grootel et al., 1997; Sintubin, 1999; Verniers et al., 2002a; Debacker et al., 2005a; Debacker, 2012; Herbosch & Verniers, 2013, 2014). It is almost completely covered by unfolded Mesozoic-Cenozoic deposits (Fourmarier, 1921; Legrand, 1968). Along the southeastern rim of the massif (see Fig. 1B northern limit of basement outcrops), incised rivers provide narrow outcrop areas. Our understanding of the Brabant Massif is based largely on these outcrop areas, combined with boreholes and the interpretation of gravimetric and aeromagnetic data.
7In map view, the massif appears as a gently ESE-trending broad anticlinal structure, with a Cambrian core flanked on both sides by Ordovician to Silurian strata (Fig. 1B) (e.g. Fourmarier, 1921; Legrand, 1968; De Vos et al., 1993). To the NW, the massif continues beneath the North Sea and links up with the East-Anglian Basin (Fig. 1A). Both areas form part of the “Anglo-Brabant Deformation Belt” (ABDB; Pharaoh et al., 1993, 1995; Van Grootel et al., 1997), a predominantly concealed slate belt along the E-side of the Neoproterozoic Midlands Microcraton (Sintubin et al., 2009). To the S, SW and SE, the Brabant Massif is separated by a Givetian angular unconformity from overlying relatively undeformed Devonian to Carboniferous deposits of the Namur Basin. Both of these elements constitute the Brabant Parautochthon (Fig. 3; cf. Mansy et al., 1999; Sintubin et al., 2009; Belanger et al., 2012). To the south, the Brabant Parautochthon is tectonically overlain by the Ardenne Allochthon via the Midi-Aachen Fault System which marks the Variscan Thrust Front (Figs 1A, 3). The Lower Palaeozoic Condroz Inlier, a 70 km long by 1 to 3 km wide strip, elongated W-E along the Sambre and Meuse rivers (Fig. 3) straddles the central part of the Midi-Aachen Fault System. These Lower Palaeozoic rocks also belong to the Anglo-Brabant Deformation Belt but are now incorporated within Variscan thrust sheets along the leading edge of the Ardennes Allochthon (Verniers et al., 2002a; Debacker & Vanmeirhaeghe, 2007; Sintubin et al., 2009; Belanger et al., 2012; Herbosch & Verniers, 2014).
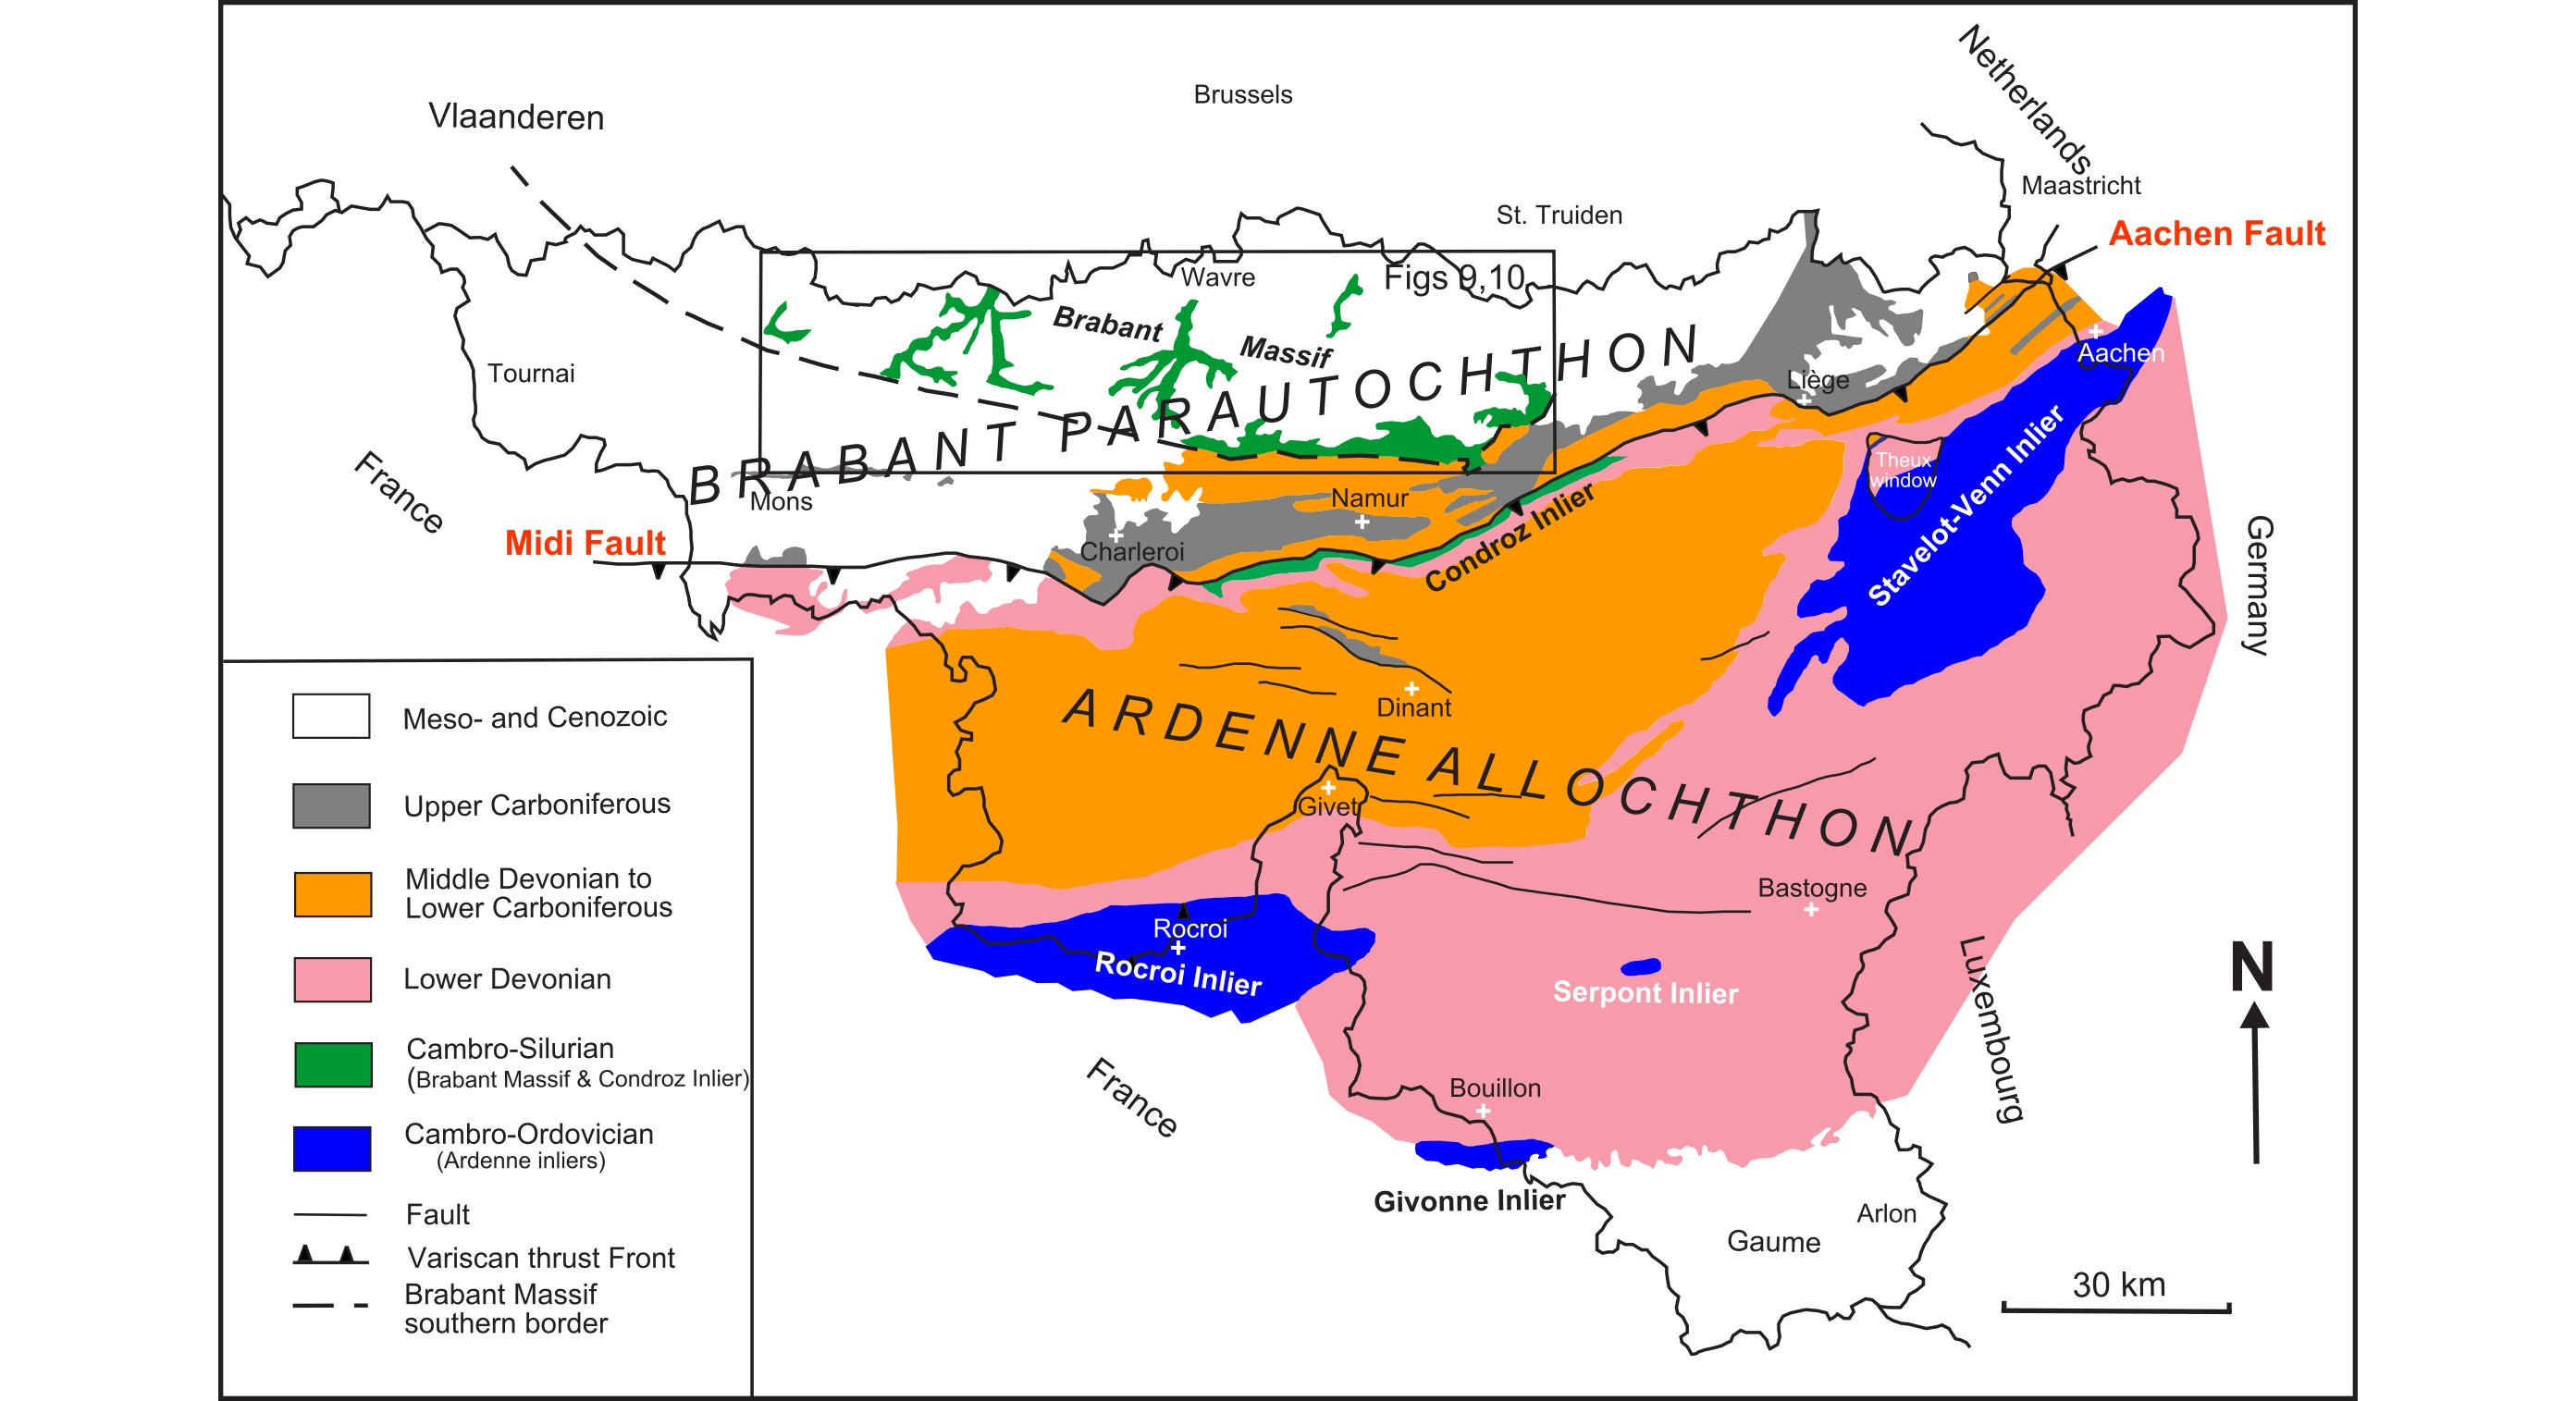
8Figure 3. Simplified geological map of the Brabant-Ardenne region, with indication of the main tectonostratigraphic units, showing the position of the outcrop map of the Brabant Massif presented here (Figs 9, 10).
9The Brabant Massif consists of a very thick siliciclastic, often turbiditic sequence, ranging from the upper part of the lower Cambrian in the core to the upper Silurian (and locally even lowermost Devonian) along the rims (Fig. 4). There is evidence for several magmatic episodes, but the main magmatic activity extends from the Upper Ordovician up to the mid-Silurian, with a peak in the late Katian to Rhuddanian (Fig. 4). Magmatic activity is mainly represented by interbedded pyroclastic rocks of dacitic and rhyolitic composition, but also by several hypabyssal dioritic bodies, such as the Quenast plug and the Bierghes and Lessines sills which are extensively quarried. The sedimentary record is largely continuous, with the exception of an important hiatus in the Lower-Middle Ordovician (Vanguestaine, 1992; Maletz & Servais, 1998; Verniers et al., 2001, 2002a; Vanmeirhaeghe, 2006; Herbosch et al., 2008a; Herbosch & Verniers, 2013, 2014; Wang & Servais, 2015). The total thickness of the sedimentary pile is estimated to exceed 13 km, with over 9 km for the Cambrian alone (Fig. 4) (Piessens et al., 2005; Linnemann et al., 2012; and references therein). The crystalline basement to the sedimentary sequence is not observed. As part of the “Anglo-Brabant Deformation Belt”, the Brabant Massif is currently considered to be situated above the boundary of two lithospheric blocks, the Midlands Microcraton to the SW and the Southern North Sea - Lüneberg Terrane to the NE (Fig. 1A; Verniers et al., 2002a; Sintubin & Everaerts, 2002; Sintubin et al., 2009).
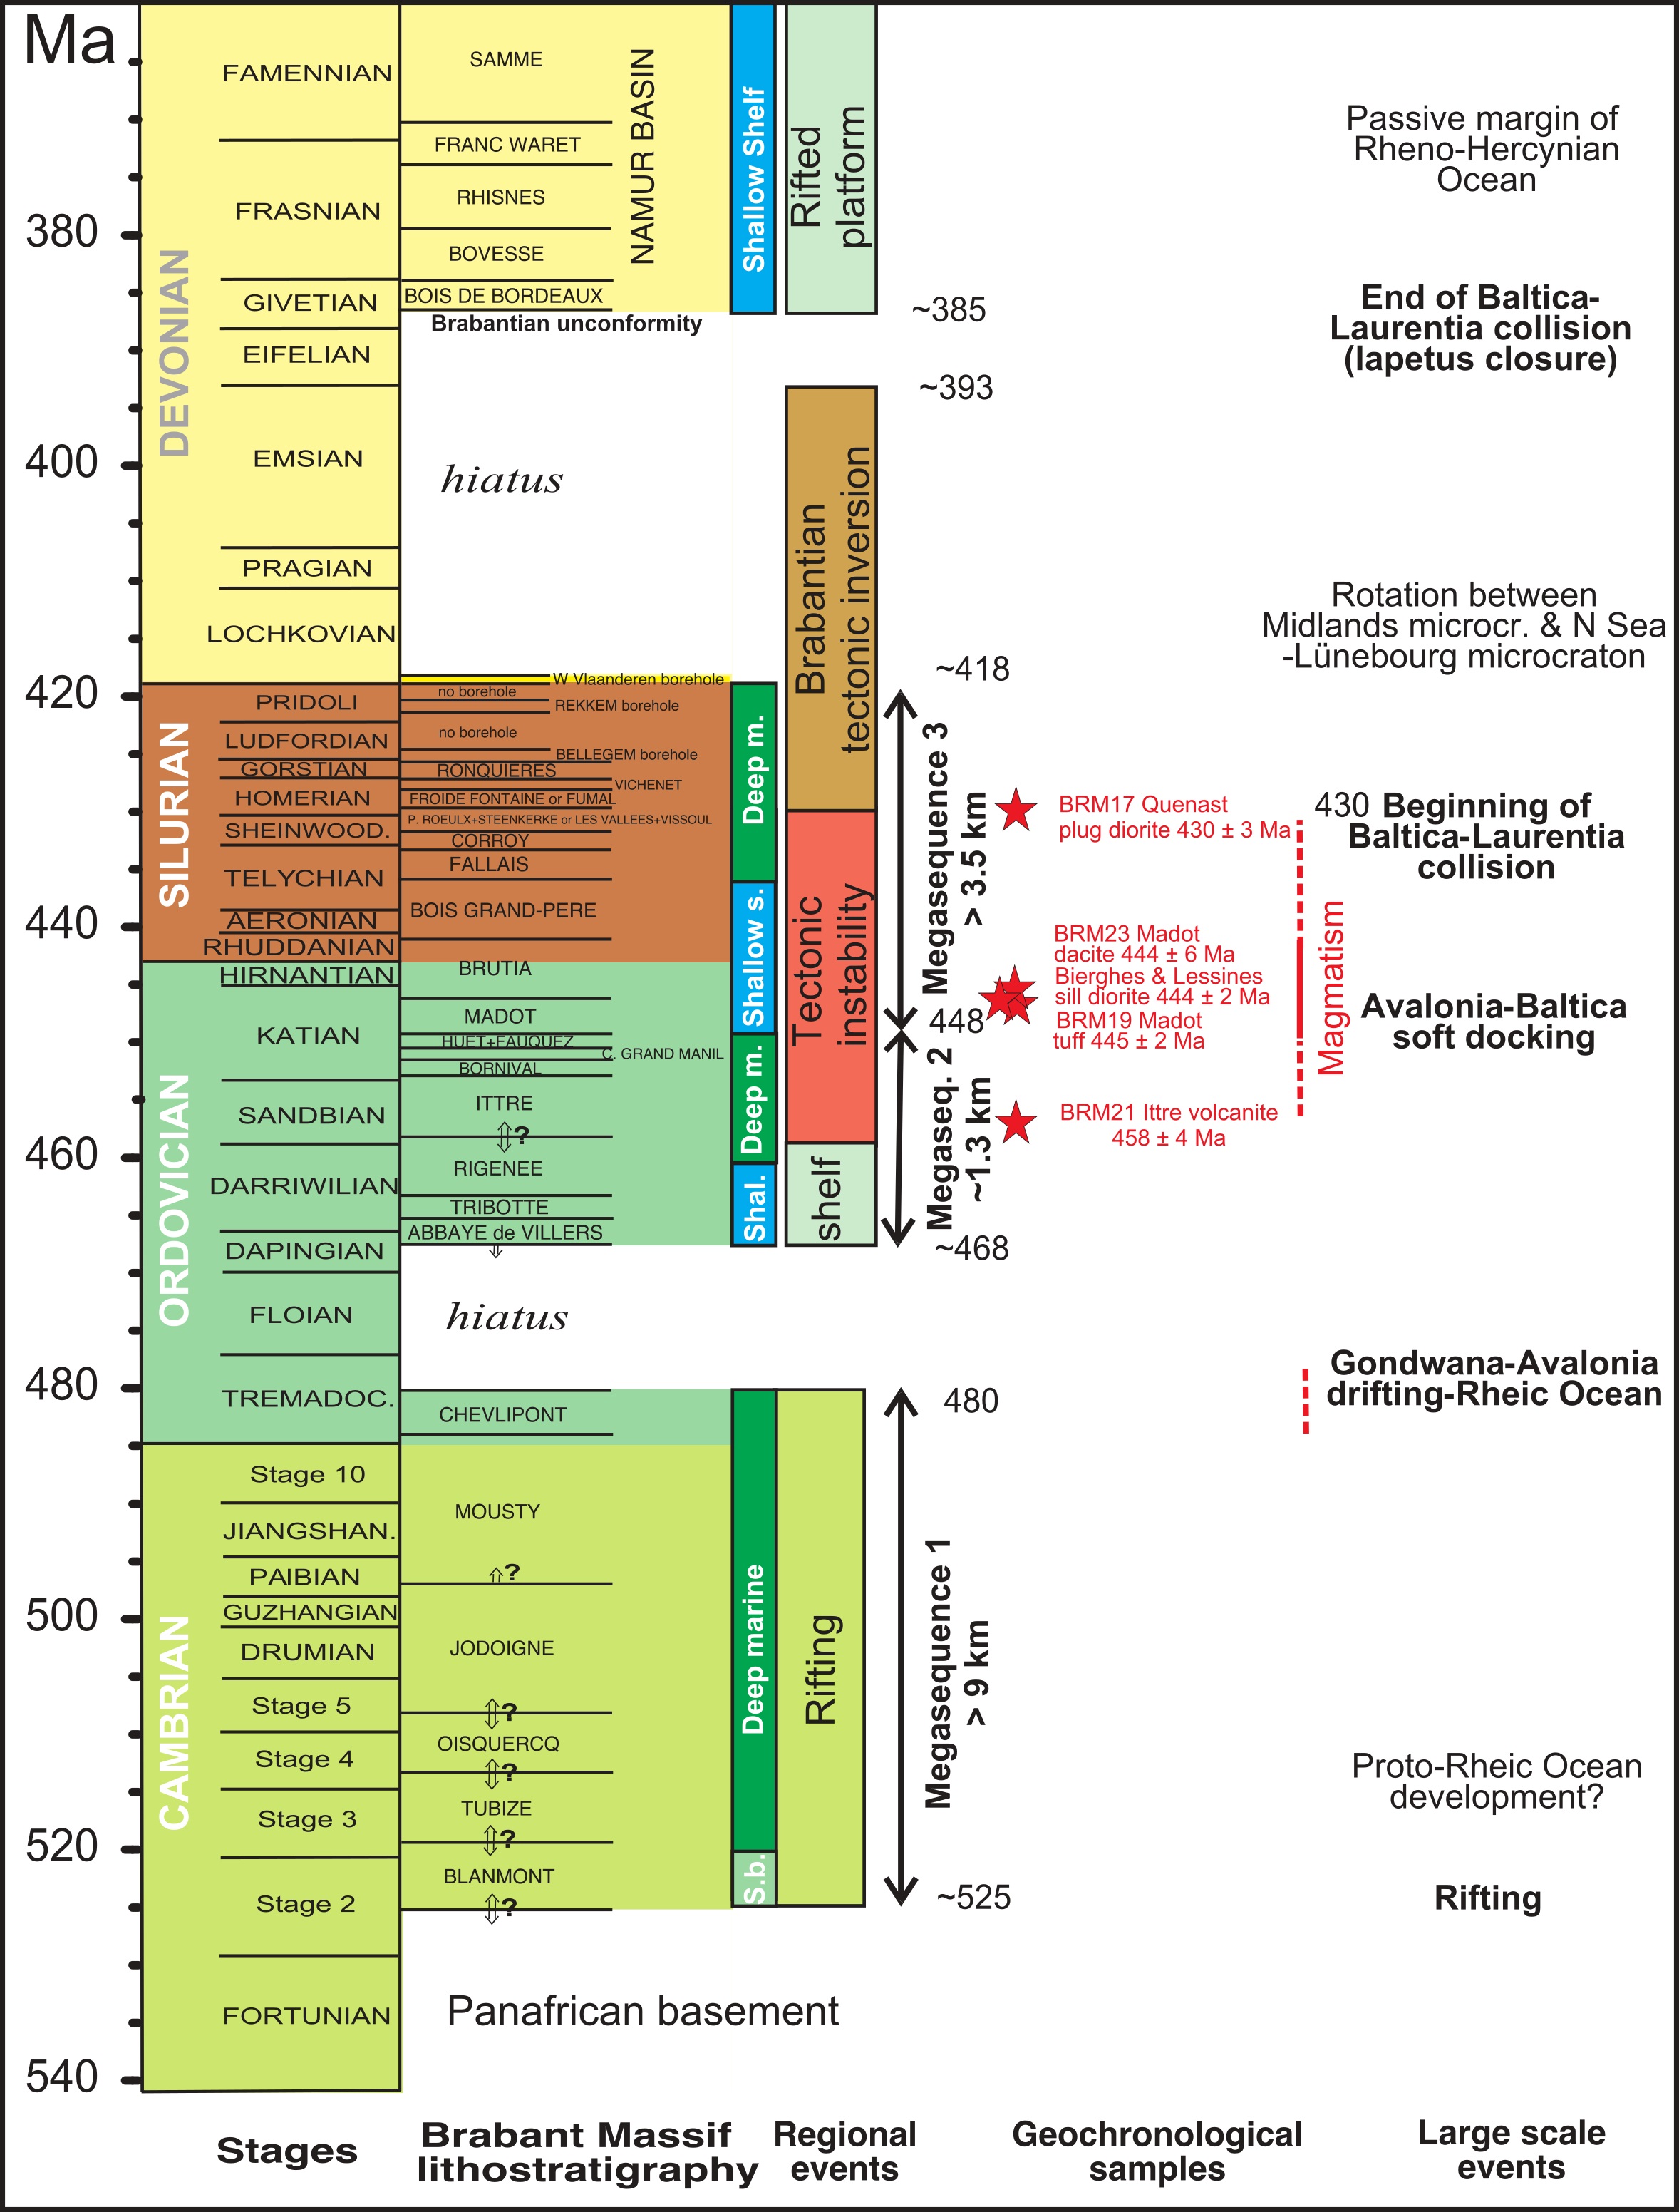
10Figure 4. Stratigraphic chart from Cambrian to Devonian for the Brabant Massif (modified after Linneman et al., 2012) with (1) system and stage names and ages from the International Stratigraphic Chart (Gradstein et al., 2012); (2) detailed lithostratigraphy of the Brabant Massif (after Verniers et al., 2001; Herbosch & Verniers, 2013, 2014); (3) depositional depth indications; (4) regional events (after Verniers et al., 2002a; Linnemann et al., 2012); (5) Megasequence number and estimated total thickness (after Verniers et al., 2002a; thicknesses adjusted according to Herbosch et al., 2008a and Herbosch & Verniers, 2013, 2014); (6) stratigraphic position of zircon-dated magmatic samples (see Linneman et al., 2012); (7) localization of large scale events (after Verniers et al., 2002a; Cocks & Torsvik, 2002; Cocks & Fortey, 2009). Abbreviation: s.: shelf; m.: marine; s.b.: shallow basin.
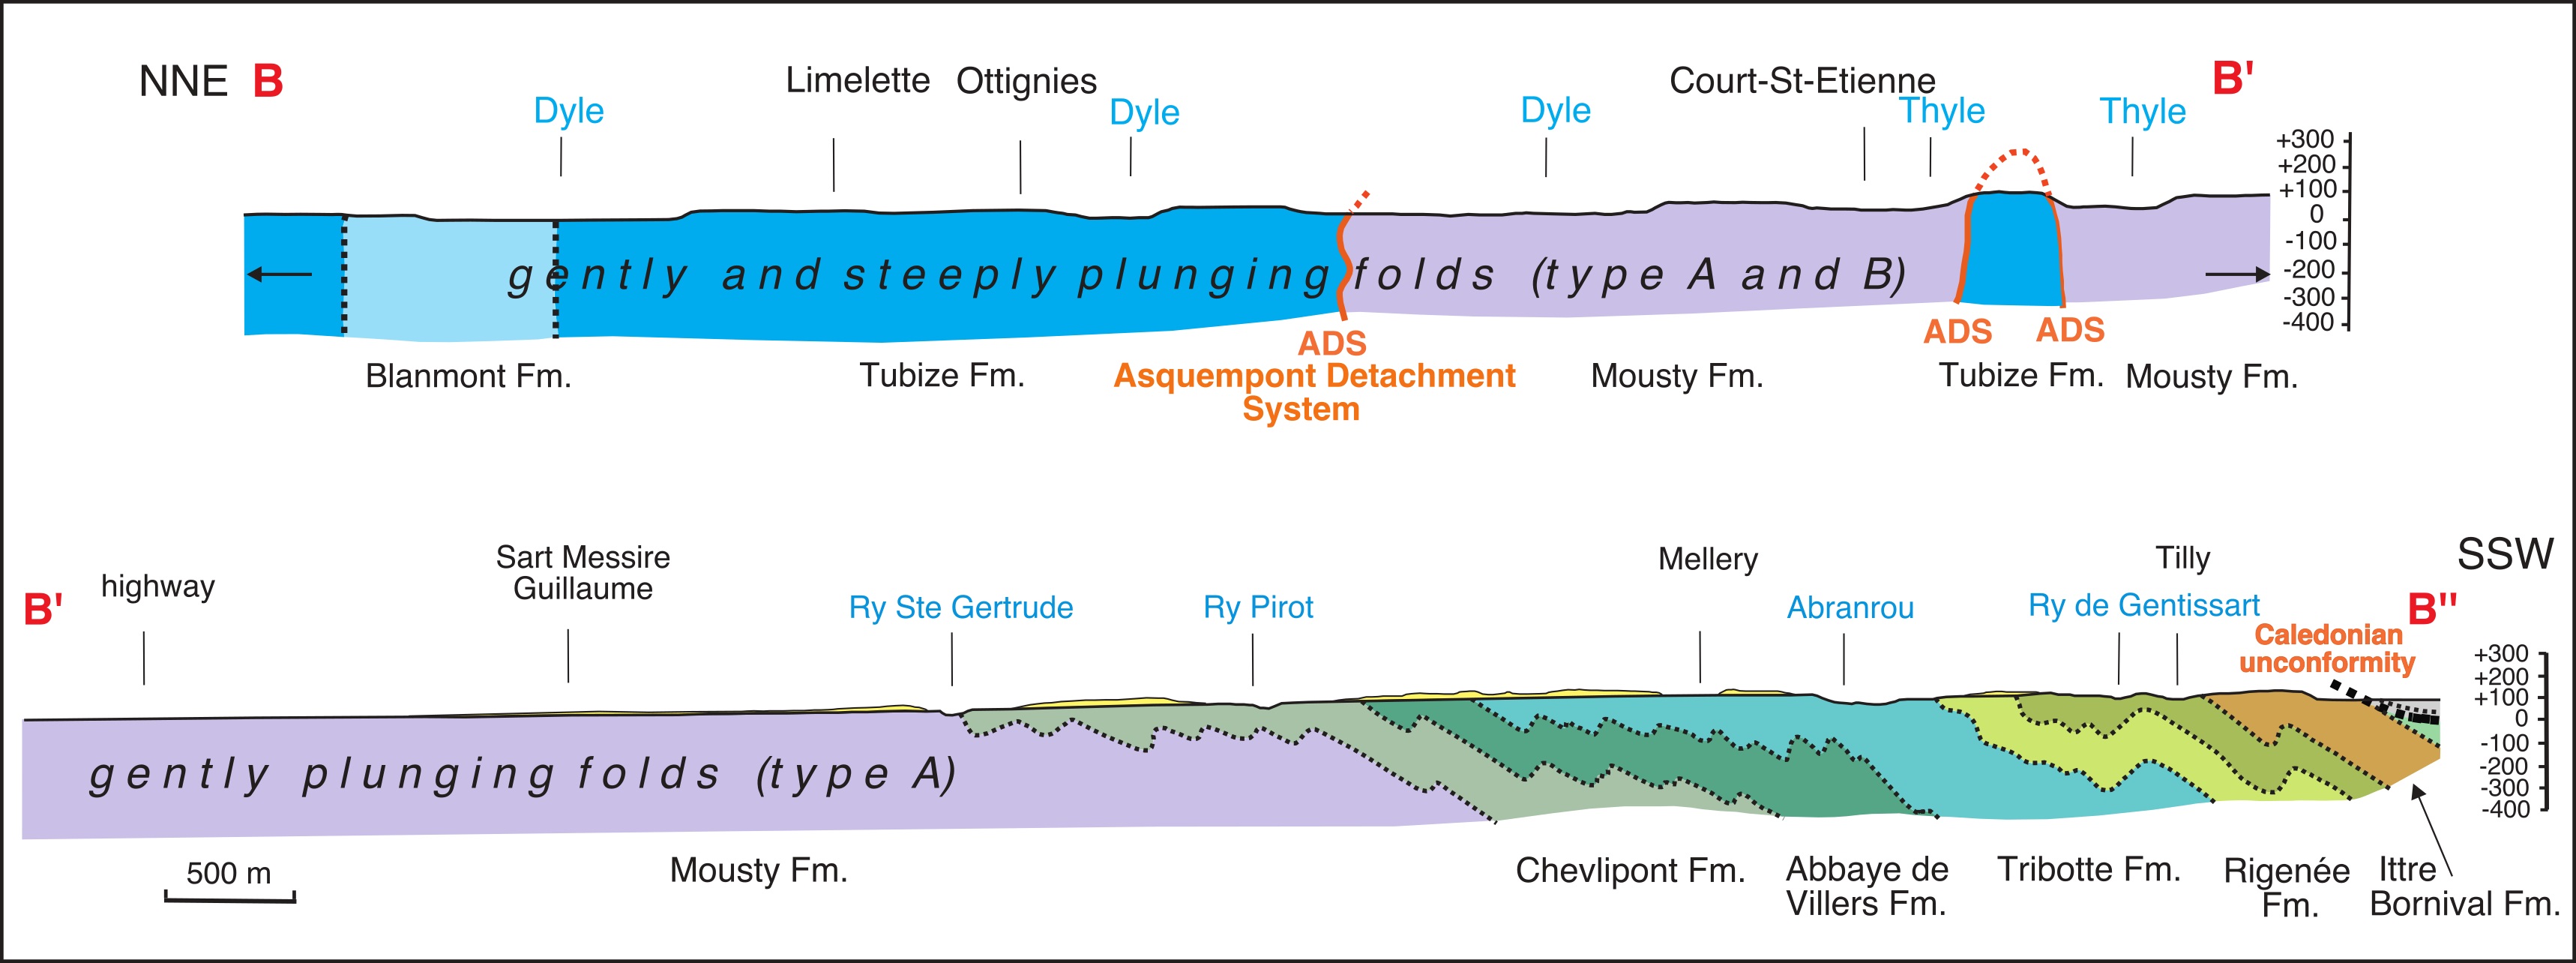
11There is evidence only for one single progressive compressional deformation event, now called the Brabantian deformation event (Debacker, 2001; Verniers et al., 2002a; Sintubin et al., 2009; Debacker, 2012). The main features associated with this deformation are folds and a well-developed cogenetic cleavage. Several types of syncleavage folds have been distinguished, ranging from steeply plunging folds associated with subvertical to steeply dipping cleavage (type B folds sensu Debacker, 2001; cf. Sintubin et al., 1998) in the Cambrian core of the BM, to more widespread subhorizontal to gently plunging folds, associated with a steep to moderately north dipping cleavage (type A folds sensu Debacker, 2001) (Sintubin, 1997, 1999; Debacker, 2001; Debacker et al., 2003, 2004b, 2005b; Debacker, 2012).
12The nature, timing and geodynamic significance of the Brabantian deformation event have only been established relatively recently (Debacker, 2001; Verniers et al., 2002a; Sintubin & Everaerts, 2002; Debacker et al., 2005a; Sintubin et al., 2009). Contrary to the traditional view of an anticlinal culmination (e.g. De Vos et al., 1993), the architecture of the BM is currently interpreted as a NW-SE trending compressional wedge consisting of a central steep belt composed of predominantly Cambrian metasediments, more or less symmetrically flanked by less deformed Ordovician and Silurian metasediments (Sintubin & Everaerts, 2002; Verniers et al., 2002a; Debacker et al., 2005a).
13On the basis of the youngest deformed basement rocks in outcrop (Gorstian; Ronquières Formation) and the oldest cover rocks above the Brabantian unconformity (Givetian; Bois de Bordeaux Formation) deformation along the southern rim of the Brabant Massif took place between the end of the Gorstian and the Givetian (Fig. 4; e.g. Fourmarier, 1921; De Vos et al., 1993). This age was narrowed further by the discovery of Pridoli to lowermost Lochkovian (circa 418 Ma) deposits below the unconformity in boreholes (Verniers & Van Grootel, 1991; Van Grootel et al., 1997). However, the initiation of deep marine turbiditic sedimentation at about mid-Llandovery and the sudden increase in subsidence in the late Llandovery around 430 Ma mark the onset of foreland basin development (Van Grootel et al., 1997). This suggests the presence of a tectonic load from around 430 Ma, and this tectonic load is considered to be the gradually deforming Cambrian core of the Brabant Massif (Debacker, 2001; Verniers et al., 2002a; Debacker et al., 2005a). This is supported by single grain 40Ar/39Ar ages on newly formed cleavage/parallel sericite/muscovite in Ordovician rocks within a low-angle reverse shear zone, which indicate syntectonic metamorphic fluid circulation from ~426 Ma onwards (Dewaele et al., 2002), before deposition of the (now deformed) upper Wenlock Vichenet Formation and Gorstian Ronquières Formation (Debacker et al., 2005a). Silurian to lower Lochkovian reworked acritarchs (Steemans, 1989) found in the Lower Devonian in the Dinant Basin (Fig. 3; Ardenne Allochthon) also suggest that the central part of the BM was emerged since the Lochkovian. Together, these data demonstrate a diachronic nature of the Brabantian deformation event and therefore Debacker et al. (2005a) placed the onset of the Brabantian deformation event around ~430 Ma and the end at the Emsian-Eifelian boundary (circa 393 Ma), very near the end of the Lower-Middle Devonian hiatus (Fig. 4). According to Debacker et al. (2005a) the progressive Brabantian deformation event resulted in a continued uplift of the core and a gradual spreading of the deformation toward the rims of the massif from the middle Silurian to early Devonian (Debacker, 2001; Verniers et al., 2002a; Debacker et al., 2005a; Sintubin et al., 2009).
14Sintubin & Everaerts (2002) propose that the Brabantian Orogeny was the result of the convergence of the Midlands Microcraton and the North Sea - Lüneberg Terrane. This convergence would be the result of an anti-clockwise rotation of the former (Piper, 1997) within the Avalonia terrane assemblage (Debacker, 2001; Verniers et al., 2002a; Sintubin et al., 2009). As suggested by Sintubin et al. (2009), this rotation could be driven from the south, and is in accordance with a Rheic cause for the Middle Devonian, ‘‘Acadian’’ deformation in Wales and England proposed by Woodcock et al. (2007). Different models exist for this “push from the south”: the impingement of Armorica, the accretion of an island arc, or flat-slab subduction of the Rheic oceanic lithosphere below the Laurussian-Avalonian margin (Sintubin et al., 2009 and references therein). However, Linnemann et al. (2012) still opt for a “push from the north” and interpret the resulting Brabantian Orogeny as a far-distant effect of the collision of Baltica-Avalonia with Laurentia which began at circa 430 Ma (Fig. 4).
3. Methodology
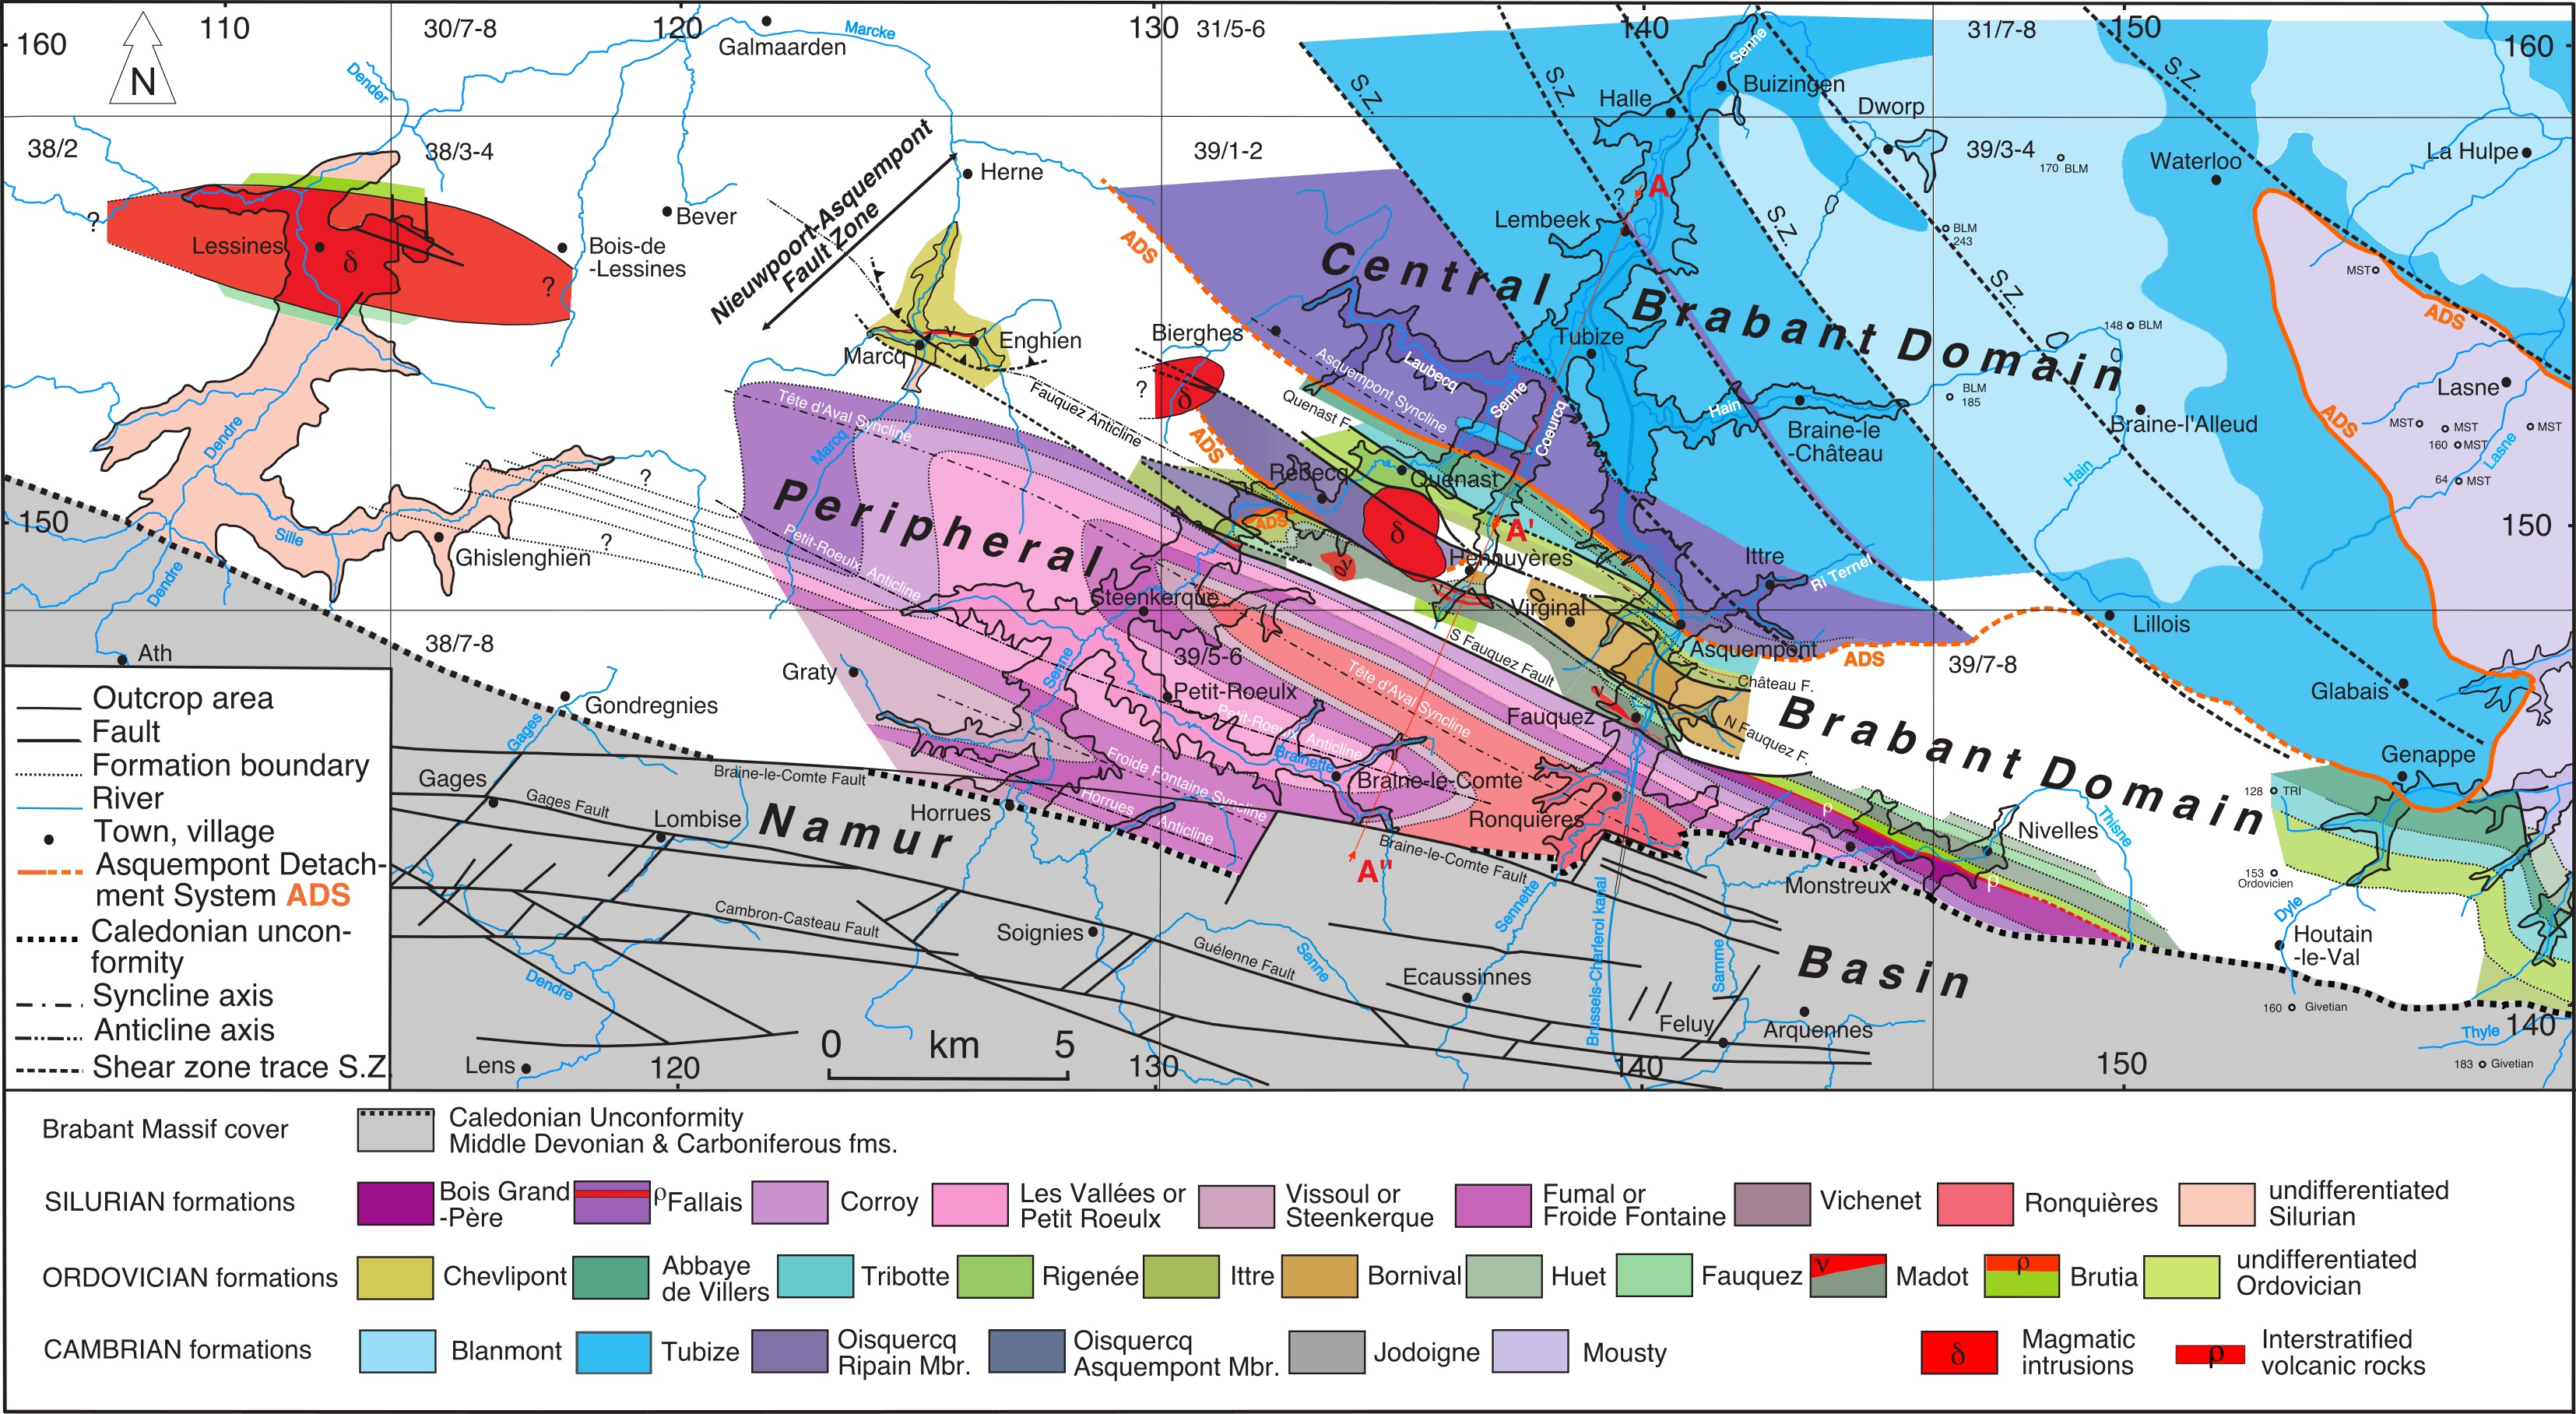
15The geological maps published on the website of the Walloon Region (http://geologie.wallonie.be/home/acquisition-de-donnees/telechargements.html), and three maps in publication (maps 38/1-2, 38/3-4, 48/1-2; see Annex 1) were joined and then completely redrawn on a scale of ~1/200 000. The heterogeneities and old concepts have been corrected according to the most recent publications and the authors' insights. The main papers and studies used for updating the maps are Debacker, 2001; Herbosch et al., 2008a; Verniers et al., 2005; Debacker & Sintubin, 2008; Debacker et al., 2003, 2004a, 2005b, 2011. Geological formations were extrapolated under the Mesozoic-Cenozoic cover where possible, with the aid of borehole data, gravimetric and aeromagnetic data (Figs 5 to 8). Interpretation of the latter has been very helpful for the Cambrian core of the massif where magnetic and lithologic contrasts between the black shale in the Mousty Formation, the magnetite-bearing siltstones in the Tubize Formation and the quartzite in the Blanmont Formation are particularly important. Aeromagnetic data used are from Chacksfield et al. (1993) and Everaerts (2000). The Bouguer gravity data and the filtered gravity data are taken from Chacksfield et al. (2004). The latter is a commissioned study by the British Geological Survey managed by GF Consult bvba on behalf of Afdeling Natuurlijke Rijkdommen en Energie (now Vlaams Planbureau voor Omgeving), Vlaamse Overheid, and was part of project VLA04-3.1.
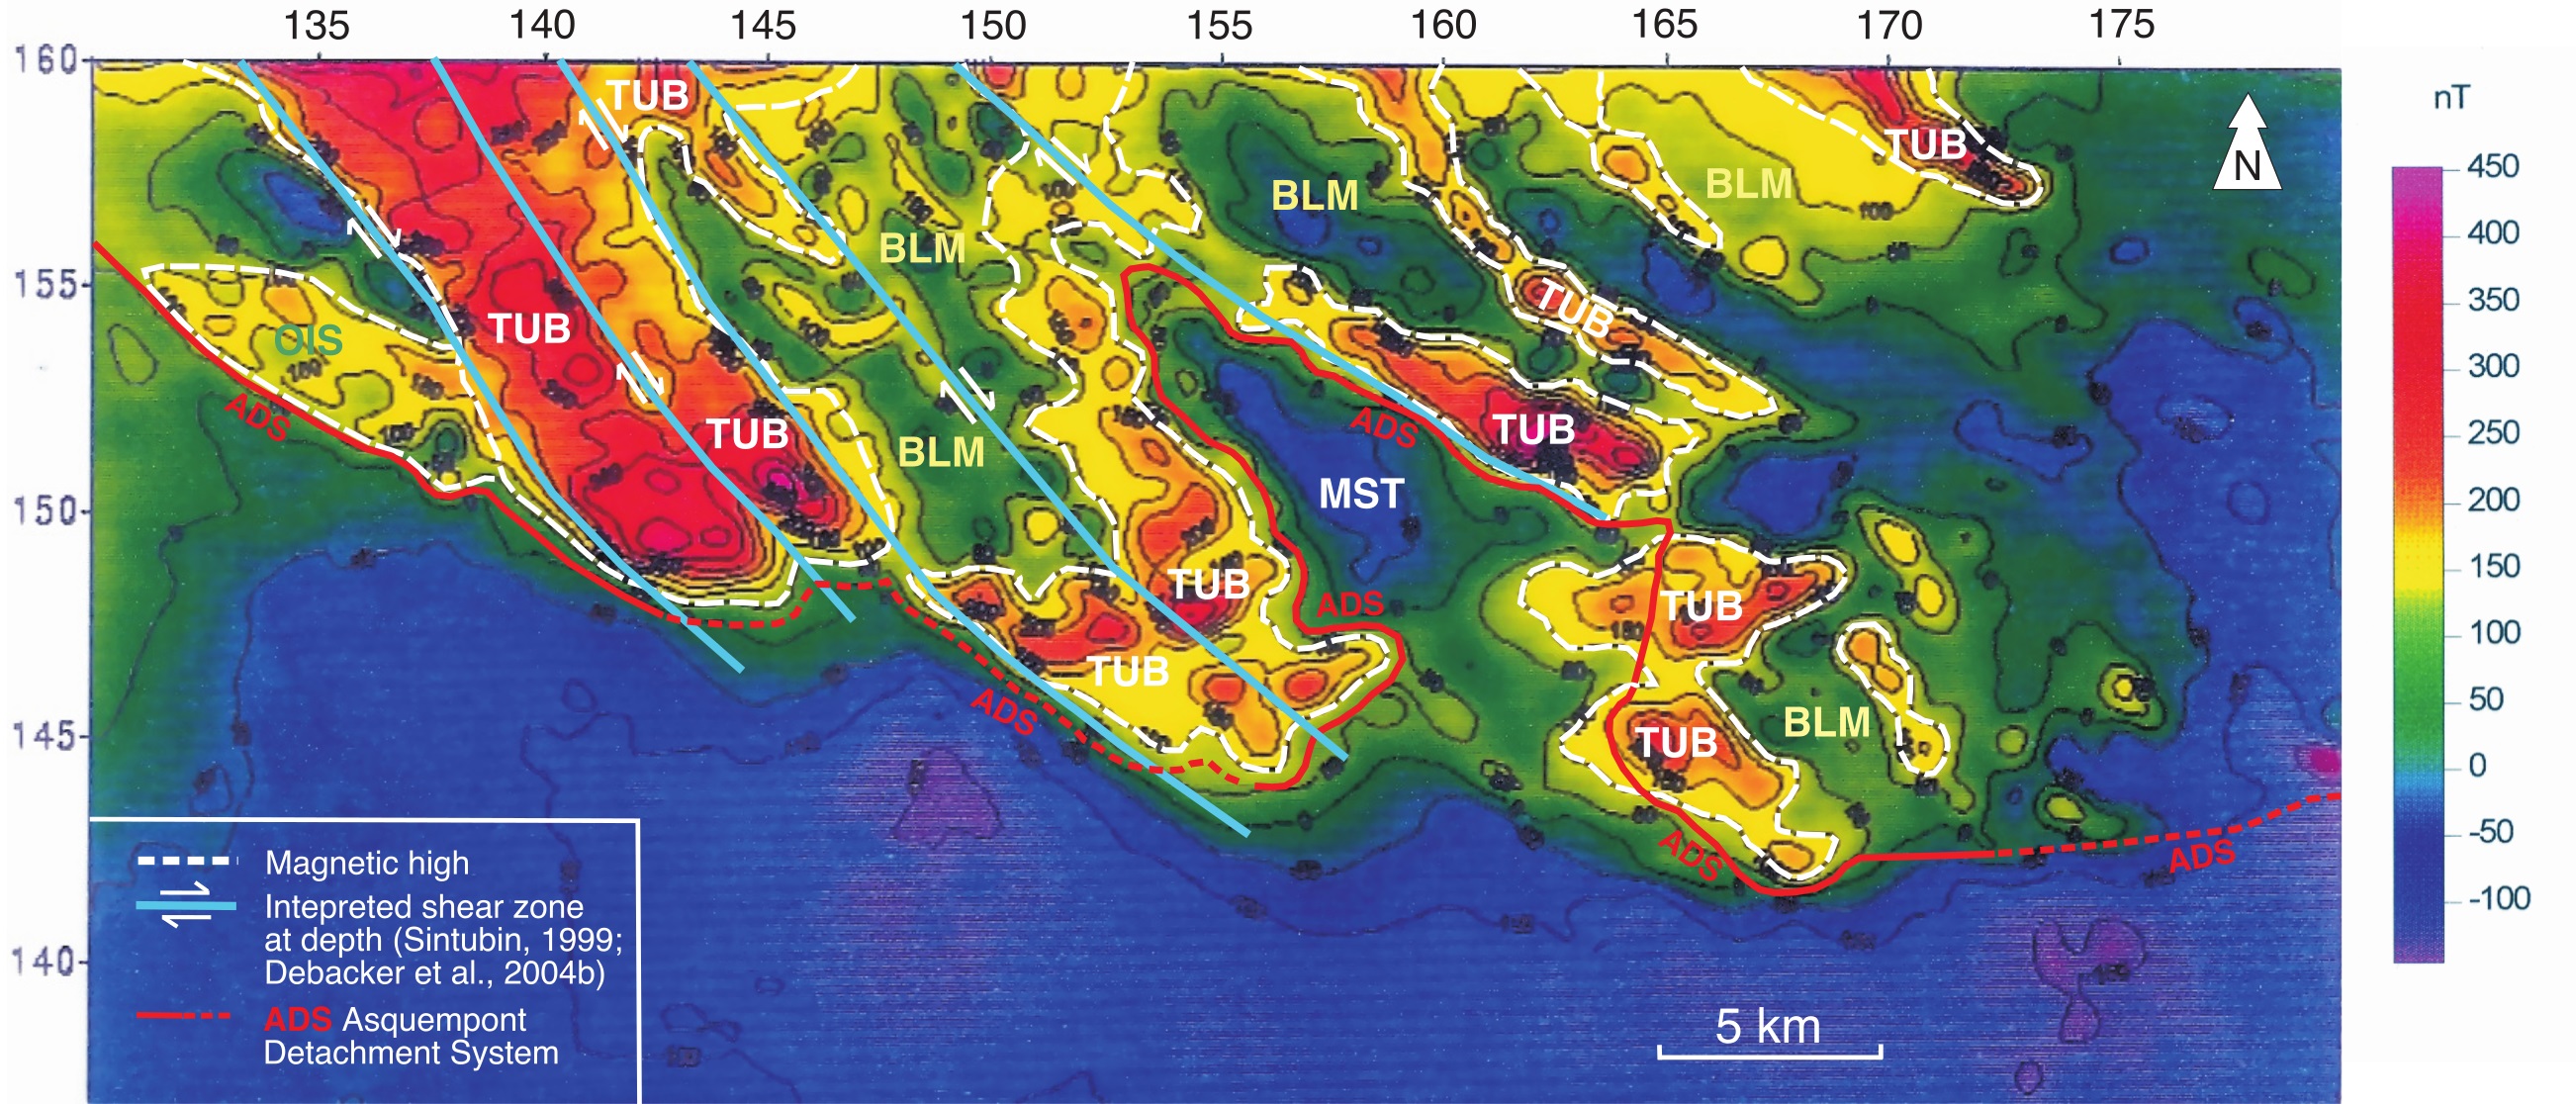
16Figure 5. Aeromagnetic map (aeromagnetic field reduced-to-the-pole) of the southern part of the aeromagnetic high of the core of the Brabant Massif (after Everaerts, 2000 his fig.1.12), with structural interpretations based on mapping and publications of Sintubin (1999) and Debacker et al. (2004b). Abbreviations: BLM: Blanmont Fm., TUB: Tubize Fm., OIS: Oisquercq Fm., MST: Mousty Fm., ADS: Asquempont Detachment System.
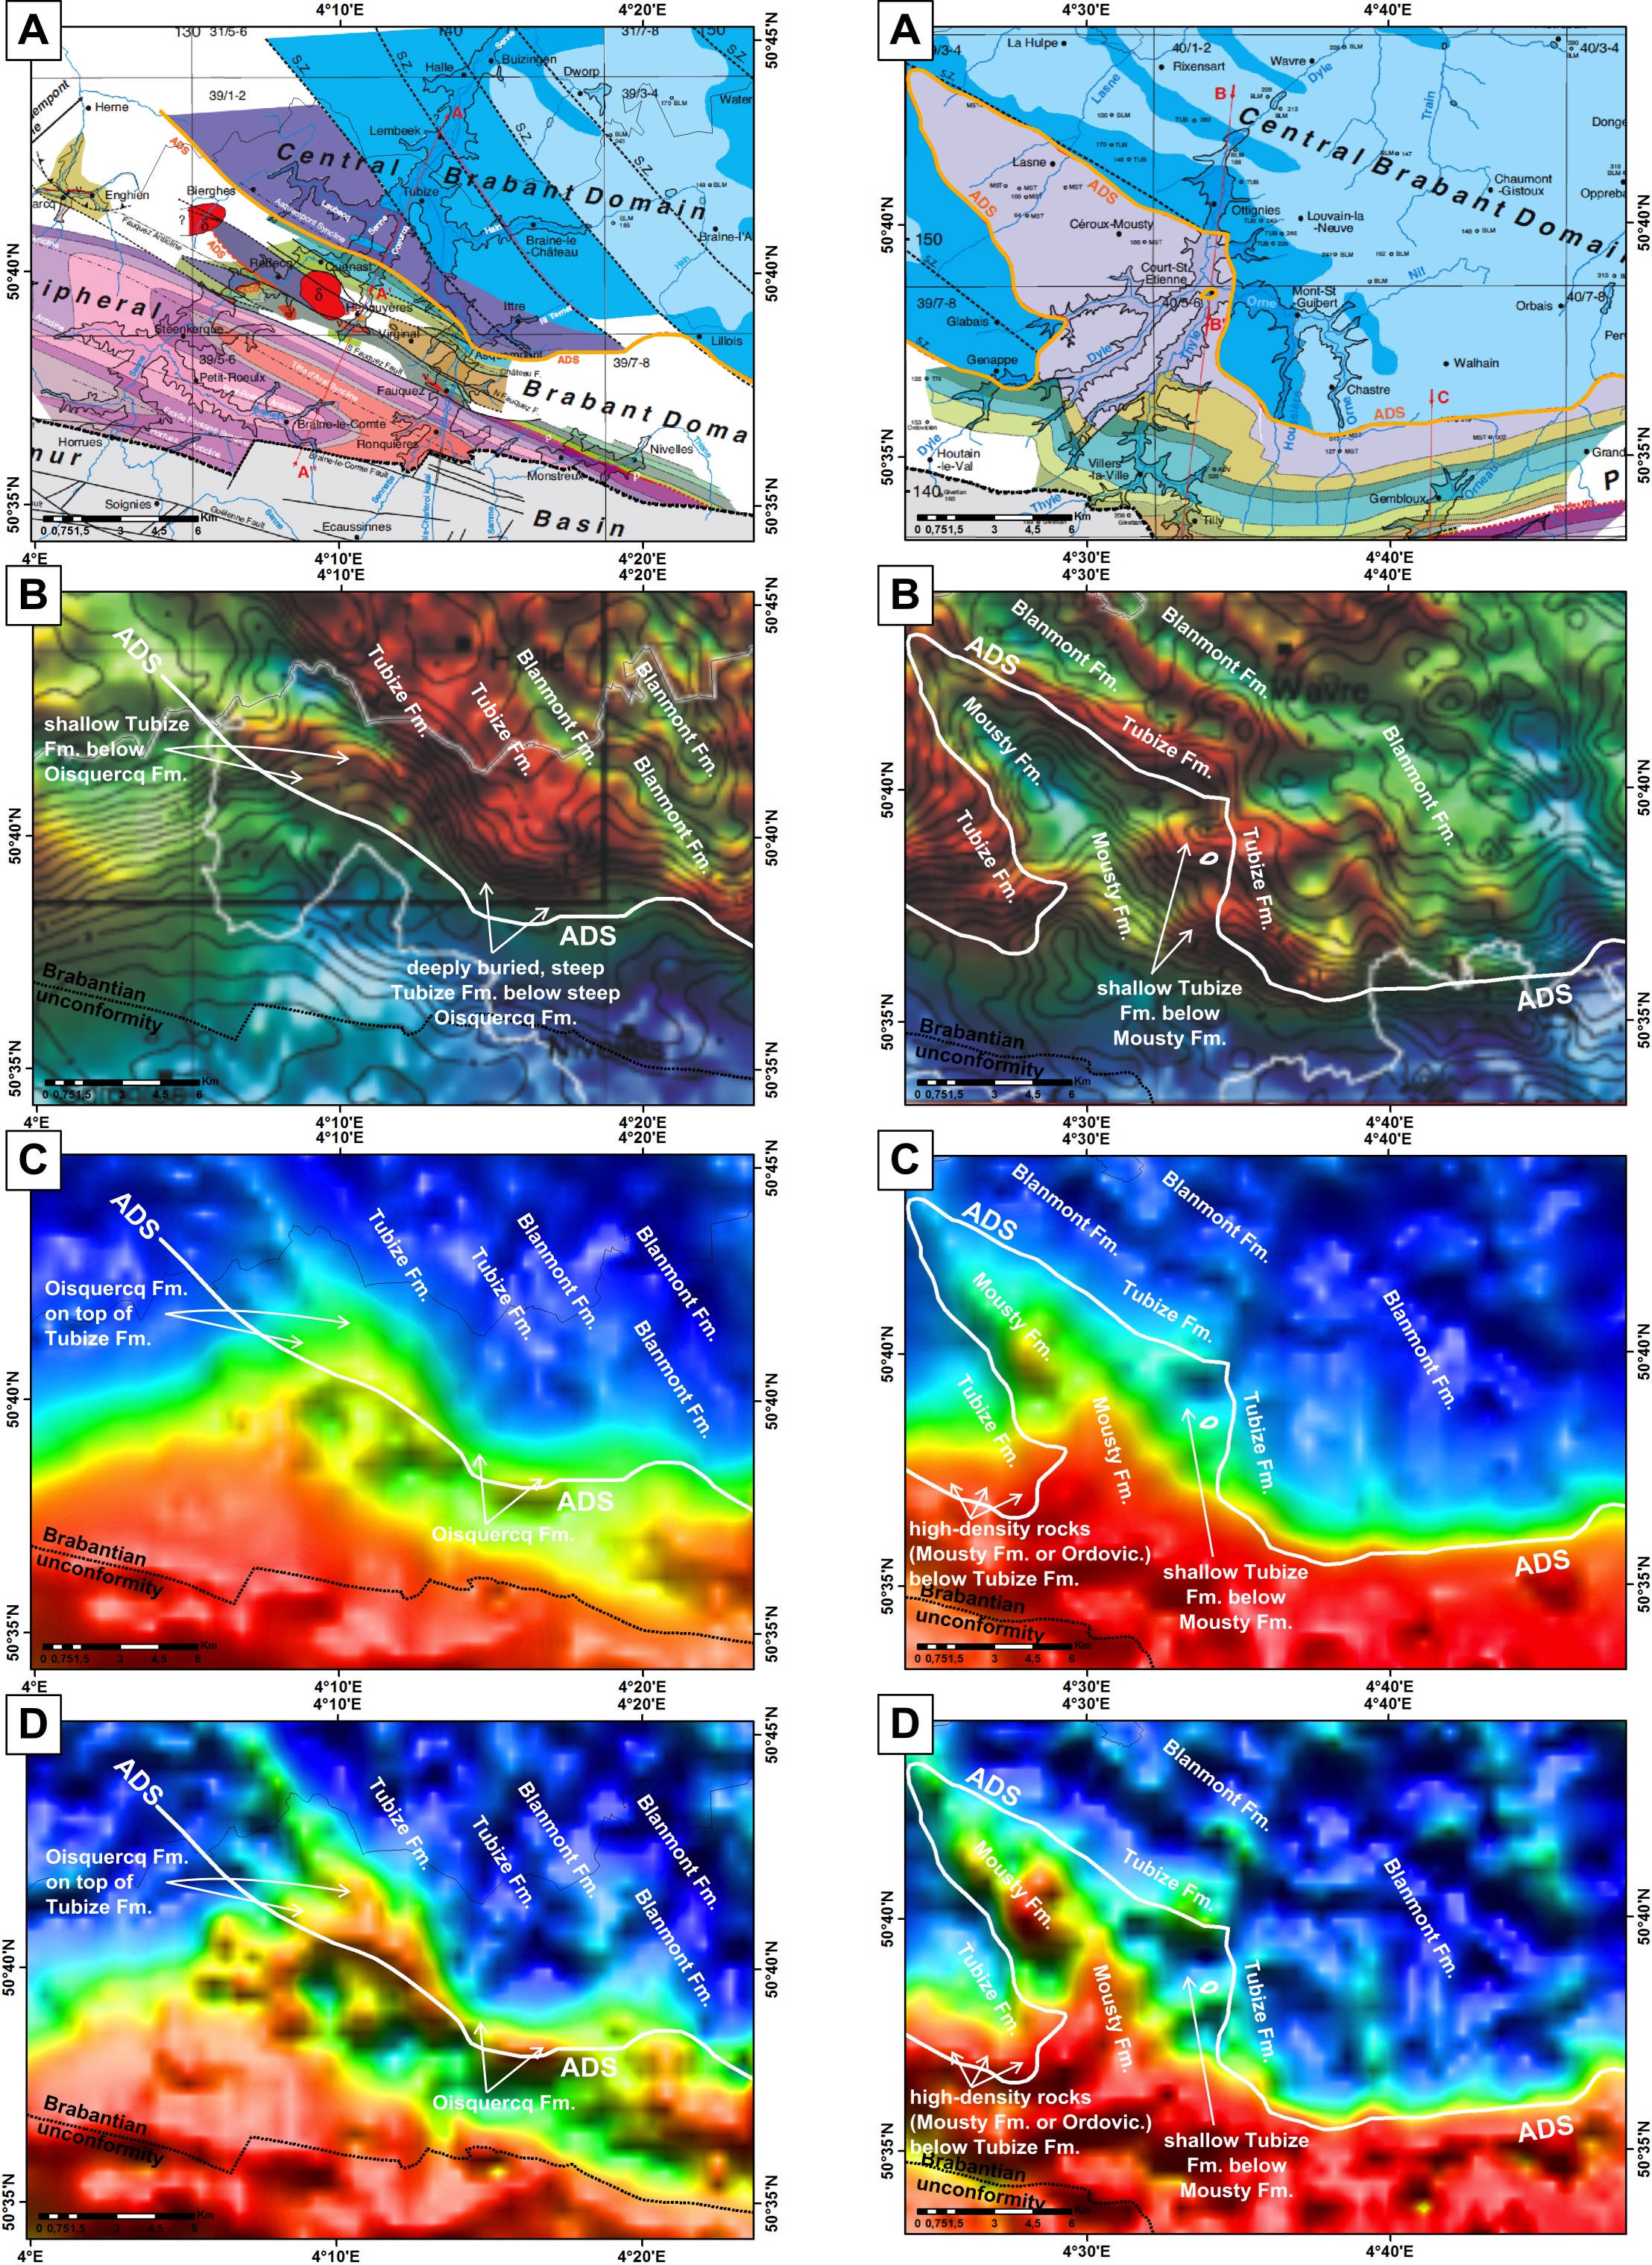
17Figure 6 (left). Geological map (A), aeromagnetic map (B), Res5k filter of Bouguer gravity data (C) and Res1k filter of Bouguer gravity data (D), showing the position of the ADS for the Senne-Sennette outcrop area. The ADS is shown in orange on the geological map and in white on the geophysical images. The geological map is as presented in this work (see Figs 9, 10). The aeromagnetic data, reduced to the pole, (B) are from Chacksfield et al. (1993), and also show gravity contours in black and province outlines in white. The Res5k (C) and Res1k (D) filters of the Bouguer gravity data are taken from Chacksfield et al. (2004; project VLA04-3.1), and represent the residual gravity after subtraction of anomalies upward continued by 1 km and 5 km respectively.
18Figure 7 (right). Geological map (A), aeromagnetic map (B), Res5k filter of Bouguer gravity data (C) and Res1k filter of Bouguer gravity data (D), showing the position of the ADS for the Dyle-Thyle outcrop area. Legend as for Fig. 6.
19Figure 8. Geological map (A), aeromagnetic map (B), Res5k filter of Bouguer gravity data (C) and Res1k filter of Bouguer gravity data (D), showing the position of the ADS for the Grande Gette outcrop area. Legend as for Fig. 6.
20Formation colours were chosen to highlight the formations belonging to the Cambrian (blue hues), the Ordovician (green hues) and the Silurian (purple hues) (Figs 9, 10). Where concealed, extrapolated formations are shown in paler shades of the same colours. For a better readability the geological map of the area was split into two maps. The West Brabant map extends from the eastern Senne valley to the western Dender valley (Fig. 9). The East Brabant map extends from the eastern Mehaigne and Grande Gette valleys to the western Thisne and Hain valleys (Fig. 10). The two maps show a slight overlap for easier reading. Four large sections complement these maps (Figs 11, 12, 13). The lithostratigraphy used for the Cambrian and the Ordovician corresponds to recent syntheses by Herbosch & Verniers (2013, 2014). The Silurian lithostratigraphy corresponds to the latest version of the Belgian Stratigraphic Commission (Verniers et al., 2001; NCS, 2017). The Wenlockian lithostratigraphy (Sheinwoodian and Homerian; Fig. 4) differs slightly between the east and west because of strong lateral facies changes (Verniers, pers. comm. 2017).
21Figure 9. W-Brabant Map, showing the Palaeozoic geology from the Dendre outcrop area in the west to the Dyle-Thyle outcrop area in the east. The position of section A-A’-A’’ (Fig. 11) is indicated.
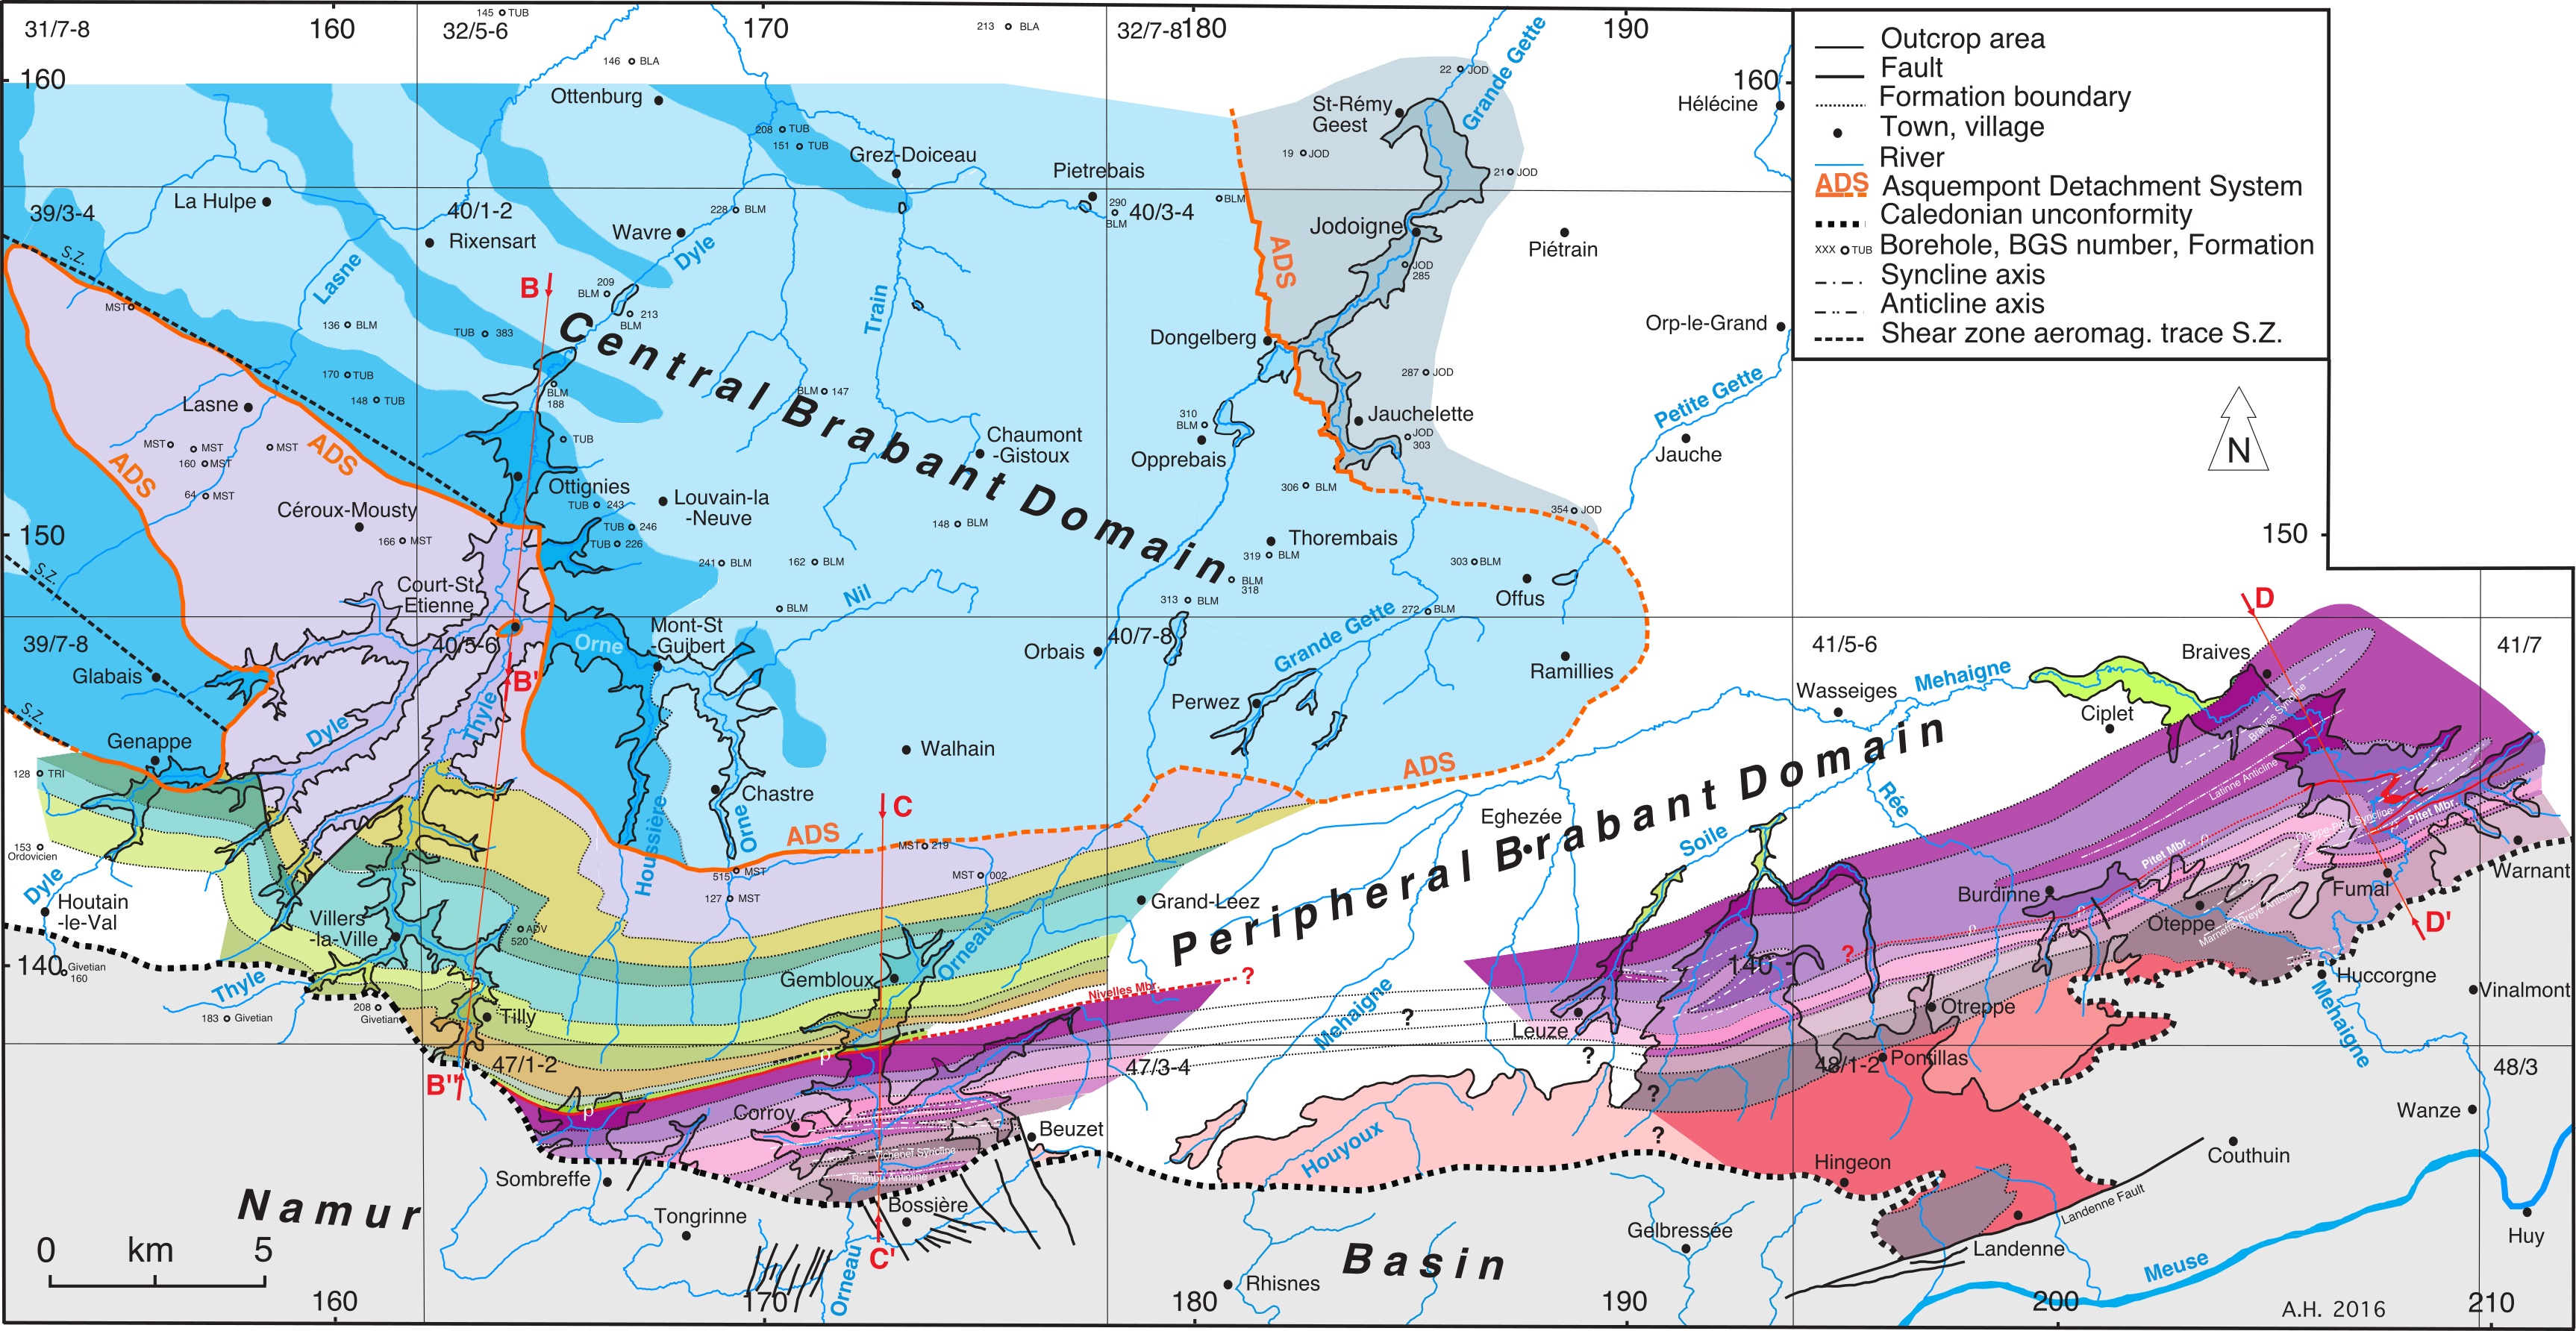
22Figure 10. E-Brabant Map, showing the Palaeozoic geology from the Dyle-Thyle outcrop area in the west to the Mehaigne outcrop area in the east. The position of sections B-B’-B’’ (Fig. 12), C-C’ and D-D’ (Fig. 13) is indicated. See Fig. 9 for legend.
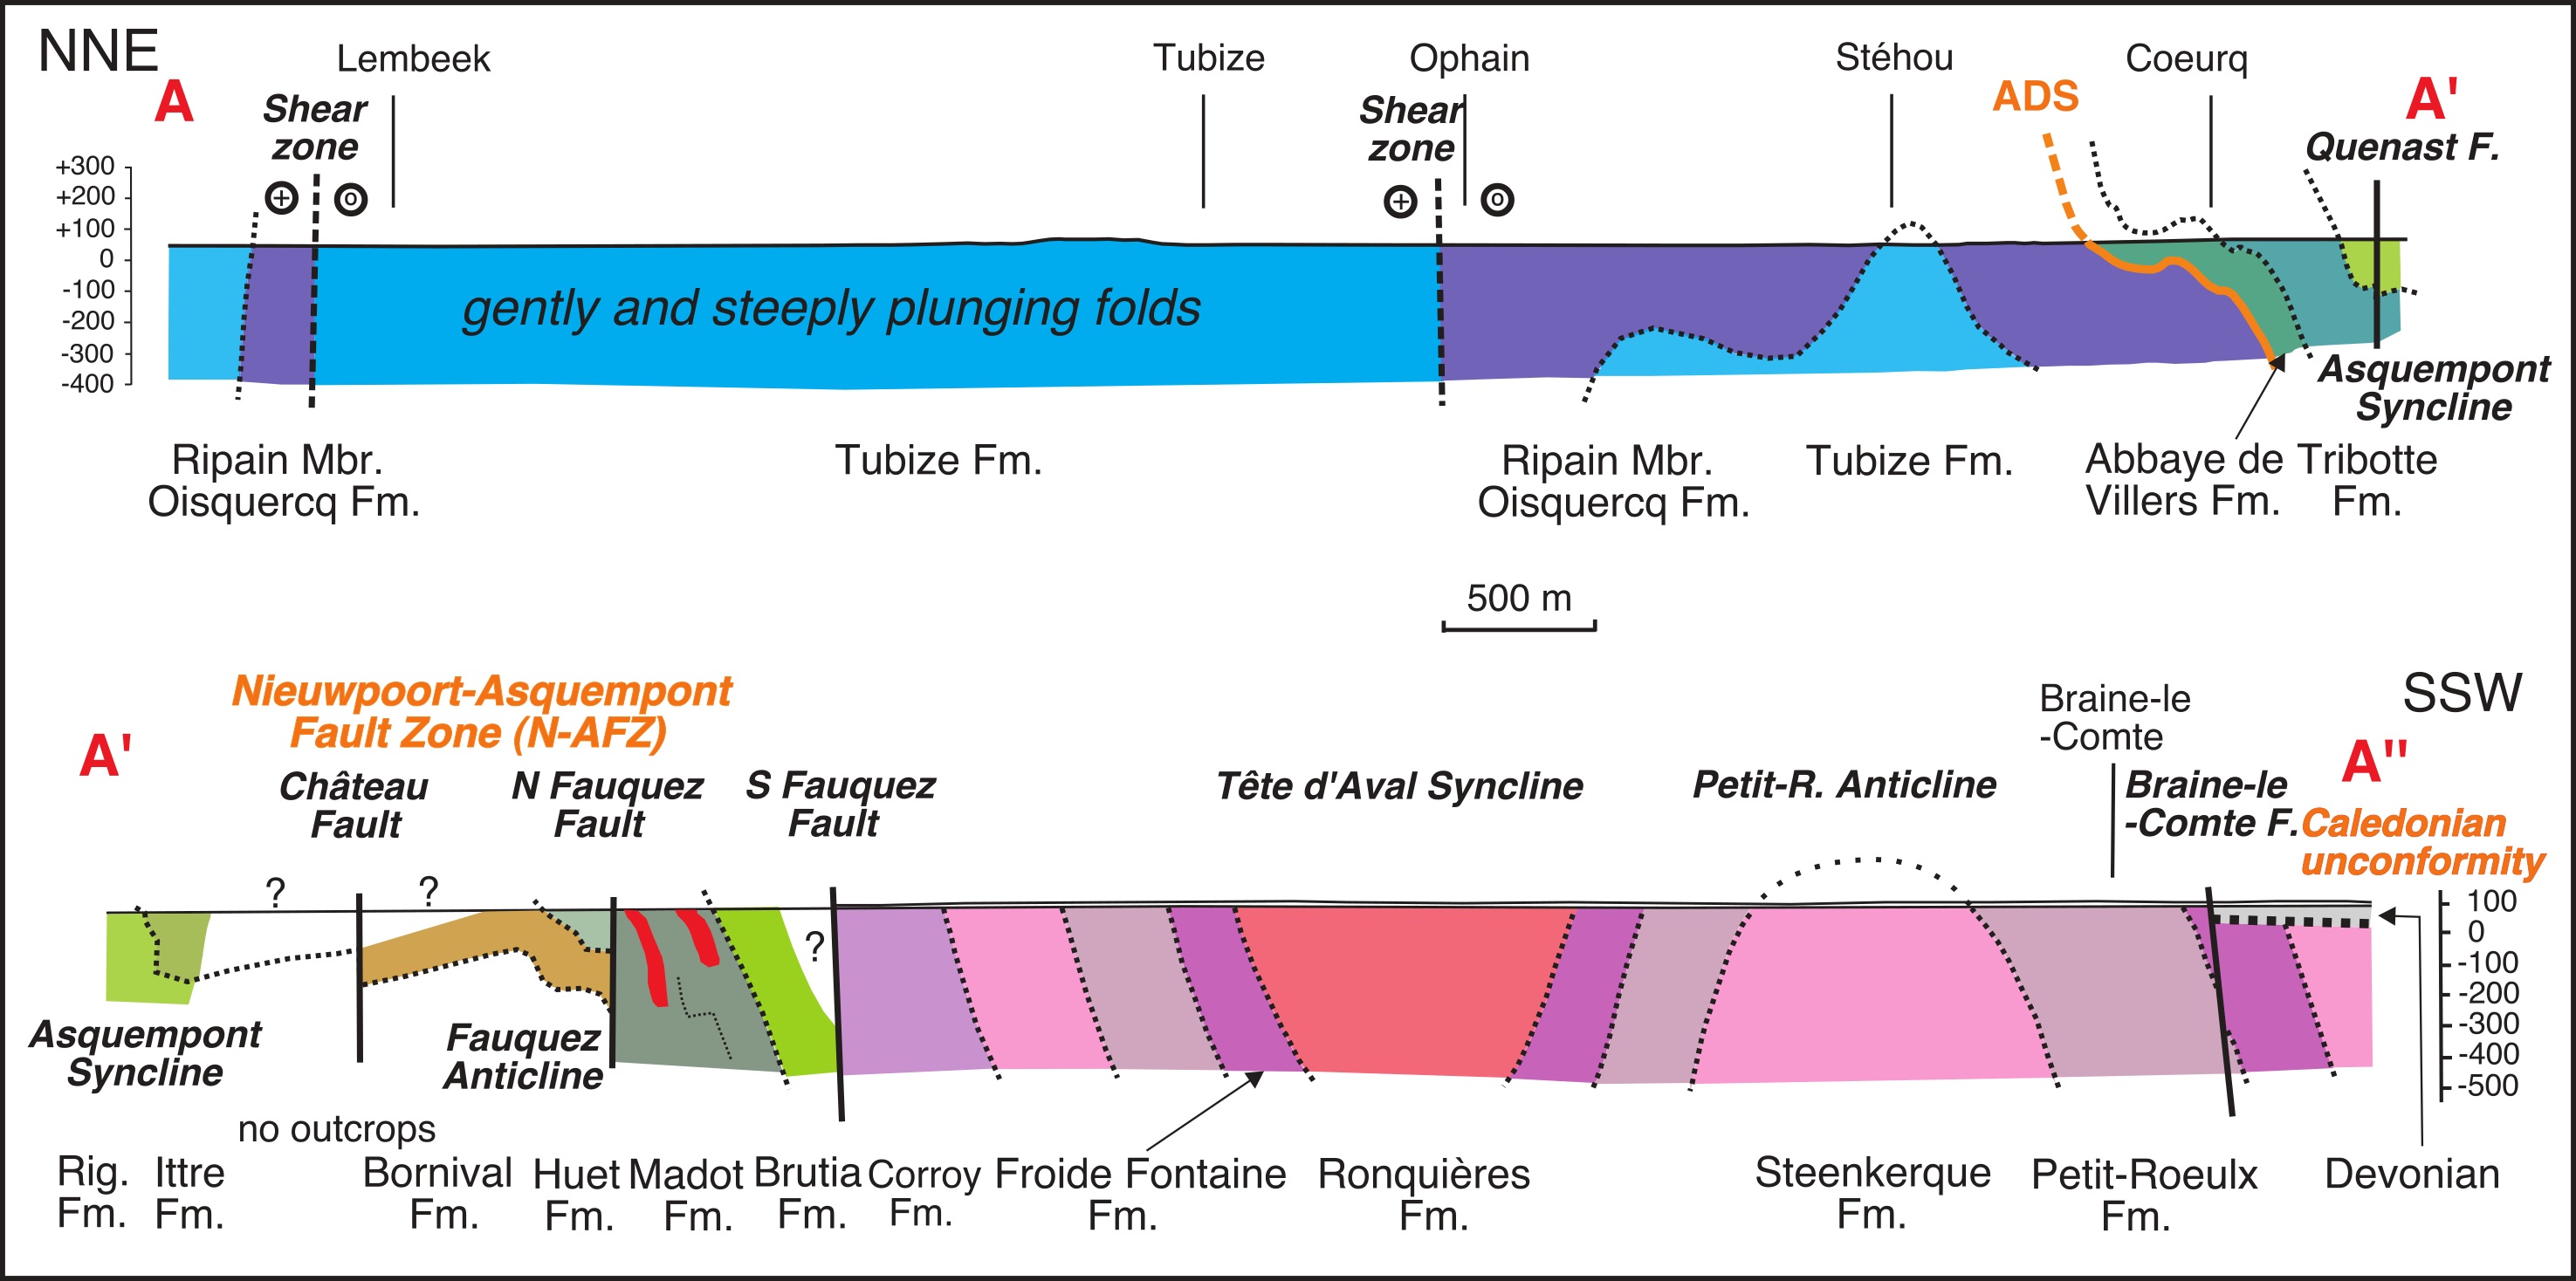
23Figure 11. Cross-section A-A’-A’’ across the Senne-Sennette outcrop area, along the Coeurcq valley. See Fig. 9 for position. Abbreviation: Rig.: Rigenée.
24Figure 12. Cross-section B-B’-B’’ across the Dyle-Thyle outcrop area, along the Thyle valley. See Fig. 10 for position. Section part B’-B” is taken from Delcambre et al. (2002).
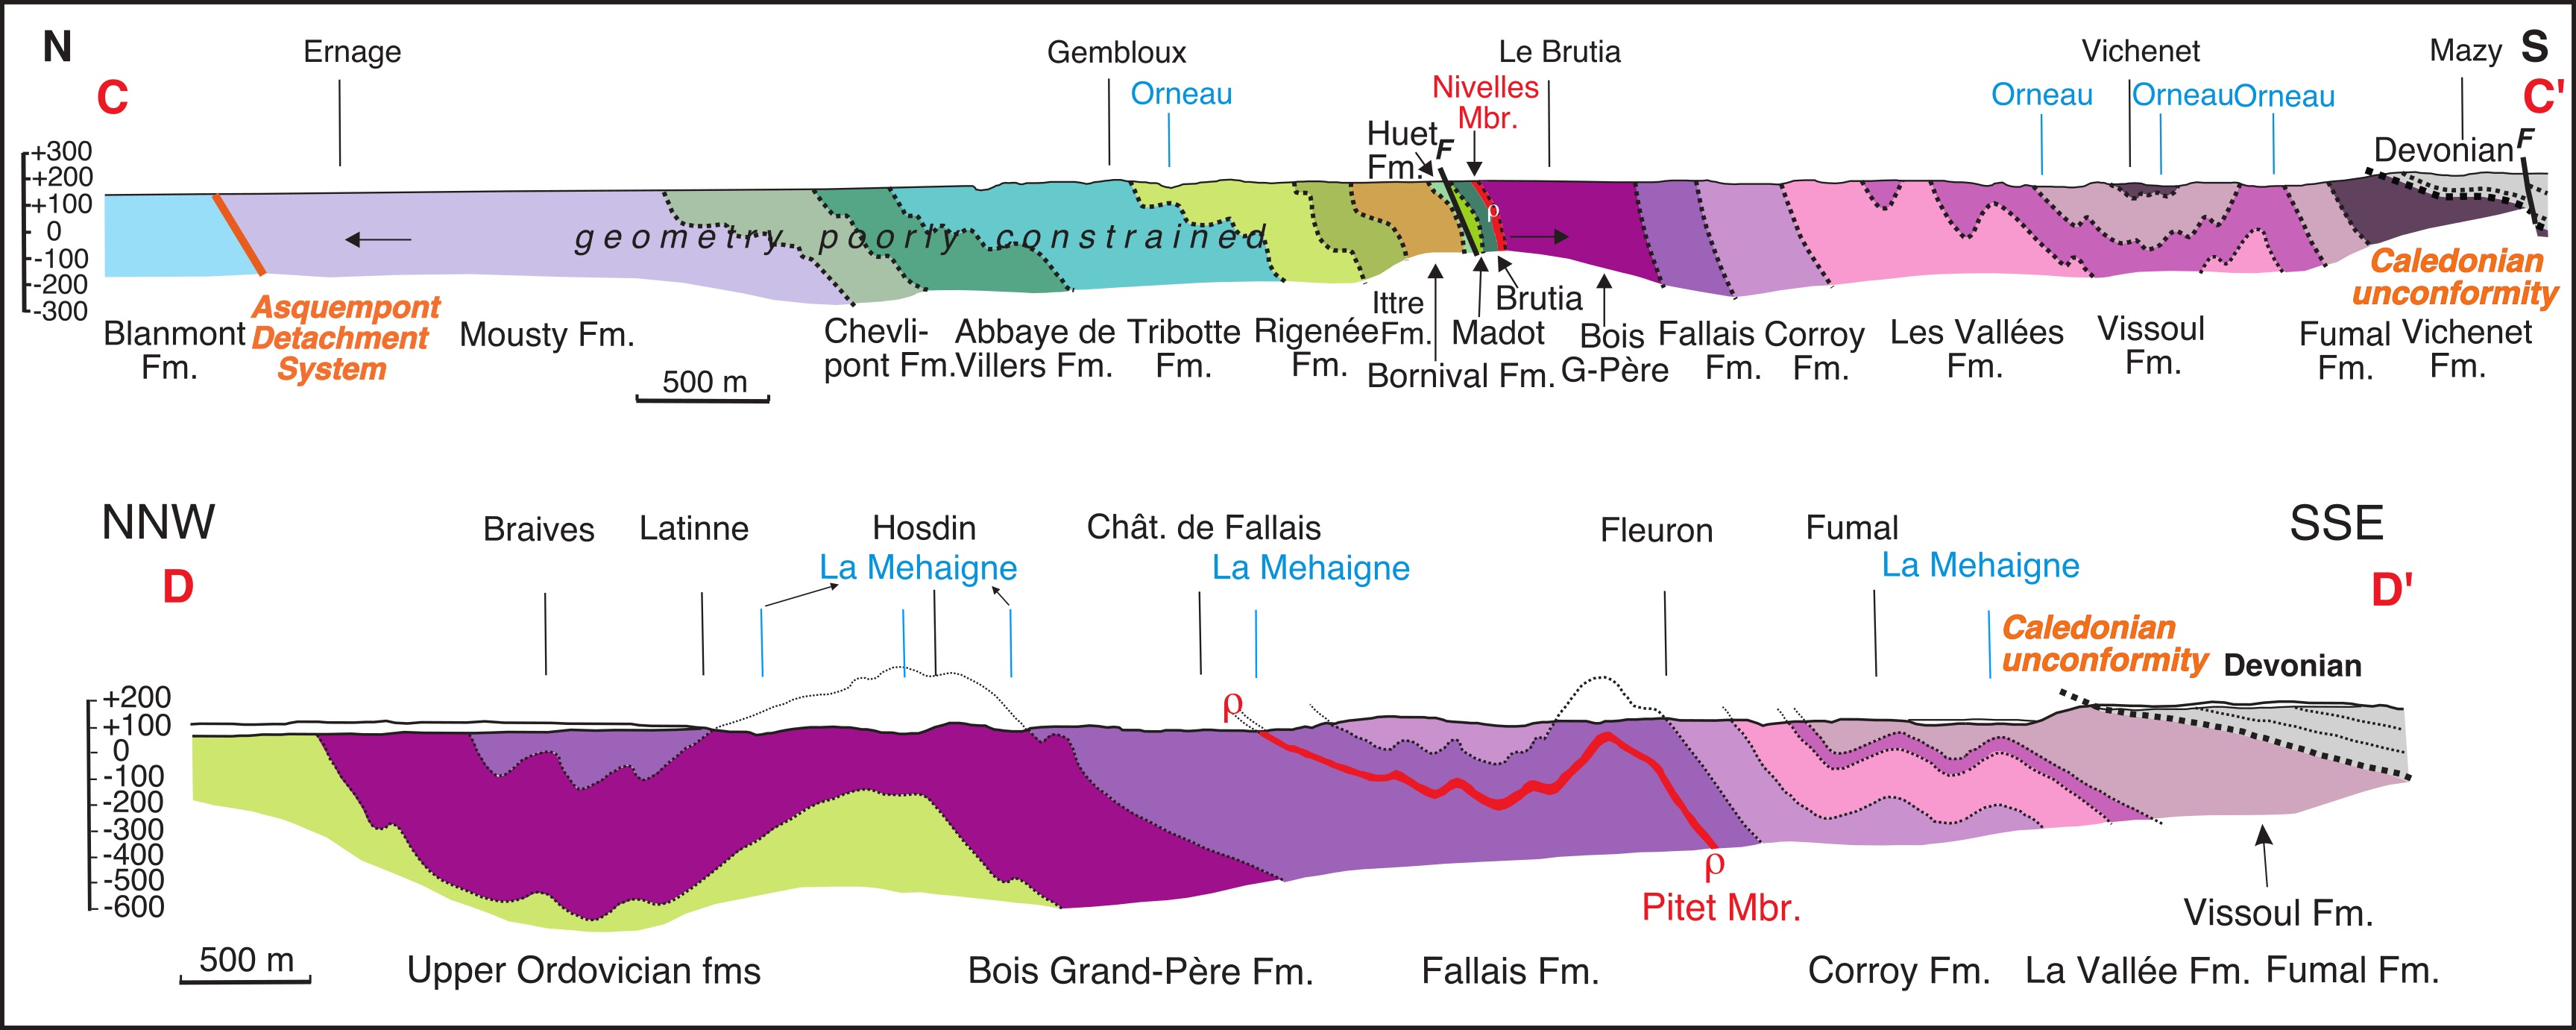
25Figure 13. Cross-sections C-C’ and D-D’, respectively along the Orneau valley, and along the Mehaigne valley. See Fig. 10 for position. Section C-C’ extended and modified from Delcambre & Pingot (2008) and section D-D’ modified from Delcambre & Pingot (2014).
26The two main structural concepts used for the construction of this map and also for the subcrop map of Piessens et al. (2005), are: 1) different fold styles formed during one single progressive deformation and 2) a continuation of the Asquempont Detachment System across the entire Brabant Massif.
27The Cambrian core of the Brabant Massif is characterised by an overall steepness of bedding and contains steeply plunging folds (type B folds of Debacker (2001) and Debacker et al. (2004b)) whereas the Ordovician-Silurian rim is characterised by subhorizontal to gently plunging folds (type A folds). As demonstrated by Debacker (2001) and Debacker et al. (2004b), type A folds also occur in the Cambrian core, gradual transitions exist between the type A and type B folds, and both fold types formed during the same progressive deformation event, the Brabantian deformation event (see also Debacker, 2012).
28The Asquempont Detachment System (ADS) is a pre-cleavage and pre-folding extensional fault zone oriented at low angles to bedding that formed between the late Ordovician and the time of cleavage development (Debacker, 2001; Debacker et al., 2004a, 2005b, 2012; Figs 1B, 5, 14). On the basis of the age of the youngest formation in the hangingwall (Fig. 14); Katian Madot Formation in borehole at Waregem; Sandbian Ittre Formation in boreholes at Bever and Tielt), detachment took place during or after the Katian. The Asquempont Detachment System was first described in the Sennette outcrop area (Debacker, 2001; Debacker et al., 2003, 2004a) and was later systematically observed in the other outcrop areas of the Brabant Massif (Debacker et al., 2004a, 2005b, 2011; Debacker & Sintubin, 2008; Herbosch et al., 2008a; Herbosch & Blockmans, 2012; Herbosch et al., in press). As demonstrated by Debacker (2001) and Debacker et al. (2003, 2004a) the Asquempont fault or Asquempont Detachment System is unrelated to the aeromagnetic Asquempont lineament (cf. Sintubin, 1997, 1999). It is also not related to the Nieuwpoort-Asquempont Fault Zone, a post-cleavage and post-folding consisting of steep normal faults (see also below; Debacker, 2001; Debacker et al., 2003, 2004a). On the basis of the stratigraphic position of the hangingwall and footwall rocks in boreholes in the unexposed western part of the BM, Piessens et al. (2005) deduced an initial (i.e. pre-folding) gentle NNE-dip for the Asquempont Detachment System, fully compatible with the outcrop data (Fig. 14; fig. 11 in Herbosch et al., 2008a). Its effect on the distribution of the different stratigraphic units is so pronounced, that this detachment system was used successfully as key feature in the construction of the new subcrop map of the unexposed Flemish part of the Brabant Massif (Piessens et al., 2005, in prep.). As the initial insights on the Asquempont Detachment System were only presented in 2000, and the idea of an occurrence across the entire Brabant Massif was only proposed in 2001, it is not depicted on pre-2001 maps. In addition, the Asquempont Detachment System model was not understood or adopted immediately by some surveyors of the Brabant Massif and a delay of often more than six years exists between the survey and the publication of the geological map. As a result only maps 39/1-2 and 40/3-4 incorporate the Asquempont Detachment System (Herbosch et al., 2013, in press; see Annex 1).
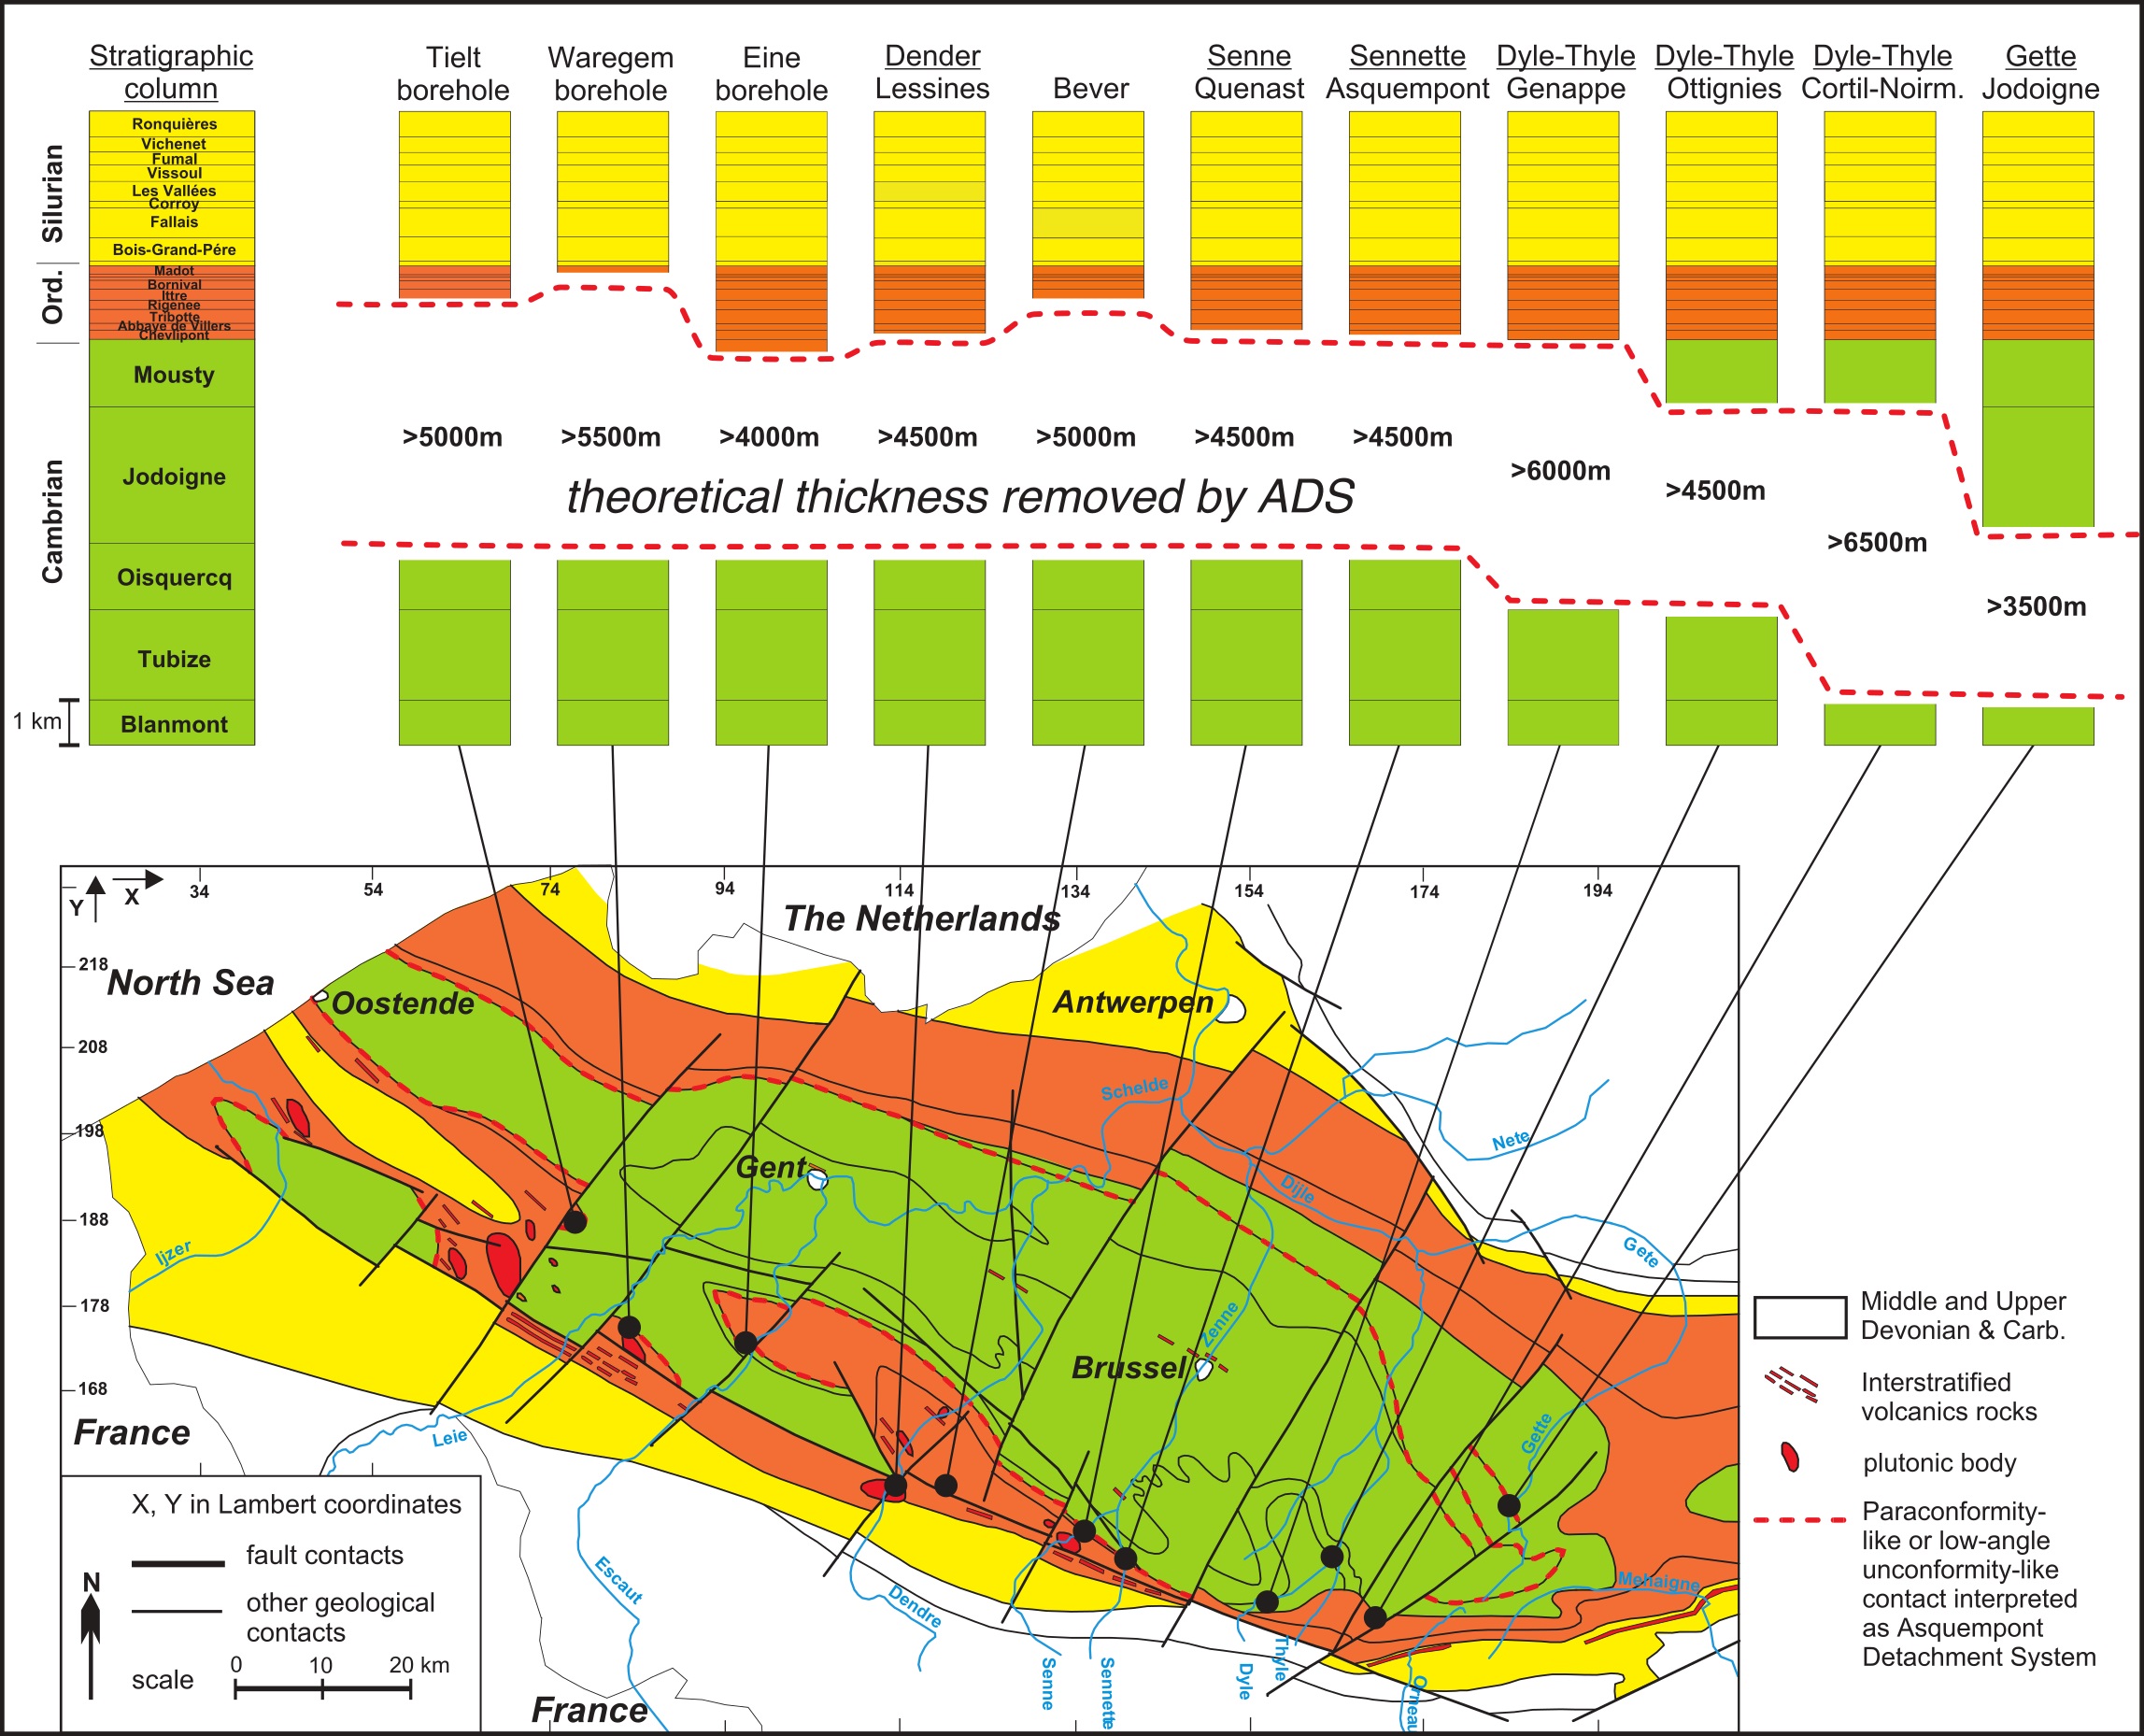
29Figure 14. Geological subcrop map of the Brabant Massif (after De Vos et al., 1993 and Van Grootel et al., 1997), showing the effect of the Asquempont Detachment System on the stratigraphy at different observation points, taken from Herbosch et al. (2008a; their fig. 11). For comparative purposes, for each of these points the same composite stratigraphic column is used as shown in the upper left corner. On these stratigraphic columns, the part considered to be removed by the Asquempont Detachment System is shown in white, together with a minimum thickness estimate (cf. thickness estimates in Figure 4). Waregem, Eine, Lessines (Dender valley) and Bever are borehole observations, whereas the columns for the Senne, the Sennette, the Dyle-Thyle and the Gette are based on outcrop observations.
4. Large-scale observations
30A subhorizontal Mesozoic-Cenozoic cover conceals much of the mapped Lower Palaeozoic units and rests on this basement via an angular unconformity. In the few cases where a basal conglomerate is visible it is thin (10 cm maximum) and reduced to some small debris derived from the nearest substrate (Herbosch & Verniers, 2015, p. 25).
4.1. Main units and domains
31The Brabant Massif (in bright colour on Figs 9, 10) is separated from the overlying Namur Basin (in grey) to the south by an angular unconformity previously known as the Caledonian unconformity (Fourmarier, 1931; heavy black dots on the new map) and more recently as the Brabantian unconformity (Legrand, 1967; Sintubin et al., 2009). Both the Brabant Massif and the Namur Basin constitute the Brabant Parautochthon. The Brabantian unconformity is overlain by red conglomerate to coarse sandstone of the Mautiennes Member of the Bois de Bordeaux Formation of Givetian age (Fourmarier, 1921; Lacroix in Bultynck et al., 1991). The composition of the Mautiennes Member changes from W to E, accompanied by an eastward reduction in thickness. Its trace can be followed from the Dender valley (Fig. 9, map 38/2) to the eastern part of the Mehaigne valley where it disappears near Huccorgne (Fig. 10, map 41/7). To the east the angular unconformity is overlain by the Bovesse Formation which disappears below the Mesozoic near Warnant (Delcambre & Pingot, 2014, p 39). In the central part (Fig. 9, map 39/7-8) it could be recognized in boreholes by its red colour. The conglomerates are best developed (several tens of meters thick) between the Samme valley (Fig. 9, map 39/5-6) and the Orneau valley (Fig. 10, map 47/1-2). In the former valley, thick conglomerates are associated with palaeovalleys incised in the Lower Palaeozoic basement.
32Within the outcropping parts of the Brabant Massif two subunits are often distinguished on individual maps (Annex 1): a Central Brabant Unit to the north and a Senne-Dyle-Orneau Unit to the south (see individual maps and also Herbosch & Verniers, 2013, 2014, 2015). These two units are separated by the ADS (Figs 1B, 9, 10). The Central Brabant Unit (blue hues on the new maps) is exclusively formed by the lower Cambrian Blanmont, Tubize and Oisquercq formations (Figs 4, 9, 10), whereas the Senne-Dyle-Orneau Unit (green and purple hues on the new maps) includes all younger formations. The Central Brabant Unit is characterised by the common to frequent occurrence of steeply plunging folds (Type B folds of Debacker et al., 2004b) (Figs 9, 10, 11, 12; e.g. Debacker, 2012). In the Senne-Dyle-Orneau Unit typically, gently plunging folds occur, usually with a south vergence (type A folds of Debacker et al., 2004b) (Figs 11, 12; e.g. Debacker, 2012). Because of observations in the Jodoigne area (Fig. 10, maps 40/3-4 and 32/7-8), this distinction between a Central Brabant Unit and a Senne-Dyle-Orneau Unit on the basis of relative position to the ADS and the dominant fold type can no longer be used. In this area, the only outcrop area situated along the northern side of the Brabant Massif, steeply plunging (Type B) folds frequently occur on either side of the ADS, and also gently plunging (Type A) folds occur but without a south-vergence (Debacker et al., 2006; Herbosch et al., 2008a). Although less obvious, and often ignored, a similar problem with this distinction also occurs in the Dyle-Thyle outcrop area. There, steeply plunging folds also occur in the Mousty Formation, situated in the Senne-Dyle-Orneau Unit. In addition, as pointed out above, gently plunging folds also occur in the Central Brabant Unit. As the ADS itself is folded by Type A and Type B folds, the ADS could not form a limit between two units characterised by these two different fold types.
33Still, in order to allow a distinction between the central parts of the Brabant Massif and the more peripheral parts, and to be somewhat compatible with published maps, for the purpose of this work we propose to use the name Central Brabant Domain and to replace the Senne-Dyle-Orneau Unit by the Peripheral Brabant Domain as to incorporate the observations of the Grande Gette outcrop area (Figs 9, 10). In this new definition, both domains are separated by the ADS, the Central Brabant Domain is composed of the Blanmont, Tubize and Oisquercq formations and the Peripheral Brabant Domain is composed of all other formations ranging from the Jodoigne Formation to the youngest Silurian formation. Steeply plunging (type B) folds mainly occur in, but are not restricted to the Central Brabant Domain. Similarly, even though mainly containing gently plunging (type A) folds, depending on position both fold types may also occur in the Peripheral Brabant Domain (e.g. Jodoigne Formation in Grande Gette outcrop area and locally in Mousty Formation in Dyle-Thyle outcrop area). It should be stressed that this division of specific stratigraphy-based domains by the ADS can only be used within the outcrop areas, and cannot be extrapolated to the entire Brabant Massif. As illustrated during the subcrop map construction by Piessens et al. (2005, in prep.), at depth, and in other parts of the Brabant Massif, rocks of the Oisquercq and Tubize formations are expected above the ADS, and hence technically in the Peripheral Brabant Domain, and rocks of the Jodoigne and Mousty formations are expected below the ADS, technically in the Central Brabant Domain.
34Within the Ordovician (post Mousty Formation) and Silurian in the Peripheral Brabant Domain along the southern rim of the Brabant Massif only gently plunging (Type A) folds occur. Borehole data from the unexposed southern parts of East and West Flanders (Rekkem and Bellegem) show gently dipping Silurian deposits without folds or cleavage. In addition, several boreholes also show gently dipping and uncleaved Pridoli to lowermost Lochkovian deposit unconformably overlain by sub-horizontal Givetian deposits (Van Grootel, 1990; Verniers & Van Grootel, 1991). This suggests that the subhorizontal to gently plunging folds (Type A folds), as observed in the Ordovician and Silurian deposits in the Senne-Sennette outcrop area, progressively attenuate towards the WNW. Despite the lack of outcrop (except in the Lessines quarries) it can be argued that also in the Dender outcrop area the Silurian deposits are not cleaved and are not or only very gently folded.
4.2. Asquempont Detachment System (ADS)
35The ADS is observed in the Senne-Sennette outcrop area, and even though not directly observed, in the Dyle-Thyle outcrop area and the Grande Gette outcrop area its trace can also be mapped with confidence. As demonstrated by Debacker (2001; see also Debacker et al., 2003, 2004a), the ADS is unrelated to the aeromagnetic Asquempont lineament. The ADS is visible on aeromagnetic data only where the immediate footwall is composed of magnetic units of the Tubize Formation (Figs 5, 7B).
4.2.1. ADS trace constrained by outcrops
36In the Senne-Sennette outcrop area, where the ADS was first defined, but referred to as the “Asquempont fault” (cf. Legrand, 1967), it can be observed in three different localities: in the Senne valley to the north of Quenast, in the Sennette valley in the old railway line at Virginal and along the canal section at Asquempont (Debacker, 2001; Debacker et al., 2003, 2004a). Because of the local exposure of the ADS, and further detailed mapping, in particular in the Rebecq-Quenast area (Fig. 9, map 39/1-2; Debacker et al., 2011), the ADS can be traced with confidence from Bierghes to Asquempont. Within this outcrop area the ADS forms the boundary between the lower to lower middle Cambrian Oisquercq Formation and the Lower (east) to Upper (west) Ordovician.
37The presence of the ADS in the Dyle-Thyle outcrop area was proposed by Debacker et al. (2005b) as a new explanation for the large Mousty Formation embayment (Figs 9, 10, map 39/3-4), the proximity between the lower Cambrian formations and the upper Cambrian to Lower Ordovician formations, and the formerly controversial “klippe” observed at Court-St-Etienne (Fig. 10, map 40/5-6; Delcambre et al., 2002; cf. Anthoine & Anthoine, 1943; De Magnée & Raynaud, 1944). Many faults previously proposed in the Dyle-Thyle outcrop area are now recognized as part of the ADS. In the area near and to north-east of Genappe the ADS replaces the Genappe Fault (Fig. 10, map 39/7-8; Herbosch & Lemonne, 2000) and from Ottignies to the south of Chastre it replaces the Ottignies, Orne and Noirmont-Baudecet faults (Figs 10, 13, maps 40/5-6, 40/1-2; Delcambre et al., 2002; Herbosch & Blockmans, 2012). Within this outcrop area, the ADS forms the contact between the lower Cambrian Tubize Formation and the upper Cambrian Mousty Formation to Lower Ordovician (west) and between the lower Cambrian Blanmont or Tubize formations and the upper Cambrian Mousty Formation (east). As the ADS is folded here by Type A and Type B folds, the ADS has a very irregular map trace, with local periclinal culminations of the Tubize Formation (the former “klippe”). This irregular trace is however well constrained by a combination of outcrops, boreholes, structural data and – because of the characteristic properties of the Tubize Formation – aeromagnetic data (Debacker et al., 2005b; Fig. 5).
38The Grande Gette outcrop area is the only outcrop area along the N-side of the Brabant Massif (Fig. 10, map 40/3-4; Herbosch et al., 2008a, Debacker & Herbosch, 2011; Herbosch et al., in press). The ADS was introduced here to explain the proximity of the Jodoigne Formation and the Blanmont Formation, following a stratigraphic revision in which the Jodoigne Formation is no longer considered as the oldest formation of the Brabant Massif (lowermost Cambrian?) but instead as middle to lower Cambrian (see Herbosch et al., 2008a; cf. Piessens et al., 2005 and Debacker et al., 2010). Also in this outcrop area, the ADS is folded by type A and type B folds (Herbosch et al., 2008a). On the basis of a combination of detailed mapping and structural data, the ADS trace can be followed with confidence from Jauchelette to Dongelberg.
4.2.2. ADS trace constrained by boreholes and geophysical data
39In between these three outcrop areas, the ADS trace shown in Figures 9 and 10 is based on borehole data and aeromagnetic and gravimetric data.
40Between the Senne-Sennette outcrop area and the Dyle-Thyle outcrop area (Fig. 9, maps 39/7-8, 39/5-6), the upper part of the footwall is composed of the Oisquercq Formation (west) or the Tubize Formation (central and east), whereas the hangingwall is composed of Lower Ordovician (Fig. 6A). Because of the presence of levels with a high magnetic susceptibility, the Tubize Formation stands out on aeromagnetic maps (Everaerts, 2000; Figs 5, 6B). It also has a low relative density, whereas the Oisquercq Formation (footwall) and the Ordovician hangingwall rocks have higher relative densities (see also De Vos et al., 1992). Taking into account these geophysical properties, the ADS can be traced with a fair amount of confidence between both outcrop areas, with confidence increasing eastwards. The presence of the Oisquercq Formation in the ADS footwall in the Asquempont-Ittre area makes it slightly harder to determine the fault trace. Judging from the gravity and magnetic data however, which show a “Tubize signature” (i.e. high-resolution, very positive magnetic anomaly and negative gravity anomaly), the Oisquercq Formation seems to be relatively thin, and thinning towards the east (Fig. 6B-6D). From Lillois onwards, the Oisquercq Formation appears to be virtually absent and the upper part of the footwall composed almost entirely of the Tubize Formation, allowing for a more accurate trace on the basis of geophysical data (Fig. 6A-6D).
41In the Dyle-Thyle area (Fig. 10), the gravity data allow refinement of the ADS trace shown by Debacker et al. (2005b) (see also Fig. 5). Judging from the gravity data, the Mousty Formation is characterised by high relative densities, and the Mousty embayment is clearly visible on the gravimetric map (Fig. 7C-7D). Interestingly, low gravity values are observed around Court St-Etienne, and these low values continue eastwards across the ADS (Fig. 7C-7D). This can be attributed to the low relative densities of the Tubize Formation, which occurs there at relatively shallow depth. As such, the gravity data confirm the model put forward by Debacker et al. (2005b), and provide further evidence against the former “klippe” hypothesis. Around Genappe (map 39/7-8), the footwall is composed entirely of the Tubize Formation and the position of the ADS trace is partially constrained by outcrops (Fig. 7A). The trace is compatible with the aeromagnetic data (Fig. 7B), but high gravity values continue for about 1 km to the north of the ADS (Fig. 7C-7D). This indicates the presence at depth of relatively high density rocks, either the Mousty or Ordovician formations, below the Tubize Formation visible in outcrop. Either this is due to some amount of thrusting, cutting the ADS at depth, or it reflects the ADS being situated in an overturned fold limb.
42The gravity and magnetic data of the Grande Gette outcrop area (Fig. 8B-8D) do not show obvious differences between the Jodoigne Formation (east) and the Blanmont Formation (west) that allow definition of the ADS trace. Indeed, mapping by Herbosch et al. (2008a) shows that the lower parts of the Jodoigne Formation, cartographically closest to the ADS, are very rich in quartzite and therefore expected to have similar densities to the Blanmont Formation. Only the younger parts of the Jodoigne Formation, situated around Jodoigne (Fig. 10, map 40/3-4), have a high concentration of fine-grained, relatively denser beds. Indeed, there the gravity data show higher values (Fig. 8C-8D). Because of the similarities in gravity and magnetic data between the Blanmont Formation and the lower parts of the Jodoigne Formation, the trace of the ADS is poorly constrained between the Grande Gette and the Dyle-Thyle outcrop areas (Figs 8A, 10, maps 40/3-4, 40/7-8), in particular where the ADS crosses the central axis of the Brabant Massif (east of Offus and Ramillies). Towards the west however, the confidence with which the ADS can be traced increases, as the hangingwall lithology changes from the Jodoigne Formation to the Mousty Formation. From about Grand-Leez westwards (map 40/7-8), the large relative density difference between the Mousty Formation and the Blanmont Formation results in a strong gravimetric gradient across the ADS (Fig. 7C-7D, Fig. 8C-8D).
43As shown above, the ADS can be traced (Figs 6 to 13) with a relatively high level of confidence for 60 km in an E-W direction and extends for 20 km in a N-S direction. The trace of the ADS on our maps complements the subcrop map of the central and northern, Flemish part of the Brabant Massif constructed by Piessens et al. (2005, in prep.).
4.3. The Nieuwpoort-Asquempont Fault Zone (N-AFZ)
44In the unexposed parts of the Brabant Massif to the west of the Senne valley, Legrand (1968) defined a WNW-ESE-trending brecciation zone observed in boreholes, as the Oudenaarde-Bierghes fault zone. On the basis of geophysical data and inferred stratigraphic jumps, De Vos et al. (1993) extended this fault zone and labelled it the Nieuwpoort-Asquempont Fault Zone (N-AFZ). Using aeromagnetic, geochemical, hydrochemical and Audio Frequency Magnetics (AFMAG) lineaments, and inspired by a strike-slip movement proposed by André & Deutsch (1985), Everaerts et al. (1996) and Sterpin & De Vos (1996) concluded a sinistral sense of movement. However, outcrop observations along the eastern part of the N-AFZ consistently point to a normal sense of movement (Debacker, 2001; Debacker et al., 2003, 2004a). Although an older history cannot be ruled out, at the present-day erosion level, fault activity along the N-AFZ post-dates cleavage development, started prior to the Givetian angular unconformity and likely continued during and after deposition of the Givetian (Debacker, 2001; Debacker et al., 2003, 2004a; cf. Legrand, 1967).
45Faults belonging to the N-AFZ can be observed in outcrop in the Sennette outcrop area (map 39/1-2) (Debacker, 2001; Debacker et al., 2003, 2004a), locally in the Senne outcrop area (e.g. N-side of Quenast plug; Debacker & Sintubin, 2008; Debacker et al., 2011), at Bierghes (André & Deutsch, 1985) and probably also at Lessines. Faults of the N-AFZ have not been observed east of the Sennette valley, probably due to a lack of exposure (Debacker, 2001; Herbosch & Lemonne, 2000; Herbosch & Verniers, 2002). If active during and after the Givetian, the N-AFZ is expected to affect the Devonian to the SSE, in the southern Dyle-Thyle outcrop area.
46Within a zone about 3 km wide in the Sennette valley, between the Asquempont-Virginal area to the north and the Fauquez area to the south (map 39/5-6), numerous steeply dipping, post-cleavage normal faults occur (Debacker, 2001; Debacker et al., 2001, 2003, 2004a; Van Grootel et al., 2002; Verniers et al., 2005). Examples of these visible on the map (Fig. 9) are: S Fauquez Fault, N Fauquez Fault, Chateau Fault and the newly named Quenast fault (F7 of Debacker, 2001 and Debacker et al., 2004a). These faults are often characterised by a damage zone of brecciated rocks with deformed quartz and/or carbonate veins (Debacker, 2001; Debacker et al., 2003, 2004a). As shown by Dewaele et al. (2004), fault fluids are typically H2O-NaCl-KCl fluids. Hence, the combined use of mapping, wall rock deformation, fault throw, fault orientation and fluid chemistry allows a particular fault to be related to the N-AFZ. Several faults of the N-AFZ are present in the Senne valley close to Rebecq (map 39/1-2), where they affect the ADS and the Quenast plug (see Fig. 9; Debacker, 2001; Debacker & Sintubin, 2008; Debacker et al., 2011; cf. André & Deutsch, 1985). Also the presumed strike-slip shear zones of André & Deutsch (1985) at Bierghes are in fact steeply N-dipping normal faults, reactivating the pre-existing cleavage fabric. Further west, the N-AFZ passes through the Marcq area (map 38/3-4), where a low-angle reverse shear zone occurs hosting metallic mineralisations. Although the shear zone pre-dates, and is unrelated to the N-AFZ, the stratigraphic distribution within this poorly exposed outcrop area indicates important fault displacements that cannot be attributed to the reverse shear zone. In addition, fluid inclusion studies on veins from boreholes show fractured veins infilled by a H2O-NaCl-KCl fluid, typical of the N-AFZ (Dewaele et al., 2004).
4.4. Distribution of magmatic rocks
47Magmatic rocks occur mainly in the Upper Ordovician along the southern edge of the Cambrian core, in particular along the Nieuwpoort-Asquempont Fault Zone (Figs 1B, 9, 11). However, two thick and rather continuous levels of interbedded volcanic rocks are also observed in the lower Silurian (Figs 9, 10, 13) and in the Marcq outcrop area (Fig. 9, map 38/3-4), rhyolites occur of an unknown, possibly Tremadocian age (cf. Debacker, 1999).
4.4.1. Plutonic rocks
48The map shows three relatively large intrusive bodies (Fig. 9). These are from SE to NW the Quenast plug, the Bierghes sill and the Lessines sill:
49- The Quenast plug (Fig. 9, map 39/1-2) is an elliptical (1.8 x 1.2 km) and subvertical pipe that intrudes the rocks of Cambrian and Ordovician age. It is a quartz microdiorite intrusion giving a concordant age of 430 +/- 3 Ma (LA-ICP-MS on zircon; mid-Wenlockian; Linneman et al., 2012). This radiometric age suggests a pre-kinematic origin, compatible with the notion that the Quenast plug acted as a mega-porphyroclast during the Brabantian deformation event (Debacker & Sintubin, 2008). Interestingly, the plug shows up as a clear negative anomaly in the Bouguer gravity data (Fig. 6C), as well as in short-wavelength filters thereof (res1k, res5k, 1vd) (Fig. 6D).
50- The sill of Bierghes (Fig. 9, map 39/1-2) was zircon dated at 447.1 +/- 2.4 Ma (Shrimp dating, unpublished data), an age that corresponds to the uppermost Ordovician. It has a quartz diorite composition fairly similar to that of Quenast. The Bierghes intrusion is a tabular body of more than 300 m of thickness which dips 30° to the SW (André & Deutsch, 1985). Its known E-W extension is about 1.3 km but it seems to extend even farther towards the W (Herbosch et al., 2013). The sedimentary host rocks are unknown.
51- The Lessines sill (Fig. 9, maps 38/2, 38/3-4) was zircon dated at 445.3 +/- 2.1 Ma (Shrimp dating, unpublished data) which is the same Ordovician age as Bierghes. The Lessines sill is much larger, 4 km width and >10 km in length. Its extension is well constrained in the vicinity of Lessines, where many quarries have been excavated and boreholes drilled. Its western extension under the Cenozoic cover was deduced from an electric survey (Tavernier et al., 1967; Fig. 9) and some boreholes but its eastern extension under cover is less well known. The geometry of the sill is estimated from the fairly regular cooling joints and its concordance with the host sedimentary rocks. The sill dips ~20° to the south and has an estimated thickness of 850 m (Legrand & Mortelmans, 1948; Denaeyer & Mortelmans, 1954; André, 1983). The footwall of the intrusion is formed by the graptolitic black shale of the Fauquez Formation (Denaeyer & Mortelmans, 1954; Lecompte, 1950; Herbosch et al., 1991, 2008b). Its hangingwall is the Gouteux Member of the Brutia Formation (Legrand, 1965; Herbosch & Verniers, 2014, fig. 3). Given the similarity between the magmatic emplacement age (445 +/- 2 Ma) and the stratigraphic age of the enclosing formations (443 - 449 Ma), magma was emplaced in wet sediments. This is compatible also with the frequent presence of shale breccias (André, 1983, p. 24).
4.4.2. Volcanic rocks
52A 40–50 m thick volcanic unit of rhyolitic composition (Corin, 1965; Linneman et al., 2012), the upper Nivelles Member of the Brutia Formation, marks the base of the Silurian (upper Rhuddanian, Herbosch & Verniers, 2014, fig. 3). To the west it is observed around Nivelles (Fig. 9, maps 39/5-6, 39/7-8) and eastwards it continues below the Namur Basin, re-appears near Sombreffe and continues south of Gembloux (Fig. 10, map 47/1-2), adding up to an along-strike distance of about 40 km (Verniers et al., 2001; Herbosch & Verniers, 2014). In the west it is removed by the South Fauquez Fault and eastward it disappears under the Cenozoic cover just east of the Orneau valley (Fig. 13, CC’ section). It is not observed in the Mehaigne valley, and therefore its trace has not been extended eastward into the Mehaigne outcrop area. However, its presence cannot be ruled out, as outcrops of the uppermost Ordovician are almost nonexistent in the Mehaigne area (Fig. 10, maps 40/7-8, 41/5-6, undifferentiated Ordovician; Verniers, 1983; Pingot & Delcambre, 2006; Delcambre & Pingot, 2014).
53Another relatively thick and continuous volcanic unit is observed in the Mehaigne valley in the upper part of the Fallais Formation (Figs 10, 13; map 41/5-6) where it has been known as the Pitet Member (Verniers, 1983; Verniers et al., 2001; Delcambre & Pingot, 2014). This volcanic unit has a thickness of 25–30 m N of Fumal. It shows at the base a quite coarse and massive clear rock of rhyolitic composition (Flick, 1935) that grades into finer tuffs and finely bedded slates. This volcano-sedimentary deposit was interpreted as an ignimbritic flow that was remobilized as turbidite (Verniers, 1983, pers. comm. 2017). The volcanic unit was dated by microfossils as topmost Telychian (Verniers et al., 2001). It can be followed westward from the eastern edge of the map until about Burdinne (~13 km away). To the west (Fig. 10, map 40/7-8) the Pitet Member is currently no longer visible (Pingot & Delcambre, 2006) but Malaise (1892) mentioned two outcrops of volcanic rocks. Further west, in the Orneau valley (Fig. 10, map 47/1-2), a 4 m thick volcanic bed near the top of the Fallais Formation corresponds stratigraphically to the Pitet Member (Herbosch & Verniers, 2002; Delcambre & Pingot, 2008). Still further west, the Fallais Formation, well exposed near Monstreux (Fig. 9, map 39/5-6), shows a volcanic unit “the Monstreux porphyroid” that might still be the continuation of the Pitet Member (Verniers et al., 2002b, pers. comm. 2017). In the Sennette valley around Fauquez, the Fallais Formation is cut-off by the South Fauquez Fault. In conclusion, it seems that the volcanic level of Pitet is continuous from the easternmost outcrops of the Fallais Formation up to Monstreux, i.e. a distance of about 50 km away. Its thickness greatly decreases from E to W, which suggests that, if turbiditic, the volcanic centre and the turbiditic flow came from the east. On the map and section (Figs 10, 13) the Pitet volcanic layer has only been shown in the Mehaigne valley.
54The Madot Formation, defined in the Senne-Sennette outcrop area (Figs 9, 11; maps 39/1-2, 39/5-6), contains many volcanic rocks (volcano-sedimentary rocks, volcanic breccias with shale fragments, dacitic flows, tuffs, …) interstratified with coarse siltstone and mudstone rich in macrofossils (Verniers et al., 2005; Herbosch & Verniers, 2014). The rhyolitic tuffs from Hennuyères (Coeurq valley) at the top of the formation were zircon dated at 445 +/- 2 Ma and the dacite from the Bois des Rocs (Fauquez, Sennette valley) at 444 +/- 6 Ma (MC-ICPMS; Linnemann et al., 2012; Herbosch & Verniers, 2014). These ages are in excellent agreement with the upper Katian micropalaeontological ages (Mortier, 2014). In the Sennette valley, the volcanic units of the Madot Formation show a dramatic eastward decrease in thickness, which is compatible with the presence of a nearby eruption centre (see references in Verniers & Van Grootel, 1991; Verniers et al., 2005). In the Orneau valley, volcanic units of the Madot Formation are only mentioned in old literature and unlikely to be thick (Mathieu, 1905). However, to the west, in boreholes in the south of East and West Flanders (Lichtervelde 53W57 borehole), the Madot Formation is also associated with significant volcano-sedimentary units. As such, and also taking into account the zircon ages of the Bierghes and Lesinnes sills, it appears that during deposition of the Madot Formation, several eruption centres were active in the southwestern part of the Brabant Massif.
4.5. Regional-scale folds
55The dominant strike of the Ordovician and Silurian deposits in the Peripheral Brabant Domain changes across the mapped area from WNW in the west to NE in the east, thus displaying a large arc concave to the north. As first documented by Fourmarier (1914, 1921), and later in more detail by Sintubin (1997, 1999) and Debacker (2001, 2002), this arc shape, clearly visible on the new map (Figs 9, 10), is also reflected by the orientation of the fold hinge lines and to a lesser extent by the cleavage orientation. The orientation of transverse fractures also changes regionally in a similar fashion to the fold hinge lines (Debacker, 2001). The different amount of curvature displayed by the fold hinge line orientation and the cleavage orientation results in a predominantly anticlockwise cleavage transection in the west and a predominantly clockwise cleavage transection in the east (Sintubin, 1997, 1999). However, local variations in cleavage transection exist in virtually each outcrop area, due to local strain and stress deflections (e.g. Debacker, 1999; Debacker & Sintubin, 2008) and the common occurrence of periclinal folds (e.g. Debacker et al., 1999; Debacker, 2001, 2002). On a regional scale, the area with no expected cleavage transection (or rather with as much clockwise as anticlockwise transection) occurs between the Sennette valley and the Orneau valley (Fig. 10, E of map 39/7-8 and W of maps 40/5-6 and 47/1-2).
56Several of the larger folds can be mapped between different outcrop areas. In the Sennette valley, three hectometre to kilometre-scale folds occur with an important regional extent. These are from north to south the Asquempont Syncline (Debacker, 2001; Debacker et al., 2001), the Fauquez Anticline (Debacker, 2001; Verniers et al., 2005) and the Tête d’Aval Syncline in the inclined shiplift at Ronquières (Louwye et al., 1992; Debacker et al., 1999). Because of the large distance to the Orneau valley, and the Devonian cover (Fig. 10, maps 39/7-8, 47/1-2) it is difficult to trace these folds to the east. However, all three can be traced towards the WNW. As shown in Figure 9 the Tête d’Aval Syncline can be found also in the Senne valley to the north of Steenkerque, and probably extends further to the WNW. At Fauquez, the Fauquez Anticline is cut by faults belonging to the N-AFZ (Debacker, 2001; Verniers et al., 2005). Probably because of this the anticline was not recognised by Legrand (1967) and is not shown on map 39/5-6 (Hennebert & Eggermont, 2002). Herein we propose that the Fauquez Anticline corresponds to the large anticline in the Senne valley whose hinge runs just south of the Quenast plug (see fig. 7 in Debacker et al., 2011). Further to the WNW, in the Marcq valley, the Fauquez Anticline probably occurs just below the Marcq shear zone. This is based on the dominance of steep bedding to the south and below the shear zone and asymmetric S-type folds within and above the shear zone (see Debacker, 1999; Piessens et al., 2000, 2002). Although heavily affected by faults of the N-AFZ, we equate the Asquempont Synform to the main synform to the north of the Quenast plug. Further to the WNW its hinge is likely to be situated to the north of the Marcq outcrop area, in the vicinity of Herne.
57The distance between fold hinge lines is much larger to the west of the Senne valley than it is in the Sennette valley. This corresponds to an increase in fold wavelength and a decrease in fold amplitude and illustrates the fold attenuation towards the WNW mentioned earlier. Even though individual folds are difficult to trace across the eastern outcrop areas, a similar situation occurs going eastward from the Orneau valley to the Mehaigne valley (Debacker, 2002): folds increase in wavelength and decrease in amplitude towards the east. This suggests that the highest amount of regional shortening of the Peripheral Brabant Domain took place between the Sennette valley and the Orneau valley (Debacker, 2001, 2002). This area coincides with the inferred area of least regional cleavage transection, and also coincides with the most southern extent of the Central Brabant Domain (ignoring the Mousty embayment of the Dyle-Thyle outcrop area) (Sintubin, 1997, 1999; Debacker, 2001). This area also corresponds to the northernmost extent of the Devonian cover relative to the Cambrian core of the Brabant Massif.
5. Conclusions
58The joining of published geological maps, updated according to the most recent findings and insights, shows a coherent image of the southern, outcropping parts of the Brabant Massif. The resulting geological map much better illustrates the geological history and structural architecture of the Brabant Massif compared to previous maps (e.g. Fourmarier, 1921; Legrand, 1968) and allows for a better understanding of the geology of the Brabant Massif. In addition, it fully complements the subcrop map of the Brabant Massif of Piessens et al. (2005, in prep.).
59Partially following the terminology used previously on individual maps, the terms Central Brabant Domain and Peripheral Brabant Domain are introduced here. These two domains, lithostratigraphically defined, are separated by the Asquempont Detachment System. As hangingwall and footwall stratigraphy are expected to be different in the unexposed parts of the Brabant Massif, these two terms should only be used within those parts of the Brabant Massif presented here.
60The Asquempont Detachment System, a pre-cleavage low-angle normal fault system (see Debacker et al., 2003, 2004a, 2005b; Herbosch et al., 2008a) can now be traced with fairly high confidence across the entire outcrop area of the Brabant Massif. This could be achieved using outcrop data combined with borehole information and gravity and magnetic data. Only near Ramillies, does its trace across the central axis of the Brabant Massif remain uncertain.
61The Nieuwpoort-Asquempont Fault Zone, a zone of post-cleavage normal faults several kilometres wide, can be traced from the Sennette valley to the Marcq valley, but is not (yet?) observed to the east of the Sennette valley. Even though the vertical displacement on individual faults can be significant (often >500 m), the net amount of vertical displacement across the fault zone is relatively minor (Debacker et al., 2003, 2004a; cf. De Vos et al., 1993). Still, detailed mapping within the outcrop areas allows recognition of individual faults of the Nieuwpoort-Asquempont Fault Zone, at least between Asquempont-Fauquez in the east and the Marcq area in the west.
62The lithostratigraphic units can be traced at formation level, with a high level of confidence for ~90 km between the Senne valley in the west and the Mehaigne valley in the east. It is not possible to extend this correlation farther west because of the absence of outcrops in the Dendre valley.
63In the Upper Ordovician formations of the western part of the Peripheral Brabant Domain, important intrusive bodies occur (Quenast, Bierghes, Lessines; Fig. 9), in particular within and around the Nieuwpoort-Asquempont Fault Zone. The Upper Ordovician volcano-sedimentary Madot Formation contains many volcanic rocks, and locally shows strong thickness variations, suggesting the presence of unknown eruption centres (Figs 9, 11). Two thick and rather continuous levels of interbedded volcanic rocks (in the Brutia and Fallais formations) are observed in the lower Silurian of the central and eastern parts of the Peripheral Brabant Domain (Figs 9, 10, 13). New zircon dating and the present chronostratigraphical knowledge of the Brabant Massif show that the main igneous activity extends from 460 to 430 Ma with a peak of activity from 450 to 440 Ma (Fig. 4). The latter coincides with the stratigraphical age of the Madot and Brutia formations.
64Within the Peripheral Brabant Domain, large, hectometre to kilometre-scale folds can be traced across different outcrop areas. Going westwards from the Sennette valley, fold amplitude decreases and fold wavelength increases whilst folds attenuate towards the unexposed, unfolded Silurian in the subsurface of W-Flanders. Similarly, also fold amplitude decreases and fold wavelength increases going eastwards from the Orneau valley. As a result, the highest amount of regional shortening of the Peripheral Brabant Domain is expected between the Sennette valley and the Orneau valley (Debacker, 2001, 2002). This area coincides with the inferred area of no regional cleavage transection and with the most southern extent of the Central Brabant Domain (Sintubin, 1997, 1999; Debacker, 2001) and also corresponds to the area with the northernmost extent of the Devonian cover relative to the Cambrian core.
6. Acknowledgements
65The authors would like to thank J. Verniers and T. Pharaoh, for their constructive remarks and A. Anceau for her meticulous editorial work. We are very grateful to the authors of the about 20 geological maps that were used in this work. Without their patient field work and our numerous, sometimes lively discussions, the present work would not have been possible. These are in particular: S. Blockmans, S. Delaby, B. Delcambre,V. Dumoulin, M. Hennebert and J.L. Pingot. A.H. especially would like to thank Michel Hennebert, for kindly sharing his unpublished maps of Mainvault-Lessines and Bever-Enghien-Geraardsbergen, and for providing precious information regarding Silurian outcrops in the Senne and Dender outcrop areas, and outcrops of the Lessines sill. Similarly, A.H. is also particularly grateful to Bernard Delcambre, for authorising the use of the unpublished map of Andenne-Couthuin. We also would like to thank M. Vanguestaine, who left us too soon, and J. Verniers, for their patient micropalaeontological work, without which the detailed stratigraphical chart of the Brabant Massif would not exist. Many of the insights used in this work are a result of, or build upon insights gained during, research projects G.0274.99, G.0094.01 and G.0271.05 of the Research Foundation – Flanders, when T.D. was a Doctoral and Postdoctoral Fellow of the Research Foundation – Flanders (1997 – 2012). Finally, a warm thank you to Virginie Dumoulin and Sabine Blockmans, with whom A.H. formed a field team during more than 15 years.
7. References
66André, L., 1983. Origine et évolution des roches éruptives du Massif du Brabant (Belgique). Implications au niveau de l’étude des roches magmatiques transformées et de la géologie calédonienne du nord-ouest de l’Europe. Unpublished PhD thesis. Université Libre de Bruxelles, Belgium, 299 p.
67André, L. & Deutsch, S., 1985. Very low-grade metamorphic Sr isotopic resetting of magmatic rocks and minerals: Evidence for a late Givetian strike-slip division of the Brabant Massif, Belgium. Journal of the Geological Society, London, 142, 911–923. https://doi.org/10.1144/gsjgs.142.5.0911
68Anthoine, R. & Anthoine, P., 1943. Les assises de Mousty et de Villers-la-Ville du basin supérieur de la Dyle. Annales de la Société géologique de Belgique, 66, M53–M181.
69Belanger, I., Delaby, S., Delcambre, B., Ghysel, P., Hennebert, M., Laloux, M., Marion, J.-M., Mottequin, B. & Pingot, J.-L., 2012. Redéfinition des unités structurales du front varisque utilisées dans le cadre de la nouvelle Carte géologique de Wallonie (Belgique). Geologica Belgica, 15, 169–175.
70Blockmans, S. & Dumoulin, V., in press. Carte géologique de Wallonie : Duisbourg – Hamme-Mille 32/5-6. 1/25 000. Namur, Service Public de Wallonie, avec une notice explicative.
71Blockmans, S., Dumoulin, V. & Herbosch, A., in press. Carte géologique de Wallonie : Uccle – Tervuren 31/7-8 et Waterloo – La Hulpe 39/3-4. 1/25 000. Namur, Service Public de Wallonie, avec une notice explicative.
72Bultynck, P., Coen-Aubert, M., Dejonghe, L., Godefroid, J., Hance, L., Lacroix, D., Préat, A., Stainier, P., Steemans, P., Streel, M. & Tourneur, F., 1991. Les formations du Dévonien moyen de la Belgique. Mémoires pour servir à l'explication des Cartes Géologiques et Minières de la Belgique, 30, 1–106.
73Chacksfield, B.C., De Vos, W., D’Hooge, L., Dusar, M., Lee, M.K., Poitevin, C., Royles, C.P. & Verniers, J., 1993. A new look at Belgian aeromagnetic and gravity data through image-based display and integrated modelling techniques. Geological Magazine, 130, 583–591. https://doi.org/10.1017/S0016756800020884
74Chacksfield, B.C., Williamson, J.P., Pharaoh, T.C. & McEvoy, F.M., 2004. Reinterpretation of gravity anomalies over the Brabant Massif in southern Flanders (Belgium). British geological survey commissioned Report, CR/04/215, 47 p.
75Cocks, L.R.M. & Fortey, R.A., 2009. Avalonia: a long-lived terrane in the Lower Palaeozoic? In Basset, M.G. (ed.), Early Palaeozoic Peri- Gondwana Terranes: New Insights from Tectonics and Biogeography. Geological Society, London, Special Publications, 325, 141–155. https://doi.org/10.1144/SP325.7
76Cocks, L.R.M. & Torsvik, T.H., 2002. Earth geography from 500 to 400 million years ago: a faunal and palaeomagnetic review. Journal of the Geological Society, London, 159, 631–644. https://doi.org/10.1144/0016-764901-118
77Corin, F., 1965. Atlas des roches éruptives de Belgique. Mémoires explicatifs des cartes géologiques et minières de Belgique, 4, 190 p.
78Debacker, T.N., 1999. Folds trending at various angles to the transport direction in the Marcq area, Brabant Massif, Belgium. Geologica Belgica, 2, 159–172.
79Debacker, T.N., 2001. Palaeozoic deformation of the Brabant Massif within eastern Avalonia: how, when and why? Unpublished PhD thesis, Universiteit Gent, Belgium, 225 p.
80Debacker, T.N., 2002. Cleavage/fold relationship in the Silurian of the Mehaigne-Burdinale area, southeastern Brabant Massif, Belgium. Geologica Belgica, 5, 3–15.
81Debacker, T.N., 2012. Folds and cleavage/fold relationships in the Brabant Massif, southeastern Anglo-Brabant Deformation Belt. Geologica Belgica, 15, 81–95.
82Debacker, T.N. & Herbosch, A., 2011. Field guide to the pre-cleavage deformation and stratigraphy of the Jodoigne area. Memoirs of the Geological Survey of Belgium, 57, 1–27.
83Debacker, T.N. & Sintubin, M., 2008. The Quenast plug: a mega-porphyroclast during the Brabantian Orogeny (Senne Valley, Brabant Massif). Geologica Belgica, 11, 199–216.
84Debacker, T.N. & Vanmeirhaeghe, J., 2007. Pre-Devonian, Brabantian Deformation within the Southern Condroz Inlier (Ruisseau des Chevreuils, Dave, Belgium).Geologica Belgica, 10, 165–169.
85Debacker, T.N., Sintubin, M. & Verniers, J., 1999. Cleavage/fold relationships in the Silurian metapelites, southeastern Anglo-Brabant fold belt (Ronquières, Belgium). Geologie & Mijnbouw, 78, 47–56. https://doi.org/10.1023/A:1003726205971
86Debacker, T.N., Sintubin, M. & Verniers, J., 2001. Large-scale slumping deduced from structural and sedimentary features in the Lower Palaeozoic Anglo-Brabant fold belt, Belgium. Journal of the Geological Society, London,158, 341–352. https://doi.org/10.1144/jgs.158.2.341
87Debacker, T.N., Herbosch, A., Sintubin, M., & Verniers, J., 2003. Palaeozoic deformation history of the Asquempont-Virginal area (Brabant Massif, Belgium): large-scale slumping, low-angle extensional detachment development (the Asquempont fault redefined) and normal faulting (the Nieuwpoort-Asquempont fault zone). Memoirs of the Geological Survey of Belgium, 49, 1–30.
88Debacker, T.N., Herbosch, A., Verniers, J. & Sintubin, M., 2004a. Faults in the Asquempont area, southern Brabant Massif, Belgium. Netherlands Journal of Geosciences/Geologie en Mijnbouw, 83, 49–65. https://doi.org/10.1017/S0016774600020461
89Debacker, T.N., Sintubin, M. & Verniers, J., 2004b. Transitional geometries between gently plunging and steeply plunging folds: an example from the Lower Palaeozoic Brabant Massif, Anglo-Brabant deformation belt, Belgium. Journal of the Geological Society, London, 161, 641–652. https://doi.org/10.1144/0016-764903-143
90Debacker, T.N., Dewaele, S., Sintubin, M., Verniers, J., Muchez, Ph. & Boven, A., 2005a. Timing and duration of the progressive deformation of the Brabant Massif, Belgium. Geologica Belgica, 8, 20–34.
91Debacker, T.N., Herbosch, A. & Sintubin, M., 2005b. The supposed thrust fault in the Dyle-Thyle outcrop area (southern Brabant Massif, Belgium) re-interpreted as a folded low-angle extensional detachment. Geologica Belgica, 8, 53–69.
92Debacker, T.N., van Noorden, S., Sintubin, M., 2006. Distinguishing syn-cleavage folds from pre-cleavage folds to which cleavage is virtually axial planar: examples from the Cambian core of the Lower Palaeozoic Anglo-Brabant Deformation belt (Belgium). Journal of Stuctural Geology, 28, 1123–1138. https://doi.org/10.1016/j.jsg.2006.03.027
93Debacker, T.N., Sintubin, M., Robion, P., 2010. On the use of magnetic techniques for stratigraphic purposes: example from the Lower Palaeozoic Anglo-Brabant Deformation Belt (Belgium). Geologica Belgica, 13, 325–344.
94Debacker, T.N., Herbosch, A. & Verniers, J., 2011. The presumed Upper Ordovician green rocks at Rebecq reinterpreted as a resurfacing of the Cambrian Oisquercq Formation (Senne valley, Anglo-Brabant Deformation Belt, Belgium). Geologica Belgica, 14, 249–264.
95Delcambre, B., in press. Carte géologique de Wallonie : Andenne – Couthuin 48/1-2. 1/25 000. Namur, Service Public de Wallonie, avec une notice explicative.
96Delcambre, B., in press. Carte géologique de Wallonie : Jehai-Bodegnée – Saint-Georges 41/7-8. 1/25 000. Namur, Service Public de Wallonie, avec une notice explicative.
97Delcambre, B. & Pingot, J.-L., 2008. Carte géologique de Wallonie : Fleurus – Spy 47/1-2. 1/25 000. Namur, Service Public de Wallonie, avec une notice explicative de 96 p.
98Delcambre, B. & Pingot, J.-L., 2014. Carte géologique de Wallonie : Wasseiges – Braives 41/5-6. 1/25 000. Namur, Service Public de Wallonie, avec une notice explicative de 112 p.
99Delcambre, B. & Pingot, J.-L., 2015. Carte géologique de Wallonie : Namur – Champion 47/3-4. 1/25 000. Namur, Service Public de Wallonie, avec une notice explicative de 96 p.
100Delcambre, B. & Pingot, J.-L. avec la collaboration de Herbosch, A. pour le socle, 2002. Carte géologique de Wallonie : Chastre – Gembloux 40/5-6. 1/25 000. Namur, Ministère de la Région wallonne, Direction générale des ressources naturelles et de l’environnement, avec une notice explicative de 72 p.
101De Magnée, I. & Raynaud, J., 1944. Etude magnétique de la tectonique du Cambrien du Brabant à l’est de Court-St-Etienne. Annales de la Société Géologique de Belgique, 67, M495–M548.
102Denaeyer, M.E. & Mortelmans, G., 1954. Les roches éruptives. In Fourmarier, P. (ed.), Prodrome d’une description géologique de la Belgique. Liège, Vaillant Carmanne, 747–792.
103De Vos, W., Poot, B., Hus, J. & El Khayati, M., 1992. Geophysical characterization of lithologies from the Brabant Massif as a contribution to gravimetric and magnetic modelling. Bulletin de la Société belge de Géologie, 101, 173–180.
104De Vos, W., Verniers, J., Herbosch, A. & Vanguestaine, M., 1993. A new geological map of the Brabant Massif, Belgium. Geological Magazine, 130, 605–611. https://doi.org/10.1017/S0016756800020902
105Dewaele, S., Boven, A. & Muchez, Ph., 2002. 40Ar/39Ar dating of mesothermal, orogenic mineralization in a low-angle reverse shear zone in the Lower Palaeozoic of the Anglo-Brabant fold belt, Belgium. Transactions of the Institution of Mining and Metallurgy, B111, 215–220. https://doi.org/10.1179/037174502765188619
106Dewaele, S., Muchez, Ph. & Banks, D., 2004. Fluid evolution along multistage composite fault systems at the southern margin of the Lower Palaeozoic Anglo-Brabant fold belt. Geofluids, 4, 341–356. https://doi.org/10.1111/j.1468-8123.2004.00096.x
107Doremus, P. & Hennebert, M., 1995. Carte géologique de Wallonie : Lens – Soignies 39/7-8. 1/25 000. Namur, Ministère de la Région wallonne, Direction générale des ressources naturelles et de l’environnement, avec une notice explicative de 54 p.
108Everaerts, M., 2000. L’interprétation structurale de la Manche au Rhin apport du filtrage des champs potentiels. Unpublished PhD thesis. Université Catholique de Louvain, Belgium, 167 p.
109Everaerts, M., Poitevin, C., De Vos, W. & Sterpin, M., 1996. Integrated geophysical/geological modelling of the western Brabant Massif and structural implications. Bulletin de la Société belge de Géologie, 105, 41–59.
110Flick, L., 1935. Contribution à l’étude de la roche éruptive de la Méhaigne. Bulletin de la Société belge de Géologie, de Paléontologie et d’Hydrologie, 45, 104–115.
111Fourmarier, P., 1914. La poussée calédonienne dans le massif siluro-cambrien du Brabant. Annales de la Société Géologique de Belgique, 41, B300–B314.
112Fourmarier, P., 1921. La tectonique du Brabant et des régions voisines. Mémoires de l’Académie royale de la Belgique, Classe Sciences (2e sér.), 4, 1–95.
113Fourmarier, P., 1931. Les plissements calédoniens et les plissements hercyniens en Belgique. Annales de la Société Géologique de Belgique, 54, B364–B384.
114Gradstein, F.M., Ogg, J.G., Schmitz, M.D. & Ogg, G.M., 2012. The Geologic Time Scale 2012. Elsevier, Amsterdam, 2 vol., 1144 p.
115Hennebert, M. & Eggermont, B., 2002. Carte géologique de Wallonie : Braine-le-Comte – Feluy 39/5-6. 1/25 000. Namur, Ministère de la Région wallonne, Direction générale des ressources naturelles et de l’environnement, avec une notice explicative de 63 p.
116Hennebert, M. & Delaby, S., in press. Carte géologique de Wallonie : Mainvault – Lessines 38/1-2. 1/25 000. Namur, Service Public de Wallonie, avec une notice explicative.
117Hennebert, M. & Delaby, S., in press. Carte géologique de Wallonie : Bever – Enghien 38/3-4 et Geraardsbergen 30/7. 1/25 000. Namur, Service Public de Wallonie, avec une notice explicative.
118Herbosch, A. & Blockmans, S., 2012. Carte géologique de Wallonie : Wavre – Chaumont-Gistoux 40/1-2. 1/25 000. Namur, Service Public de Wallonie, avec une notice explicative de 66 p.
119Herbosch, A. & Lemonne, E., 2000. Carte géologique de Wallonie : Nivelles – Genappe 39/7-8. 1/25 000. Namur, Ministère de la Région wallonne, Direction générale des ressources naturelles et de l’environnement, avec une notice explicative de 59 p.
120Herbosch, A. & Verniers, J., 2002. The Lower Palaeozoic stratigraphy and sedimentology of the Brabant Massif in the Dyle and Orneau valleys and of the Condroz inlier at Fosses: an excursion guidebook. Geologica Belgica, 5, 71–143.
121Herbosch, A. & Verniers, J., 2013. Stratigraphy of the Lower Palaeozoic of the Brabant Massif, Belgium. Part I: The Cambro-Ordovician from the Halle and Ottignies groups. Geologica Belgica, 16, 49–65.
122Herbosch, A. & Verniers, J., 2014. Stratigraphy of the Lower Palaeozoic of the Brabant Massif, Belgium. Part II: The Middle Ordovician to lowest Silurian of the Rebecq Group. Geologica Belgica, 17, 115–136.
123Herbosch, A. & Verniers, J., 2015. Field guide to the geology of the Brabant Massif – The Outcrops of the Dyle and Senne basins. Memoirs of the Geological Survey of Belgium, 62, 140 p.
124Herbosch, A., Vanguestaine, M., Degardin, J.M., Dejonghe, L., Fagel, N. & Servais, T., 1991. Etude lithostratigraphique, biostratigraphique et sédimentologique du sondage de Lessines (Belgique). Annales de la Société Géologique de Belgique, 114, 195–212.
125Herbosch, A., Debacker, T.N. & Piessens, K., 2008a. The stratigraphic position of the Cambrian Jodoigne Formation redefined (Brabant Massif, Belgium). Geologica Belgica, 11, 133–150.
126Herbosch, A., Debacker, T.N. & Verniers, J., 2008b. Révision stratigraphique du sondage de Lessines (Massif du Brabant, Belgique). Geologica Belgica, 11, 167–174.
127Herbosch, A., Blockmans, S., Dumoulin, V. avec la collaboration de Debacker, T. pour la tectonique, 2013. Carte géologique de Wallonie : Rebecq – Ittre 39/1-2. 1/25 000. Namur, Service Public de Wallonie, avec une notice explicative de 114 p.
128Herbosch, A. & Debacker, T. pour le socle, Blockmans, S. & Dumoulin, V. pour la couverture, in press. Carte géologique de Wallonie : Jodoigne – Jauche 40/3-4. 1/25 000. Namur, Service Public de Wallonie, avec une notice explicative.
129Lecompte, M., 1950. L’Ordovicien de la carrière de la Dendre, à Lessines. Bulletin de la Société belge de Géologie, de Paléontologie et d’Hydrologie, 59, 47–52.
130Legrand, R., 1965. La zone à Cephalograptus? acuminatus au toit immédiat du porphyre de Lessines. Bulletin de la Société belge de Géologie, de Paléontologie et d’Hydrologie, 74, 113–114.
131Legrand, R., 1967. Ronquières, documents géologiques. Mémoires pour servir à l’Explication des Cartes géologiques et minières de la Belgique, 6, 1–60.
132Legrand, R., 1968. Le Massif du Brabant. Mémoires pour servir à l’Explication des Cartes géologiques et minières de la Belgique, 9, 1–148.
133Legrand, R. & Mortelmans, G., 1948. Un contact de la diorite quartzifère de Lessines et de l’Ordovicien. Bulletin de la Société belge de Géologie, de Paléontologie et d’Hydrologie, 57, 642–674.
134Linnemann, U., Herbosch, A., Liégeois, J.P., Pin, C., Gärtner, A. & Hofmann, M., 2012. The Cambrian to Devonian odyssey of the Brabant Massif within Avalonia: A review with new zircon ages, geochemistry, Sm-Nd isotopes, stratigraphy and palaeogeography. Earth-Science Reviews, 112, 126–154. https://doi.org/10.1016/j.earscirev.2012.02.007
135Louwye, S., Van Grootel, G. & Verniers, J., 1992. The stratigraphy of the type locality of the ?late Wenlock/early Ludlow Mont Godart Formation and the early Ludlow Ronquières Formation, Brabant Massif, Belgium. Annales de la Société Géologique de Belgique, 115, 307–331.
136Malaise, C., 1892. Sur les affleurements nouveaux de roches feldspathiques entre Fallais et Grand-Manil. Annales de la Société Géologique de Belgique, 19, B24–B25.
137Maletz, J. & Servais, T., 1998. Upper Ordovician graptolites from the Brabant Massif, Belgium. Geobios, 31, 21–37. https://doi.org/10.1016/S0016-6995(98)80093-4
138Mansy J.-L., Everaerts, M. & De Vos, W., 1999. Structural analysis of the adjacent Acadian and Variscan fold belts in Belgium and northern France from geophysical and geological evidence. Tectonophysics, 309, 99–116. https://doi.org/10.1016/S0040-1951(99)00134-1
139Mathieux, E., 1905. Les tuffoïdes kératophyriques de Grand-Manil. Bulletin de la Société belge de Géologie, 19, 499–525.
140Mortier, J., 2014. The evolution of the Upper Ordovician to Silurian basin in the Condroz Inlier and the Brabant Massif from a litho- and biostratigraphical point of view. Unpublished PhD thesis. Ghent University, Belgium, 350 p.
141NCS, 2017. National Commission for Stratigraphy Belgium, sub-Commission Lower Paleozoic. https://ncs.naturalsciences.be/lower-paleozoic, accessed 01/16/2018.
142Pharaoh, T.C., Molyneux, S.G., Merriman, R.J., Lee, M.K. & Verniers, J., 1993. The Caledonides of the Anglo-Brabant Massif reviewed. In Pharaoh, T.C., Molyneux, S.G., Merriman, R.J, Lee M.K. & Verniers J. (eds), Proceedings of the International Conference on the Caledonides of the Anglo-Brabant Massif (Nottingham, September 1992). Special Issue on the Caledonides of the Anglo-Brabant Massif. Geological Magazine, 130, 561–562. https://doi.org/10.1017/S0016756800020847
143Pharaoh, T.C., England, R.A. & Lee, M.K., 1995. The concealed Caledonide basement of Eastern England and the southern North Sea - a review. In Gee, D.G. & Beckholmen, M. (eds), The Trans-European Suture Zone: EUROPROBE in Liblice 1993. Studia Geophysica et Geodaetica, 39, 330–346. https://doi.org/10.1007/BF02295826
144Piessens, K., Muchez, Ph., Viaene, W., Boyce, A., De Vos, W. Sintubin, M. & Debacker, T., 2000. Alteration and fluid characteristics of a mineralised shear zone in the Lower Palaeozoic of the Anglo-Brabant belt, Belgium. Journal of Geochemical Exploration,69-70, 317–321. https://doi.org/10.1016/S0375-6742(00)00082-0
145Piessens, K., Muchez, Ph., Dewaele, S., Boyce, A., De Vos, W., Sintubin, M., Debacker, T.N., Burke, E.A.J. & Viaene, W., 2002. Fluid flow, alteration and polysulphide mineralisation associated with a low-angle reverse shear zone in the Lower Palaeozoic of the Anglo-Brabant fold belt, Belgium. Tectonophysics, 348, 73–92. https://doi.org/10.1016/S0040-1951(01)00250-5
146Piessens, K., De Vos, W., Beckers, R., Vancampenhout, P. & De Ceukelaire, M., 2005. Eindverslag Project VLA03-1.1: Opmaak van de pre-Krijt subcropkaart van het Massief van Brabant voor invoering in de Databank Ondergrond Vlaanderen. Unpublished report for Ministerie van de Vlaamse Gemeenschap, Afdeling Natuurlijke Rijkdommen en Energie, 90 p.
147Piessens, K., Debacker, T.N., Beckers, R., De Vos, W., Sintubin, M., Vancampenhout, P. & Verniers, J., in prep. The new subcrop map of the Lower Palaeozoic Brabant Massif (Belgium).
148Pingot, J.-L., in press. Carte géologique de Wallonie : Meldert – Tienen 32/7-8. 1/25 000. Namur, Service Public de Wallonie, avec une notice explicative.
149Pingot J.-L. & Delcambre B., 2006. Carte géologique de Wallonie : Perwez – Eghezée 40/7-8. 1/25 000. Namur, Ministère de la Région wallonne, Direction générale des ressources naturelles et de l’environnement, avec une notice explicative de 71 p.
150Piper, J.D.A., 1997. Tectonic rotation within the British paratectonic Caledonides and Early Palaeozoic location of the orogen. Journal of the Geological Society, London, 154, 9–13. https://doi.org/10.1144/gsjgs.154.1.0009
151Sintubin, M., 1997. Cleavage-fold relationships in the Lower Paleozoic Brabant Massif (Belgium). Aardkundige Mededelingen, 8, 161–164.
152Sintubin, M., 1999. Arcuate fold and cleavage patterns in the southeastern part of the Anglo-Brabant Fold Belt (Belgium): tectonic implications. Tectonophysics, 309, 81–97. https://doi.org/10.1016/S0040-1951(99)00133-X
153Sintubin, M. & Everaerts, M., 2002. A compressional wedge model for the Lower Palaeozoic Anglo-Brabant Belt (Belgium) based on potential field data. In Winchester, J., Verniers, J. & Pharaoh, T. (eds), Palaeozoic Amalgamation of Central Europe. Geological Society, London, Special Publications, 201, 327–343. https://doi.org/10.1144/GSL.SP.2002.201.01.16
154Sintubin, M., Brodkom, F. & Laduron, D., 1998. Cleavage-fold relationships in the Lower Cambrian Tubize Group, southeast Anglo-Brabant Fold Belt (Lembeek, Belgium). Geological Magazine, 135, 217–226.
155Sintubin, M., Debacker, T.N. & Van Baelen, H., 2009. Early Palaeozoic orogenic events north of the Rheic suture (Brabant, Ardenne): A review. Comptes Rendus Geoscience, 341, 156–173. https://doi.org/10.1016/j.crte.2008.11.012
156Steemans, Ph., 1989. Paléogéographie de l'Eodévonien ardennais et des régions limitrophes. Annales de la Société Géologique de Belgique, 112, 103–119.
157Sterpin, M. & De Vos, W., 1996. Onderzoek naar metallische mineralisaties in de Paleozoïsche sokkel van Vlaanderen. Unpublished BNRE-Eindrapport, Project VLA/94-3.5., 47 p.
158Tavernier, R., De Breuk, W. & De Moor G., 1967. Geo-electrish onderzoek in de streek van Lessines. Mededelingen van de Koninklijke Academie voor Wetenschapen, Letteren en Schone Kunsten. Klasse Wetenschapen, 11, 1–64.
159Van Grootel, G., 1990. Litho- and biostratigraphische studie met Chitinozoa van het westelijk deel van het Massief van Brabant. Unpublished PhD thesis. Ghent University, Belgium, deel 1: 90 p, deel 2: 108 p.
160Van Grootel, G., Verniers, J., Geerkens, B., Laduron, D., Verhaeren, M., Hertogen, J. & De Vos, W., 1997. Timing of magmatism, foreland basin development, metamorphism and inversion in the Anglo-Brabant fold belt. Geological Magazine, 134, 607–616.
161Van Grootel, G., Verniers, J. & Debacker, T.N., 2002. Overview of the Upper Ordovician in the Fauquez area (Brabant Massif, Belgium), lithostratigraphy, biostratigraphy, geological map and structures. Aardkundige Mededelingen, 12, 77–79.
162Vanguestaine, M., 1992. Biostratigraphie par acritarches du Cambro-Ordovicien de Belgique et des régions limitrophes: synthèses et perspectives d’avenir. Annales de la Société Géologique de Belgique, 115, 1–18.
163Vanmeirhaeghe, J., 2006. The evolution of the Condroz-Brabant Basin from the Middle Ordovician to Llandovery: lithostratigraphical and chitinozoan biostratigraphical approach. Unpublished PhD thesis. Dept. Geology & Soil Sciences, Ghent University, Belgium, 261 p.
164Verniers, J., 1983. The Silurian of the Mehaigne area (Brabant Massif, Belgium), lithostratigraphy and features of the sedimentary basin. Professional Paper of the Geological Survey of Belgium, 203, 1–117.
165Verniers, J. & Van Grootel, G., 1991. Review of the Silurian in the Brabant Massif, Belgium. Annales de la Société Géologique de Belgique, 114, 163–193.
166Verniers, J., Herbosch, A., Vanguestaine, M., Geukens, F., Delcambre, B., Pingot, J.-L., Belanger, I., Hennebert, M., Debacker, T.N., Sintubin, M. & De Vos, W., 2001. Cambrian-Ordovician-Silurian lithostratigraphic units (Belgium). In Bultynck, P. & Dejonghe, L. (eds), Guide to a revised lithostratigraphic scale of Belgium. Geologica Belgica, 4, 5–38.
167Verniers, J., Pharaoh, T., André, L., Debacker, T.N., De Vos, W., Everaerts, M., Herbosch, A., Samuelsson, J., Sintubin, M. & Vecoli, M., 2002a. The Cambrian to mid Devonian basin development and deformation history of Eastern Avalonia, east of the Midlands Microcraton: new data and a review. In Winchester, J., Verniers, J. & Pharaoh, T. (eds), Palaeozoic Amalgamation of Central Europe. Geological Society, London, Special Publications, 201, 47–93. https://doi.org/10.1144/GSL.SP.2002.201.01.04
168Verniers, J., Van Grootel, G., Louwye, S. & Diependaele B., 2002b. The chitinozoan biostratigraphy of the Silurian of the Ronquières-Monstreux area (Brabant Massif, Belgium). Review of Palaeobotany and Palynology, 118, 287–322. https://doi.org/10.1016/S0034-6667(01)00120-8
169Verniers, J., Van Grootel, G. & Debacker, T.N., 2005. The Upper Ordovician lithostratigraphy and structure of the Fauquez area (Brabant Massif, Belgium). Geologica Belgica, 8, 160–175.
170Wang, W. & Servais, T., 2015. A re-investigation of the Rhabdinopora flabelliformis fauna from the Early Tramadocian “Dictyonema shale” in Belgium. Geologica Belgica, 18, 66–77.
171Winchester, J.A. & PACE TMR Network Team, 2002. Palaeozoic amalgamation of Central Europe: new results from recent geological and geophysical investigations. Tectonophysics 360, 5–21. https://doi.org/10.1016/S0040-1951(02)00344-X
172Woodcock, N.H., Soper, N.J. & Strachan, R.A., 2007. A Rheic cause for the Acadian deformation in Europe. Journal of the Geological Society, London, 164, 1023–1036. https://doi.org/10.1144/0016-76492006-129
173Manuscript received 05.10.2017, accepted in revised form 10.02.2018, available on line 26.04.2018.
174Figures 9 and 10 in tif file format are available online as supplementary material (see https://doi.org/10.20341/gb.2018.003).
175Annex 1. Inventory of geological maps, of which the outlines are shown in Fig. 2, with map name, author name and publication year. Map references are included in the reference list.

