


- Accueil
- Volume 23 (2020)
- number 1-2
- Stratigraphical reinterpretation of Devonian strata underlying the Mons Basin based on cuttings from the Saint-Ghislain borehole, Hainaut, Belgium


Visualisation(s): 2789 (22 ULiège)
Téléchargement(s): 374 (11 ULiège)

Stratigraphical reinterpretation of Devonian strata underlying the Mons Basin based on cuttings from the Saint-Ghislain borehole, Hainaut, Belgium

Abstract
It is revealed that the lowest 1010 m of the Saint-Ghislain borehole (-4393 to -5403 m), of which cuttings are available, constitutes a crucial source of information to investigate, amongst others, the deep geothermal potential within the Brabant Parautochthon, underlying the Mons Basin, Hainaut. The lithological succession of this interval was reconstructed based mainly on visual analysis and calcimetry of 852 cutting samples as well as four cored sections. Additionally, palynological, magnetic susceptibility and X-ray diffraction analyses were conducted in order to complement the dataset. The lower section of the investigated borehole sequence mainly consists of grey calcareous shale while the middle section is dominated by blue-grey shaly limestone and the upper section is mainly composed of green shale. Palynomorphs found at -5261 m suggest a latest Givetian–Early Frasnian age. A new lithostratigraphical interpretation of the deepest part of the Saint-Ghislain borehole is proposed. The lower calcareous shale from ‑5403 to ‑5100 m is interpreted as the Bovesse Formation (Lower Frasnian) and at its base possibly uppermost Givetian. The overlying limestones from -5100 to -4790 m can be attributed to the Rhisnes Formation (Upper Frasnian), and the green shale between ca. -4393 and -4790 m, to the Bois de la Rocq Member (Famennian). These results open new insights regarding the geological interpretation of the basement underlying the Mons Basin. They also present a promising approach and example regarding interpretations based on cuttings.
Table des matières
1. Introduction and objectives
1Evaporitic formations have been observed in Givetian strata in Annappes, Tournai and Leuze deep boreholes, located on the northern border of the Brabant Parautochthon (Coen-Aubert et al., 1980) (Fig. 1). Delmer already formulated in 1972 the hypothesis that important volumes of evaporites, including halite, could be present in the deep basement of the Mons Basin. The dissolution of these evaporites could explain the peculiarities of the Upper Carboniferous and Meso-Cenozoic deposits in the Mons Basin.
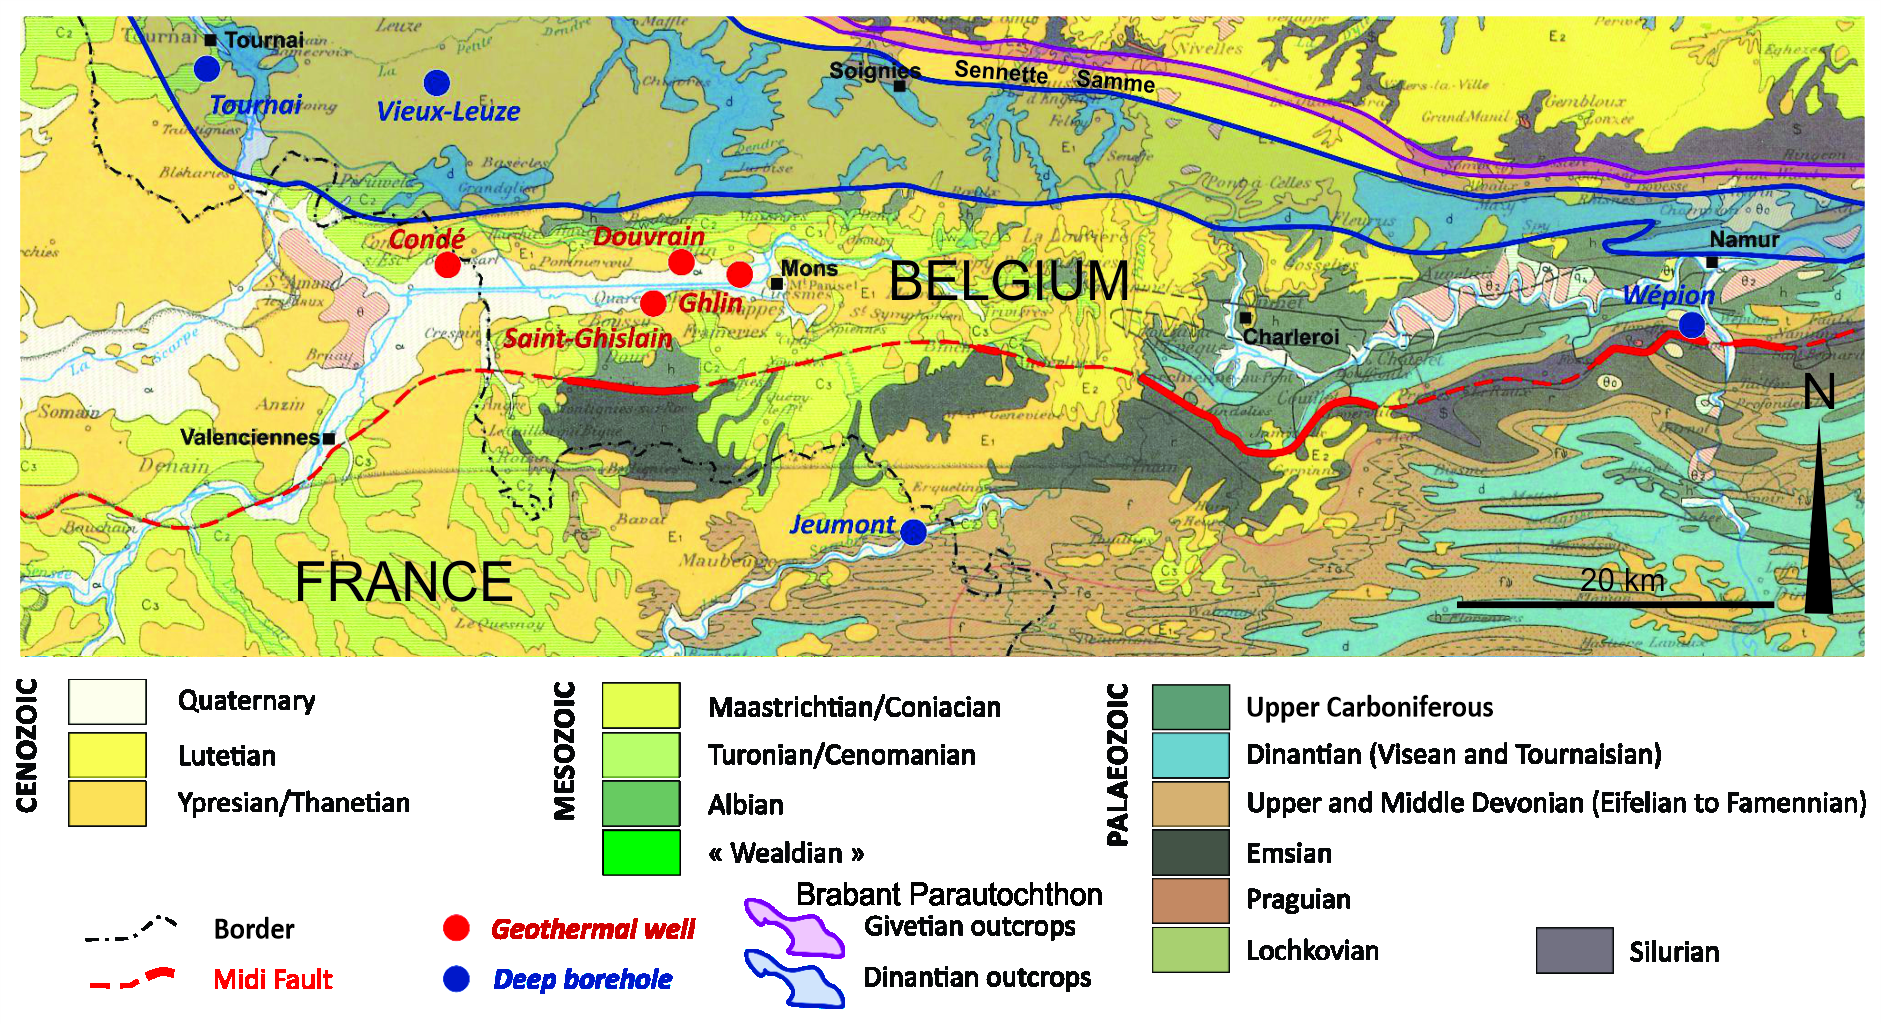
Figure 1 General geological map with location of Saint-Ghislain and other deep boreholes, and indication of the Givetian and Dinantian outcrops in the Brabant Parautochthon (modified after de Béthune, 1961). Note that the Condé, Douvrain and Ghlin boreholes have not reached the Devonian units. The Annappes (FR) borehole is located 16 km WNW from Tournai city.
2The main objective of the Saint-Ghislain borehole, drilled between 1972 and 1976, was to test this hypothesis. During the drilling, a total of several hundred metres of anhydrite (CaSO4) was recovered not from the Devonian, as expected, but from the Lower Carboniferous. Preserved anhydrite layers are located in Middle and Upper Visean limestones, between -1950 and -2750 m, representing about 50% of the series within this section (Dejonghe et al., 1976; Delmer, 1977; Groessens et al., 1979; de Magnée et al., 1986). This was the first direct evidence of the presence of evaporites in the French-Belgian Carboniferous carbonate formations. This discovery shed new light on the causes of brecciation in the “Grande brêche viséenne”, outcropping in the Ardenne allochton, and whose origin is now explained as related to the dissolution of such evaporites (Delmer, 1977; Groessens et al., 1979; Bless et al., 1980; De Putter & Herbosch, 1990; Muchez et al., 1994; De Putter, 1995).
3Just below the thick Visean anhydrite beds in the Saint-Ghislain borehole, important inflows of hot (73 °C), sulphate-rich water were observed in the brecciated limestone, between -2400 and -2650 m (Delmer, 1977; Legrand, 1978a; Blommaert et al., 1983). Both the temperature and the flow rate make this geothermal aquifer suitable for district heating applications. The Saint-Ghislain borehole was the first location in the Mons city region (south-west Belgium) where geothermal energy started to be exploited. During the following years, two additional boreholes were drilled with the objective to explore the geothermal reservoir. Relatively similar hot water inflows were observed in the Douvrain borehole at -1350 m (twater = 66 °C; Leclercq, 1980) and in the Ghlin borehole at -1550 m (twater = 71 °C; Delmer et al., 1982). Later on, for about 30 years, only limited research has been performed about geothermal resources in this part of Belgium. Recently, however, the deep geothermal potential in the Hainaut area received renewed attention in a context of growing societal interest for renewable energies. Recent studies (Licour, 2010, 2012, 2014; Licour et al., 2011; Rorive & Licour, 2012, 2014) provided new insights on the characterization of the Carboniferous limestone reservoir, including the probable occurrence of thermal convection cells, and their importance to explain the spatial distribution of subsurface temperatures.
4Below the Visean units, the Saint-Ghislain borehole encountered Tournaisian strata, from -3627 to -4394 m, and Devonian strata, from -4394 to -5403 m (maximum depth of the borehole), but no evidence of evaporite was observed in these formations.
5While the Carboniferous formations of the Saint-Ghislain borehole were studied in great detail (Groessens et al., 1979; Delmer, 1988; Laumondais et al., 1984; Pierre et al., 1984; Rouchy, 1986; Rouchy et al., 1984, 1986, 1987, 1993; De Putter et al., 1991, 1994), very little attention was paid to the underlying Devonian units in the lowest 19% of the borehole. This can partly be explained by the fact that Carboniferous units were almost entirely cored, providing high quality samples, as well as geophysical borehole logs. For the Devonian, a total of only 22 metres was cored in four sections with a length of 5 to 6 m each, and no log data were recorded. However, cuttings were collected every metre. Legrand (1978b) did a preliminary interpretation, mainly based on the cored sections, but the cutting samples were never studied.
6In the specific context of geothermal exploration, this study addresses the potential existence of geothermal reservoirs in the basement underlying the already known Visean reservoir. Frasnian and Givetian limestones, if present, could be of particular interest as they could host exploitable water with a temperature above 150 °C, which would open new perspectives in geothermal power production (e.g. electricity generation) in the Hainaut area.
7The objectives of this study are: (1) to report on a detailed study of the available cutting samples collected between -4393 and -5403 m; (2) to identify the different Devonian lithologies, (3) attempt to date them based on microfossils; and (4) place them into the regional-scale litho-stratigraphical framework.
2. Material and methods
2.1. The Saint-Ghislain borehole and available samples
8The Saint-Ghislain borehole (Belgian Lambert 1972: X = 111623 m; Y = 126268 m) was drilled to a maximum depth of 5403 m (Fig. 2). In 2018, cutting and cores were stored by the Geological Survey of Belgium in their buildings in Brussels and in the lithographical collection centre in Péronnes. The interval 0 to -123 m contains Cenozoic and Mesozoic deposits. The interval -123 to -4394 m corresponds to a Carboniferous sequence (Legrand, 1978a; Groessens et al., 1979) and below -4394 m Devonian formations are observed. Dinantian (Lower Carboniferous) limestone, extending from -1760 to -4394 m, constitutes the geothermal reservoir, with the most productive horizon consisting of a limestone breccia between -2525 and -2640 m (Figs 2 and 3).
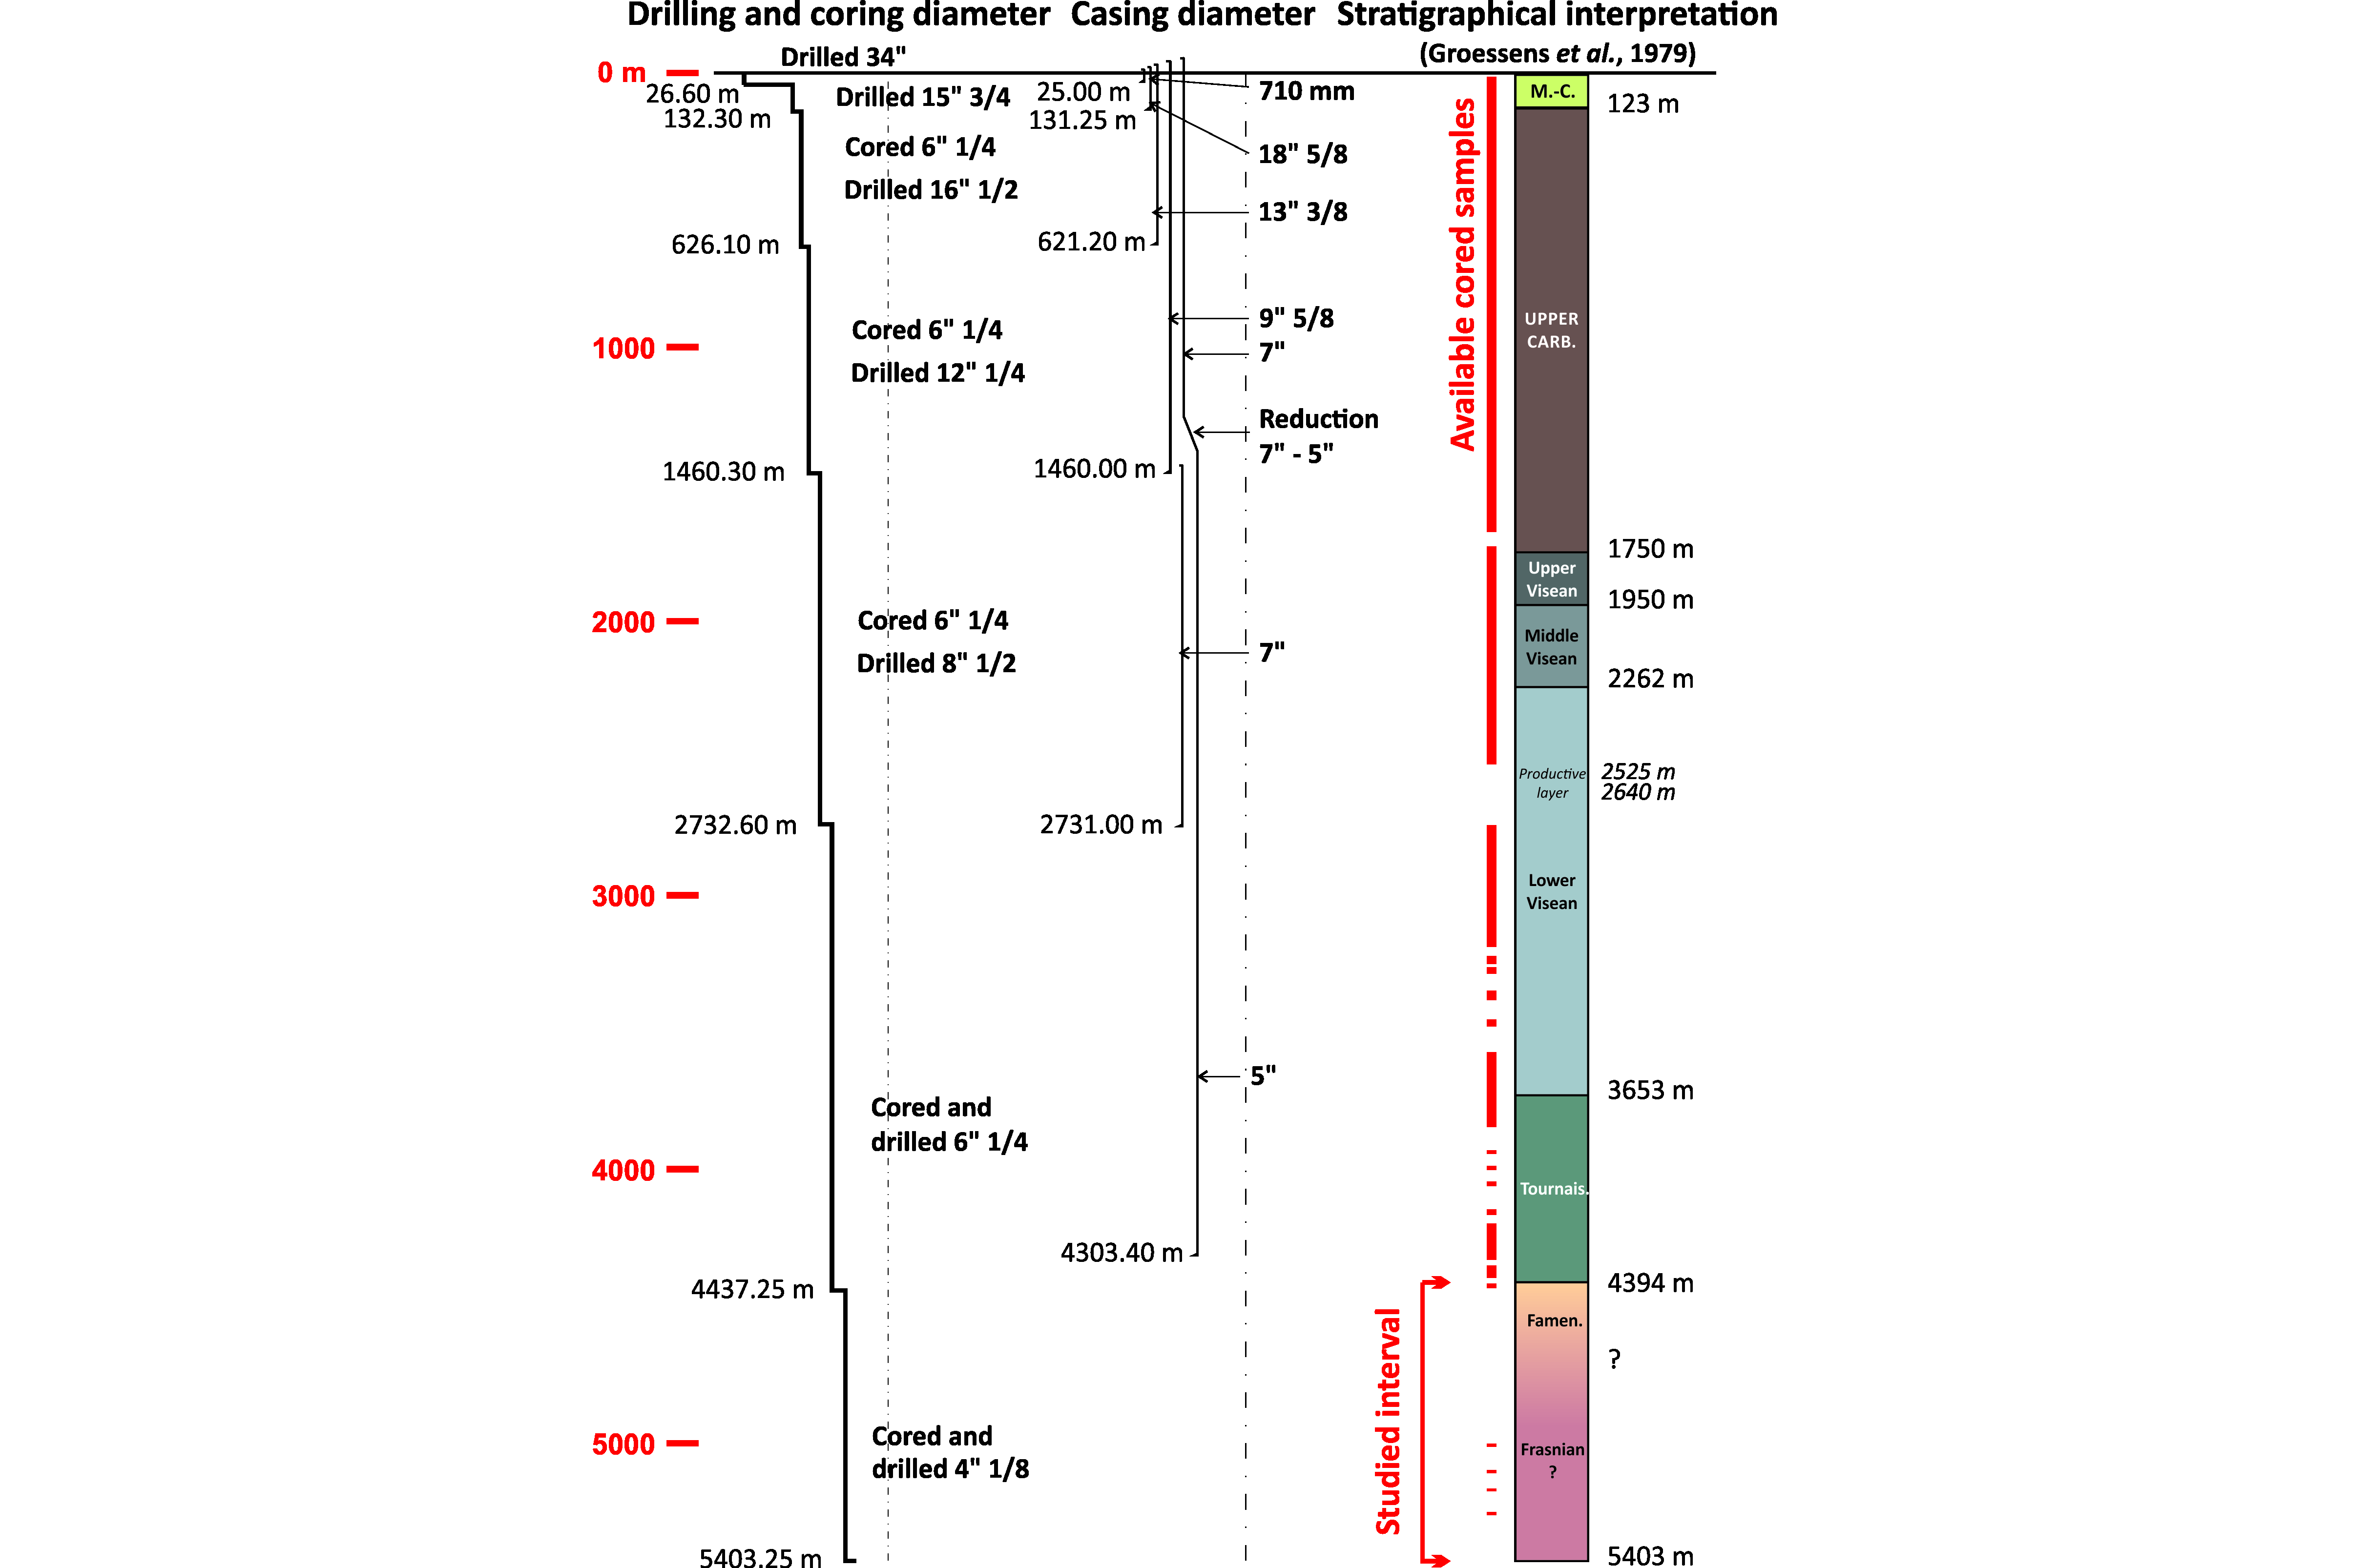
Figure 2. Technical and simplified geological log of the Saint-Ghislain borehole (based on drilling archives and Groessens et al., 1979).
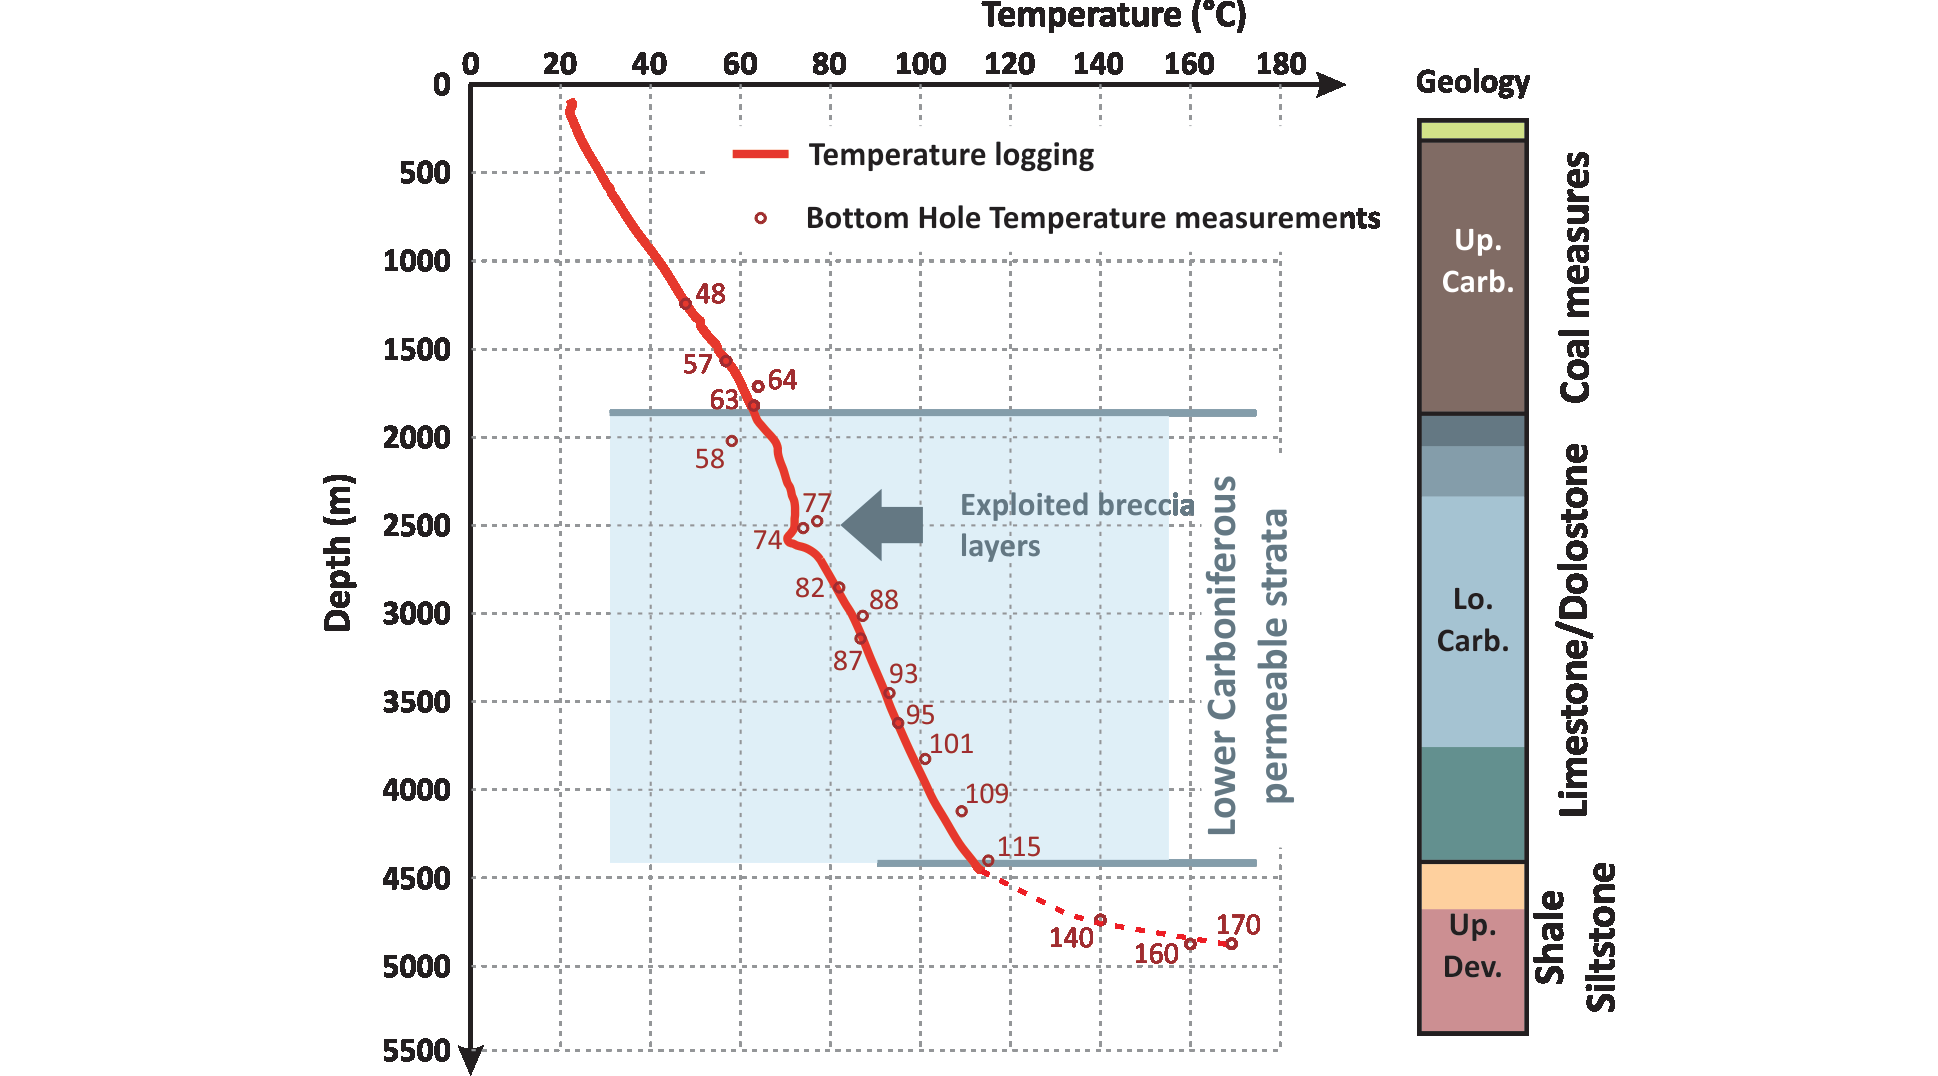
Figure 3. Temperature data in the Saint-Ghislain borehole (modified from Licour, 2012).
9Most of the Saint-Ghislain borehole has been cored, mainly in the highest 4000 m interval. A total of 3615 m core samples have been collected between the ground surface and -4420 m (about 67% of this interval). Between -4420 and -5403 m, only four core samples have been recovered (-4998.75 to -5006.45 m, -5097.55 to -5102.55 m, -5171.60 to -5176.90 m and -5227.50 to -5261.50 m), a total of only 22 m of the 1017 m deepest part of the borehole. A preliminary description of the core samples was given by Legrand (1978b). The only information that allowed a possible stratigraphic attribution, according to Legrand (1978b), was a similarity noticed at -5258 m with the Frasnian of the Tournai and Vieux-Leuze boreholes in terms of facies and macrofauna.
10Besides the above mentioned four cored intervals, cutting samples have been collected nearly every metre, from -4393 to -5403 m. Cutting samples are missing for some intervals, because the quantity of recovered material was not sufficient to constitute a single sample. Samples are also missing between -4546 and -4622 m (78 m). This results in a collection of 852 cutting samples ranging from less than 1 to 140 g in weight (50% of the samples weigh less than 15 g). For the first time we provide a detailed description and interpretation of these samples.
2.2. Methods
11Different methods have been used in this study: visual lithological analysis, magnetic susceptibility, X-ray diffraction and palynology. Gamma-ray spectroscopy was carried out but was not successful because the individual mass of most cutting samples is very low and no useable signal could be recorded.
2.2.1. Visual lithological analysis
12Each cutting sample was spread out in a laboratory watch glass and examined using a stereomicroscope applying uniform observation conditions for all samples. For each sample, a surface area of 10 to 15 cm2 was visually analysed. As the grain size generally lies in the millimetre range, thousands of grains were inspected over the observed area. Cutting grains, which all represent fine-grained rock pieces, have been classified into different lithological types based on their colour and reactivity to hydrochloric acid. The relative abundance of the different lithological types in each cutting sample was then estimated using the Bacelle & Bosellini (1965) charts.
2.2.2. Magnetic susceptibility (MS)
13The magnetic susceptibility of the cutting samples has been measured using a KLY-3S Kappabridge device. The magnetic susceptibility was measured in one sample every four metres (ca. 200 samples in total). For each sample, the measurement was repeated three times, and a mean value was calculated. Several reference samples were measured regularly and repeatedly to correct for potential instrumental drift.
2.2.3. X-ray diffraction
14X-ray powder diffraction was used to determine the mineral composition of the cuttings. Sixteen samples were subjected to semi-quantitative XRD analysis for comparison with the visual analysis. These 16 samples were selected to cover the dominant lithologies as determined by macroscopic visual lithological observations under a low magnification binocular microscope of the cuttings. Contaminants originating from drilling operation were handpicked and removed before analysis. The cleaned samples were ground down to 50 µm with 20 wt.% corundum as an internal reference and X-rayed with a Brucker-Siemens D5000 diffractometer operating at 40 kV and 30 mA. The XRD spectra (three replicates per sample) were normalized to the main peak of corundum in order to minimize the influence of powder compacity on peak intensity. Semi-quantitative analysis according to the method proposed by Brouard (1991) was then performed based on intensity measurement of the strongest peak of the detected minerals: i.e. clays (which also includes micas), quartz, calcite, dolomite, ankerite and pyrite.
15Calcimetric data from drilling archives (Foraky, 1979) were also used to corroborate with both XRD and visual analysis. Unfortunately, no information was found about the operators, method and material used for these analyses. In addition, the sampling density is very heterogeneous, all the cutting samples being collected from only two intervals (from -4900 to -5000 m and from -5340 to -5400 m). Additional calcimetric data from only three core samples outside these intervals are available.
2.2.4. Palynomorphs
16The palynological content of three cuttings and four core samples has been analysed with the objective of collecting biostratigraphical information. The cutting samples, selected based on their high shale content, correspond to depths -4779 m, -5103 m and -5323 m, and core samples were taken at -4999.5 m, -5102 m, -5174 m and -5261.2 m.
17All samples were processed according to standard palynological laboratory methods (Streel, 1965). Each sample was crushed and 10–25 g was demineralized in 10% HCl and 40% HF. The residue of the most thermally mature samples was oxidized in 65% HNO3 and KClO3 (Schultze solution) and sieved through a 10 µm mesh. Subsequently, a hot bath in 25% HCl eliminated the remaining fine neoformed fluoride-bearing particles. The residue was sieved through a 10 µm mesh and mounted on palynological slides using Euparal or Eukit resin. One to four slides were made for each productive sample.
3. Results
3.1. Lithology
18The lithological reconstruction of the studied interval was based on three methods. Firstly the visual analysis provided a first description of the cutting samples and an estimation of their lithological composition (herein called “facies”). Secondly, XRD analysis allowed the identification of the different minerals and the validation of the lithological composition obtained by visual analysis. Thirdly, the magnetic susceptibility signature supported the lithological interpretation. The results of the three types of analysis are successively given below.
19Working exclusively with cuttings introduces some uncertainty inherent to the nature and the collection method of the samples, which are composed of small rock chips that can be contaminated and/or intermixed to variable degrees. Hence, the interpretation of our results should be more robust for thick units than for thin ones. For this reason, only the general trends are taken into account in this study, not the detailed variations.
3.1.1. Visual analysis
20The different lithologies composing the cuttings were identified by combining visual analysis (colour and morphology) and HCl reactivity testing of the grains (Fig. 4). Four different lithologies have been determined:
-
Shale (not HCl-reactive), green to greenish grey, with flattened grains (‘Green shale and silt’ in Fig. 5);
-
Limestone (HCl-reactive), dark grey (‘Blue-grey carbonate’ in Fig. 5);
-
Shale, variably dolomitic/ankeritic (not HCl-reactive), dark grey (‘Grey shale’ in Fig. 5).
-
Grains of a fourth conspicuous, red-coloured lithology were observed but predominantly as an accessory component. The grains are composed of a reddish-brown material containing abundant iron oxides (goethite/hematite). They are more frequent in the uppermost 200 m (-4393 to -4593 m) of the studied section of the borehole (’Reddish’ in Fig. 5).
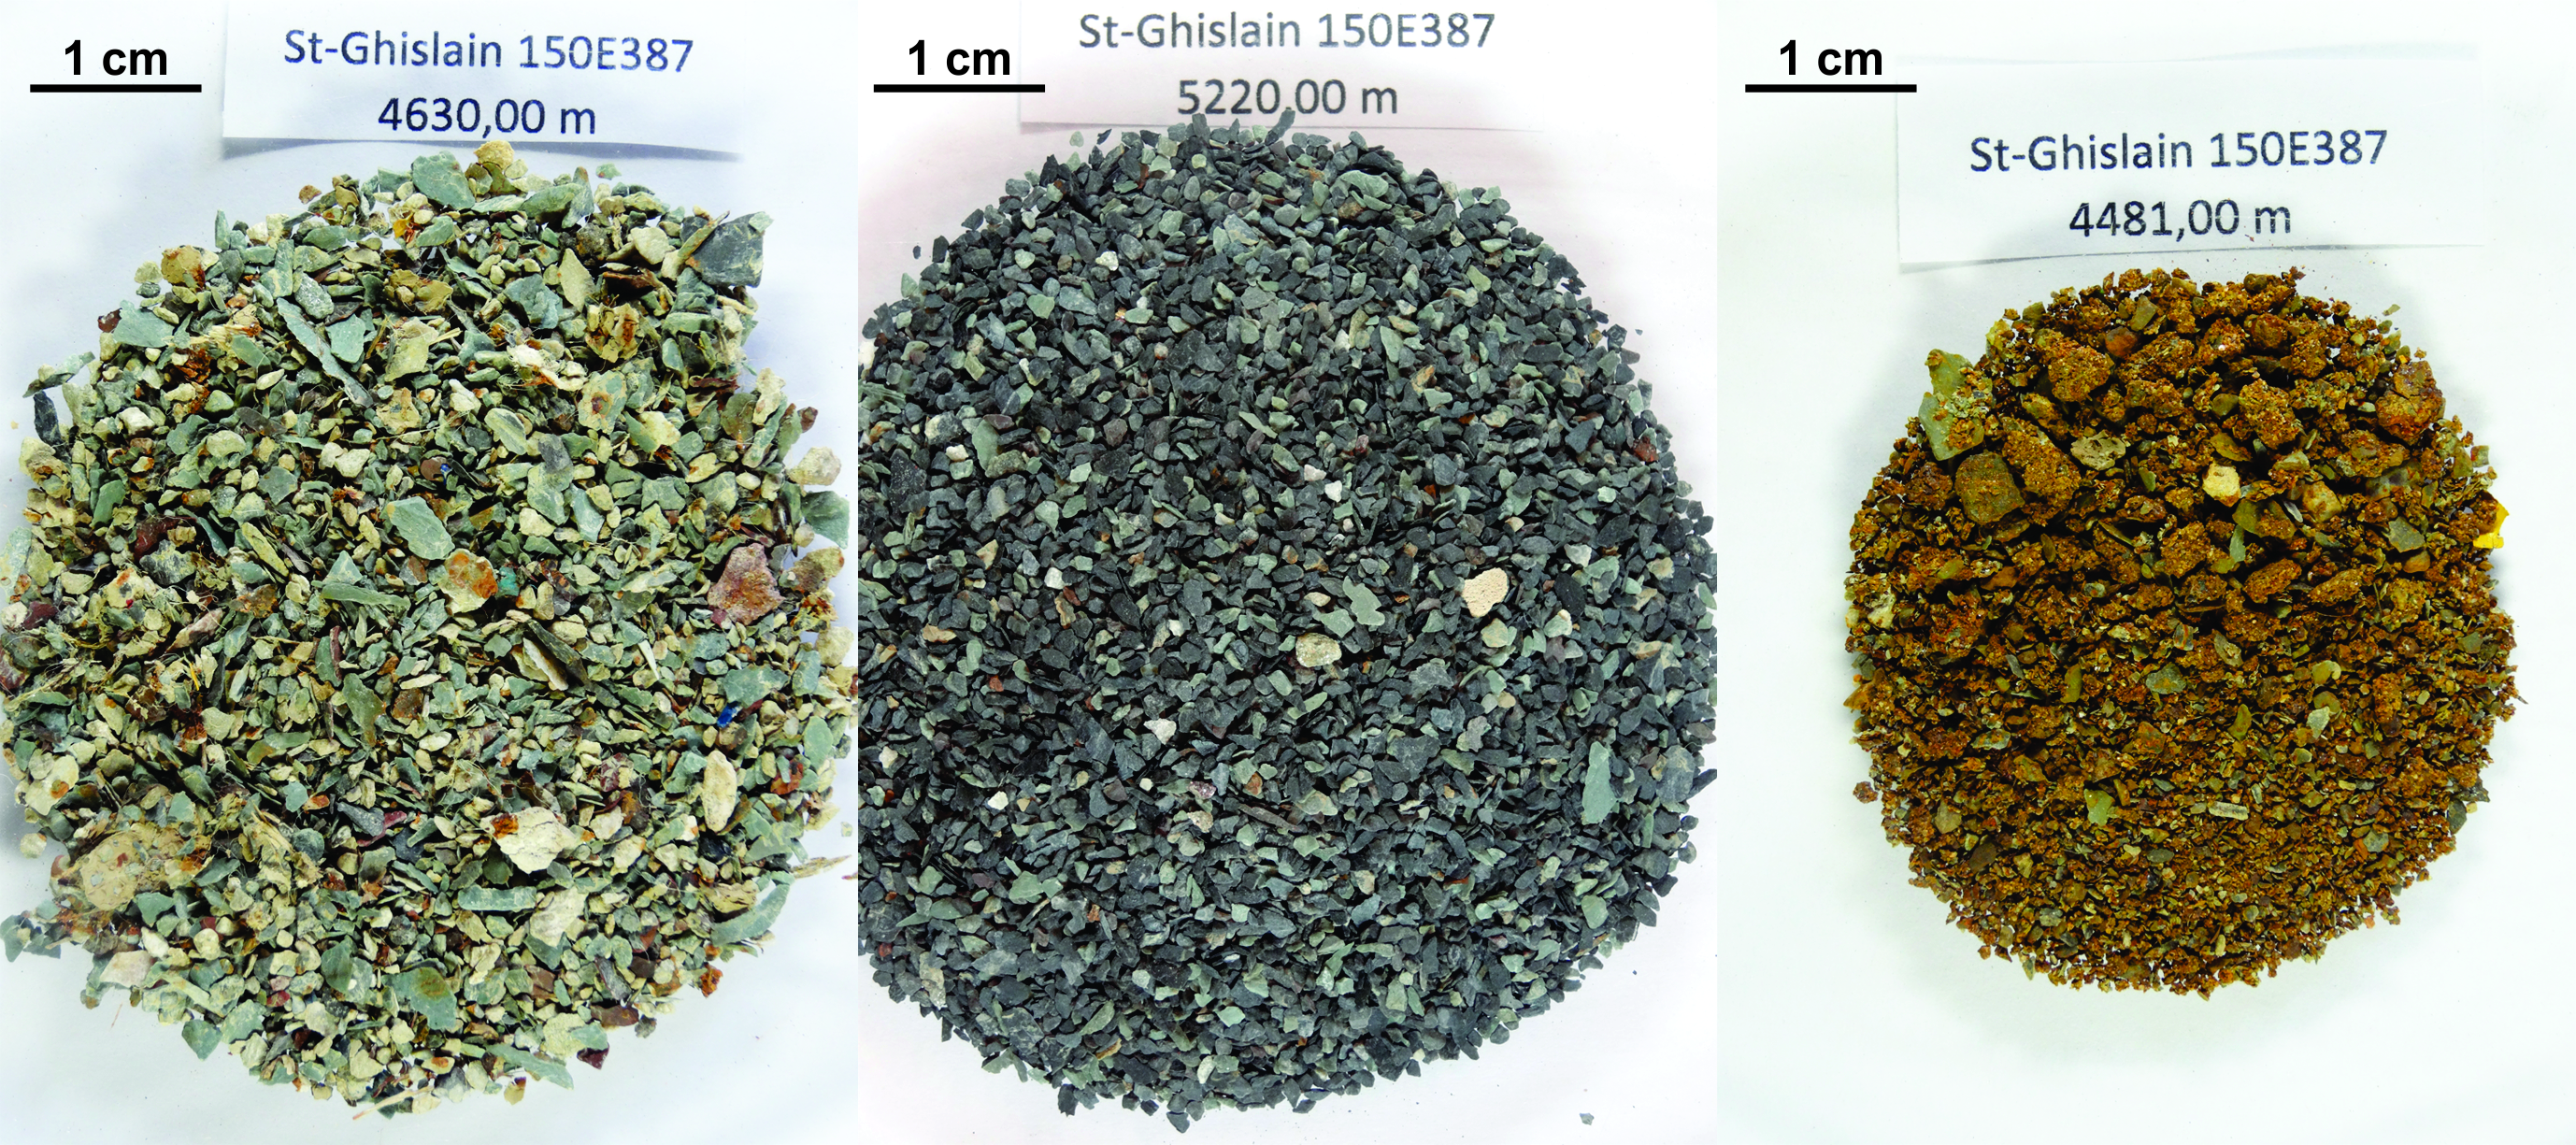
Figure 4. Examples of cutting samples dominated by green shale (left), grey limestone and shale (middle) and iron oxide-rich grains (right) (Saint-Ghislain borehole).
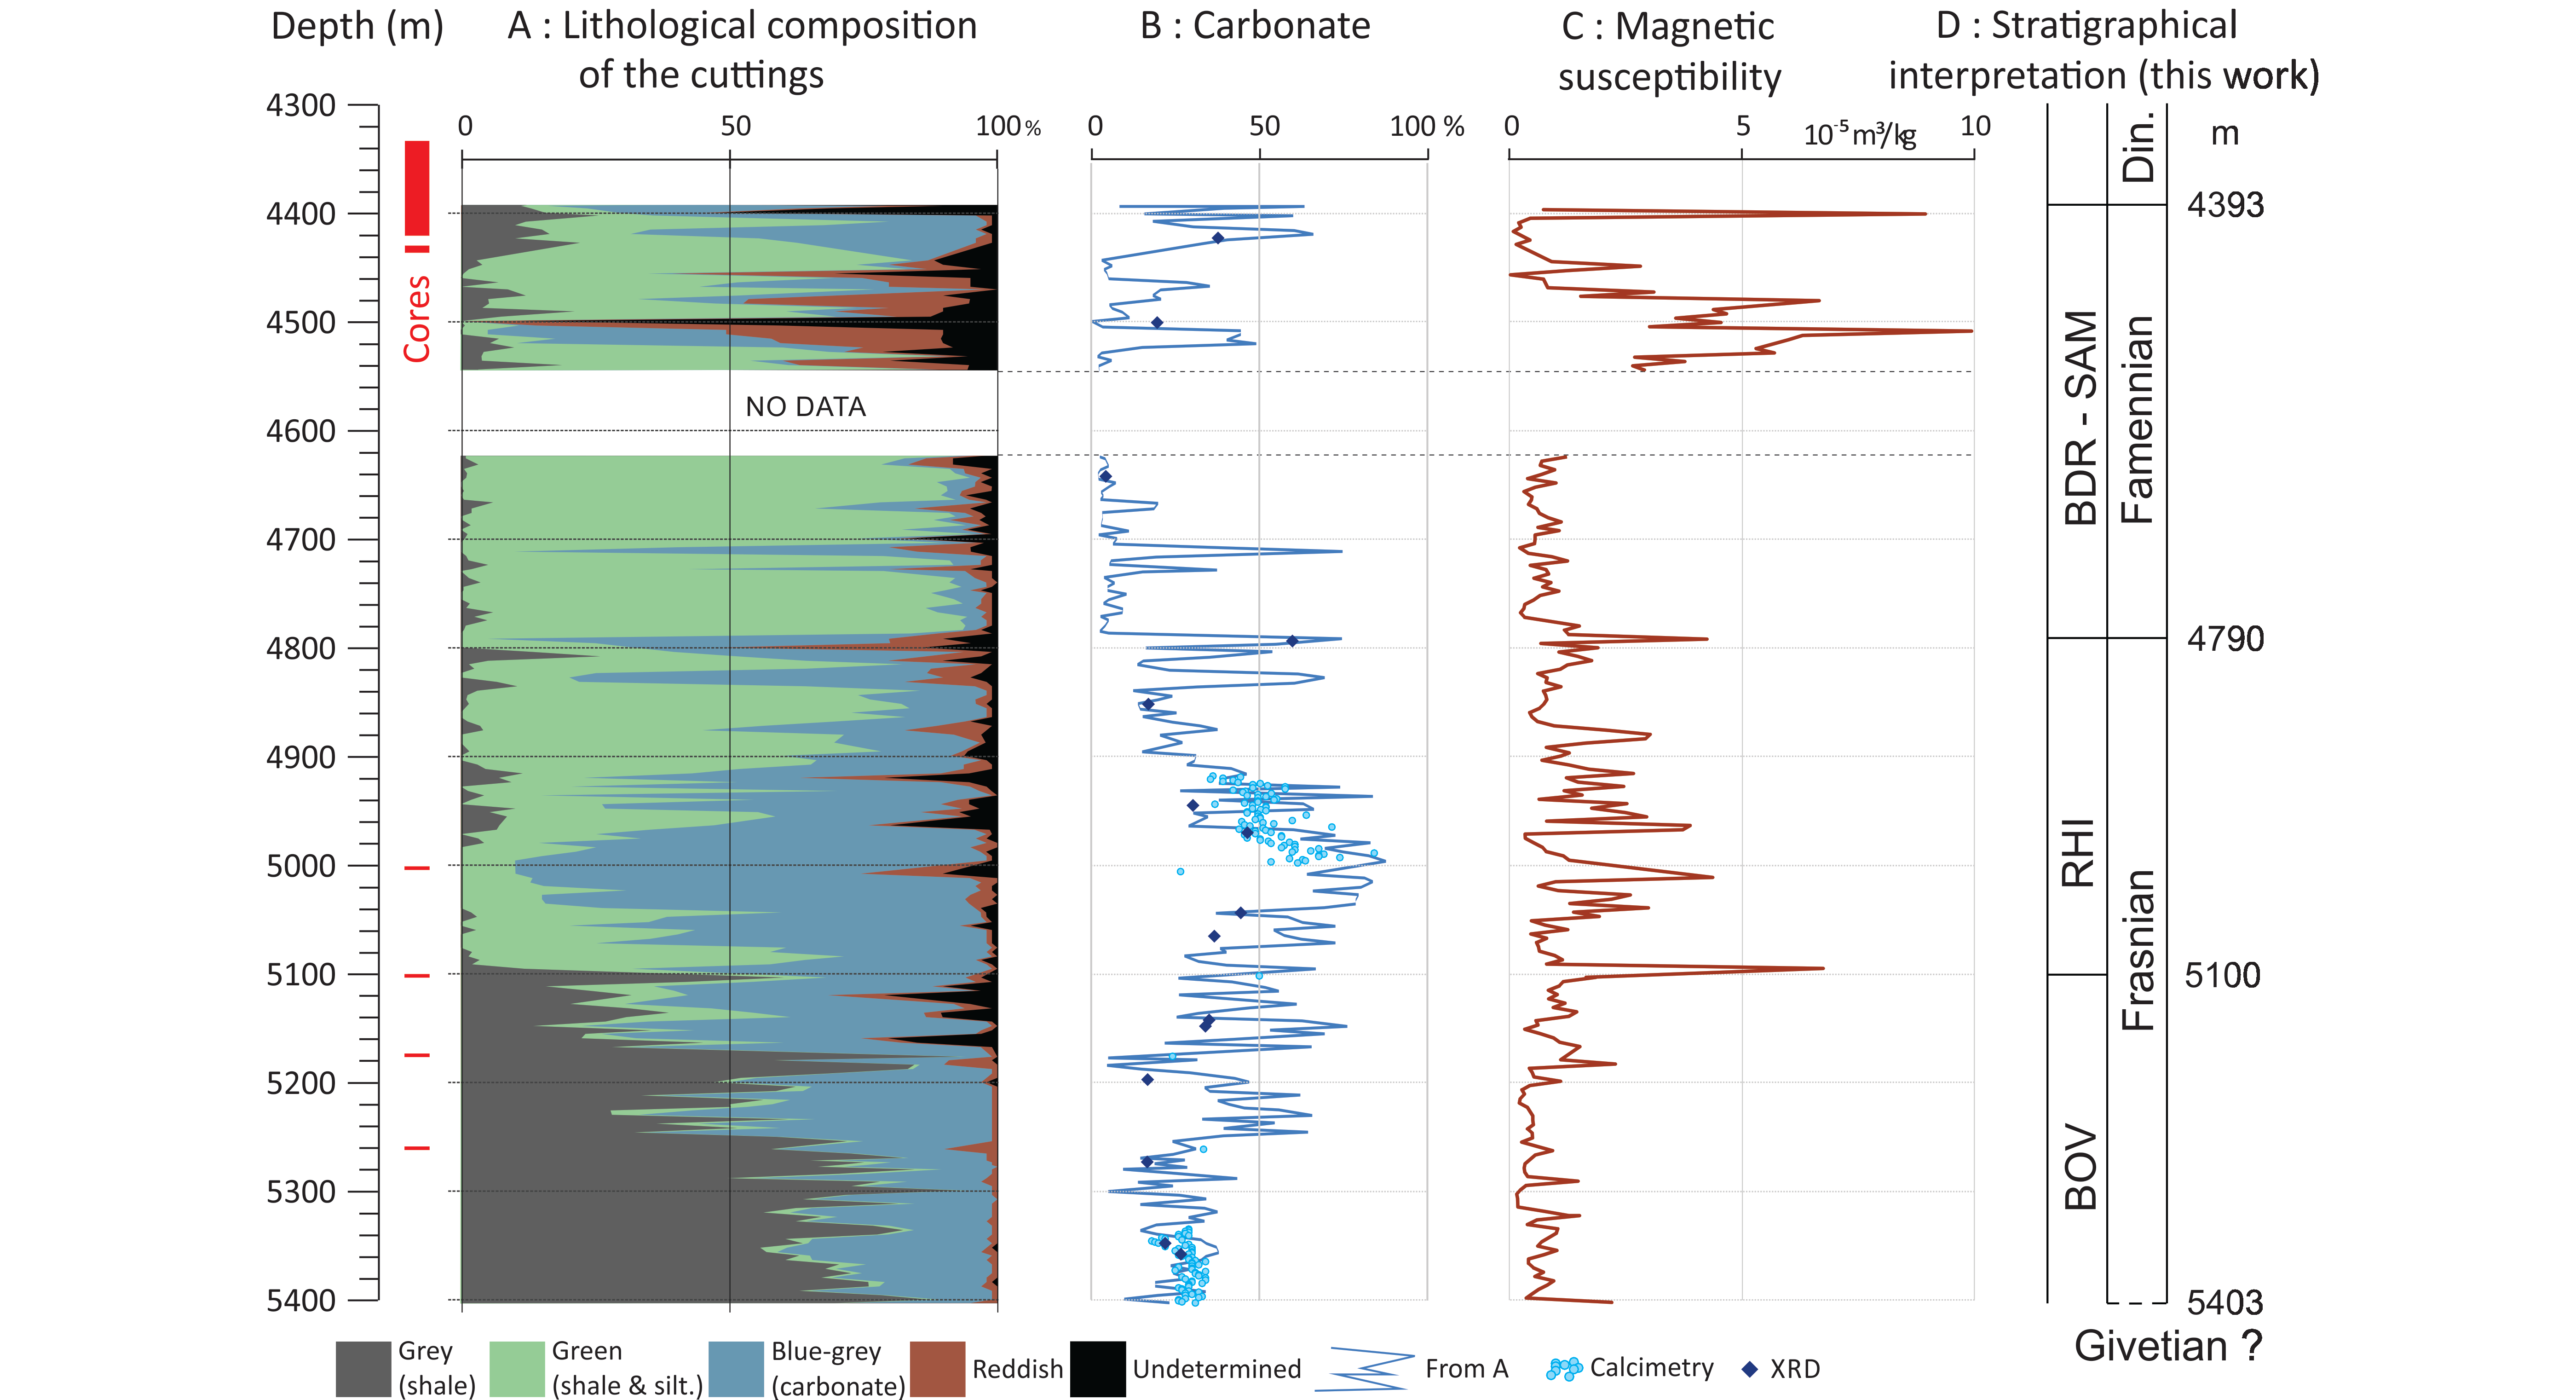
Figure 5. Lithological composition of the cuttings, carbonate content, magnetic susceptibility and stratigraphical interpretation of the Devonian cutting samples between -4393 and -5403 m in the Saint-Ghislain borehole. A. Lithological composition (facies) based on visual analysis. B. Carbonate content based on visual analysis, calcimetry and XRD analysis. C. Magnetic susceptibility measurements. D. Proposed stratigraphical interpretation based on the work presented in this paper. BDR-SAM: Bois-de-la-Rocq Member (Samme Formation); RHI: Rhisnes Formation; BOV: Bovesse Formation.
21Many samples include a low proportion of white, friable pellets, identified as a mixture of gypsum and calcite, and interpreted as residues from drilling mud. Other contaminants were observed, in various proportions, including plastic, steel and paint chips from the drilling equipment or casing, and nutshell fragments. The latter were used during drilling operation for mitigating mud losses in highly permeable horizons (Foraky, ca.1979).
22The lithological composition of the studied Devonian cutting samples is shown in Figure 5A, where the relative abundance of the four recognized lithologies are represented along with that of the undetermined grains (mud pellets and other obvious contaminants have been ignored). Except for a few samples, mainly located in the upper part of the studied section, this undetermined fraction is generally low and does not exceed a few percent.
23Three main units can be clearly distinguished in the lithological column as deduced from the visual analysis of the cuttings (Fig.4A) (from top to bottom):
24Unit A. From -4393 to -4790 m, the cuttings facies is largely dominated by green shale, a relatively high iron-oxide content, and very scarce limestone-dominated intervals.
25Unit B. From -4790 to -5100 m, the cuttings facies is largely dominated by limestone. After two pulses around -4800 m, the abundance of limestone gradually increases down to -5000 m below which it decreases.
26Unit C. From -5100 m to the bottom of the borehole, the cuttings facies has a mixed calcareous-shaly nature but with extremely rare green shale. The proportion of limestone exhibits a downward-decreasing trend with a few pulses.
3.1.2. XRD analyses and calcimetry
27XRD analyses support the lithological interpretation of the cutting samples and provide more detailed information regarding their mineralogical composition and hence their lithology (Table 1). In particular, there is a good consistency between calcite abundance determined by XRD and visual analysis (Fig. 5B).
Table 1. Mineralogical composition (in wt.%, normalized to 100%) of 16 selected cutting samples as determined by semi-quantitative XRD analysis.

28Within the 16 samples, three lithological groups can be identified based on the average abundance of quartz, clay and carbonate minerals (calcite, ankerite and dolomite) determined by XRD analysis (from top to bottom):
29a. An upper group of seven samples (from -4424 to -4946 m), globally composed of 70% siliciclastics, 20% calcite or less and 10% dolomite + ankerite, corresponding to the green shale unit as inferred from the visual lithological analysis. Average composition has less sense here because the results are heterogeneous as shown by the very variable clay and calcite abundance;
30b. A middle group of five samples (-4973 to -5150 m), with 50% siliciclastics and 40% calcite, corresponding to blue-grey calcareous shale unit from the visual analysis;
31c. A lower group of four samples (-5193 to -5366 m), with an average of 70% siliciclastics (clays and quartz), ~20% calcite and 6% ankerite, corresponding to the dark grey shale unit of the visual analysis.
32Sample -4792 m, which was selected to confirm its high limestone content as determined by HCl test, effectively shows the highest calcite content of the 16 investigated samples.
33Eighty one calcimetric analyses are available from -4918 to -4997 m and another 69 analyses from -5335 to -5400 m. The CaCO3 content globally increases from 40 to 70% within the first interval, and is globally stable at about 30% within the second interval. Calcimetric data are consistent with calcite abundance measured by XRD analysis and limestone abundance as determined by visual analysis (Fig. 5B).
3.1.3. Magnetic susceptibility (MS) on cutting samples
34As shown in Figure 5C, magnetic susceptibility values range from 3.5×10⁻⁸ to 9.9×10‑5 m³/kg. The highest values correspond to the presence of some ferromagnetic materials, which could be natural or artificial (contaminant). For example, the high MS values observed between -4399 and -4507 m and around -4800 m could relate to the presence of ironstone layers that are known in the Upper Devonian of the Ardenno-Rhenish Massif (Dreesen, 1989). Other high MS values could have an anthropogenic origin, such as a contamination by metallic particles from drilling tools and borehole casings. The MS peaks corresponding to metallic contaminants are here generally strongly correlated with tool manipulation events, as reported in the drilling operation logbook. This is for example the case in the lower part of the borehole (between -5000 and -5300 m), after each coring operation. Despite the presence of contaminants, MS is thought to be reliable in identifying ferruginous geological horizons, with high MS values in facies enriched in red-coloured grains. These ironstone beds are potentially important as they can provide stratigraphical markers for correlation purposes.
35Regarding the discrimination between carbonate and detrital lithologies, the interpretation is more difficult as the MS signal is influenced by the presence of high-MS ferromagnetic materials (see above), which may hide lower fluctuations. However, the different facies identified by visual analysis are fairly well distinguishable by their MS signature (from top to bottom):
36a. From -4400 to -4540 m, very high MS values are correlated with the abundance of red-coloured grains originating from ironstone beds. The low and more uniform MS interval between -4411 to -4427 m corresponds to more abundant carbonate.
37b. From -4623 to -4775 m, mid-range and rather uniform MS values are mostly related to dominantly detrital formations corresponding to the lower green shale facies.
38c. From -4779 to -5183 m, MS values are on average higher and quite fluctuating (with an increasing trend downward). The peak around -4800 m corresponds to a higher abundance of ironstone grains. Infra-millimetre pyrite cubes (FeS2) have also been observed at -4833 m. The highly-fluctuating MS signal between -4867 and -4971 m could at least partly be associated with higher contamination as observed during visual analysis of the cuttings. The same could apply to the conspicuous MS peaks around -5000 and -5100 m (although the latter marks a unit boundary), where cored sections are located. This interval corresponds to the limestone facies (‘Blue-grey carbonate’ in Fig. 5).
39d. From -5183 to -5403 m, MS values are on average lower and remain fairly constant. According to the visual analysis, this interval corresponds to calcareous shale facies (‘Grey shale’ in Fig. 5).
3.2. Biostratigraphy
3.2.1. Palynomorphs
40Only two core samples (-5261.2 and -5174 m) out of all analysed samples contain microfossils. The latter have been heavily coalified due to thermal alteration. Despite their poor preservation, some microfossils could be identified. The palynomorph assemblage is dominated by miospores with rare acritarchs, scolecodonts, and one chitinozoan. The presence of some marine palynomorphs suggests that the sediments were deposited in a near shore environment.
41Eight miospore taxa (Fig. 6) have been recognized in the two samples which contain a similar assemblage. Four taxa are identified at species level: Acinosporites lindlarensis, Riegel (1968); Dibolisporites echinaceus (Eisenack 1944), Richardson (1965); Retusotriletes triangulatus (Streel), Streel (1967) and Samarisporites triangulatus, Allen (1965). The identification of three taxa is doubtful: Ancyrospora cf. Ancyrospora ancyrea (Eisenack), Richardson (1962); Grandispora cf Grandispora protea (Naumora 1953), Moreau Benoit (1980); and Samarisporites cf Samarisporites praetervisus (Naumova 1953), Allen (1965). One taxum is in open nomenclature: Hystricosporites sp. Those species are well known in the TA and overlying TCo Biozones (Streel et al., 1987). TA Biozone is Late Givetian to Earliest Frasnian in age. TCo Biozone is Early to Late Frasnian. The first appearance of Chelinospora concinna Allen (1965), which was not observed in this study, marks the limit between the two biozones. As a consequence, there is no miospore arguments to differentiate the top of the Givetian from the base of the Frasnian. The absence of C. concinna in our samples cannot be considered as a biostratigraphic argument because of the poor quality of the assemblage.
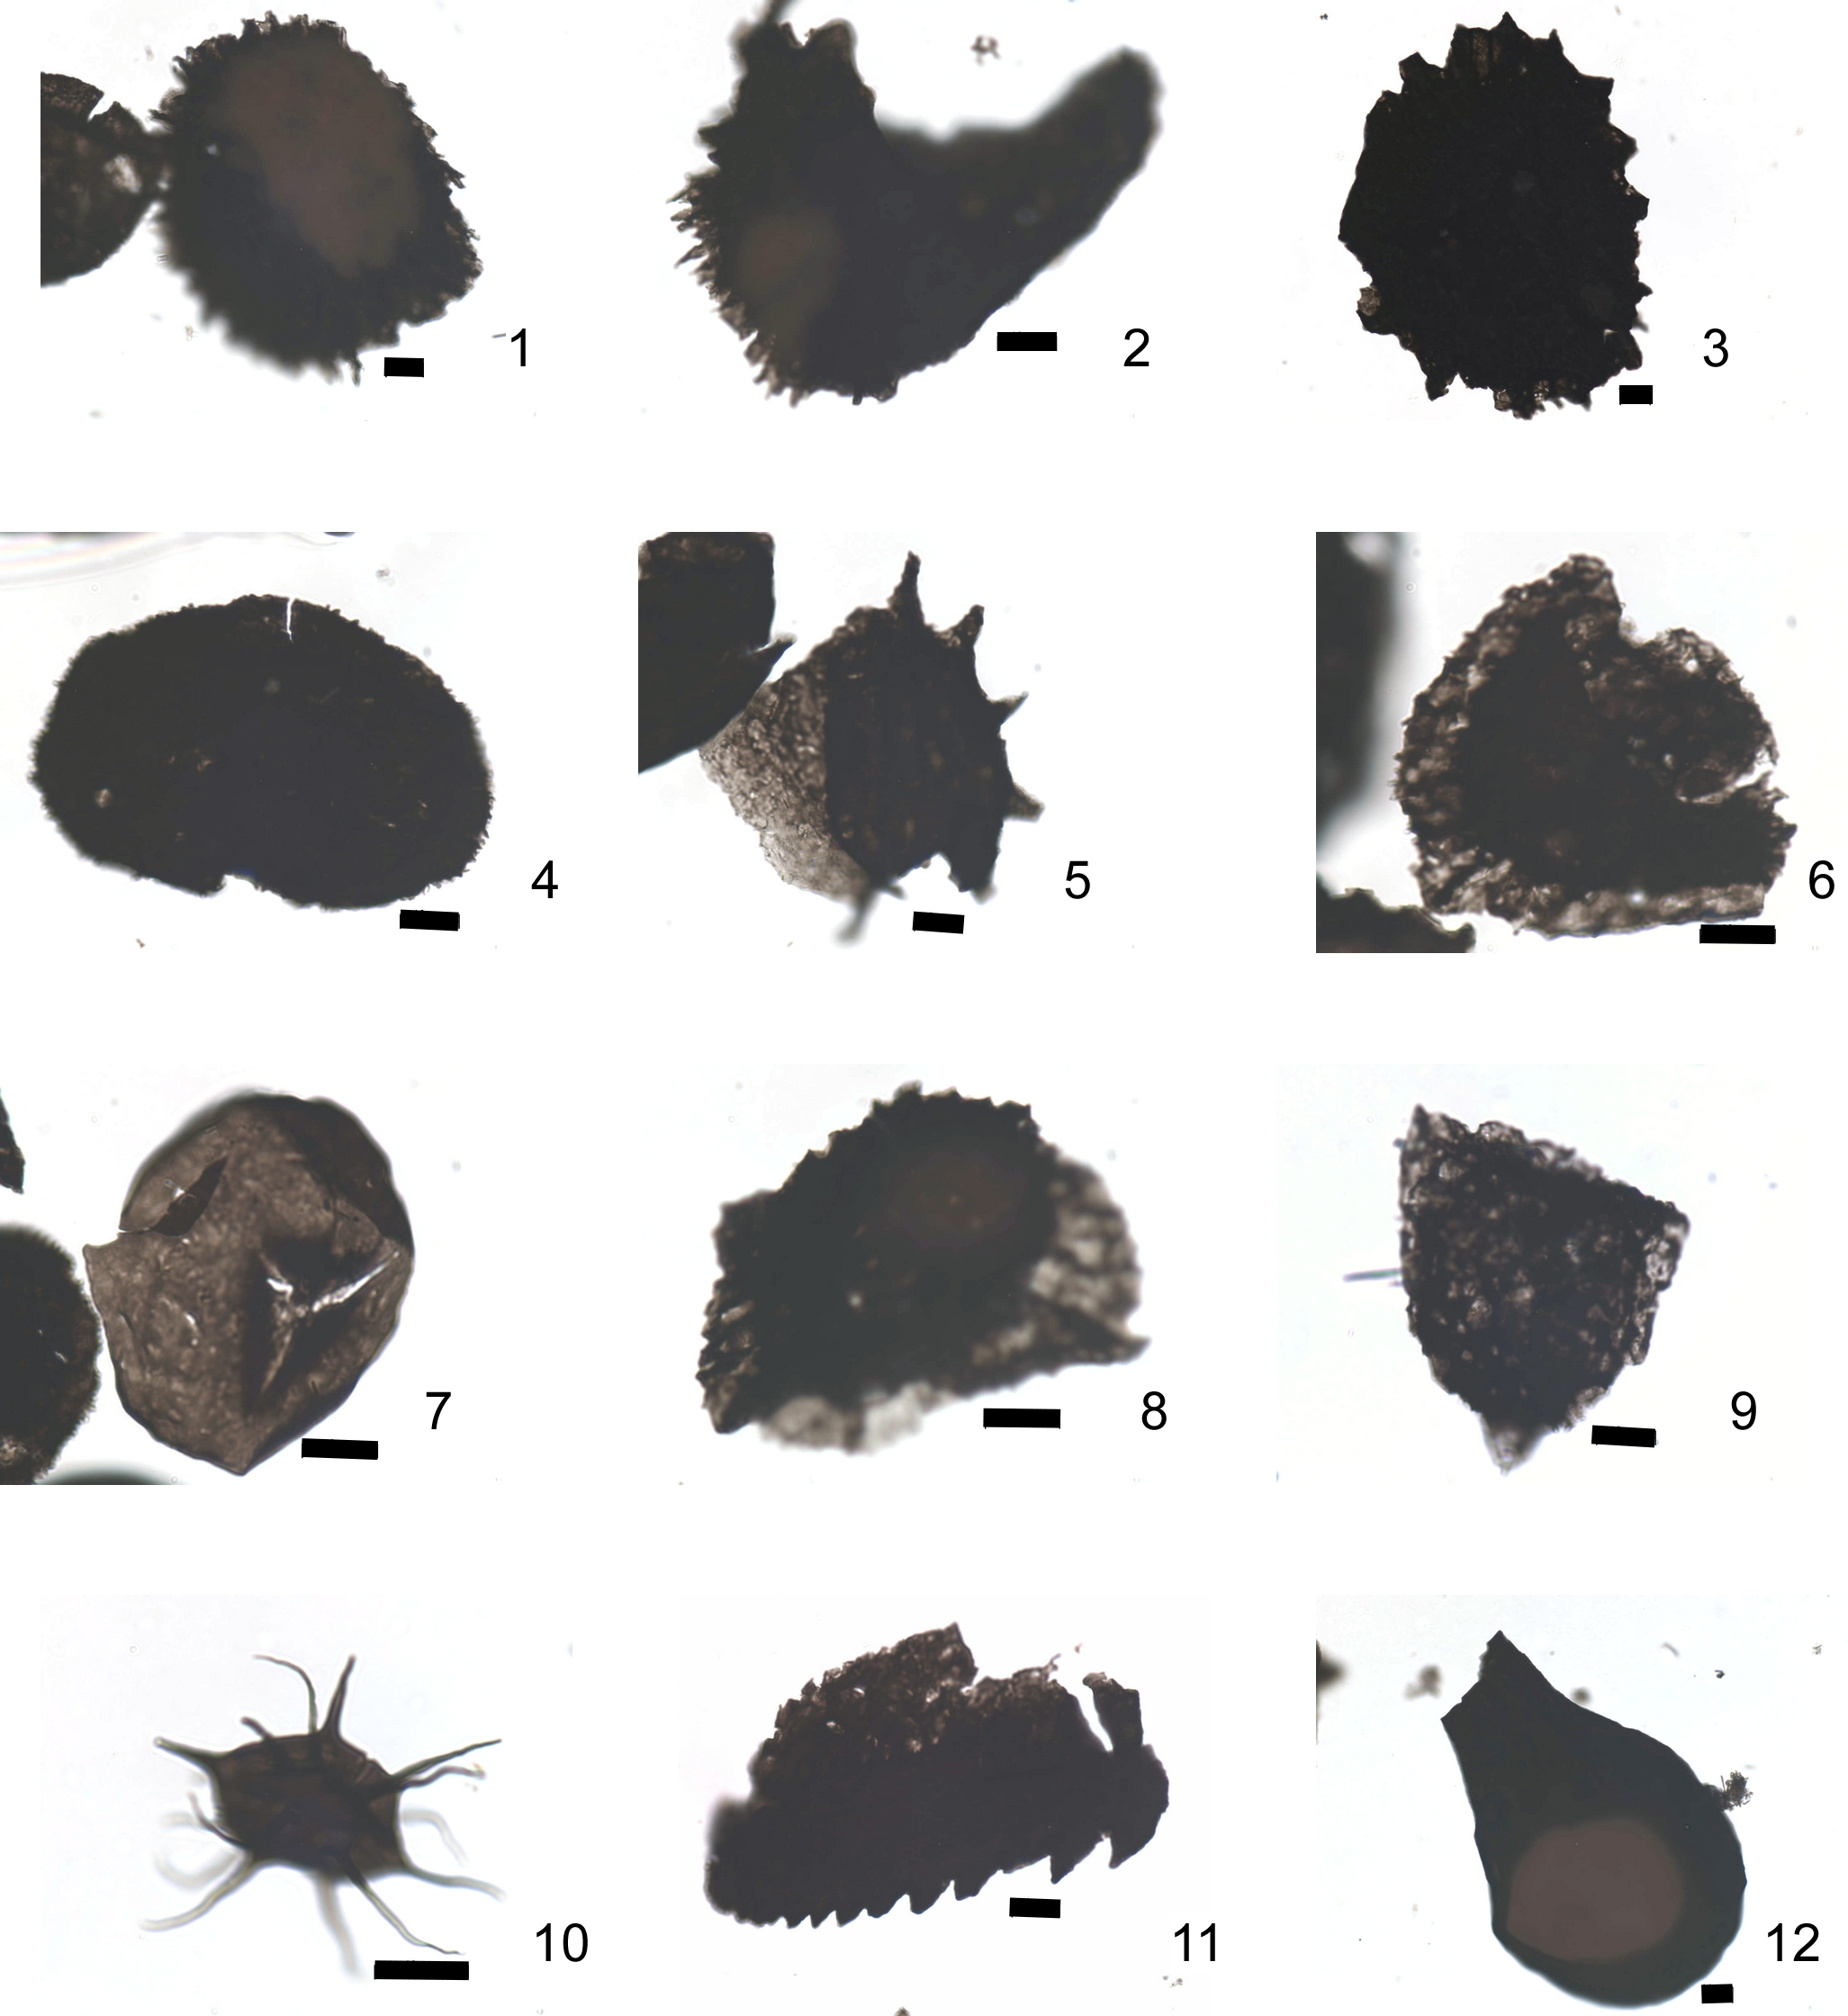
Figure 6. Observed palynomorphs in the Devonian of the Saint-Ghislain borehole. The black line beside each picture corresponds to a length of 10 µm. Figured material is housed in the Palaeopalynological Collection of the University of Liège. Each name is followed by the sample depth, the slide number and the England Finder co-ordinates. [1-2] Acinosporites lindlarensis Riegel 1968, 5261.2 m, L 73001, Q39/1 – C43/4. [3] Ancyrospora cf. Ancyrospora ancyrea (Eisenack) Richardson 1962, 5261.2 m, L 73001, J37/3. [4] Dibolisporites echinaceus (Eisenack) Richardson 1965, 5261.2 m, L 73001, N40/3. [5] Hystricosporites sp., 5261.2 m, L 73001, L53/0. [6] Grandispora cf Grandispora protea (Naumora) Moreau Benoit 1980, 5261.2 m, L 73001, F38/1. [7] Retusotriletes triangulatus (Streel) Streel 1967, 5174.0 m, L. N45/2. [8] Samarisporites cf Samarisporites praetervisus (Naumova) Allen 1965, 5261.2 m, L 73001, N43/1. [9] Samarisporites triangulatus Allen 1965, 5261.2 m, L 73001, J41/0. [10] Example of acritarch. [11] Example of a scolecodont. [12] Example of a chitinozoan.
42The biostratigraphical range of the different taxa (Fig. 7) is based on Breuer & Steemans (2013), Loboziak & Streel (1989), Richardson & McGregor (1986), Streel (2009), Streel et al. (1987), and Turnau & Narkiewicz (2011). This range corresponds to the confidently identified species and not to the doubtful identified specimens observed in the Saint Ghislain cores. The identification of S. triangulatus and A. lindlarensis is relatively confident. In this case, the maximum biostratigraphic age of the core samples is Middle Givetian to Early Frasnian (A in Fig. 7). If S. praetervisus, whose identification was more uncertain, is taken into account, the age of the samples can be restricted to the range from Middle Givetian to earliest Frasnian or to the Upper Givetian (B in Fig. 7). In any case, according to the observed palynomorphs, the biostratigraphic age of the deepest core sample (5261.2 m deep) is close to the Givetian/Frasnian boundary, without being able to discriminate between the two periods.
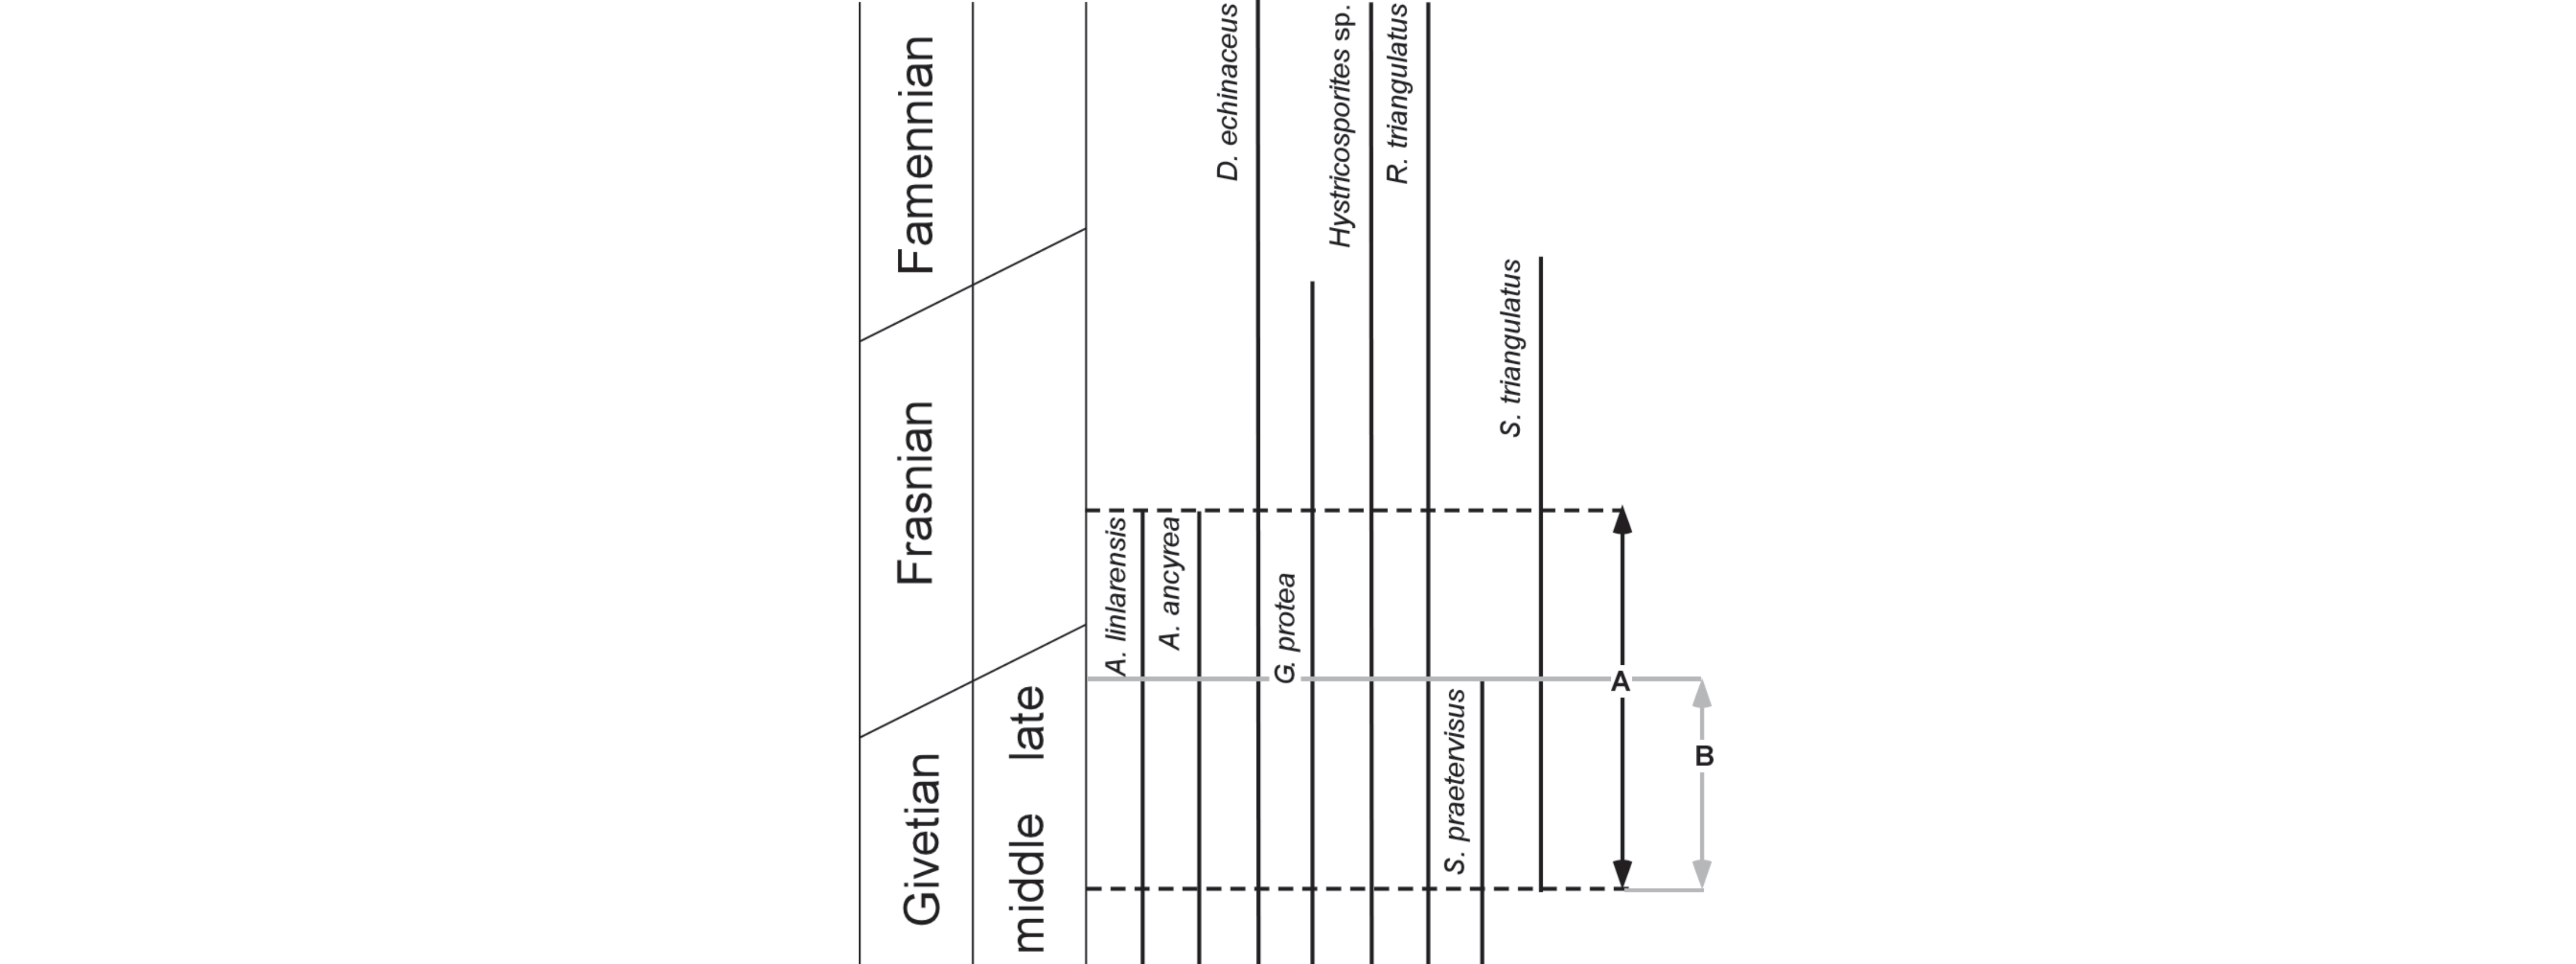
Figure 7. Biochronology of the identified miospores in the Devonian of the Saint-Ghislain borehole. The oblique line between the stages relates to the uncertainty of the first and last appearance of a taxa. The A interval corresponds to the common appearance period of the four identified taxa (A. lindlarensis, D. echinaceus, R. triangulates, S. triangulatus). The B interval corresponds to the common period of these four identified taxa and the three doubtful taxa (A. ancyrea, G. Protea, S. praetervisus).
3.2.2. Other information
43At -5258 m, Legrand (1978b) recognized a bryozoan-rich layer, and related it to similar layers in the Frasnian Bovesse Formation of Tournai and Vieux-Leuze boreholes.
3.3. Information from drilling operations
44Drilling archives and unpublished reports contain information on weathering state and permeability of the rocks. In these documents (Foraky, ca. 1979), operators reported a level of ‘soft rocks’ around -5300 m. This information might indicate the presence of altered rocks, either by intense fracturing or paleo-weathering possibly with karst dissolution.
45Operators also reported the necessity to inject extra drilling mud at rates of 0.4 m³/h and 0.1 m³/h, in intervals -5288.7 to -5345.55 m and -5345.55 to -5372.9 m, respectively. This compensation for mud losses may suggest the presence of horizons with enhanced permeability in the Devonian rocks.
4. Discussion
4.1. The Devonian of the Saint-Ghislain borehole
46All results and information achieved concerning the deepest section of the Saint-Ghislain borehole are summed up in Figure 5 A, B and C. The stratigraphic interpretation is shown in Figure 5D. This interpretation is based on the knowledge of related outcropping geological formations, and on data available for other nearby deep boreholes (Fig. 1). In particular, the Tournai and Vieux-Leuze boreholes may be more representative and more pertinent for comparison, because of their proximity to the Saint-Ghislain borehole.
47In the Saint-Ghislain borehole, the transition between the Dinantian (Mississippian, Lower Carboniferous) and the Famennian (Upper Devonian) is located at a depth of -4393 m. This is supported by the microfauna identified at -4430 m, which indicates an early Famennian age, and by the presence of an ironstone layer between -4393 and -4402 m (Groessens et al., 1979; Etienne, 2010).
48According to our study, three main lithostratigraphical units (named Unit A, B and C, see 3.1.1.) have been identified in the Devonian part, extending below -4402 m (from top to bottom):
49Unit A, from -4402 to -4790 m. The top of the Famennian is located below an ironstone layer. The lithology is quite homogeneous, mainly detrital, with a strong predominance of green shale, with some carbonate-rich levels. The upper 100 m of this interval (at least) is enriched in iron oxi/hydroxides, as supported by visual analysis and MS measurements. The Bois-de-la-Rocq Member (BDR; Samme Formation) can tentatively be assigned to this unit.
50Unit B, from -4790 to -5100 m. Overall, this unit can be globally described as a limestone formation. Two thick limestone horizons with a high iron oxi/hydroxide content are observed around -4790 and -4838 m. This unit could relate to the Upper Frasnian Rhisnes Formation (RHI). Note that the shaly Franc-Waret Formation (FRW), which encompasses the Frasnian-Famennian transition in the eastern Brabant Parautochthon, was not recognized. This formation is not observed in the Tournai borehole, and is only 14 m thick in the Vieux-Leuze borehole, where it is constituted of sandy and calcareous dolostone (Coen-Aubert et al., 1980). The studied unit was tentatively assigned to the Franc-Waret Formation because it is intercalated between the Rhisnes and Samme Formations, both clearly identified in the Vieux-Leuze borehole (Hennebert & Doremus, 1997a, b). Thus, in Saint-Ghislain, one could speculate on the presence of a similar thin carbonated ‘Franc-Waret’ Formation overlying the Rhisnes Formation or a more shaly formation at the base of the Bois-de-la-Rocq Member.
51Unit C, from -5100 to -5403 m. The oldest Devonian unit in the Saint-Ghislain borehole exhibits a fairly homogenous facies, dominated by mixed carbonate and shale. This lithology could be related to the Lower Frasnian Bovesse Formation (BOV). The lithological uniformity of this lowermost unit suggests that the Givetian-Frasnian transition beds, which have been observed in the Wépion, Tournai and Vieux-Leuze boreholes, have probably not been reached. In particular, the red sandstones and shales of the Mazy Member, and the more calcareous Alvaux Member (Bois de Bordeaux Formation), well identified in the Tournai and Vieux-Leuze boreholes and in the outcrops of the Senne, Sennette and Orneau valleys (Coen-Aubert et al., 1980; Hennebert & Doremus, 1997a, b), are not observed here, although the nature of the Bois de Bordeaux Formation could differ in this deeper part of the basin. Biostratigraphical data are in accordance with this interpretation as the core samples at -5170 and -5260 m yielded Frasnian to uppermost Givetian microfossils.
4.2. Correlations with other boreholes and implications for regional geology
52Based on (1) the new results on the lower 1010 m thick section of the Saint-Ghislain borehole, (2) the geological information available from other boreholes, and (3) the current knowledge from outcrops in the surrounding area, new insights regarding the geometry of the different lithostratigraphical units in the Saint-Ghislain area may be provided. Correlations between the deepest section in the Saint-Ghislain borehole and other regional sections have been investigated and are presented in Figure 8, where the Devonian-Carboniferous (Famennian-Tournaisian) boundary has been used as reference level. The location of the boreholes and outcrops is shown in Figure 1.
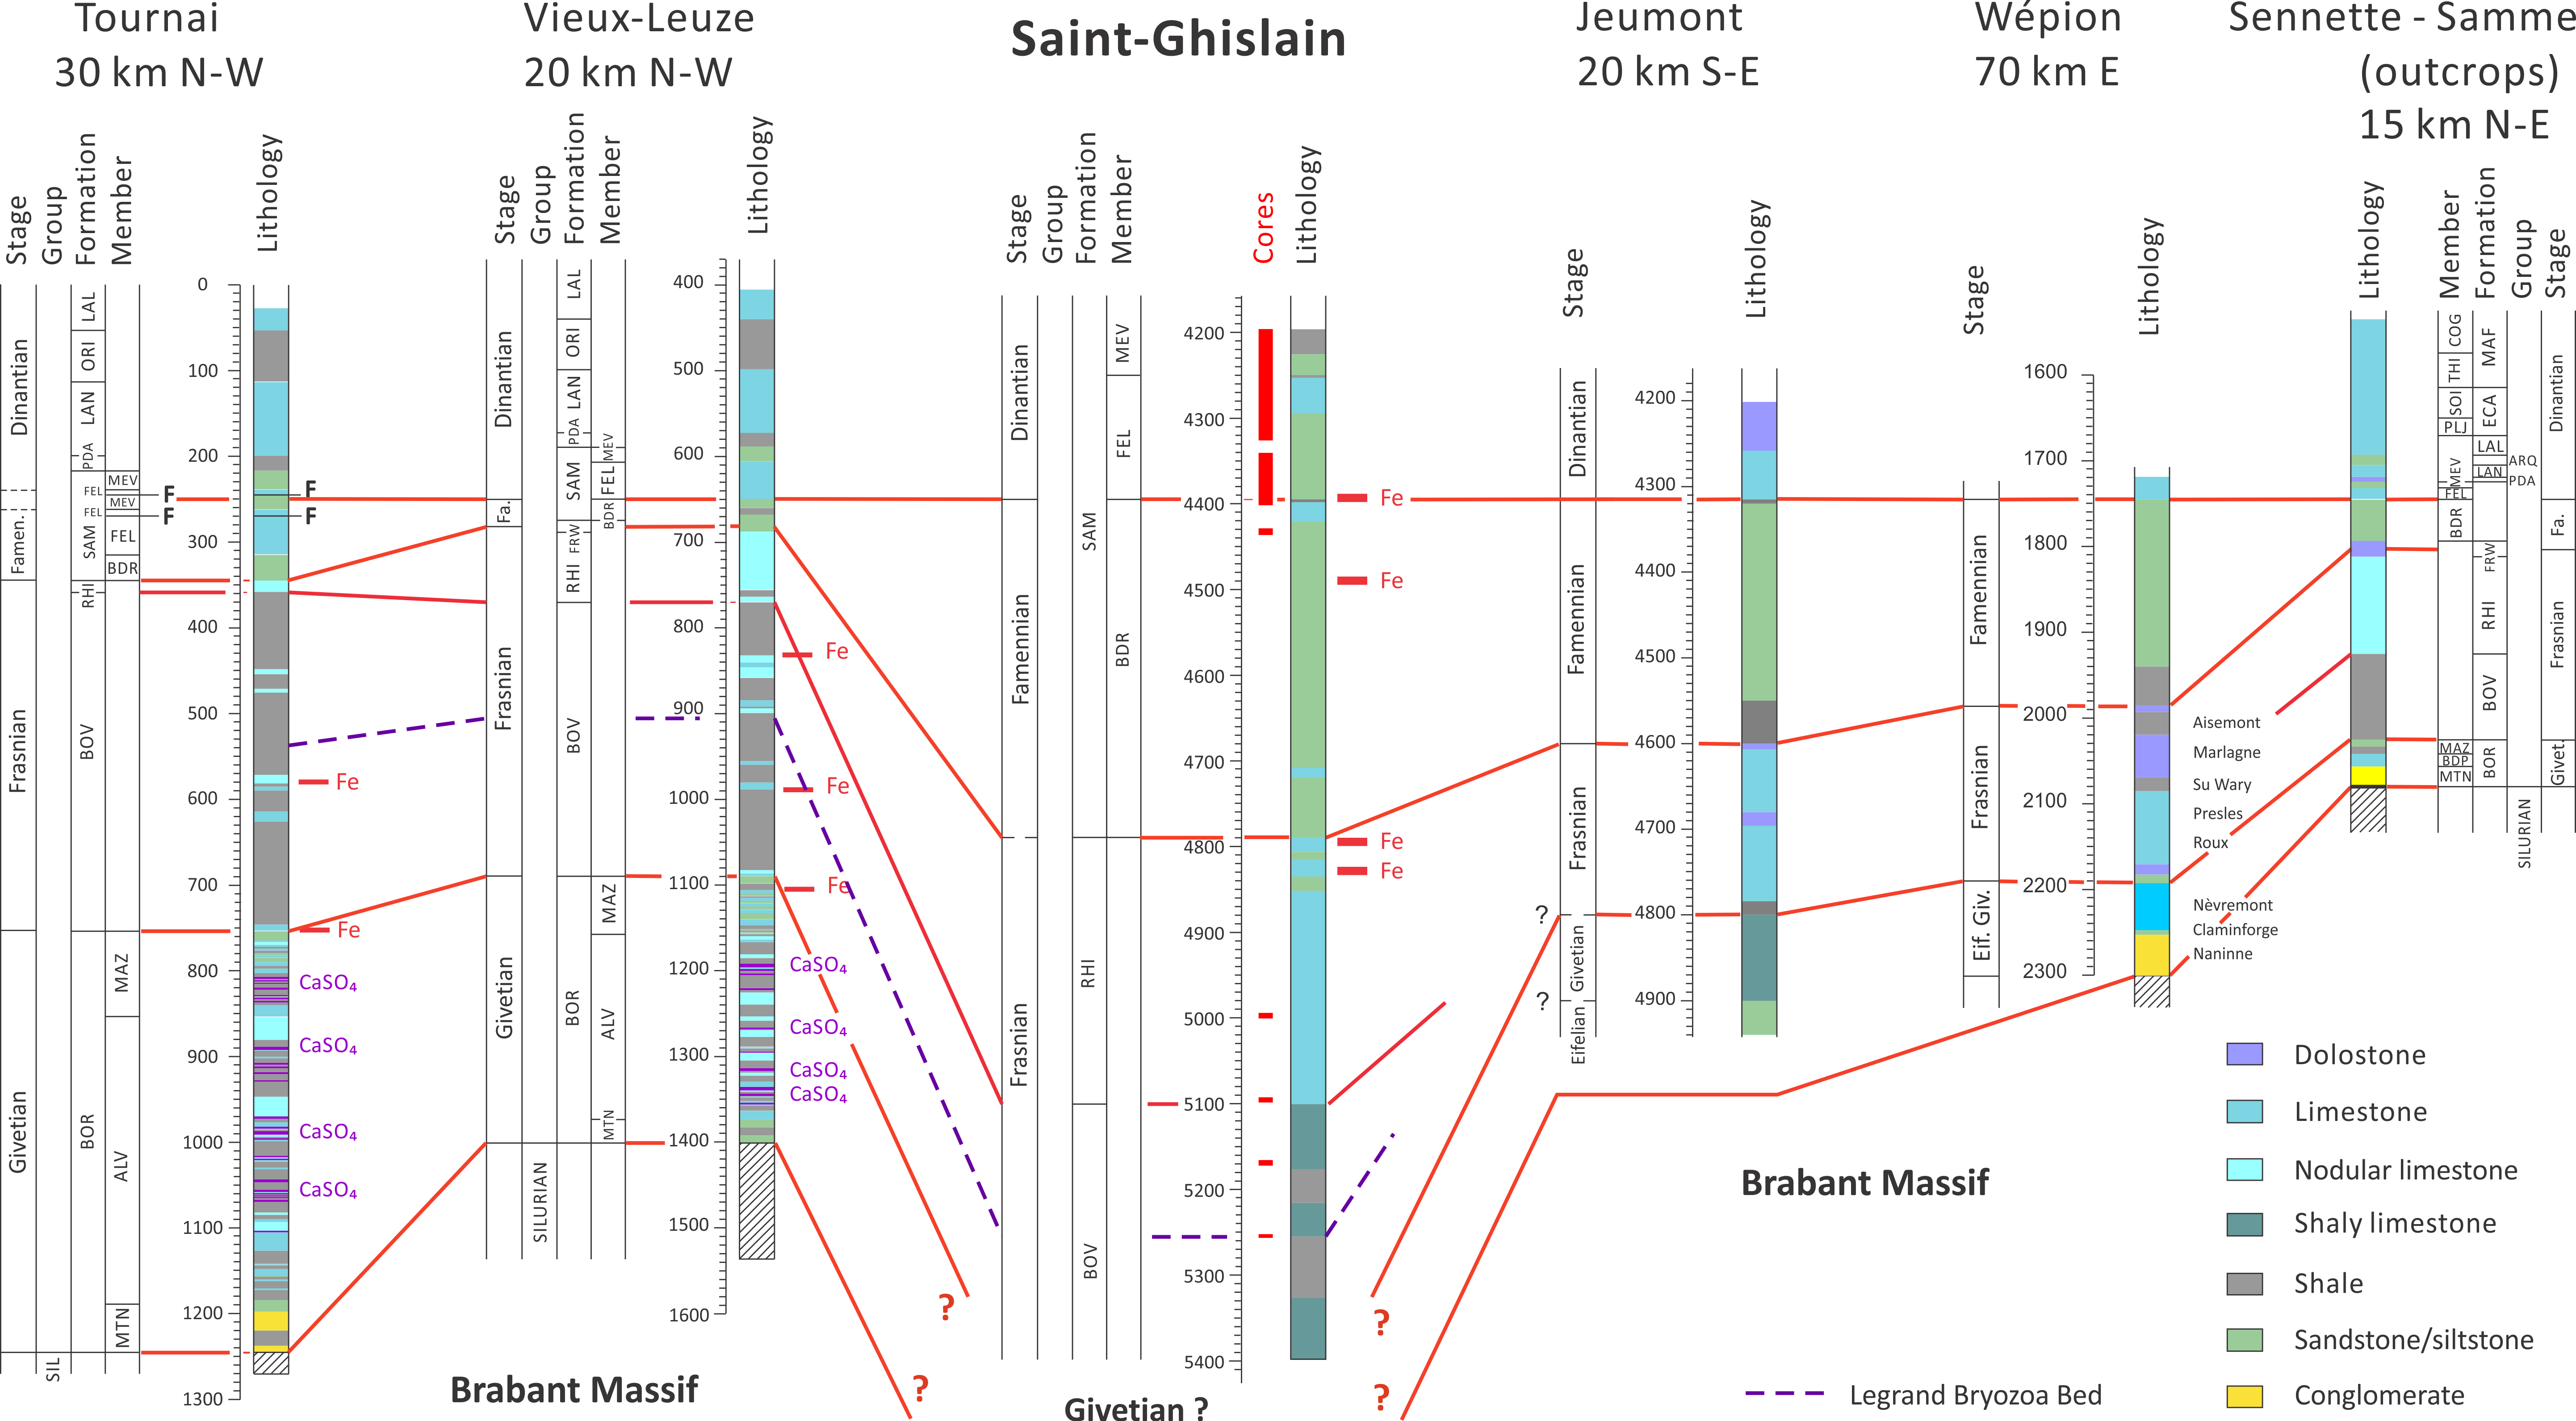
Figure 8. Correlation of the Devonian and Lower Carboniferous strata between the Saint-Ghislain borehole and other sections (solid horizontal line = Famennian/Tournaisian boundary). The location of the boreholes is provided in Figure 1.
53From a general perspective, the greater thickness of the Devono-Carboniferous series in the neighbourhood of Saint-Ghislain is confirmed, as Givetian strata have probably not been or were just reached by the borehole.
54More specifically, the thickness of the Famennian is much greater in the Saint-Ghislain borehole than in the Tournai and Vieux-Leuze boreholes as well as in outcrops to the NE but rather similar to that in the Jeumont and Wépion boreholes. This suggests that during the Famennian the Tournai and Vieux-Leuze areas were probably subsiding with a lower rate than in other areas of the sedimentary basin.
55Frasnian formations have a similar thickness in Saint-Ghislain, Vieux-Leuze and Tournai boreholes but are thinner in the Wépion borehole. The proportion of limestone versus shaly rocks vary significantly towards the East. In the Wépion borehole, Frasnian strata contain less shaly parts, in comparison to the calcareous parts. The limestone-rich Rhisnes Formation is observed over intervals of only 13 m in thickness at Tournai and 83 m in thickness at Vieux-Leuze. In the Saint-Ghislain borehole, the Rhisnes Formation might reach to 387 m in thickness.
56According to biostratigraphical data and the proposed lithostratigraphical interpretation, the top Givetian is supposed to be very close to the bottom of the Saint-Ghislain borehole. In Annappes, Tournai and Vieux-Leuze boreholes, the Alvaux Member (Bois de Bordeaux Formation) is 318 m, 335 m and 217 m thick, respectively (Sangnier et al., 1968; Coen-Aubert et al., 1980). This member is constituted of limestone, with subordinate shale, sandstone and anhydrite levels. It is possible, but not supported by direct evidence, that similar limestone beds are present within the Hainaut basement, in the vicinity of the Meso-Cenozoic Mons Basin.
5. Conclusions
57Drilled in 1972–1976, the Saint Ghislain borehole was the deepest (5403 m) of a long series of boreholes carried out by the Geological Survey of Belgium. Especially known for the discovery of evaporites (anhydrite) and for its sulphate-rich geothermal waters (73 °C), both in Lower Carboniferous formations, the deep section of the borehole (below -4400 m) remained, to date, poorly known. While the Dinantian and the Silesian have been studied in detail, there has been little interest in the Devonian strata. It must be said that the upper 81% of the borehole has been cored almost entirely and was covered by conventional geophysical well logging. In contrast, the remaining lower 19% were recovered mostly as cuttings, with very sparse cored intervals and no geophysical logging available. This study attempts—40 years later—to fill this gap. The objective is twofold: (1) to extend the geological knowledge of the deep strata in the Hainaut area, and (2) to assess the potential of deep geothermal resources with a temperature exceeding 120 °C.
58The lithostratigraphical succession of the deepest section of the Saint-Ghislain borehole is reconstructed based mainly on visual (colour) analysis of 852 cutting samples and a few core samples. Calcimetry, magnetic susceptibility and X-ray diffraction analyses complemented the lithological investigation.
59A new lithostratigraphical interpretation of the deepest part of the borehole is proposed. The lower section consists mainly of grey shale and carbonate, the middle section of blue-grey limestone and the upper section of green shale. Palynomorphs from samples at -5174 and at -5261 m suggest an age ranging from the latest Givetian to Lower Frasnian.
60According to these data, the lower calcareous shale from ‑5403 to ‑5100 m is interpreted as Early Frasnian in age and possibly latest Givetian at its base. The overlying limestones from -5100 to -4790 m are considered as Late Frasnian in age, and the green shale between -4393 to -4790 m, as Famennian. These stratigraphical units are assigned to the Bovesse Formation, Rhisnes Formation and Bois de la Rocq Member, respectively.
61This interpretation is mainly based on the analysis of cuttings, with some uncertainty inherent to the material and approach. In this context, future subsurface investigations in the area should ideally integrate a more extensive sampling and measurement strategy, including geophysical well logging and more systematic coring program, allowing a more detailed and direct description.
62The recognition of a 310 m thick calcareous unit, attributed to the Upper Frasnian Rhisnes Formation, constitutes an important result for geothermal exploration. Although not evidenced, permeability in this formation could be enhanced by the occurrence of fractures and/or dissolution processes. This would support the hypothesis of the existence of a deep geothermal resource with water temperature potentially higher than 150 °C, which opens perspectives for geothermal power generation.
63Our interpretation that the base of the borehole (-5403 m) possibly reached the top of the Givetian strata suggests that an additional geothermal target could exist in the Devonian, namely the calcareous Alvaux Member of the Bois de Bordeaux Formation (with possible evaporites), as recognized in the Annappes, Tournai, Leuze, Jeumont and Wépion boreholes, in the deep basement underlying the Meso-Cenozoic Mons Basin.
6. Acknowledgements
64This work was supported by Engie Electrabel in the framework of the GEODES project. The authors would like to thank F. Lacquement and J. Verniers for their constructive reviews from which the article benefited.
7. References
65Bacelle, L. & Bosellini, A., 1965. Diagrammi per la stima visiva della composizione precentuale nelle rocce sedimentarie. Annali dell’Università di Ferrara, N.S. Sezione 9, 4/3, 59–62.
66Bless, M.J.M., Conil, R., Defourny, P., Groessens, E., Hance, L. & Hennebert, M., 1980. Stratigraphy and thickness variations of some Strunio-Dinantian deposits around the Brabant Massif. Mededelingen Rijks Geologische Dienst, 32-8, 56–65.
67Blommaert, W., R. Vandelannoote, A. Sadurski, L. Van't Dack & R. Gijbels, 1983. Trace-element geochemistry of thermal water percolating through a karstic environment in the region of Saint Ghislain (Belgium). Journal of Volcanology and Geothermal Research, 19/3-4, 331–334. https://doi.org/10.1016/0377-0273(83)90117-8
68Breuer, P. & Steemans, P., 2013. Devonian spore assemblages from northwestern Gondwana: taxonomy and biostratigraphy. Special Papers in Palaeontology, 89, 5–163.
69Brouard, E., 1991. Les systèmes karstiques de la forêt de la Bessècle (Périgord, France) et de l’Entre-Sambre-et-Meuse (Belgique). Lithologies, géochimie, néogenèses argileuses, Evolution des systèmes. Unpublished Ph.D. Thesis, Université de Paris-Sud, Paris, 179 p.
70Coen-Aubert, M., Groessens, E. & Legrand, R., 1980. Les formations paléozoïques des sondages de Tournai et de Leuze. Bulletin de la Société belge de Géologie, 89/4, 241–275.
71de Béthune, P. 1961. Atlas de Belgique, planche 8 : géologie. 1/500 000. Académie royale de Belgique, Bruxelles.
72Dejonghe, L., Delmer, A. & Groessens, E., 1976. Découverte d'anhydrite dans les formations anténamuriennes du sondage de Saint-Ghislain. Bulletin de l'Académie Royale de Belgique, Classe des Sciences, 5e série, 62, 80–83.
73Delmer, A., 1972. Origine du bassin crétacique de la vallée de la Haine. Service Géologique de Belgique, Professional Papers, 1972/5, 79, 21 p.
74Delmer, A., 1977. Le Bassin du Hainaut et le sondage de Saint-Ghislain. Service Géologique de Belgique, Professional Papers, 1977/6, 143, 12 p.
75Delmer, A., 1988. Le sondage de Saint-Ghislain (Pl. 150E, n° 387) : Stratigraphie et tectonique en terrain houiller, sa liaison avec le sondage de Jeumont I. Annales de la Société géologique de Belgique, 111, 291–295.
76Delmer, A., Leclercq, V., Marlière, R. & Robaszynski, F., 1982. La géothermie en Hainaut et le sondage de Ghlin (Mons, Belgique). Annales de la Société géologique du Nord, 101, 189–206.
77de Magnée, I., Delmer, A. & Cordonnier, M., 1986. La dissolution des évaporites du Dinantien et ses conséquences. Bulletin de la Société belge de Géologie, 59, 213–220.
78De Putter, T., 1995. Etude sédimentologique de la Grande Brèche viséenne ("V3a") du Bassin de Namur-Dinant. Mémoires pour servir à l’Explication des Cartes Géologiques et Minières de la Belgique, 40, 264 p.
79De Putter, T. & Herbosch, A., 1990. Le V3a du sondage de Corenne (Synclinorium de Dinant, Belgique) : 110 mètres de brèche grise. Annales de la Société géologique de Belgique, 113/2, 247–265.
80De Putter, T., Groessens, E. & Herbosch, A., 1991. Le “V3a” anhydritique du sondage de Saint-Ghislain (150E387, Province du Hainaut, Belgique) : description macroscopique et sédimentaires. Service Géologique de Belgique, Professional Papers, 1991/6, 250, 22 p.
81De Putter, T., Rouchy, J.-M., Herbosch, A., Keppens, E., Pierre, C. & Groessens, E., 1994. Sedimentology and palaeo-environment of the Upper Visean anhydrite of the Franco-Belgian Carboniferous Basin (Saint-Ghislain borehole, southern Belgium). Sedimentary Geology, 90/1-2, 77–93. https://doi.org/10.1016/0037-0738(94)90018-3
82Dreesen, R., 1989. Oolitic ironstones as event-stratigraphical marker beds within the Upper Devonian of the Ardenno-Rhenish Massif. In Young, T.P. & Taylor, W.E.G. (eds), Phanerozoic Ironstones. Geological Society, London, Special Publications, 46, 65–78. https://doi.org/10.1144/GSL.SP.1989.046.01.08
83Etienne, A., 2010. Minéralogie, diagenèse et environnement de formation de l'hématite oolitique du sondage de Saint-Ghislain. Unpublished Master Thesis, Faculty of Engineering, University of Mons, Mons, 74 p.
84Foraky S.A., 1979. Unpublished mail dated 4/01/1979. Archives of the Geological Survey of Belgium, file number 150E387.
85Foraky S.A., ca. 1979. Historique du sondage de Saint-Ghislain, janvier 1973 – décembre 1978. Archives of the Geological Survey of Belgium, file number 150E387, unpublished report, 31 p.
86Groessens, E., Conil, R. & Hennebert, M., 1979. Le Dinantien du sondage de Saint-Ghislain. Stratigraphie et paléontologie. Mémoires pour servir à l’Explication des Cartes Géologiques et Minières de la Belgique, 22, 137 p.
87Hennebert, M. & Doremus, P., 1997a. Carte géologique de Wallonie : Hertain – Tournai 37/5-6. 1/25 000. Ministère de la Région wallonne, Direction générale des ressources naturelles et de l’environnement, Namur, avec une notice explicative de 66 p.
88Hennebert, M. & Doremus, P., 1997b. Carte géologique de Wallonie : Antoing – Leuze 37/7-8. Ministère de la Région wallonne, Direction générale des ressources naturelles et de l’environnement, Namur, avec une notice explicative de 74 p.
89Laumondais, A., Rouchy, J.-M. & Groessens, E., 1984. Importance des formations anhydritiques dinantiennes pour l’interprétation paléogéographique et structurale du domaine varisque d’Europe septentrionale. Comptes rendus de l'Académie des sciences. Série 2, Mécanique, physique, chimie, sciences de l'univers, sciences de la terre, 298/9, 411–414.
90Legrand, R., 1978a. La géothermie du sondage de Saint-Ghislain. Bulletin de la Société belge de Géologie, 87/3, 168–169.
91Legrand, R., 1978b. Dossier du Service Géologique de Belgique, Planche Saint-Ghislain – 150E, n° 387. Archives of the Geological Survey of Belgium.
92Leclercq, V., 1980. Le sondage de Douvrain. Service Géologique de Belgique, Professional Papers, 1980/3, 170, 51 p.
93Licour, L., 2010. L'aquifère géothermique du Hainaut (Belgique) : Un karst profond à (re-) découvrir. Karstologia Mémoires, 17, 58–63.
94Licour, L., 2012. Relations entre la géologie profonde et le comportement hydrogéologique du réservoir géothermique du Hainaut (Belgique). Caractérisation de l’aquifère dans la région de Saint-Ghislain. Unpublished Ph.D. Thesis, University of Mons, Mons, 416 p.
95Licour, L., 2014. The geothermal reservoir of Hainaut: the result of thermal convection in a carbonate and sulfate aquifer. Geologica Belgica, 17/1, 75–81.
96Licour, L., Quinif, Y. & Rorive, A., 2011. La géothermie profonde en Hainaut. Le réservoir du Dinantien. Bulletin d’Information des Géologues du Bassin de Paris, 48/3, 31–35.
97Loboziak, S. & Streel, M., 1989. Middle-Upper Devonian miospores from the Ghadamis Basin (Tunisia-Libya): systematics and stratigraphy. Review of Palaeobotany and Palynology 58/2-4, 173–196. https://doi.org/10.1016/0034-6667(89)90084-5
98Muchez, P., De Putter, T., Peeters, C., Herbosch, A. & Viane, W., 1994. Comparison of the diagenetic evolution of the lower Visean Belle Roche breccia and the middle Visean Grande Brèche. Bulletin de la Société belge de Géologie, 103/1-2, 149–159.
99Pierre, C., Rouchy, J.-M., Laumondais, A. & Groessens, E., 1984. Sédimentologie et géochimie isotopique (18O, 34S) des sulfates évaporitiques givétiens et dinantiens du Nord de la France et de la Belgique ; importance pour la stratigraphie et la reconstitution des paléomilieux de dépôts. Comptes Rendus de l’Académie des Sciences, Série 2, Mécanique, physique, chimie, sciences de l'univers, sciences de la terre, 299/9, 21–26.
100Richardson, J.B. & McGregor, D.C., 1986. Silurian and Devonian spore zones of the Old Red Sandstone Continent and adjacent regions. Geological Survey of Canada, Bulletin, 364, 1–79. https://doi.org/10.4095/120614
101Rorive, A. & Licour, L., 2012. L’aquifère géothermique du Hainaut : fonctionnement, exploitation et perspectives. Mémoires et publications de la Société des Sciences, Arts et Lettres du Hainaut, 106, 103–127.
102Rorive, A. & Licour, L., 2014. Géothermie profonde en Wallonie. In Dassargues, A. & Walraevens, K. (eds.), Watervoerende lagen en grondwater in België - Aquifères et eaux souterraines en Belgique. Academia Press, Gent, 367–374.
103Rouchy, J. M., 1986. Sédimentologie des formations anhydritiques givétiennes et dinantiennes du segment varisque franco-belge. In Les évaporites pré-permiennes en Europe: aspects sédimentologiques, paléogéographiques et structuraux. Bulletin de la Société belge de Géologie, 95/2-3, 111–127.
104Rouchy, J. M., Groessens, E. & Laumondais, A., 1984. Sédimentologie de la formation anhydritique viséenne du sondage de Saint-Ghislain (Hainaut, Belgique). Implications paléogéographiques et structurales. Bulletin de la Société belge de Géologie, 93/1-2, 105–145.
105Rouchy, J. M., Pierre, C., Groessens, E., Monty, C. Laumondais, A. & Moine, B., 1986. Les évaporites pré-permiennes du segment varisque franco-belge : aspects paléogéographiques et structuraux. In Les évaporites pré-permiennes en Europe : aspects sédimentologiques, paléogéographiques et structuraux. Bulletin de la Société belge de Géologie, 95/2-3, 139–149.
106Rouchy, J.-M., Laumondais, A. & Groessens, E., 1987. The lower Carboniferous (Visean) evaporites in northern France and Belgium: Depositional, diagenetic and deformational guides to reconstruct a disrupted evaporitic basin. In Peryt, T.M. (ed.), Evaporite Basins. Springer, Berlin, Lecture Notes in Earth Sciences, 13, 31–67.
107Rouchy, J.M., Groessens, E. & Laumondais, A., 1993. Dislocation des formations évaporitiques par la tectonique et la dissolution : le modèle des évaporites dinantiennes du domaine varisque franco-belge. Bulletin de la Société Géologique de France, 164/1, 39–50.
108Sangnier, P., Bonte, A., Waterlot, G. & Clément, B., 1968. Carte géologique détaillée de la France à 1:50 000ème : Lille - Halluin XXV-3-4. Bureau de Recherches Géologiques et Minières, Orléans.
109Streel, M., 1965. Techniques de préparation des roches détritiques en vue de l’analyse palynologique quantitative. Annales de la Société géologique de Belgique, 88, B107–B117.
110Streel, M., 2009. Upper Devonian miospore and conodont zone correlation in western Europe. Geological Society, London, Special Publications, 314, 163–176. https://doi.org/10.1144/SP314.9
111Streel, M., Higgs, K., Loboziak, S., Riegel, W. & Steemans, P., 1987. Spore stratigraphy and correlation with faunas and floras in the type marine Devonian of the Ardenne-Rhenish regions. Review of Palaeobotany and Palynology, 50, 211–229. https://doi.org/10.1016/0034-6667(87)90001-7
112Turnau, E. & Narkiewicz, K., 2011. Biostratigraphical correlation of spore and conodont zonations within Givetian and Frasnian of the Lublin area (SE Poland). Review of Palaeobotany and Palynology, 164/1-2, 30–38. https://doi.org/10.1016/j.revpalbo.2010.07.003
113Manuscript received 17.12.2018, accepted in revised form 21.02.2020, available online 01.04.2020.
