


- Startpagina tijdschrift
- Volume 23 (2020)
- number 3-4 - The Neogene stratigraphy of northern ...
- The architecture of the Kattendijk Formation and the implications on the early Pliocene depositional evolution of the southern margin of the North Sea Basin


Weergave(s): 3335 (48 ULiège)
Download(s): 486 (14 ULiège)

The architecture of the Kattendijk Formation and the implications on the early Pliocene depositional evolution of the southern margin of the North Sea Basin

Abstract
An east-west correlation profile through the upper Neogene succession north of Antwerp, based on cone penetration tests, reveals the architecture of the lower Pliocene Kattendijk Formation. It shows a basal incision of the Kattendijk Formation down to 20 m in Miocene sands and locally even Lower Oligocene clays. The incision is part of a much larger gully system in the region at the base of the Kattendijk Formation. The strongest gully incision is observed along the western profile, and coincides with increases in the thickness of the Kattendijk Formation from its typical four to six meters thickness in the east towards a maximum of 15 m in the west. Correlations show that this additional thickness represents a separate sequence of the Kattendijk Formation that first filled the deepest part of the gully prior to being transgressed and covered by the second sequence deposited in a larger gully system. Both sequences of the Kattendijk Formation have basal transgressive layers, and are lithologically identical. Initial, deep incision at the base of the Kattendijk Formation might have been the result of the constriction of early Pliocene tidal currents that invaded and expanded fluvial or estuarine gullies that had developed during the latest Miocene sea-level low. A similar mechanism had been proposed for the development of late Miocene gully system at the base of the Diest Formation further southeast in northern Belgium. As the wider area was transgressed and covered by the second sequence of the Kattendijk Formation, flow constriction ended, currents weakened and gully incisions were reduced in size.
Inhoudstafel
1. Introduction
1During the early Pliocene, the glauconite-bearing sands of the Kattendijk Formation were deposited in a shallow marine environment in the southern part of the North Sea Basin (Fig. 1). Its presence was established in the subsurface of the city of Antwerp and its harbor during excavation works (see Cogels, 1874; Gaemers, 1975; De Meuter et al., 1976; Louwye et al., 2004; De Schepper et al., 2009) and by means of boreholes in the Waasland (Laga, 1971) and Campine areas (Louwye & Laga, 1998; for location see Fig. 2). At these observation points, the Kattendijk Formation overlies units from different ages, ranging from the upper Miocene Diest Formation in the Campine area and northeast of the city of Antwerp (De Meuter et al., 1976; Louwye & Laga, 1998;) to the lower to middle Miocene Berchem Formation in the northern part of the city of Antwerp (Cogels, 1874; De Meuter et al., 1976) and even the lower Oligocene Boom Formation in the Waasland area (Laga, 1971; Gaemers, 1975; Fig. 2). The base of the Kattendijk Formation forms an important regional unconformity. Little detail is known about the geometry of the unconformity, only a few regional insights are known from schematic cross-sections (Laga, 1983) and the regional geological models (Jacobs et al., 2010; Matthijs et al., 2013; Deckers et al., 2019). This is mainly due to the poor distinction between the Kattendijk Formation and over- and underlying glauconite-bearing sands in low quality borehole descriptions (cf. Jacobs et al., 2010).
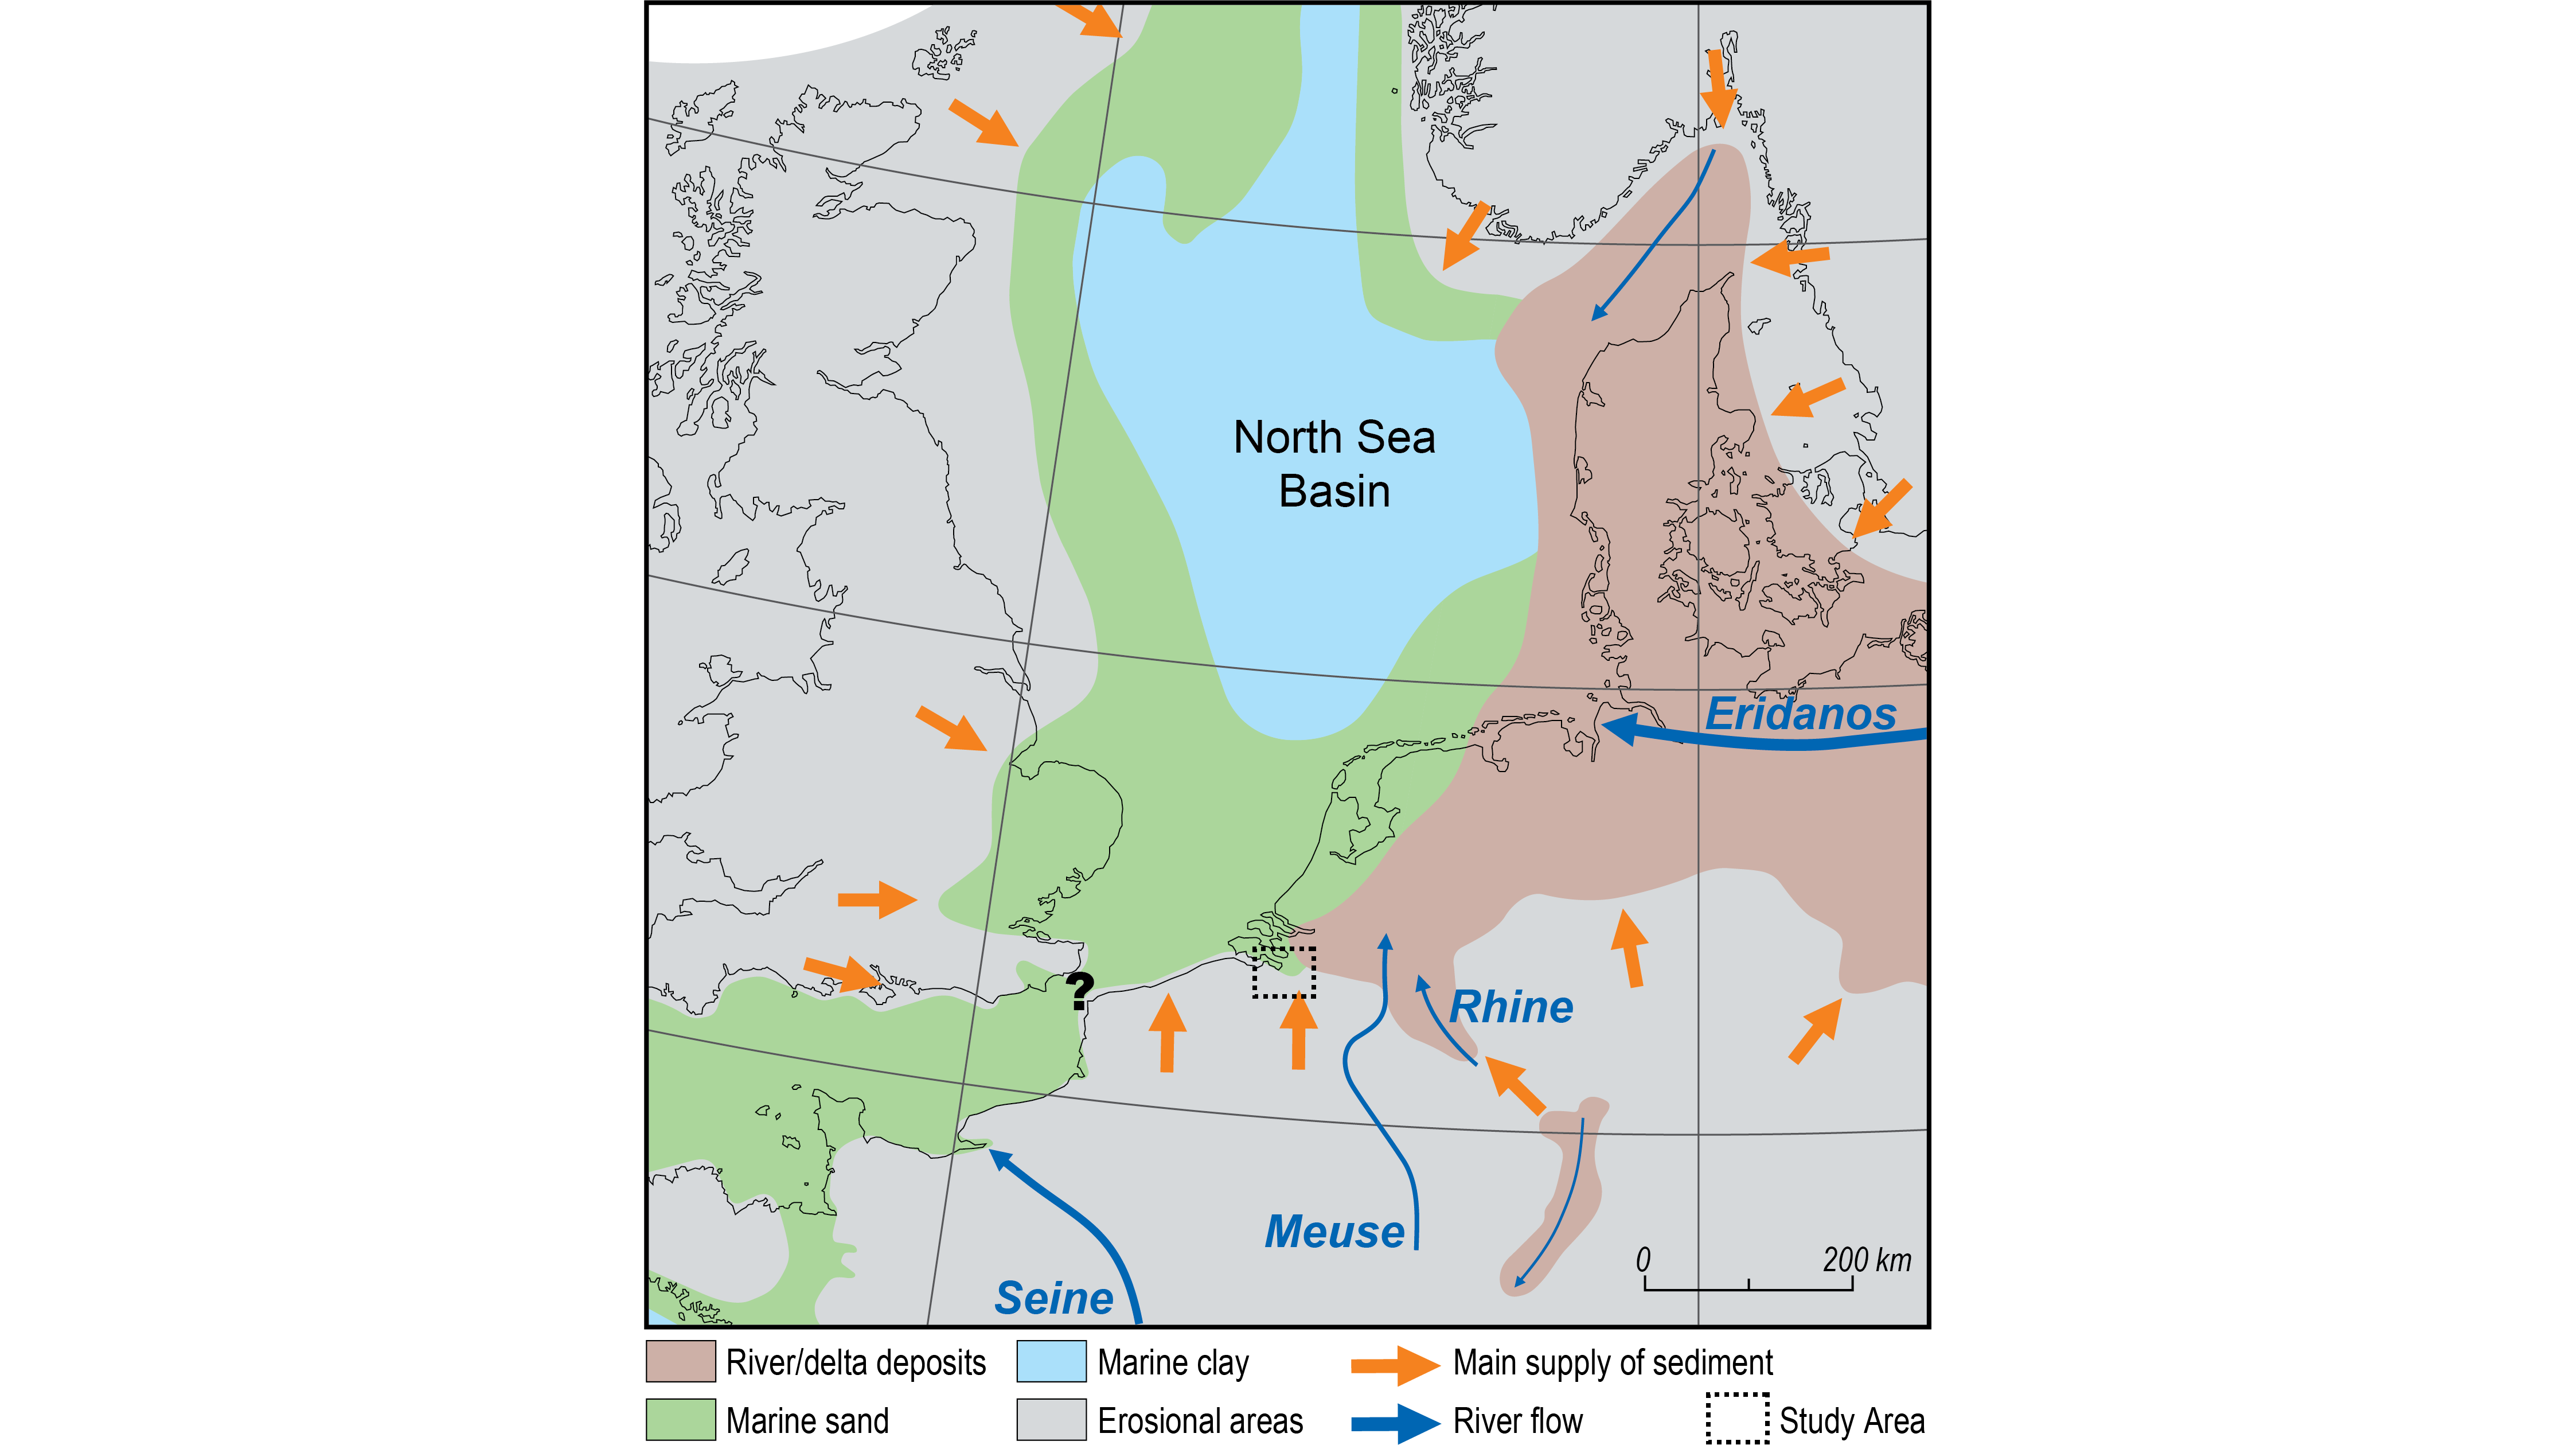
Figure 1. Early Pliocene (Zanclean) paleogeography of the North Sea Basin and surrounding areas, modified after Gibbard & Lewin (2016). The extent of the study area is also shown.
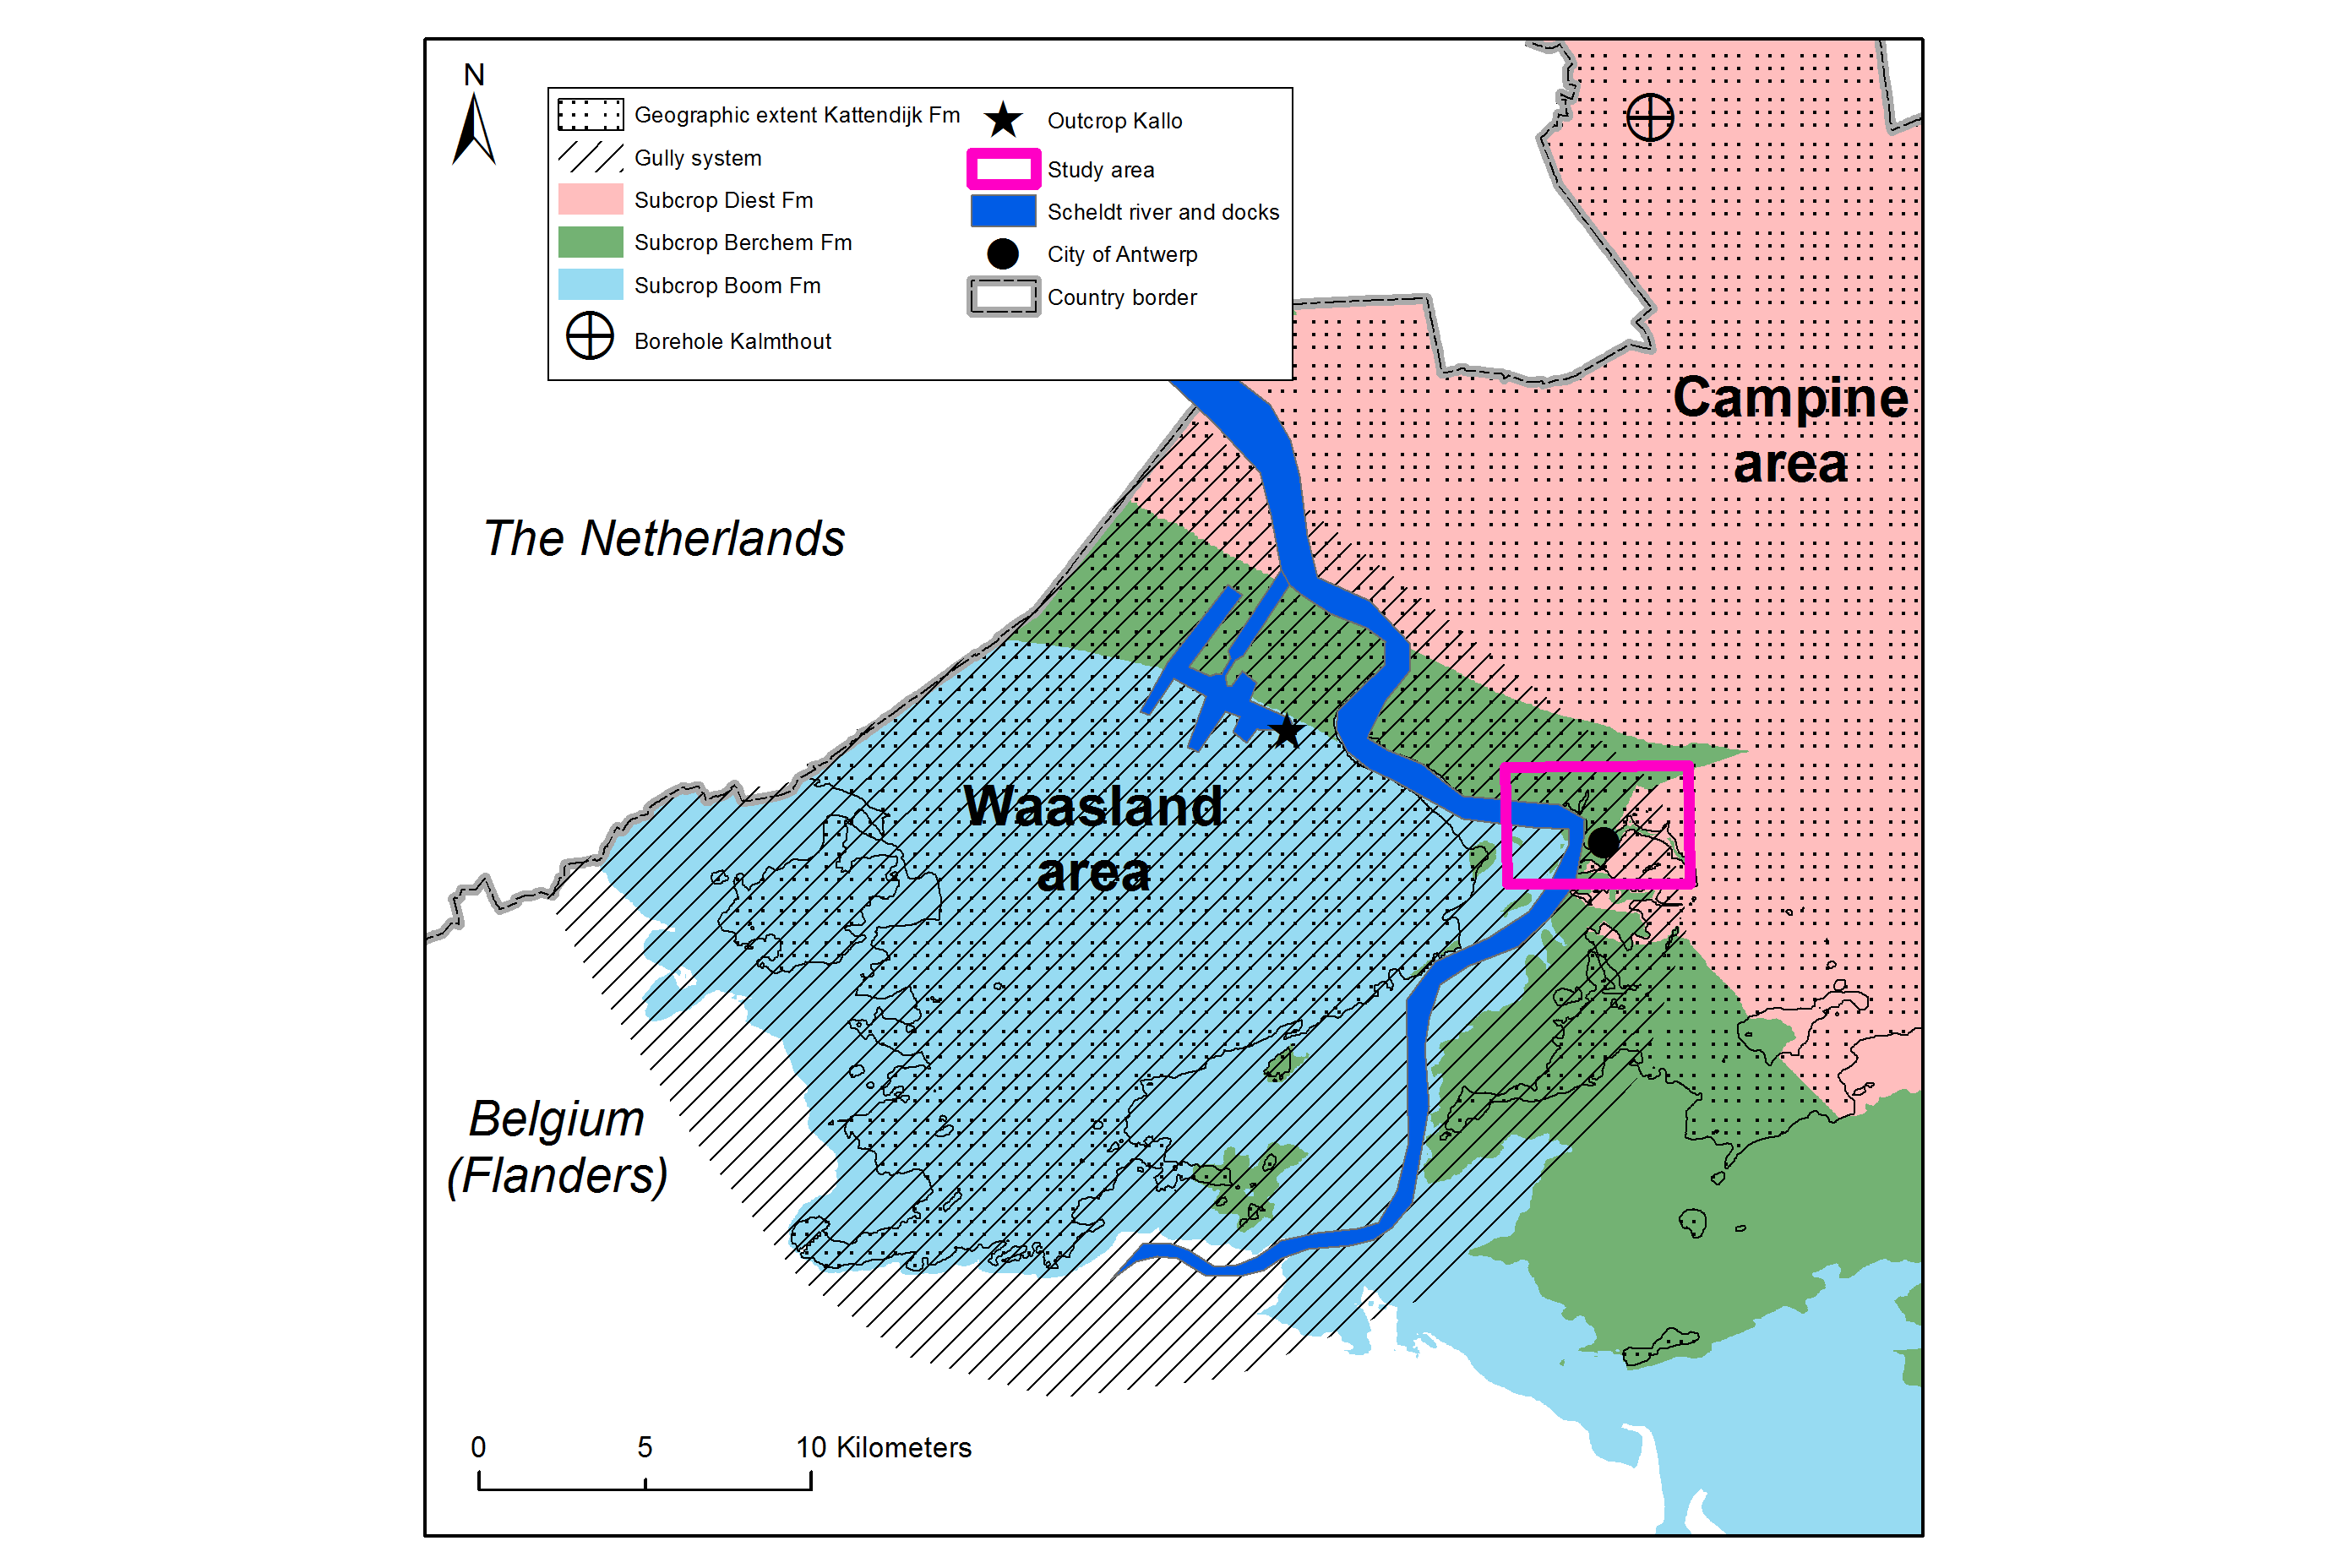
Figure 2. The occurrence of the Kattendijk Formation in the subsurface of Flanders and the gully system at its base in the Waasland area. Note the sharp delimitation of the geographic occurrences of the Diest and Berchem Formations below the base Kattendijk Formation in the large gully system. The geographic extent of the Kattendijk Formation and the subcrops of the Diest, Berchem and Boom Formations underneath the Kattendijk Formation (or Quaternary) are extracted and locally modified from the G3Dv3-model of Flanders (Deckers et al., 2019). The Kalmthout borehole and temporary outcrops near Kallo are indicated as well as the study area (Fig. 3).
2A dense network of cone penetration tests (CPTs) was created during the expansion of the Antwerp harbor and road network since the second half of the 20th century. When correlated with boreholes, these CPTs can significantly improve the stratigraphic detail (cf. Schiltz, 2020, this volume). In a recent effort to create a detailed, parameterized 3D model of the region around Antwerp (Van Haren et al., in prep.), a large number of CPTs was interpreted for, a.o., the Kattendijk Formation. For the purpose of this study, some of these CPT-interpretations will be shown in an east-west CPT correlation profile north of the city of Antwerp, thereby providing a first detailed overview of the unconformity at the base Kattendijk in the area. The purpose of this study is to describe and discuss the base Kattendijk unconformity in order to gain a better insight of the early Pliocene depositional evolution at the southern margin of the North Sea Basin.
2. The Kattendijk Formation
2.1. Lithostratigraphy and historical background
3The Kattendijk Formation was introduced by De Meuter & Laga (1976) as a fine-grained to medium fine-grained, glauconitic sand with a varying clay admixture. The color varies between dark grey to green-grey. The polychaete Ditrupa sp. can be locally abundant. Mollusks and brachiopods are present and are often concentrated in layers (Marquet, 1984). The basal gravel consists of rounded quartz and flint together with shark teeth, phosphatic nodules and rounded bones. The Kattendijk Formation is not divided into members, and rests unconformably on Miocene (Diest and Berchem Formations) or Oligocene deposits (Boom Formation; see a.o. Laga, 1971; De Meuter et al., 1976). The unit is unconformably covered by the Lillo Formation. The Kattendijk Formation reaches an average thickness of circa 10 m and does not crop out. It is recorded in the ‘Waasland area’ in the west, the Antwerp area and the northern Campine area further east (Fig. 2).
4The Kattendijk Formation was named after the hamlet Kattendijk, located north of the city of Antwerp, where the Kattendijk dock and sluice were constructed, i.e. the southern part of the Antwerp harbor. However, the type section was a temporary outcrop made for another dock (the ‘Verbindingsdok’) and was described by Cogels (1874; for location see Fig. 3). The latter author called the deposits ‘Sables à Isocardia cor’ and incorporated the unit in the ‘Système Scaldisien’, overlain by the ‘Système Diestien’. He described the ‘Sables à Isocardia cor’ as a grey-green sandy unit, locally with a yellowish or brownish appearance. Cogels (1874) described in detail the mollusks recovered in specific levels of the unit, however without providing much stratigraphical detail. Halet (1935) renamed the unit as ‘Zone à Isocardia cor and Terebratula perforata’ and regarded it as the upper part of the Pliocene ‘Diestien’ stage. De Heinzelin (1955) confirmed the observations of Cogels (1874) and Halet (1935), renamed the unit as ‘Horizon de Kattendijk’ with a basal gravel consisting of rounded mollusks and the terebratulid brachiopod Pliothyrina, and considered it as the lower part of the lower Pliocene ‘Scaldisien’ stage. Based on geometrical grounds, Gulinck (1962) proposed a correlation of the Kattendijk Formation with the unfossiliferous Kasterlee Formation in the Campine area east of Antwerp, an assumption that was followed on geological maps and in the literature (e.g. De Meuter & Laga, 1976; Vandenberghe et al., 1998, 2004). Based on a biostratigraphical analysis using dinoflagellate cysts, Louwye et al. (2007) refuted this correlation and proposed a late Miocene age for the Kasterlee Formation (see also Vandenberghe et al., 2020, this volume).
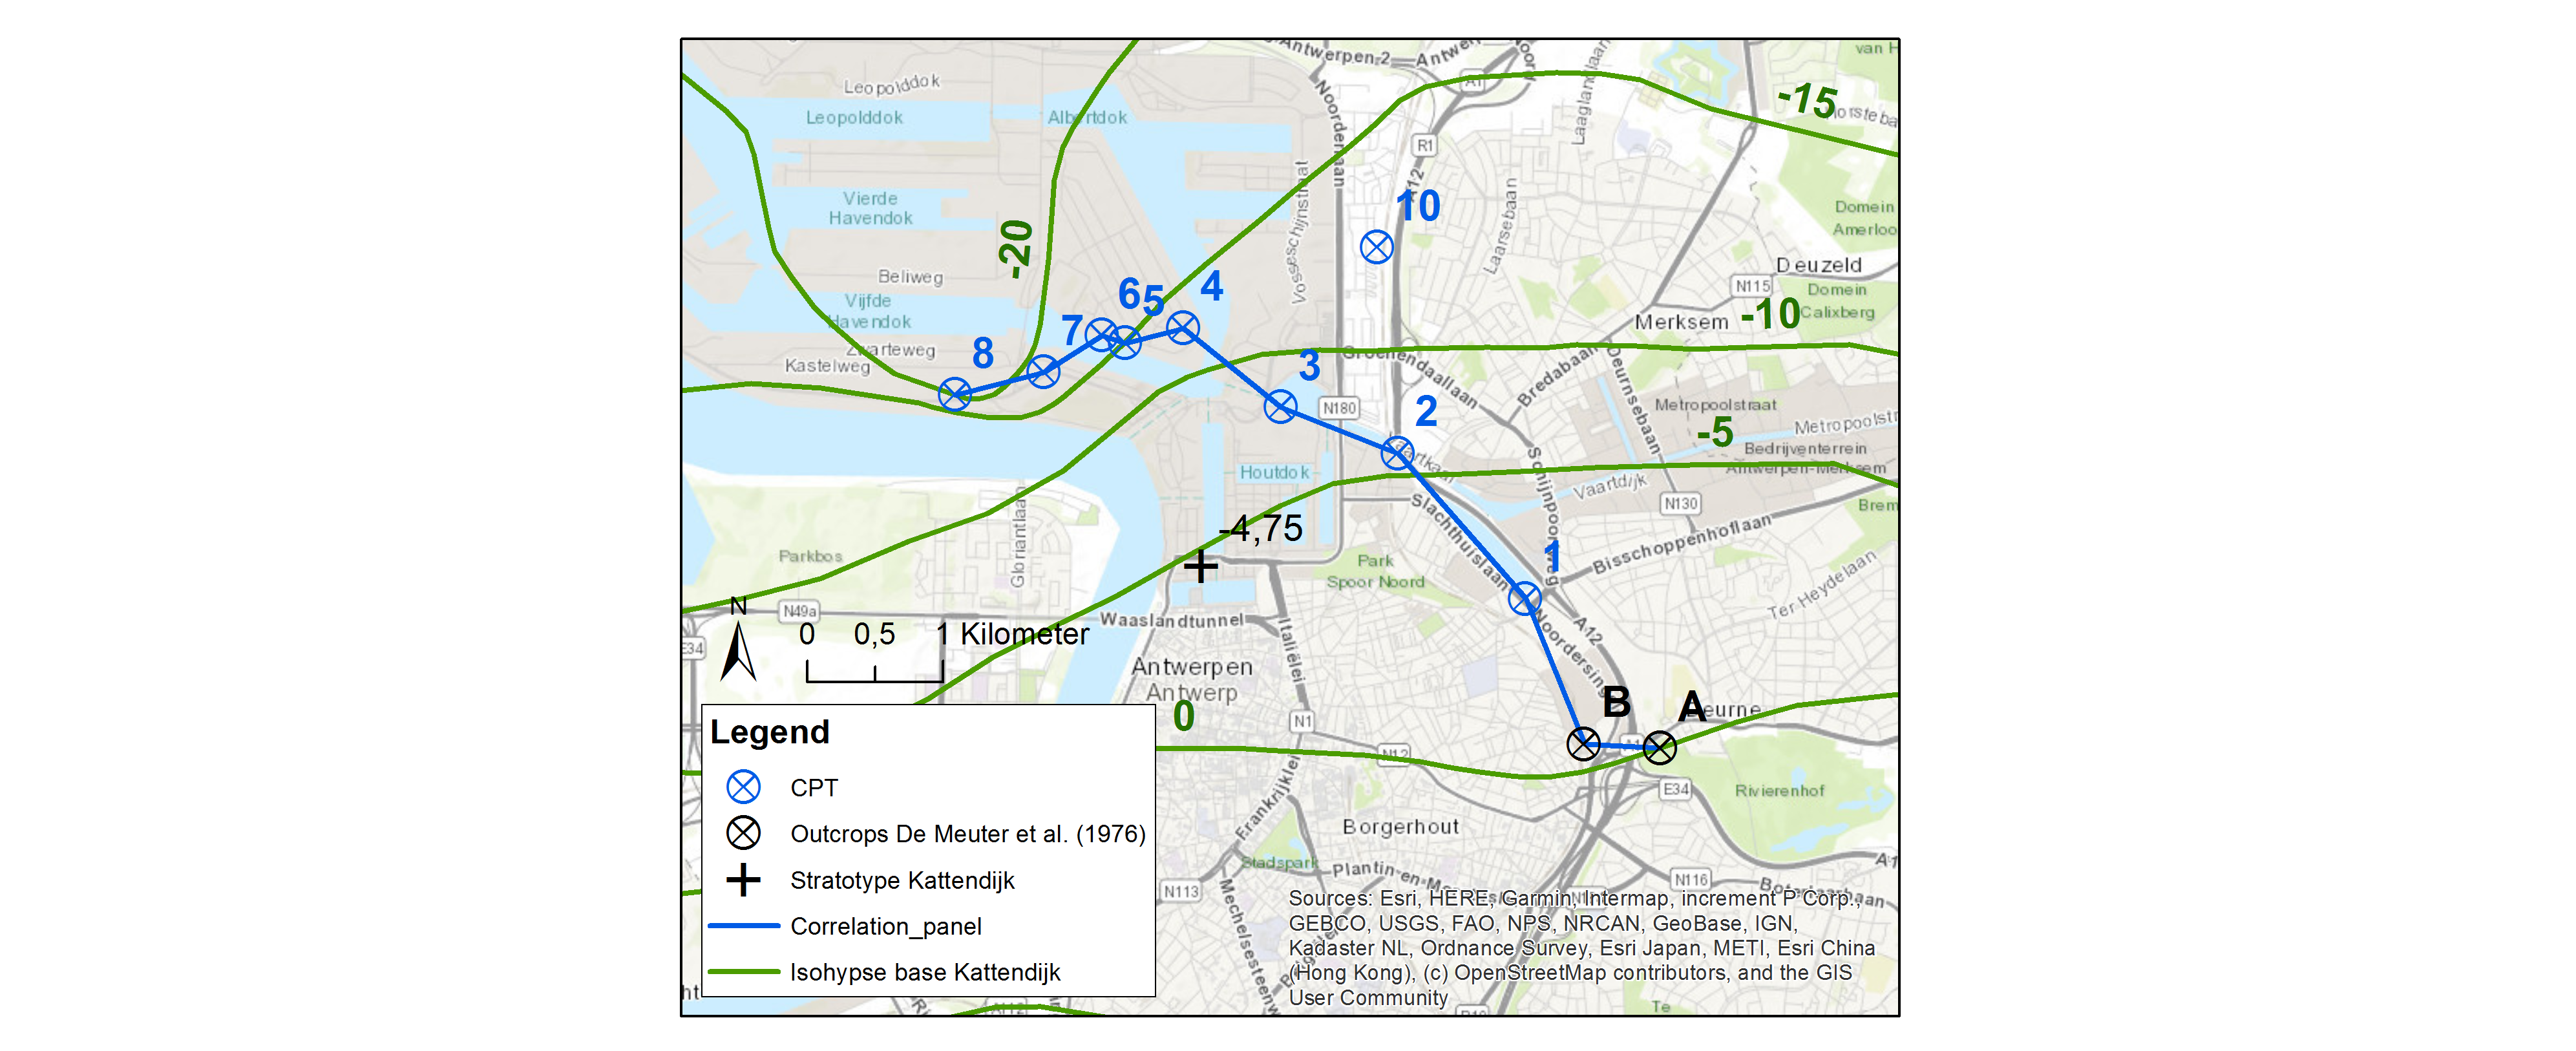
Figure 3. The study area with the location of the CPT correlation profile (see Fig. 5). The location and depth of the base of the Kattendijk Formation at the stratotype of the Kattendijk Formation are indicated. The isohypses of the base of the Kattendijk Formation are simplified after Van Haren et al. (in prep.). CPTs from the correlation profile are number from 1 to 8: 1=GEO-14/013-S105; 2=GEO-11/062-S6; 3=GEO-12/132-S70; 4=GEO-90/154-SII(KAAI103); 5=GEO-95/004-SVII; 6=GEO-95/004-SIX; 7=GEO-12/132-S34; 8=GEO-12/132-S9diep. The CPT/borehole of Figure 4 is given the number 10. Temporary outcrops described by De Meuter et al. (1976): A = Borgerhout-Rivierenhof (VII B.R.), DOV kb15d28e-B579; B = Antwerpen-Schijnpoort (II A.S.), DOV kb15d28e-B583.
2.2. Biostratigraphy
5De Meuter & Laga (1976) reported the Monspeliensina pseudotepida – Florilus boueanus benthic foraminifera Zone in the Kattendijk Formation and placed the zone in the lower Pliocene series. This zone is restricted to the Kattendijk Formation. Doppert et al. (1979) renamed the biozone as BFN4 without altering the definition of the zone. The Kattendijk Formation was subsequently analyzed with benthic foraminifera by Willems et al. (1988) who recognized the (latest Miocene)–lowest Pliocene B10 Zone. The planktonic foraminifera (Hooyberghs & Moorkens, 1988) indicate correlation with the lower Pliocene NPF16 Neogloboquadrina atlantica Zone, defined by Spiegler et al. (1988). This zone equates roughly zones N18 to N19 of Blow (1979). The NPF 16 Zone, together with the benthic mollusk Zone BM21C (Hinsch, 1988), the Gadidae otoliths Zone 17 (Gaemers, 1988) are indicative of a Zanclean age for the Kattendijk Formation. The oldest inferred age for the Kattendijk Formation is related to the recognition of Miocene-Pliocene Pteropod Zone 21 by Janssen & King (1988). The ostracods were analyzed by Gramann & Uffendorfe (1988) and allowed a correlation of the Kattendijk Formation, and the superjacent Lillo Formation, with the Pliocene Loxoconcha bitruncata – Muellerina lacunosa Zone. Spiegler (2001) recognized in the Kattendijk Formation the lower part of the Bolboforma costairregularis Zone, and suggested an age not younger than 4.1 Ma. The diversity of calcareous nannofossils is poor in the Kattendijk Formation. Only the presence of Reticulofenestra minutula allowed to infer an age younger than late Miocene (Verbeek et al., 1988).
6The dinoflagellate cysts and other marine palynomorphs from the Kattendijk Formation were for the first time analyzed in a low-resolution study of the Kalmthout borehole by Louwye & Laga (1998; for location see Fig. 2). They identified the upper Zanclean to Lower Pleistocene Melitasphaeridium choanophorum Zone of Powell (1992) and the upper Miocene – Pliocene Achomosphaera andalousiensis Zone of Manum et al. (1989). Louwye et al. (2004) studied the Kattendijk Formation in greater detail in two temporary outcrops during the construction of the Verrebroeck and Deurganck docks in the Antwerp harbor. The Kattendijk Formation holds the age diagnostic dinoflagellate cysts Operculodinium tegillatum (calibrated lowest occurrence at 5.0 Ma) and Reticulatosphaera actinocoronata (calibrated highest occurrence at 4.4 Ma) and an early Zanclean age was inferred. In a follow-up study, De Schepper et al. (2009) analyzed the Kattendijk Formation for marine palynomorphs from the temporary outcrop during the construction of the Tunnel-Canal Dock in Antwerp. Their general age assessment—deposition between 5 Ma and 4.7–4.4 Ma—was similar, but they indicated that the presence of Cyst type I of de Vernal & Mudie (1989) showed a likely depositional range of 4.7–4.4 Ma.
7Munsterman (2019) recently analyzed one sample in the lower few meters of the Kattendijk Formation at a borehole near the Mazurenbrug (1445-GEO-18/132-B5b; see Figs 3 & 4) which he dated older than 4.4 Ma, based on the presence of Operculodinium tegillatum, Reticulatosphaera actinocoronata and Selenopemphix armageddonensis.
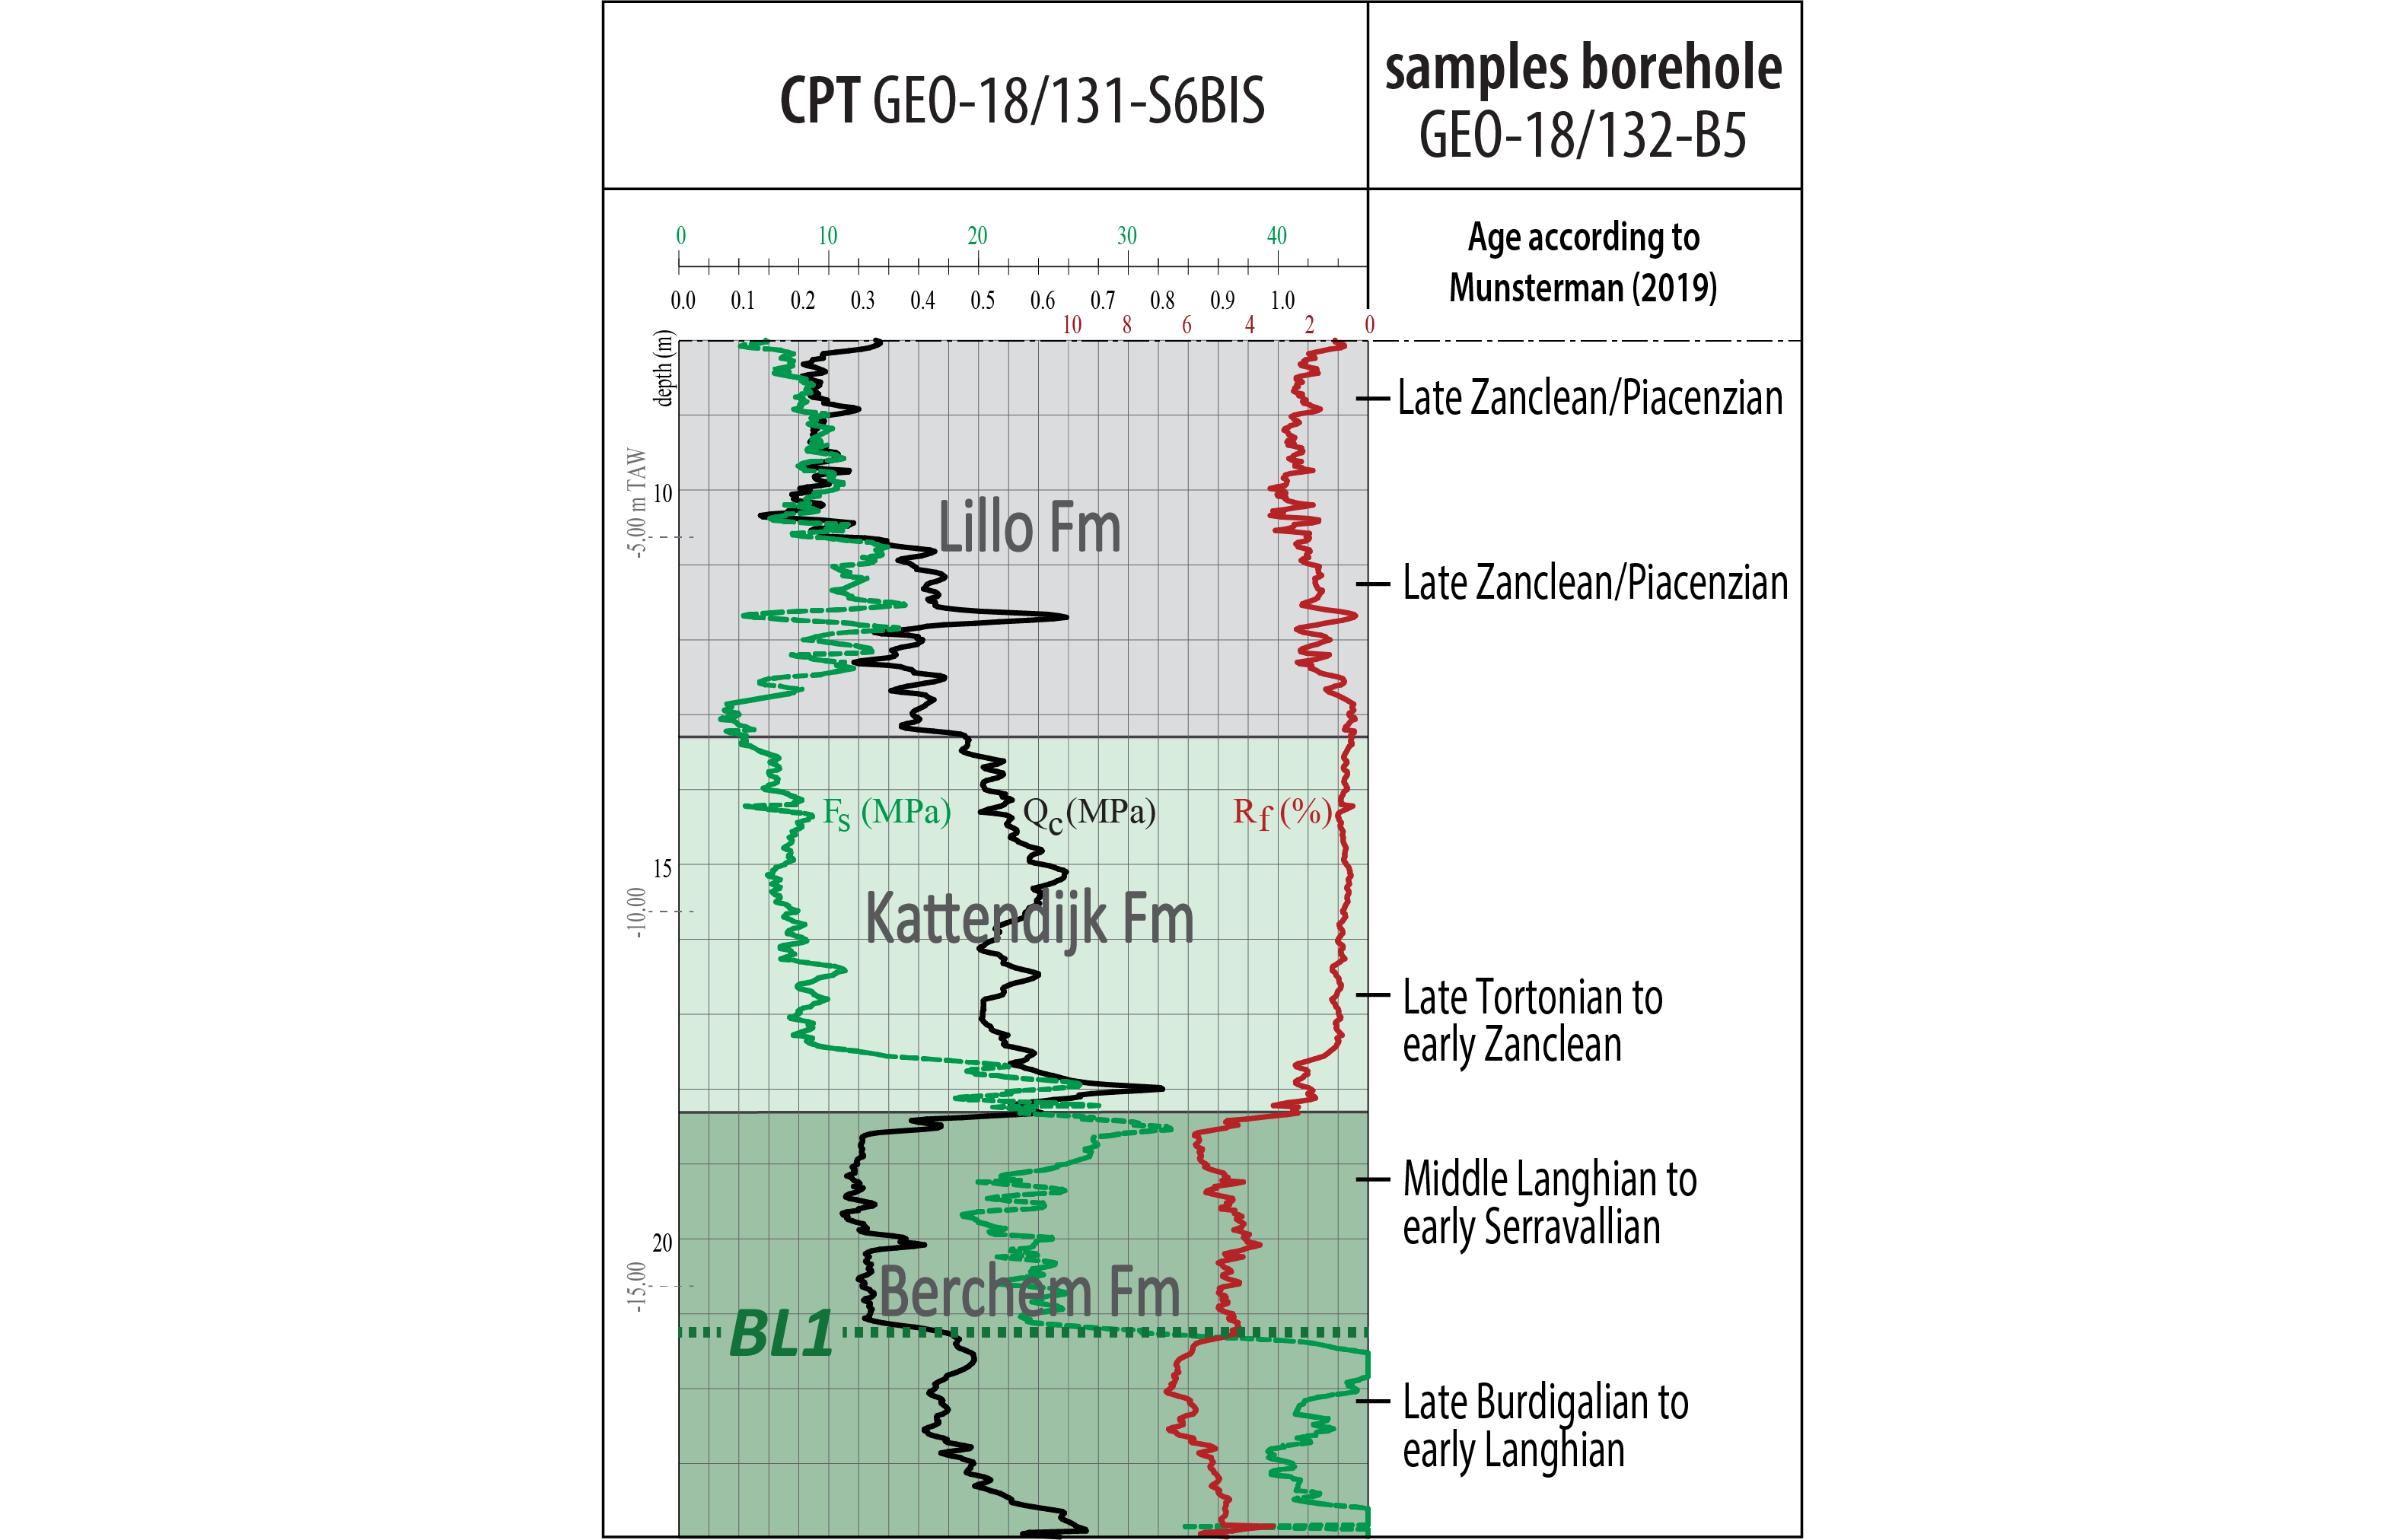
Figure 4. A CPT (GEO-18/131-S6BIS) that is interpreted by correlation with a nearby borehole (1445-GEO-18/132-B5b). Several samples of this borehole are provided with age information based on dinocyst analyses by Munsterman (2019). The location of the CPT/borehole is shown in Figure 3.
3. Dataset and Methods
8Borehole and CPT-data were all extracted from the public DOV-database of Flanders (https://www.dov.vlaanderen.be), northern Belgium. Borehole data includes lithological descriptions and often lithostratigraphic interpretations. The CPT-data includes, a.o., vectorized raw-measurements of Qc-values (cone resistance in MPa), Fs-values (sleeve friction in MPa) and Rf-values (friction ratio in %) and sometimes also lithostratigraphic interpretations. After extracting the data, electric CPTs located along a W-E line north of the city of Antwerp were selected. Although these CPTs were sometimes already interpreted in the DOV-database, most of them were reinterpreted by Van Haren et al. (in prep.). Reinterpretations of the CPTs were based on correlations with borehole interpretations, at the same location or nearby. Figure 4 provides an example of a CPT that was correlated with a nearby borehole. Unlike most other boreholes, however, the borehole of Figure 4 was provided with biostratigraphic age information. Like the CPTs, the boreholes were also provided by interpretations in the DOV-database, but were also frequently reinterpreted by Van Haren et al. (in prep.). The CPTs and boreholes were interpreted for the following formal stratigraphic formations: Boom, Berchem, Diest, Kattendijk and Lillo; and also for the Quaternary.
9Reinterpretation of the boreholes were based on the formal definitions of the lithostratigraphic units by Laga et al. (2001). These formal definitions are, however, based on temporary outcrops and/or good quality boreholes. Most of the available borehole data is unfortunately of lesser quality. Therefore, instead of fulfilling all criteria to attribute an interval to a specific stratigraphic unit, fewer criteria are used in our lower quality borehole data. We systematically used the following criteria for our interpretations of the Kattendijk Formation in boreholes:
-
Grey-green to green color of the sediments. The color of the sediments in the overlying Lillo Formation is generally described as grey or green-grey, while those of the underlying Berchem Formation are described as dark green to black. The color of the sediments of the Deurne Member (Diest Formation) is very similar to those of the Kattendijk Formation.
-
The presence of glauconite (as ‘glauconite-bearing’) is generally mentioned for the Kattendijk Formation. In case percentages are available, they are generally between 15% and 30% (Laga, 1972). In borehole descriptions of the overlying Lillo Formation, glauconite is hardly or only sporadically mentioned, with percentages around and below 10% (Laga, 1972). The underlying Berchem Formation on the other hand is glauconite-rich, with percentages over 30% (Laga, 1972; Louwye et al., 2020, this volume).
-
The abundance of mollusks or presence of shell layers in the Kattendijk Formation is markedly lower than that of the overlying Lillo Formation. Ditrupa, for example, is often mentioned in borehole descriptions and typical for the Kattendijk Formation. Glycymeris on the other hand is typically described to occur abundantly in the underlying Berchem Formation, although they are also mentioned as (often reworked) fragments in the Kattendijk Formation.
-
Often some gravel is mentioned at the base of the Kattendijk Formation. The recognition of this gravel layer is important to identify the boundary with the lithological similar sands of the subjacent Deurne Member (Diest Formation).
10Ten interpreted electric CPTs were selected in order to construct a correlation scheme that runs from east to west north of the city of Antwerp. The location of the CPTs is shown in Figure 3 and their IDs in the caption of the same figure. Because of the long ID’s of the CPTs, they are numbered for the purpose of this study from 1 to 8 (from east to west). On Figure 5, the penetration depths (in TAW or Belgian Ordnance Datum), measurements (Qc, Fs and Rf) and interpretations of the selected CPTs are shown. In the east, the CPTs are correlated with two of the temporary outcrops described by De Meuter et al. (1976) to the northeast of the city of Antwerp, called Borgerhout-Rivierenhof (VII B.R.) and Antwerpen-Schijnpoort (II A.S.; Fig. 5).
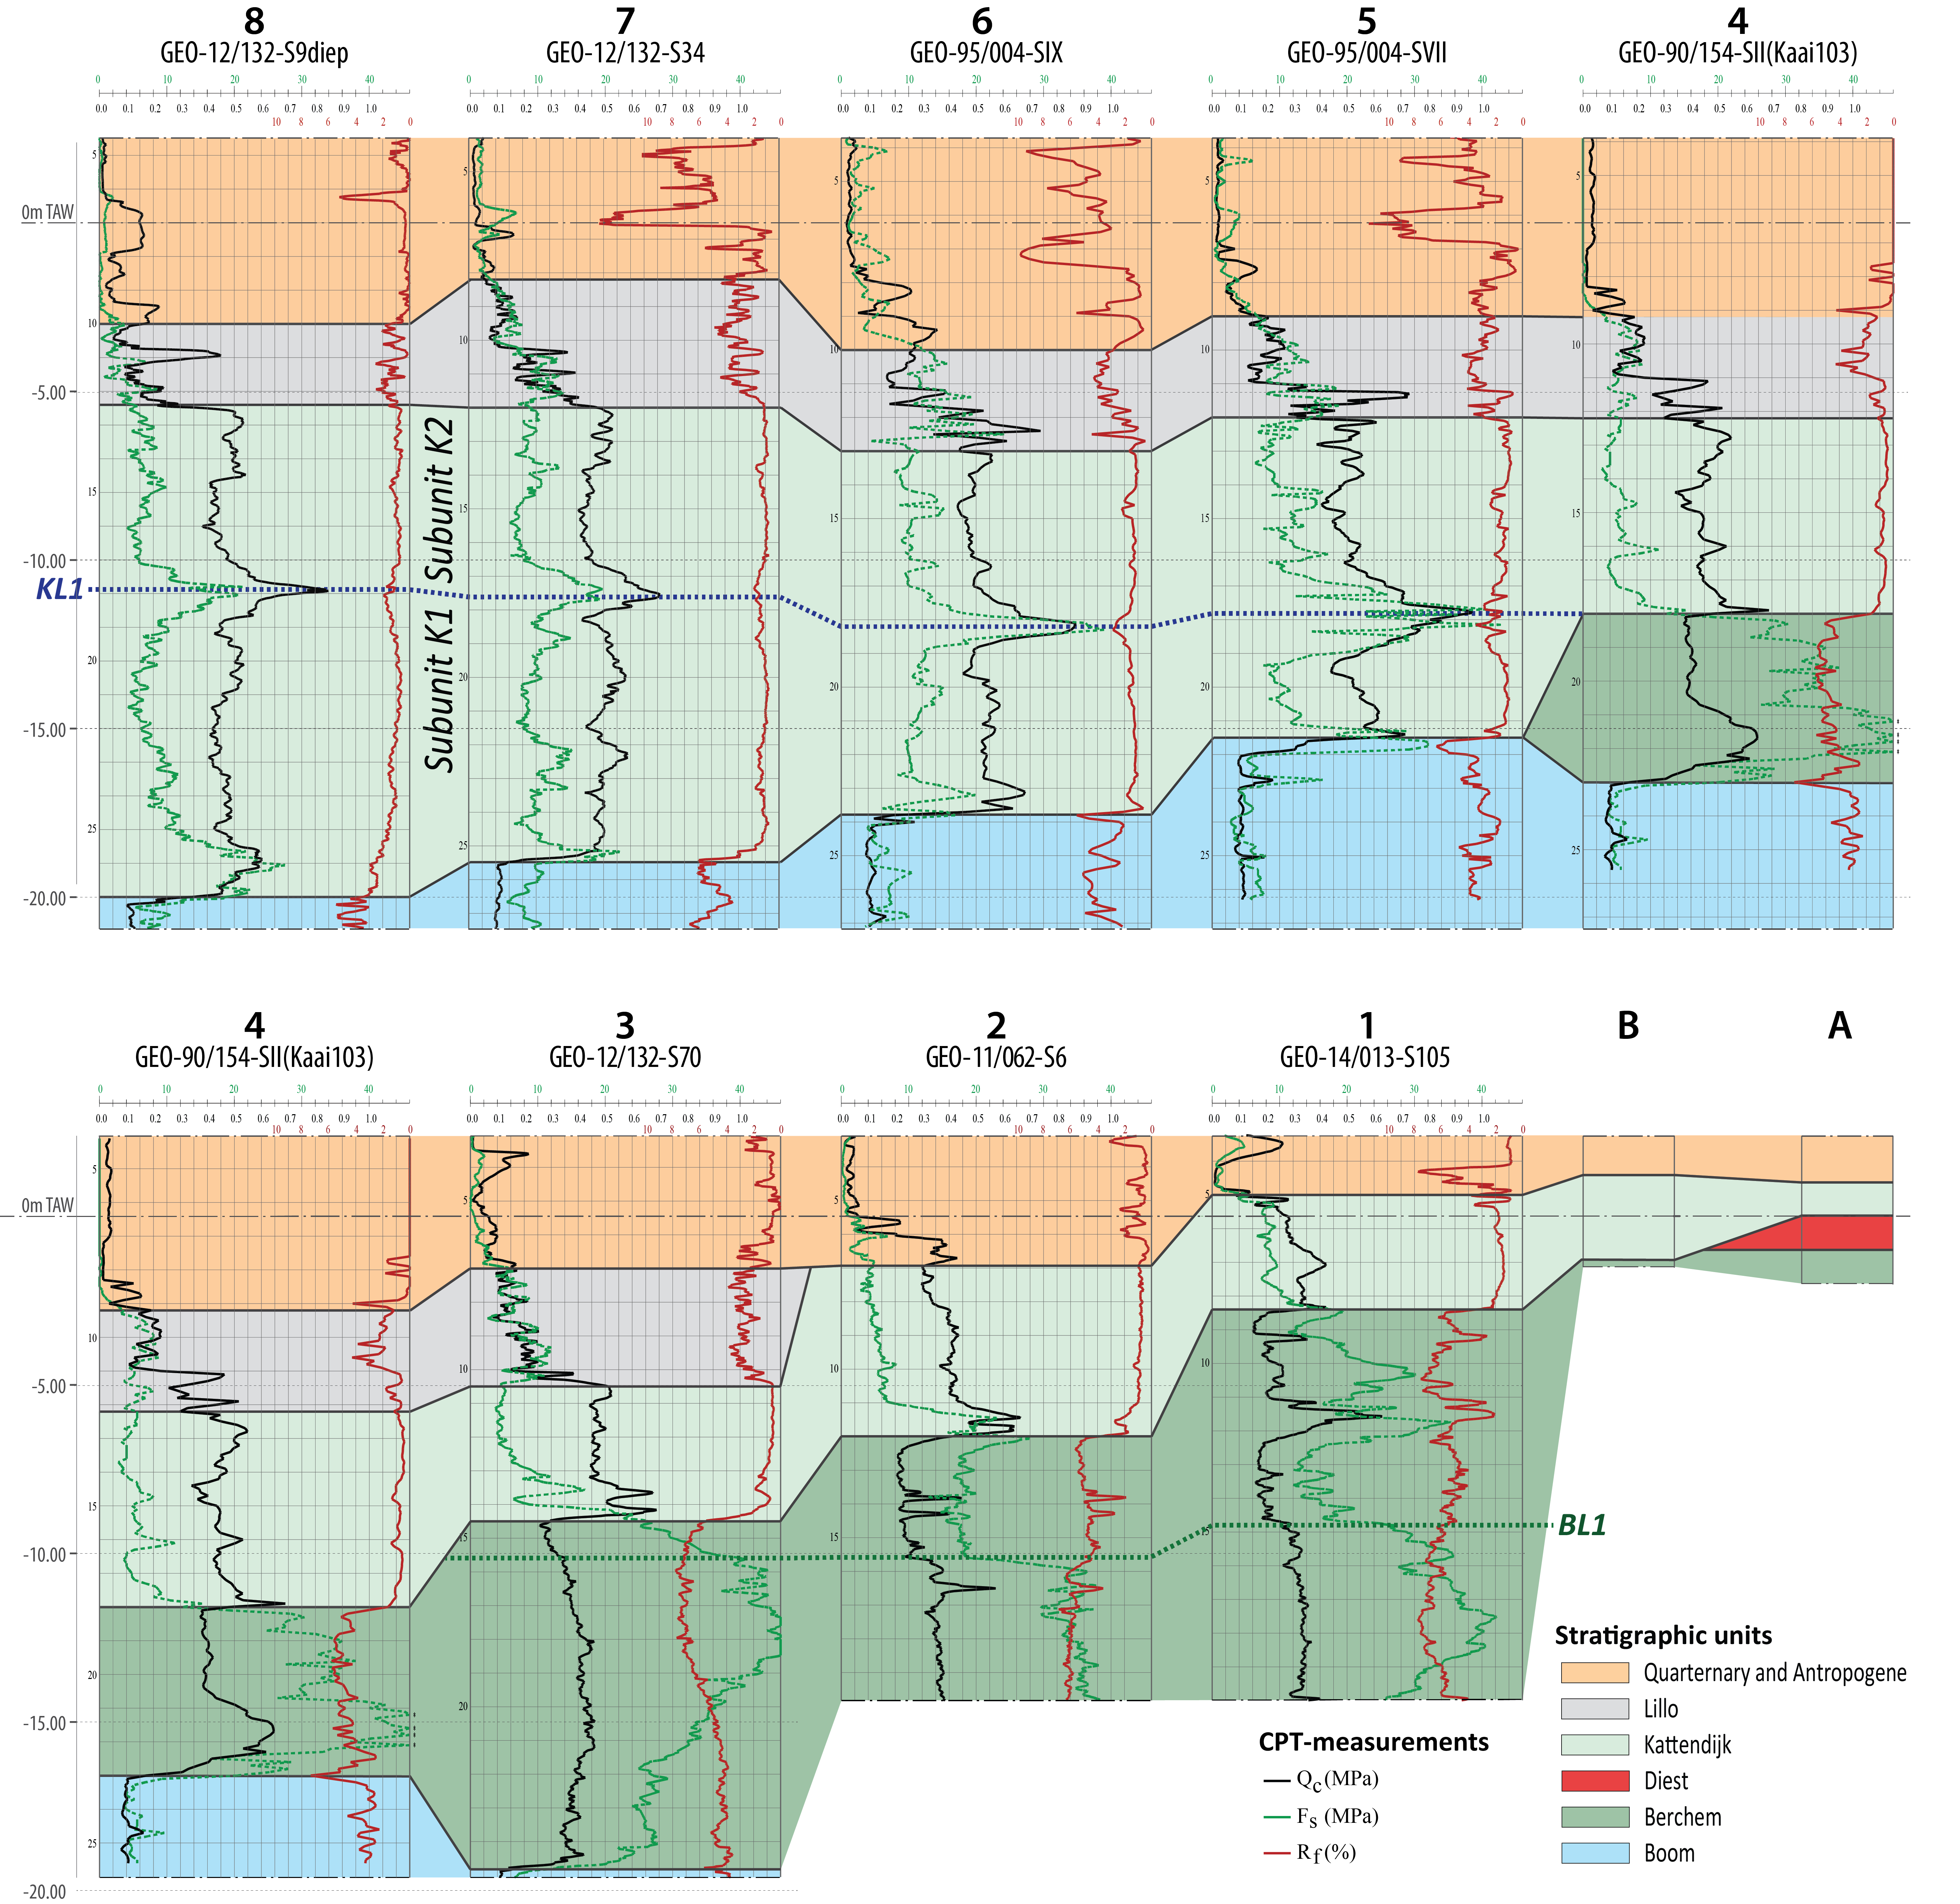
Figure 5. NW-SE correlation profile of the Lower Oligocene to Quaternary units north of the city of Antwerp based on CPTs. Stratigraphic interpretations of temporary outcrops A and B as described by De Meuter et al. (1976) are added. These outcrops show that the Kattendijk Formation also truncates the Diest Formation in western direction. A=Borgerhout-Rivierenhof (VII B.R.), B =Antwerpen-Schijnpoort (II A.S.).
4. Results
4.1. CPT-characterization
11Based on the abovementioned criteria, the Kattendijk Formation was interpreted in a large number of boreholes across and along the CPT-profile. Some of these boreholes are located at the same location as the CPTs and therefore allow perfect correlations between the latter. The correlations between boreholes and CPTs show that the Kattendijk Formation has the following expressions on CPTs (Figs 4 & 5):
-
Qc values. These are in the study area generally higher for the Kattendijk Formation than for the underlying Berchem Formation and overlying Lillo Formation and Quaternary units. Qc-values in the Lillo Formation tend to increase downwards towards the Kattendijk Formation. In the Berchem Formation, Qc-values tend to decrease upwards, with a strong increase below the boundary with the overlying Kattendijk Formation. The highest Qc-values for the Kattendijk Formation generally occur in its basal part (CPTs 2 and 3) and represent the basal transgressive surface which contains coarse quartz and glauconite grains, sandstone pebbles, gravel, phosphate nodules and large shells (reworked Glycymeris).
-
Fs values. These values are generally lower in the Kattendijk Formation than in the Lillo and Berchem Formations, but higher than those of the Quaternary units. The boundaries with the Lillo and Berchem Formations coincide with a lowering and a strong increase in Fs-values, respectively. In the basal part, basal transgressive surface, of the Kattendijk Formation, Fs-values attain similar levels as those of the underlying Berchem Formation.
-
Rf values. Compared to the over- and underlying units, the Rf-values of the Kattendijk Formation are very uniform. Only in its lower part, near its basal transgressive surface, Rf-values tend to change, i.e., decrease. The Rf-values of the Lillo and Berchem Formations are also generally higher, reflecting the higher clay content of the former and the higher glauconite content of the latter.
4.2. CPT-correlation profile
12In the greater part of the study area, the Kattendijk Formation is overlain by the Lillo Formation (Figs 4 & 5). In those cases, the Kattendijk Formation reaches a thickness of 4 m in the east (CPT 4) and up to 15 m in the west (CPT 8). In the east, the Lillo Formation is locally removed by Quaternary erosion. Consequently, the top of the Kattendijk Formation becomes truncated by the Quaternary. Truncation reduces the thickness of the Kattendijk Formation to only 1 meter in outcrop A.
13In most of the cross-sections, except at the western and eastern extremes, the Kattendijk Formation overlies the Berchem Formation which in turn overlies the Boom Formation (Fig. 5). Within the Berchem Formation, a two-fold subdivision was observed on the CPTs. A lower part with relatively high Qc- and Rf-values that decrease towards the upper part. At the boundary between both parts of the Berchem Formation, a reference horizon BL1 was defined for this study (Figs 4 & 5). The parts of the Berchem Formation under- and overlying horizon BL1 will hereafter be referred to as subunit B1 and B2, respectively. Whereas the base of the Kattendijk Formation descends in a western direction from roughly -3 m TAW towards -9 m TAW between CPT’s 1 and 3, horizon BL1 only descends from -9.5 m TAW towards -10 m TAW between the same CPT’s. This shows that the Kattendijk Formation truncates the Berchem Formation in western direction. Subunit B2 of the Berchem Formation reaches in the east a thickness of almost 6.5 m (CPT 1), while this entire subunit in the west is removed. In the west (CPT’s 5-8), subunit B1 of the Berchem Formation is also removed, so that the Kattendijk Formation directly overlies and truncates the Boom Formation.
14The easternmost part of the correlation profile (Fig. 5) covers the district of Borgerhout where De Meuter et al. (1976) described a temporary outcrop A (Borgerhout-Rivierenhof VII B.R.; DOV kb15d28e-B579) in which the Kattendijk and Berchem Formations are separated by 1 m of the Diest Formation (Deurne Member; for location of the outcrops, see Fig. 3). In another temporary outcrop B further west (Antwerpen-Schijnpoort II A.S.; DOV kb15d28e-B583), the Diest Formation was not encountered in between the Kattendijk and Berchem Formations by De Meuter et al. (1976). The results of this study show that the absence of the Diest Formation was most likely the result of truncation below the Kattendijk Formation in a western direction (Fig. 5).
15In the eastern and central parts of the correlation profile, from CPT 1 to CPT 4, the Kattendijk Formation more or less gradually dips in western direction from -3 m TAW in the east to -12 m TAW in the west across a distance of 3.3 km, thereby removing subunit B2 of the Berchem Formation (Fig. 5). At this part of the profile, the Kattendijk Formation attains a uniform thickness of about 4 to 6 m below the Lillo Formation. In the western part of the correlation profile, the westwards dip of the Kattendijk Formation is stronger as it descends from -12 m TAW to -20 m TAW across a distance of only 1.8 km (from CPT 4 to CPT 8), thereby removing the entire subunit B1 of the Berchem Formation. The stronger westward dip of the base coincides with a westward increase in thickness of the Kattendijk Formation, from the uniform 4 to 6 m in the center below the Lillo Formation towards almost 15 m in the western correlation profile (CPT 8). The amount of westwards descend of its base roughly matches the thickness increase of the Kattendijk Formation.
16Despite the thickness changes, the CPT-signature of the Kattendijk Formation remains overall very uniform across the correlation profile. In more detail, however, in the westernmost part, the Kattendijk Formation shows a horizon at about 5 to 6 m below its top with relatively high Qc- and Fs-values and subtly lower Rf-values, hereafter called KL1 (Fig. 5). Borehole descriptions indicate that the characteristically high Qc-values of KL1 seem to be caused by the coarser grain size (near CPT 8) and the concentration of large shells (large fragments of Glycymeris and oysters near CPT 7). Horizon KL1 can be traced across the correlation profile and correlates further east with the basal part of the Kattendijk Formation, which also shows higher Qc- and Fs-values and subtly lower Rf-values.
17This indicates a two-fold subdivision in the Kattendijk Formation, separated by KL1. The parts of the Kattendijk Formation below and on top of KL1 will hereafter be called units K1 and K2, respectively. While unit K2 is present throughout the correlation profile, with thicknesses of about 6 m in the west to 4 m in the center below the Lillo Formation, unit K1 is only present in the western part of the correlation profile. K1 appears below unit K2 at the start of the strong descend of the base of the Kattendijk Formation (west of CPT 4) and reaches its largest thickness of almost 9 m at the location where the base of the Kattendijk Formation reaches its maximum depth, namely -20 m TAW at CPT 8. Unit K1 therefore appears the result of infilling of the additional incision in the west. On top of unit K1, unit K2 attains a rather uniform thickness between 5 and 6 m and depth of -11 to -13 m TAW. Further east, where unit K1 is absent (CPTs 1 to 5), unit K2 gradually decreases in thickness and depth in eastern direction.
5. Discussion
5.1. Gullies at the base and subdivision of the Kattendijk Formation
18The results show a detailed expression of a truncation at the base of the early Pliocene Kattendijk Formation north of the city of Antwerp along an east-west oriented CPT transect (Figs 3 & 5). The base of the Kattendijk Formation deepens from 0 m TAW in temporary outcrops as described by De Meuter et al. (1976) in the east to -20 m TAW in the west, across a distance of only about 6.5 km (Fig. 5). It thereby progressively incises older strata in a western direction: from the upper Miocene Diest Formation in the eastern limit to the middle to lower Miocene Berchem Formation in the center and finally to the lower Oligocene Boom Formation in the west. The incision appears part of a large gully: our profile covers the southern to southeastern flank. This is supported by a NNW-SSE cross-section from the city of Antwerp in the south towards the Dutch border in the north by Laga (1983) on which the base of the Kattendijk Formation forms an about 8 km wide gully incision into the underlying Miocene down to the top of the Boom Formation just to the northwest of the city of Antwerp. North of this gully, the Berchem Formation reappears below the base of the Kattendijk Formation, however with reduced thicknesses (10 m) compared to the city of Antwerp (20 m). This suggests that the gully to the northwest of the city of Antwerp is part of an even larger gully system. Geological maps indeed indicate a 20 km wide region between the city of Antwerp up to at least the Dutch border where the base of the Kattendijk Formation progressively truncates older strata in western direction (Fig. 2; Matthijs et al., 2013; Deckers et al., 2019). In the Waasland area or the western part of the gully system (for location see Fig. 2), Miocene units are completely eroded and the Kattendijk Formation directly overlies the Boom Formation (Laga, 1971).
19The CPT-correlation of this study indicates that the gully incision by the Kattendijk Formation was not gradual. Truncation in the east was more or less gradual at a rate of 9 m across a distance of 3.3 km, while further west 8 m of sand was removed across a distance of only 1.8 km (Fig. 5). In the strongest incised area two sequences were identified within the Kattendijk Formation. The lower sequence was deposited only within the deepest part of the gully itself, thus representing the gully infill. This sequence had a maximum thickness of almost 9 m at the location of maximum incision. The upper sequence was deposited across the broader area, with more uniform thicknesses ranging from 4 m on the flanks of the gully towards 6 m on top of the deepest gully at the base of the Kattendijk Formation. The base of the upper sequence shows consistently high Qc-values on CPTs, which according to correlations with boreholes, coincide with coarser-grained sediments (quartz and glauconite) and increased presence of shelly material. Where the upper sequence of the Kattendijk Formation directly overlies the Berchem or Diest Formations, the basal gravel layer contains flint and sandstone pebbles, reworked shells, bones and shark teeth (De Meuter et al., 1976). This basal gravel layer is interpreted as a basal transgressive surface of the upper sequence of the Kattendijk Formation. The lower sequence of the Kattendijk Formation also has a basal gravel layer that holds sometimes large, reworked septaria from the underlying Boom Formation (Jansen, 1974). This basal gravel layer is considered the basal transgressive surface of the lower sequence of the Kattendijk Formation. It is thus shown that the Kattendijk Formation was deposited in two transgressive pulses. During initial transgression, deposition was restricted to the deep erosional gullies. During subsequent transgression, deposition took place in a broader, shallower gully on top and along the flanks of the deeper gullies.
20Also further east of the study area (in the northern Roer Valley Graben and Campine area; for location see Fig. 6) a two-fold subdivision was observed in more proximal lower Pliocene stratigraphic succession of the Oosterhout Formation by Munsterman et al. (2019). The latter authors identified a lower glauconite-poor unit, called the Goirle Member, and an upper glauconite-rich unit, called the Tilburg Member. The latter member is lithologically similar to the Kattendijk Formation. In our study area, however, no lithological difference was noted between the lower and upper sequences of the Kattendijk Formation. For this reason, we do not see the need to introduce the two newly identified sequences of the Kattendijk Formation as separate lithostratigraphic units.
5.2. Possible mechanism of gully formation
21In a temporary outcrop of the Kattendijk Formation near Kallo in the east of the Waasland area (for location see Fig. 2), Gaemers (1975) described the presence of several gullies within the upper part of the Kattendijk Formation, albeit with smaller amplitudes (3 m deep and more than 133 m wide), filled by cross-bedded sediments. His paleobiological study suggested deposition of the Kattendijk Formation in an open marine environment with estimated water depths of 30 to 50 m or even more. Bivalve species of the Kattendijk Formation show a similar paleobathymetry (45–55 m; Marquet, 2004). This shows that the structures reported by Gaemers within the Kattendijk Formation are a submarine feature, most likely initiated by strong submarine currents (Gaemers, 1975). Deposition under strong current activity is in agreement with the observed oblique- or cross-stratification in the Kattendijk Formation in the outcrop near Kallo (Gaemers, 1975) and at the Verrebroek Dock (Louwye et al., 2004). Such strong currents could explain the presence of dinoflagellate cysts with outer neritic to oceanic affinities within the otherwise near-coastal deposits of the Kattendijk Formation (Louwye et al., 2004). We consider it likely that strong current activity also caused the gully complex at the base of the Kattendijk Formation as observed in this study and as shown in the abovementioned geological maps of the area. Initial incision might have been caused by river drainage systems during the major latest Miocene sea-level fall (up to 50 m according to Miller et al., 2005), followed by widening and deepening of the channels as they were transgressed during the early Pliocene sea-level rise. A similar mechanism was used to explain the even larger channel system that developed during the latest middle to earliest late Miocene in the Hageland area, southeast of the study area by Houthuys (2014) and Vandenberghe et al. (2014). The latter authors discuss how after the latest middle Miocene sea-level fall with river drainage, early late Miocene marine ingression into the fluvial or estuarine channels enabled their further widening and deepening into a major gully system. In this system, the upper Miocene Diest Formation was deposited. As is the case for the Kattendijk Formation, the Diest Formation was deposited by strong, tidal current activity at water depths of up to 50 m (Houthuys, 2014). The northwest shift of the gully systems from the Hageland area to the Waasland area might be related to a similar northwest shift of the delta systems that filled the southern North Sea from the southeast. These delta systems restricted the erosive marine currents, and the related marine gully systems, to the area northwest of them. The middle Miocene delta system was located just southeast of the Hageland area (green area on Fig. 6A; Deckers & Munsterman, 2020; Louwye et al., 2020, this volume), whereas the presumed latest Miocene delta system was located northeast of the city of Antwerp, in the Campine area (green area on Fig. 6B; Vandenberghe et al., 2014; Munsterman et al., 2019).
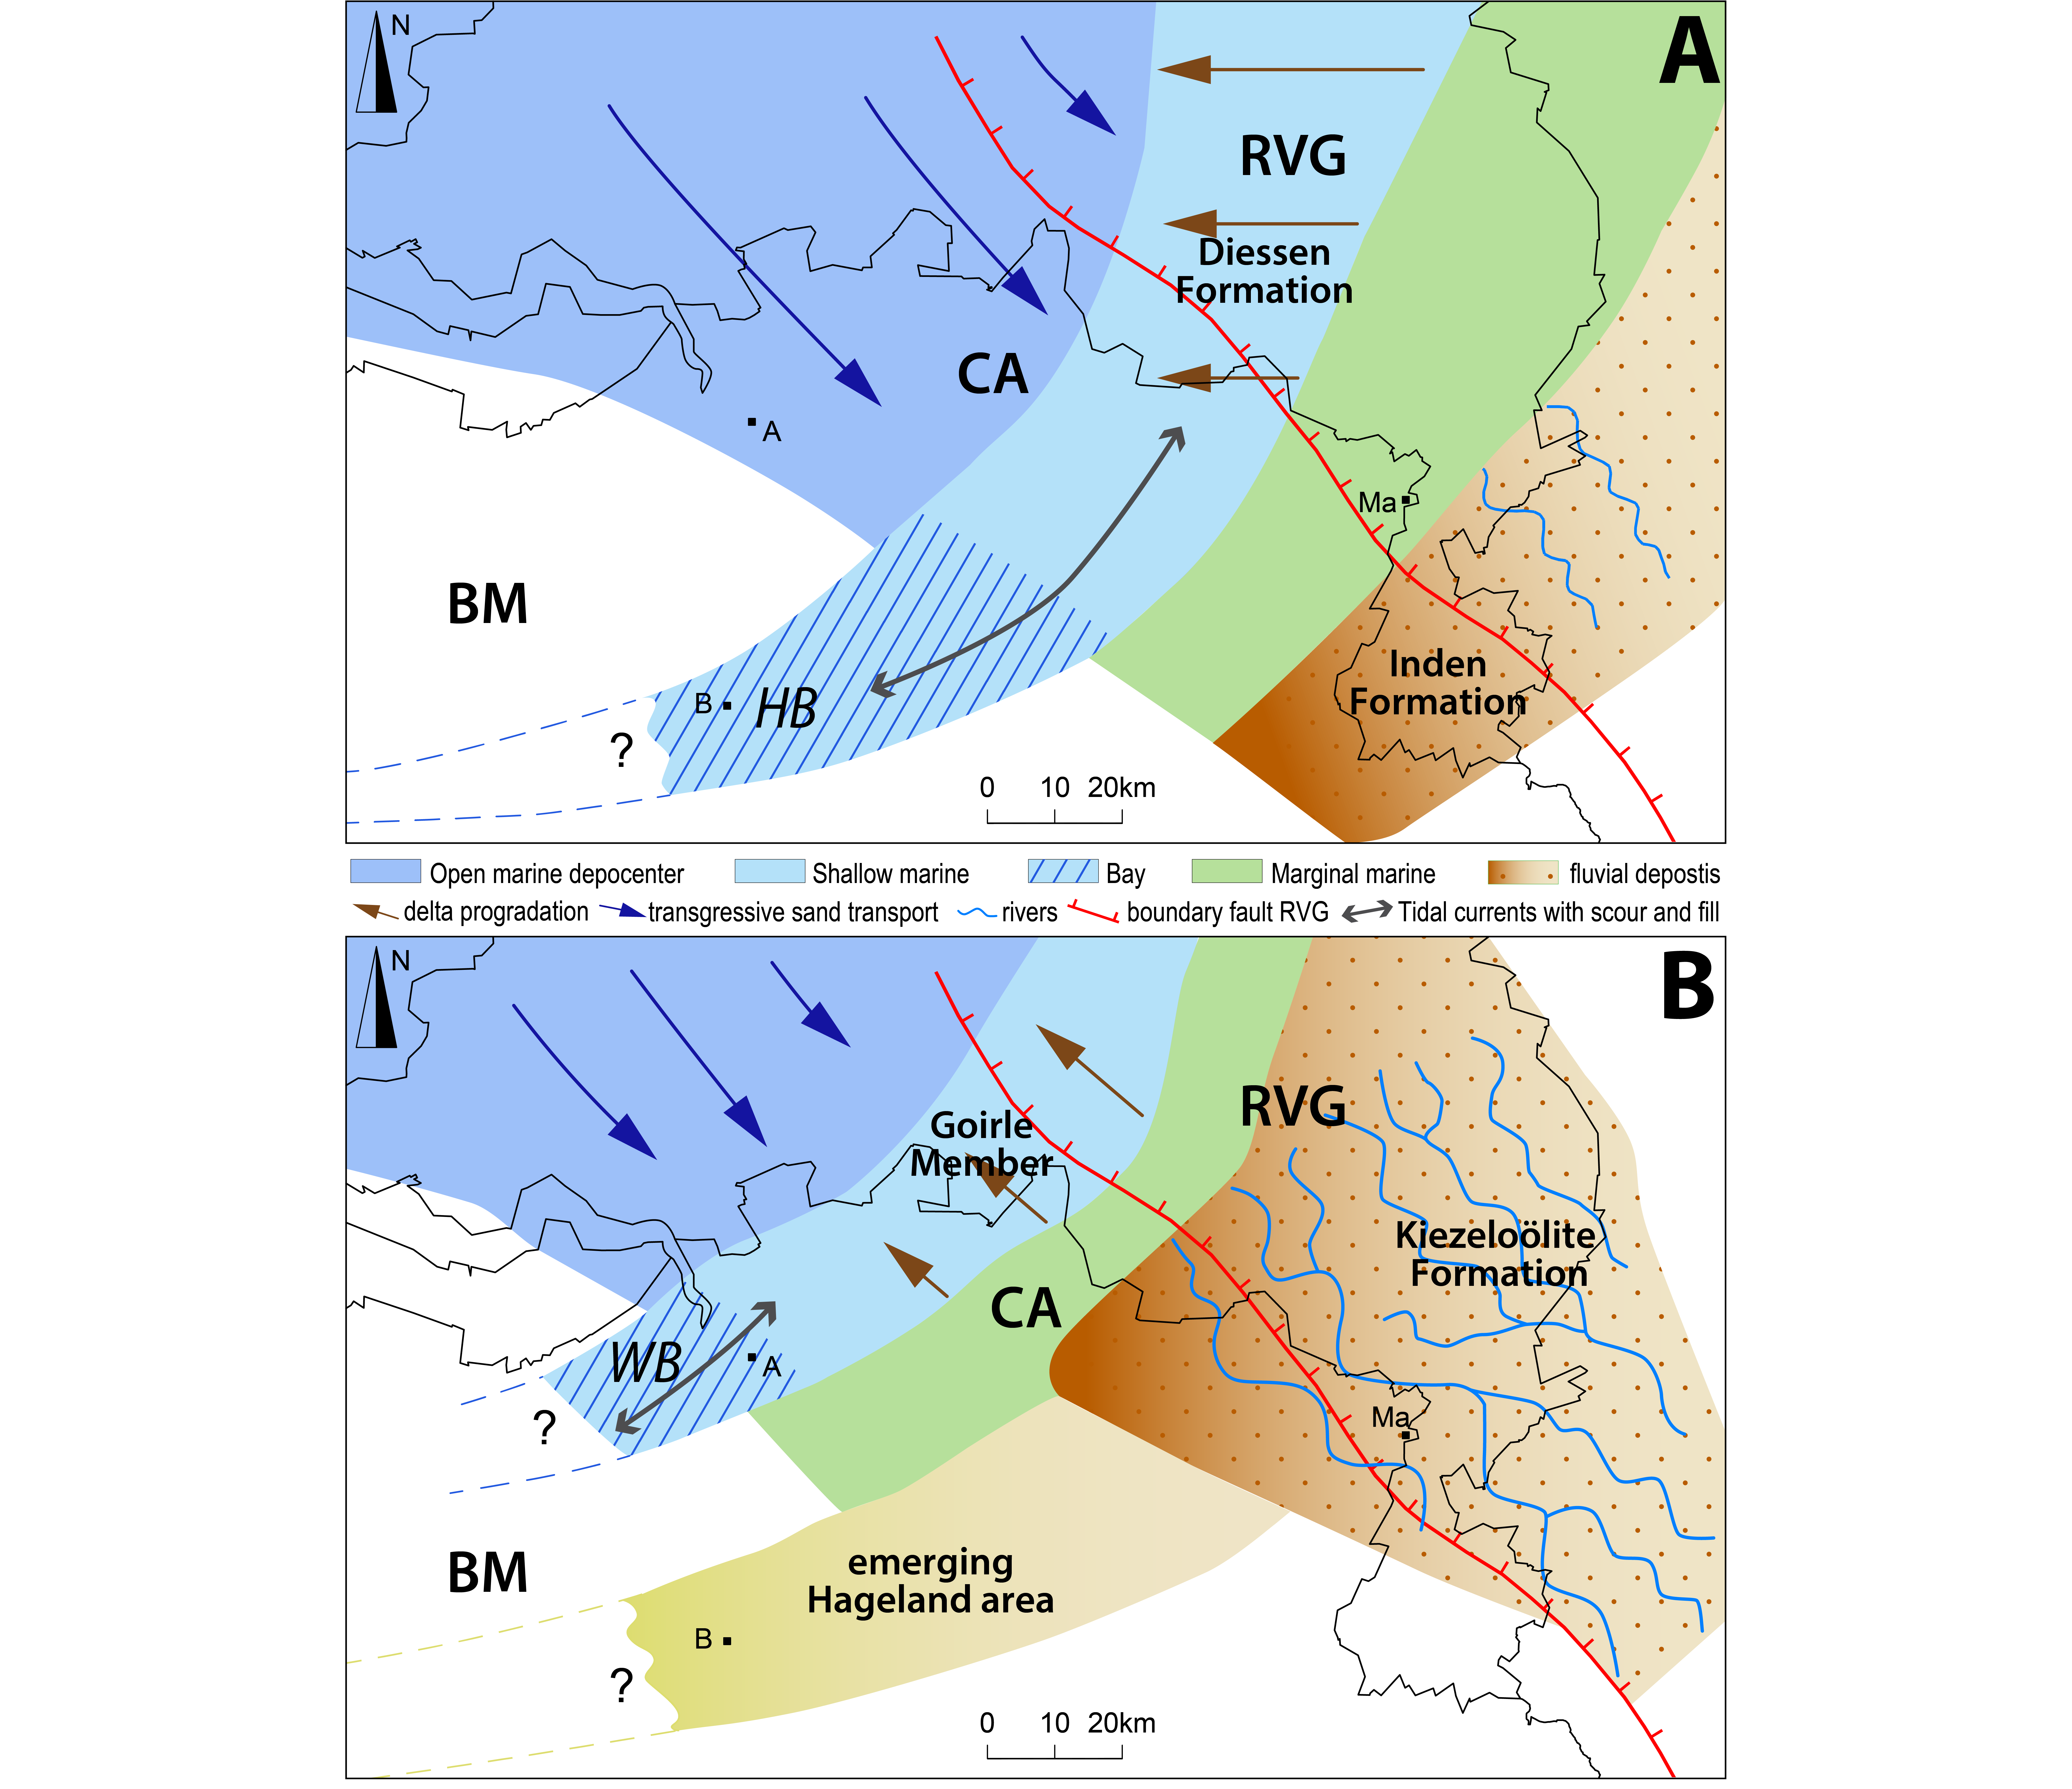
Figure 6. Sketch of the early late Miocene (Tortonian; A) and early Pliocene (Zanclean; B) paleogeography in the southern North Sea Basin to illustrate the similarities between depositional systems. A. The Tortonian marine invasion of the Hageland Bay (HB), with marine transgression in the main part of the Campine area (CA) simultaneous with clinoform progradation (lower part Diessen Member; after Munsterman et al., 2019) in the northern Roer Valley Graben (RVG). This section was modified after Vandenberghe et al. (2014).
B. The Zanclean marine invasion of the Waasland Bay (WB), with marine transgression in the western Campine area simultaneous with clinoform progradation (Goirle Member; after Munsterman et al., 2019) in the eastern Campine area. A = city of Antwerp; B = city of Brussels; Ma = city of Maaseik; BM = Brabant Massif.
22As is the case in the Hageland area during the early late Miocene, the Waasland area could have formed a narrow bay during the early Pliocene, enclosed between the Brabant Massif in the southwest and the proto-Rhine delta system in the northeast (Fig. 6). The filling of the eastern sector of this bay with the lower Pliocene sand of the Goirle Member (almost 40 m thick in the Goirle borehole; Munsterman et al., 2019) could have caused flow constriction and consequently very strong current activity and erosion in the Waasland area (see earlier comparison discussion; Fig. 6B). The resulting erosional gullies in the Waasland area could have been filled during their formation by the lower sequence of the Kattendijk Formation (up to 9 m thick in the study area). During the subsequent transgression, the upper sequence of the Kattendijk Formation (4–6 m thick in the study area) and equivalent Tilburg Member (also 6 m thick in borehole Goirle; Munsterman et al., 2019) were deposited in the wider area. The transgression of wider areas leads to less constriction and a reduction of the (erosive) strength of the marine currents, resulting in the smaller gully complexes in the upper sequence of the Kattendijk Formation such as those observed in the outcrop near Kallo by Gaemers (1975; see above).
23Seismic interpretations of gullies further north in the North Sea Basin showed they must have resulted from strong submarine current activity in the toes (base of slope) of major Mio-Pliocene sedimentary prisms (Cartwright, 1995; Knutz, 2010; Kilhams et al., 2011).
6. Conclusions
24An east-west correlation profile through the shallow subsurface north of Antwerp based on CPTs shows the following architecture of the lower Pliocene Kattendijk Formation:
-
A basal gully incision of the Kattendijk Formation that progressively cuts deeper into the Miocene sands in western direction. Maximum incision down to 20 m is reached in the west, where the Miocene sands are completely removed and the base Kattendijk Formation incises the underlying Lower Oligocene clays.
-
Strongest incision coincides with increases in the thickness of the Kattendijk Formation from its typical 4 to 6 meters in the east towards a maximum of 15 m in the west.
-
Correlations show that this additional thickness represents a separate sequence of the Kattendijk Formation that first filled the deepest gully prior to being covered by the second sequence that was deposited in a larger gully system. This larger gully system is located across the Waasland area.
-
Both sequences of the Kattendijk Formation are interpreted as being deposited during the progressive transgression of the region after the latest Miocene sea-level drop. They show basal transgressive surfaces with reworked material from the underlying Lower Oligocene to Miocene clays and sands.
-
The lower and upper sequences of the Kattendijk Formation could correlate to the recently introduced Goirle and Tilburg Members of the Dutch Oosterhout Formation northeast of the study area. Contrary to their lateral equivalents, however, the two sequences of the Kattendijk Formation are lithologically identical.
-
Deposition of the clinoforms of the Goirle Formation could have caused submarine flow constriction to the marine bay in the Waasland area. The constricted strong marine currents could have possibly invaded and expanded existing fluvial or estuarine gullies that developed during the former latest Miocene sea-level low, thereby creating the deep gullies at the base of the Kattendijk Formation. A similar mechanism had been proposed for the development of late Miocene gully system at the base of the Diest Formation further southeast.
-
During subsequent transgression and deposition of the uppermost sequence of the Kattendijk Formation (and equivalent Tilburg Member), the strength of the marine currents decreased. This could explain the past observations of shallower gullies in the upper sequence of the Kattendijk Formation.
7. Acknowledgements
25We gratefully acknowledge financial support from the Bureau for Environment and Spatial Development - Flanders. We would like to thank Katleen van Baelen (VITO) for her excellent work on the figures. Stijn Huyghe and Michiel Dusar are thanked for the constructive discussions on the geotechnical and lithostratigraphic interpretations of the Neogene in the Antwerp area. Katrien De Nil (VPO) and Marleen De Ceuckelaire (RBINS) are thanked for providing the connections between the CPTs and outcrops as discussed in the text with the databases of the Databank Ondergrond Vlaanderen (DOV) and the Geological Survey of Belgium (GSB). We also wish to thank Frank Wesselingh, Dirk Munsterman and Noël Vandenberghe for their helpful reviews and recommendations that led to considerable improvements of the manuscript.
8. References
26Blow, W.H. 1979. The Cainozoic Globigerinidae: A Study of the Morphology, Taxonomy, Evolutionary Relationships and the Stratigraphical Distribution of some Globigerinidae. Leiden, Brill, 3 vol., 1413 p.
27Cartwright, J., 1995. Seismic-stratigraphical analysis of large-scale ridge-trough sedimentary structures in the Late Miocene to Early Pliocene of the central North Sea. Special Publication of the International Association of Sedimentologists, 22, 285–303.
28Cogels, P., 1874. Observations géologiques et paléontologiques sur les différents dépôts rencontrés à Anvers lors du creusement des nouveaux bassins. Annales de la Société malacologique de Belgique, 9, 7–32.
29Deckers, J. & Munsterman, D., 2020. Middle Miocene depositional evolution of the central Roer Valley Rift System. Geological Journal. https://doi.org/10.1002/gj.3799
30Deckers, J., De Koninck, R., Bos, S., Broothaers, M., Dirix, K., Hambsch, L., Lagrou, D., Lanckacker, T., Matthijs, J., Rombaut, B., Van Baelen, K. &Van Haren, T., 2019. Geologisch (G3Dv3) en hydrogeologisch (H3D) 3D-lagenmodel van Vlaanderen. Studie uitgevoerd in opdracht van het Vlaams Planbureau voor Omgeving, departement Omgeving en de Vlaamse Milieumaatschappij. VITO, Mol, VITO-rapport 2018/RMA/R/1569. https://archief-algemeen.omgeving.vlaanderen.be/xmlui/handle/acd/251494, accessed 08/06/2020.
31de Heinzelin, J., 1955. Considérations nouvelles sur le Néogène de l’Ouest de l’Europe. Bulletin de la Société belge de Géologie, de Paléontologie et d’Hydrologie, 64/3, 463–476.
32De Meuter, F. & Laga, P. 1976. Lithostratigraphy and biostratigraphy based on benthonic Foraminifera of the Neogene deposits of northern Belgium. Bulletin van de Belgische Vereniging voor Geologie, 85/3-4, 133–152.
33De Meuter, F., Wouters, K. & Ringele, A., 1976. Lithostratigraphy of Miocene sediments from temporary outcrops in the Antwerpen city area. Service Géologique de Belgique, Professional Paper, 1976/3, 19 p.
34De Schepper, S., Head, M.J. & Louwye, S., 2009. Pliocene dinoflagellate cyst stratigraphy, palaeoecology and sequence stratigraphy of the Tunnel-Canal Dock, Belgium. Geological Magazine, 146/1, 92–112. https://doi.org/10.1017/S0016756808005438
35de Vernal, A. & Mudie, P.J., 1989. Pliocene and Pleistocene palynostratigraphy at ODP sites 646 and 647, eastern and southern Labrador Sea. In Srivastava, S.P., Arthur, M.A., Clement, B.M. et al. (eds), Proceedings of the Ocean Drilling Program, Scientific Results. College Station, Texas, Vol. 105, 401–422. https://doi.org/10.2973/odp.proc.sr.105.134.1989
36Doppert, J.W.C., Laga, P. & De Meuter, F., 1979. Correlation of the biostratigraphy of marine Neogene deposits, based on benthonic foraminifera, established in Belgium and The Netherlands. Mededelingen Rijks Geologische Dienst, 31, 1–8.
37Gaemers, P.A.M., 1975. Enkele paleo-ecologische opmerkingen over de pliocene afzettingen in de tunnelput nabij Kallo, België, provincie Oost-Vlaanderen, Deel I. Mededelingen van de Werkgroep voor Tertiaire en Kwartaire Geologie, Leiden, 12/1, 25–37.
38Gaemers, P.A.M., 1988. The regional distribution of otolith assemblages; correlation of the interregional zonation with the regional lithostratigraphic formations. In Vinken, R. (ed.), The Northwest European Tertiary Basin. Geologisches Jahrbuch, Reihe A, 100, 379–389.
39Gibbard, P.L. & Lewin, J., 2016. Filling the North Sea Basin: Cenozoic sediment sources and river styles. Geologica Belgica, 19, 201–217. https://doi.org/10.20341/gb.2015.017
40Gramann, F. & Uffendorfe, H., 1988. Belgium and The Netherlands. In Vinken, R. (ed.), The Northwest European Tertiary Basin. Geologisches Jahrbuch, Reihe A, 100, 240–245.
41Gulinck, M., 1962. Essai d’une carte géologique de la Campine. Etat de nos connaissances sur la nature des terrains néogènes recoupés par sondages. Mémoires de la Société belge de Géologie, de Paléontologie et d’Hydrologie, série in-8o, 6, 30–39.
42Halet, F., 1935. Les formations néogènes au Nord et à l'Est de la ville d'Anvers. Bulletin de la Société belge de Géologie, 45, 141–153.
43Hinsch, W. 1988. Benthic molluscs (Pelecypods, Gastropods), the description of the interregional zonation (BM zones) and its correlation with the regional lithostratigraphy. In Vinken, R. (ed.), The Northwest European Tertiary Basin. Geologisches Jahrbuch, Reihe A, 100, 344–356.
44Hooyberghs, H. J. F. & Moorkens, T., 1988. Planktonic foraminifera – Belgium. In Vinken, R. (ed.), The Northwest European Tertiary Basin. Geologisches Jahrbuch, Reihe A, 100, 190–198.
45Houthuys, R., 2014. A reinterpretation of the Neogene emersion of central Belgium based on the sedimentary environment of the Diest Formation and the origin of the drainage pattern. Geologica Belgica, 17, 211–235.
46Jacobs, P., Polfliet, T., De Ceukelaire, M. & Moerkerke, G., 2010. Toelichtingen bij de geologische kaart van België, Vlaams Gewest: kaartblad 15, Antwerpen [1/50 000]. Belgische Geologische Dienst en Ministerie van de Vlaamse Gemeenschap, Afdeling Natuurlijke Rijkdommen en Energie, Brussel, 60 p.
47Janssen, A.W., 1974. Het profiel van de bouwput onder het eerste kanaaldok nabij Kallo, provincie Oost-Vlaanderen, België. Mededelingen van de Werkgroep voor Tertiaire en Kwartaire Geologie, 11/4, 173–185.
48Janssen, A. & King, C., 1988. The description of a tentative interregional pteropod (planktonic gastropods) zonation and its correlation with the regional lithostratigraphy. In Vinken, R. (ed.), The Northwest European Tertiary Basin. Geologisches Jahrbuch, Reihe A, 100, 357–366.
49Kilhams, B., McArthur, A., Huuse, M., Ita, E. & Hartley, A., 2011. Enigmatic large-scale Furrows of Miocene to Pliocene age from the Central North Sea: current scoured pockmarks? Geo-Marine Letters, 31, 437–449. https://doi.org/10.1007/s00367-011-0235-1
50Knutz, P.C., 2010. Channel structures formed by contour currents and fluid expulsion: significance for Late Neogene development of the central North Sea basin. In Vining, B.A. & Pickering, S.C. (eds), Petroleum Geology: From Mature Basins to New Frontiers. Proceedings of the 7th Petroleum Geology Conference. Geological Society, London, Petroleum Geology Conference series, 7, 77–94. https://doi.org/10.1144/0070077
51Laga, P., 1971. De Neogene afzettingen van het Waasland (kb Beveren-Waas). Belgische Geologische Dienst, Professional Paper, 1971/7, 11 p.
52Laga, P., 1972. Stratigrafie van de mariene Plio-Pleistocene afzettingen uit de omgeving van Antwerpen met een bijzondere studie van de foraminiferen. Unpublished Ph.D. Thesis. Katholieke Universiteit Leuven - Faculteit Wetenschappen, Leuven. 3 vol., 252 p.
53Laga, P., 1983. Geologisch profiel door de haven van Antwerpen. Archief Belgische Geologische Dienst (KBIN). http://collections.naturalsciences.be/ssh-geology/geology/boreholes/profiles-boreholes/pgl/neogeen/pgl-83-106.jpg/view, accessed 08/06/2020.
54Laga, P., Louwye, S. & Geets, S. 2001. Paleogene and Neogene lithostratigraphic units (Belgium). Geologica Belgica, 4/1-2, 135–152. https://doi.org/10.20341/gb.2014.050
55Louwye, S. & Laga, P., 1998. Dinoflagellate cysts of the shallow marine Neogene succession in the Kalmthout well, northern Belgium. Bulletin of the Geological Survey of Denmark, 45, 73–86.
56Louwye, S., Head, M. & De Schepper, S., 2004. Dinoflagellate cyst stratigraphy and palaeoecology of the Pliocene in northern Belgium, southern North Sea Basin. Geological Magazine, 141/3, 353–378. https://doi.org/10.1017/S0016756804009136
57Louwye, S., De Schepper, S., Laga, P. & Vandenberghe, N., 2007. The Upper Miocene of the southern North Sea Basin (northern Belgium): a palaeoenvironmental and stratigraphical reconstruction using dinoflagellate cysts. Geological Magazine, 144/1, 33–52. https://doi.org/10.1017/S0016756806002627
58Louwye, S., Deckers, J., Verhaegen, J., Adriaens, R. & Vandenberghe, N., 2020. A review of the lower and middle Miocene in northern Belgium. Geologica Belgica, 23/3-4, this volume. https://doi.org/10.20341/gb.2020.010
59Manum, S.B., Boulter, M.C., Gunnarsdottir, H., Rangnes, K. & Scholze, A., 1989. Eocene to Miocene palynology of the Norwegian Sea (ODP Leg 104). In Eldholm, O., Thiede, J. & Taylor, E. et al. (eds), Proceedings of the Ocean Drilling Program, Scientific Results. College Station, Texas, Vol. 104, 611–662. https://doi.org/10.2973/odp.proc.sr.104.176.1989
60Marquet, R., 1984. A remarkable molluscan fauna from the Kattendijk Formation (Lower Pliocene) at Kallo (Oost-Vlaanderen, Belgium). Bulletin de la Société belge de Géologie, 93/4, 335–345.
61Marquet, R., 2004. Ecology and evolution of Pliocene bivalves from the Antwerp Basin. Bulletin van het Koninklijk Belgisch Instituut voor Natuurwetenschappen, Aardwetenschappen, 74, 205–212.
62Matthijs, J., Lanckacker, T., De Koninck, R., Deckers, J., Lagrou, D. & Broothaers, M., 2013. Geologisch 3D lagenmodel van Vlaanderen en het Brussels Hoofdstedelijk Gewest - versie 2, G3Dv2. Studie uitgevoerd door VITO in opdracht van de Vlaamse overheid, Departement Leefmilieu, Natuur en Energie, Afdeling Land en Bodembescherming, Ondergrond, Natuurlijke Rijkdommen. VITO, Mol, VITO-rapport 2013/R/ETE/43, 21 p. https://dov.vlaanderen.be/page/meer-modelinfo-over-g3dv2, accessed 08/06/2020.
63Miller, K.G., Kominz, M.A., Browning, J.V., Wright, J.D., Mountain, G.S., Katz, M.E., Sugarman, P.J., Cramer, B.S., Christie-Blick, N. & Pekar, S.F., 2005. The Phanerozoic record of global sea-level change. Science, 310, 1293–1298. https://doi.org/10.1126/science.1116412
64Munsterman, D.K., 2019. De resultaten van het palynologisch onderzoek naar de ouderdom van boring GEO-18/132-B5 (Antwerpen), interval 6.5-29.92 m (TAW). TNO-rapport R11924, 16 p.
65Munsterman, D.K., ten Veen, J.H., Menkovic, A., Deckers, J., Witmans, N., Verhaegen, J., Kerstholt-Boegehold, S.J., van de Ven, T. & Busschers, F.S., 2019. An updated and revised stratigraphic framework for the Miocene and earliest Pliocene strata of the Roer Valley Graben and adjacent blocks. Netherlands Journal of Geosciences, 98, e8. https://doi.org/10.1017/njg.2019.10
66Powell, A.J., 1992. Dinoflagellate cysts of the Tertiary System. In Powell, A.J. (ed.), A Stratigraphic Index of Dinoflagellate Cysts. Chapman & Hall, London, 155–251.
67Schiltz, M., 2020. On the use of CPTs in stratigraphy: recent observations and some illustrative cases. Geologica Belgica, 23/3-4, this volume. https://doi.org/10.20341/gb.2020.019
68Spiegler, D., 2001. Bolboforma biostratigraphy in the Neogene glauconitic sands of Belgium. Aardkundige Mededelingen, 11, 61–68.
69Spiegler, D., Gramann, F. & von Daniels, C.H., 1988. Planktonic foraminifera the description of the interregional zonation (NPF zones). In Vinken, R. (ed.), The Northwest European Tertiary Basin. Geologisches Jahrbuch, Reihe A, 100, 152–160.
70Vandenberghe, N., Laga, P., Steurbaut, E., Hardebol, J. & Vail, P.R., 1998. Tertiary sequence stratigraphy at the southern border of the North Sea Basin in Belgium. In de Graciansky, P.C., Hardenbol, J., Jacquin, T. & Vail, P.R. (eds), Mesozoic and Cenozoic Sequence Stratigraphy of European Basins. SEPM (Society for Sedimentary Geology), Tulsa (OK), SEPM Special Publication, 60, 120–154. https://doi.org/10.2110/pec.98.02.0119
71Vandenberghe, N., Van Simaeys, S., Steurbaut, E., Jagt, J.W.M. & Felder, P.J., 2004. Stratigraphic architecture of the Upper Cretaceous and Cenozoic along the southern border of the North Sea Basin in Belgium. Netherlands Journal of Geosciences, 83/3, 155–171. https://doi.org/10.1017/S0016774600020229
72Vandenberghe, N., Harris, W.B., Wampler, J.M., Houthuys, R., Louwye, S., Adriaens, R., Vos, K., Lanckacker, T., Matthijs, J., Deckers, J., Verhaegen, J., Laga, P., Westerhoff, W. & Munsterman, D., 2014. The implications of K-Ar glauconite dating of the Diest Formation on the paleogeography of the Upper Miocene in Belgium. Geologica Belgica, 17, 161–174.
73Vandenberghe, N., Wouters, L., Schiltz, M., Beerten, K., Berwouts, I., Vos, K., Houthuys, R., Deckers, J., Louwye, S., Laga, P., Verhaegen, J., Adriaens, R. & Dusar, M., 2020. The Kasterlee Formation and its relation with the Diest and Mol Formations in the Belgian Campine. Geologica Belgica, 23/3-4, this volume. https://doi.org/10.20341/gb.2020.014
74Van Haren, T., Deckers, J., De Koninck, R., Dirix, K., Hambsch, L. & Van Baelen, K., in prep. Ondiep geologische 3D lagen- en voxelmodel van de regio Antwerpen. VITO, Mol, VITO-rapport 2019/RMA/R/1985.
75Verbeek, J., Steurbaut, E. & Moorkens, T., 1988. Nannoplankton – Belgium. In Vinken, R. (ed.), The Northwest European Tertiary Basin. Geologisches Jahrbuch, Reihe A, 100, 267–273.
76Willems, W., Laga, P. & Moorkens, T., 1988. Benthic foraminifera – Belgium. In Vinken, R. (ed.), The Northwest European Tertiary Basin. Geologisches Jahrbuch, Reihe A, 100, 179–188.
77Manuscript received 23.04.2020, accepted in revised form 11.06.2020, available online 17.07.2020.
