


- Startpagina tijdschrift
- Volume 23 (2020)
- number 3-4 - The Neogene stratigraphy of northern ...
- On the use of CPTs in stratigraphy: recent observations and some illustrative cases


Weergave(s): 4272 (23 ULiège)
Download(s): 537 (17 ULiège)

On the use of CPTs in stratigraphy: recent observations and some illustrative cases

Abstract
During processing and interpretation of about 200 Cone Penetration Tests (CPT) with electrical cones in a limited area of 60 km² in NE Belgium, a close analogy was observed between the vertical trend and signature of two CPT derived parameters (normalized soil behavior index Ic and hydraulic conductivity kSBTn) and borehole gamma ray (GR) measurements. This close analogy could be repeatably observed on five locations with a CPT executed along a cored and logged borehole.
Using this feature proves to be a considerably help for stratigraphic interpretation, especially for sandy units displaying low lithological contrast. Lithostratigraphic units and their boundaries are determined by the specific log response patterns of these CPT derived parameters (kSBTn and/or Ic). These log responses prove to be more consistent and better to correlate than for the classical parameters (cone resistance qc and friction ratio Rf).
This paper describes the case of a Neogene setting in the NE of Belgium where this feature was first observed. An informal stratigraphy based on CPT log signal is proposed for the geological units for the research area. Some other cases are briefly described to illustrate the usability of this feature for other geological settings or issues.
Inhoudstafel
1. Introduction
1During 2008 and 2010 the National Institute for Radioactive Waste and Enriched Fissile Materials (ONDRAF/NIRAS) organized two comprehensive field test campaigns (Wouters & Schiltz, 2013) situated in the NE of Flanders. The subject of these field campaigns was a hydrogeological safety study for a disposal facility for low radioactive waste storage. This investigation area is situated in the NE of the Flanders region in Belgium, at the Dessel nuclear site and a surrounding safety area on the territory of the Dessel–Geel–Kasterlee communities (Fig. 1).
2This field test campaign consisted in seven cored and logged boreholes and of about 200 CPTs (depth up to 35 m) in a regular grid of ~1 km² over an area of ~60 km² in the Dessel–Geel–Kasterlee area.
3This area is situated in a geological setting where, under a thin (1–4 m) cover of Quaternary sediments, Miocene sandy sediments outcrop (Fig. 1).
4In some preliminary minor field campaigns one of the cored boreholes revealed the presence of a ~10 m thick clayey layer on a stratigraphic level that was supposed to be sandy.
5Obviously the primary objective of the large number of CPTs was determining the presence and extension of this aquitard. It turned out that these data were also valuable in the discussion of the complex detail stratigraphy of the area. Therefore CPT data have been integrated in the unravelling of the local stratigraphy as presented in Vandenberghe et al. (2020, this volume).
6More information on the CPTs and boreholes (see also table on Fig.1) referred to in this paper can be consulted on https://www.dov.vlaanderen.be/data/opdracht/2020-022689.
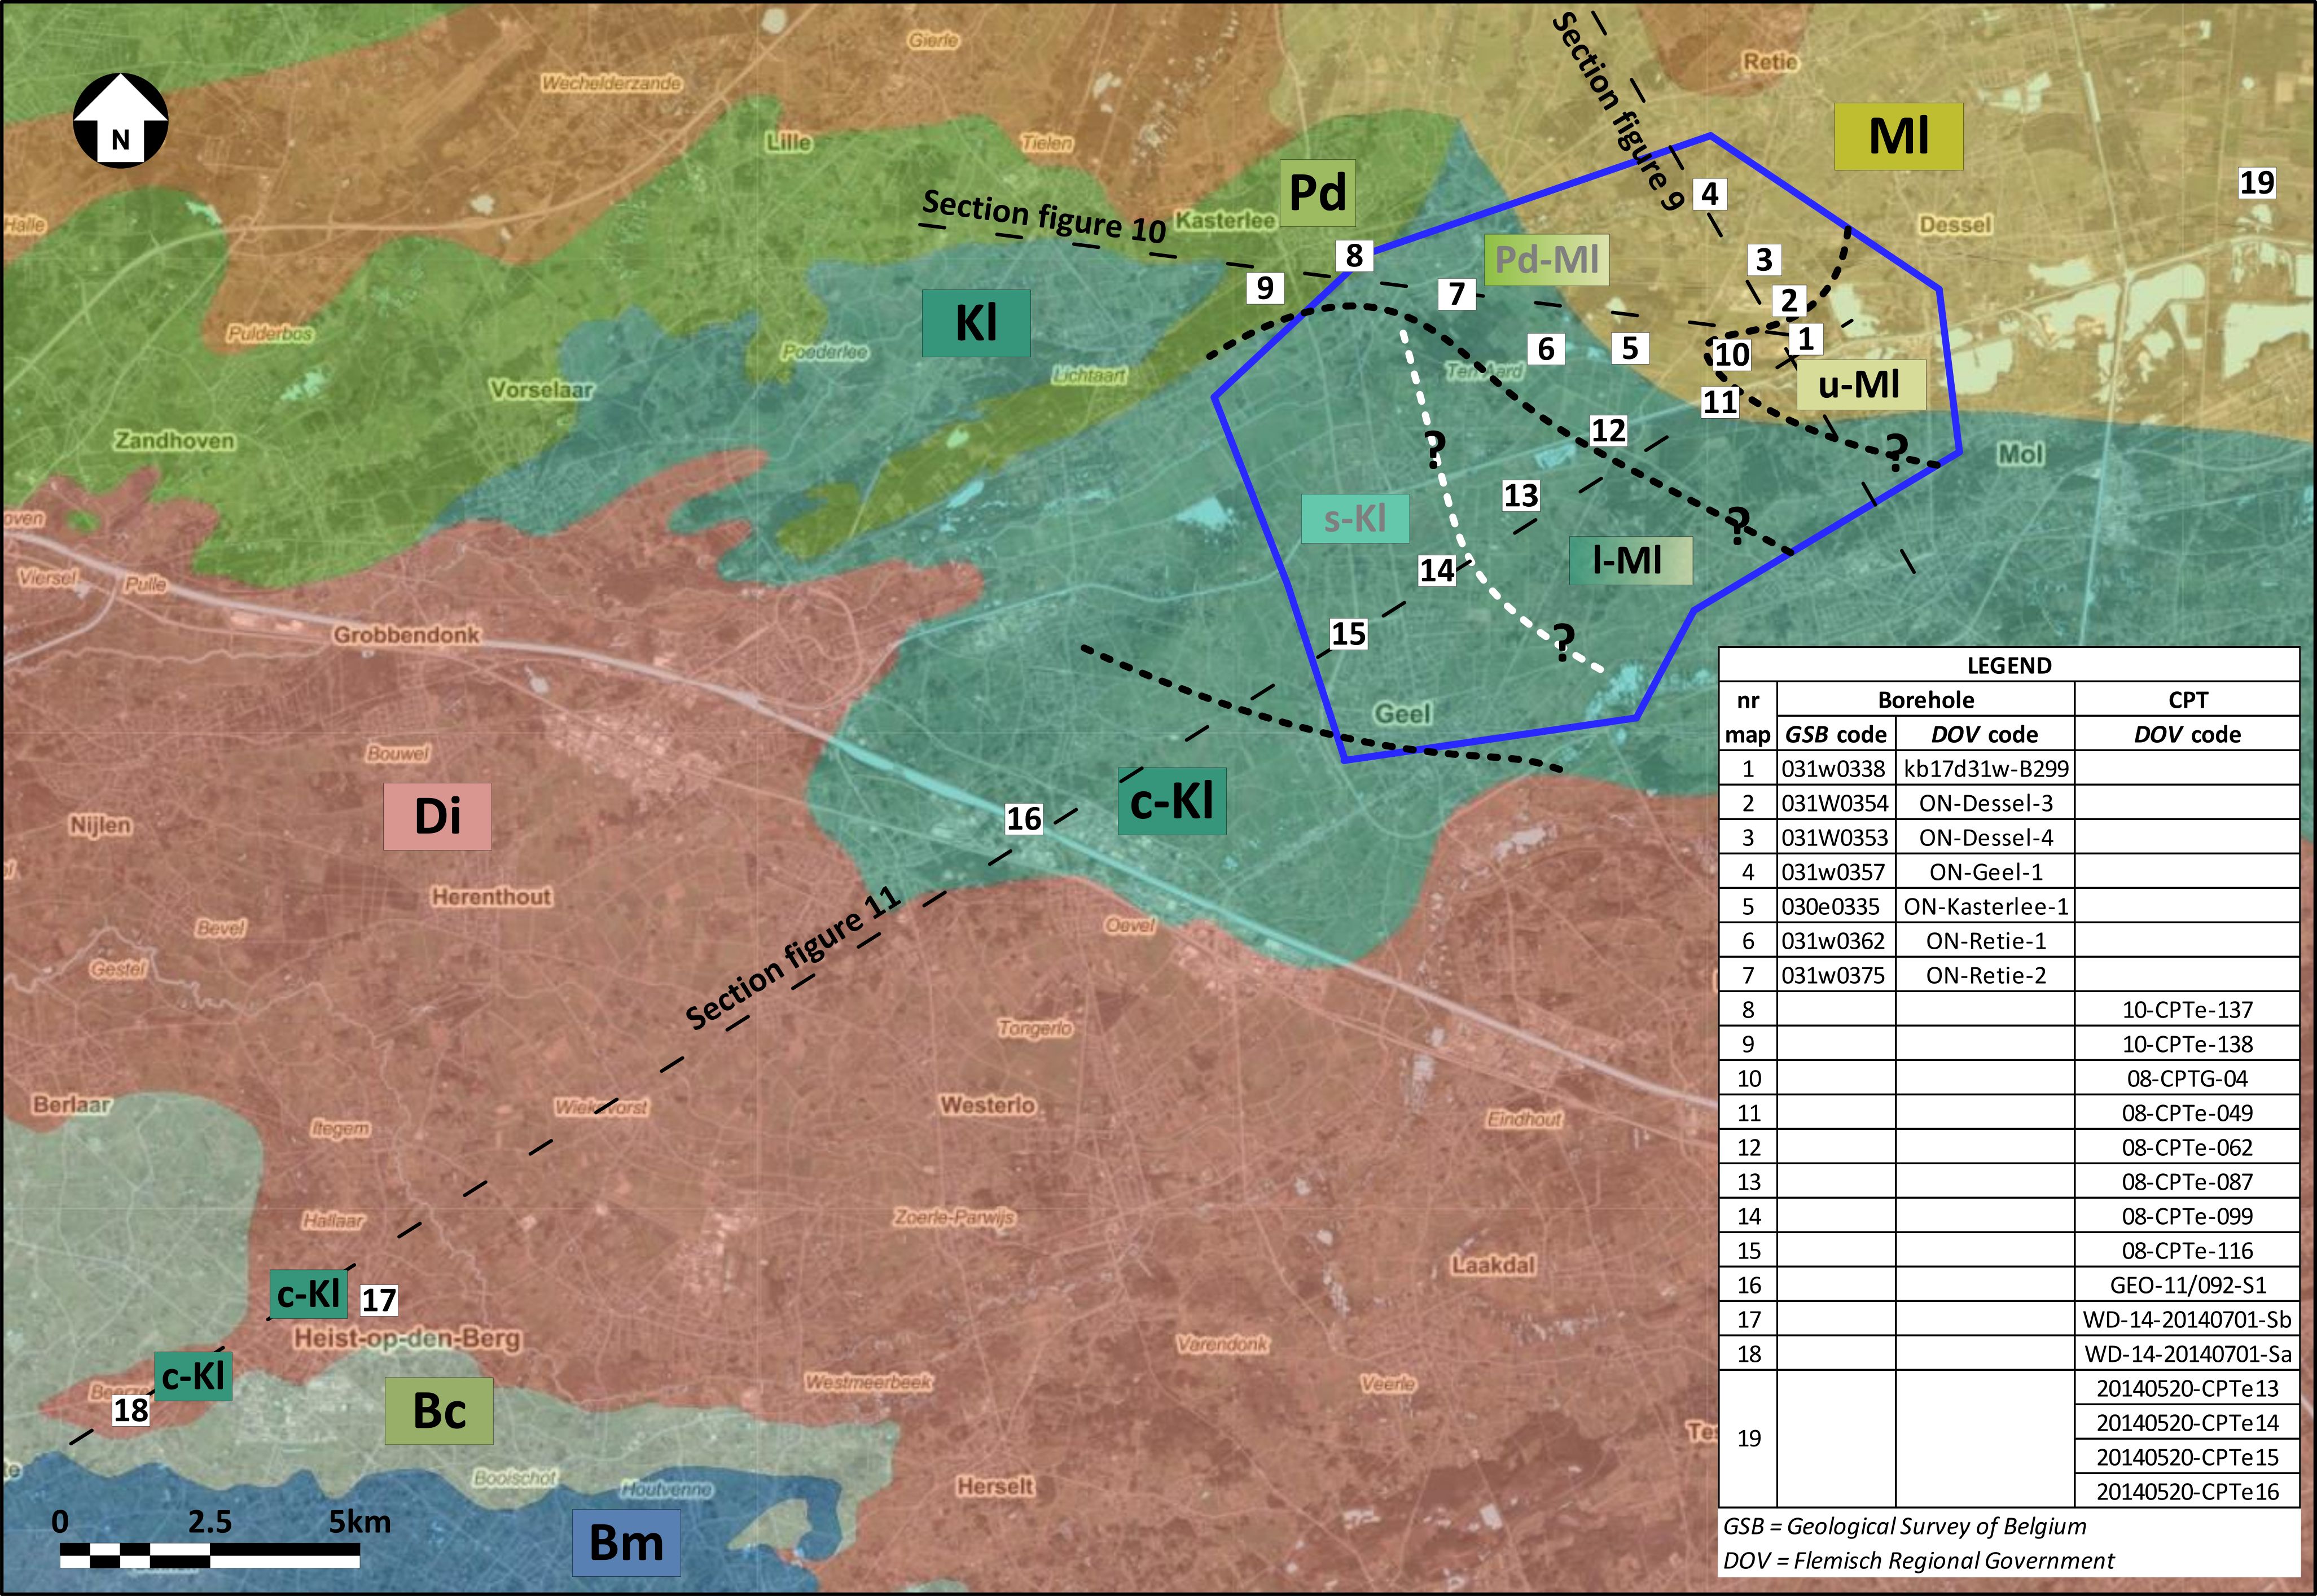
Figure 1. Geologic base map (Schiltz et al., 1993); ONDRAF/NIRAS field test area (blue contour line) with a proposal of approximate boundaries between CPT derived units (dashed lines); Bm = Boom Formation (clay), Bc = Berchem Formation (glauconitic sand), Di = Diest Formation (glauconitic sand), c-Kl = clayey Kasterlee, s-Kl (l-Ml?) = sandy unit between l-Ml and c-Kl interpreted as reworked c-Kl at the base of l-Ml (Vandenberghe et al., 2020, this volume; Adriaens & Vandenberghe, 2020, this volume), l-Ml = lower Mol sand, u-Ml = upper Mol sand, Pd-Ml = lateral sandy equivalent between Pd and Ml, Pd = Poederlee Formation (sand).
2. Method
2.1. Presentation of the method
7At the time of the 2008 ONDRAF/NIRAS CPT campaign, mechanical CPTs were still predominantly in use in Belgium. Cone resistance is than the only relevant parameter to interpret lithology and is only appropriate to some extent to distinguish between clay and sand layers. When used, soil interpretation from CPTs with electrical cone was mainly based on a qualitative analysis from cone resistance (qc) and local friction (fs) (NEN 5140, 1996).
8As far as known no soil type interpretation methods of more recent date have been used in Belgium until 2008. Nevertheless a lot of research has been done since the eighties of the last century. Results and experience are made available through a large number of publications.
9Because of lacking experience with soil type interpretation methods, it took some trial and error period with some methods (Searle, 1979; Douglas & Olsen, 1981) in a preliminary stage of the CPT interpretations. From the amount of available literature it was decided to continue with the soil type behavior (SBT) charts from Robertson (1990) and Robertson et al. (1986). They are easy to apply (raw qc and Rf measurements are used), have a robust scientific foundation, and are commonly and worldwide in use.
10For the CPTs from the 2008 ONDRAF/NIRAS campaign the application of the original SBT chart (Robertson et al., 1986) was focused on the aquitard that proved to be present throughout the whole study area. They were used in an attempt to characterize a semi quantitative “clayeyness” of the observed aquitard (Schiltz, 2008).
11Improvements in the lithostratigraphic interpretation of other geological units in the area remained modest (Schiltz, 2008; Rogiers et al., 2010) although some soil behavior type features were observed that seemed to be promising for further analysis of some, difficult to identify, units (Mol and Poederlee Formations).
12The 2010 field test campaign coincided with the publication of an update of CPT based soil type interpretation and equation for calculating soil type behavior index Ic (Robertson, 2010a) and of estimating hydraulic conductivity kSBTn (Robertson, 2010b).
13The application of the latter for new CPTs in the vicinity of logged and cored borehole locations of the 2008 campaign revealed the observation of close analogy between CPT derived kSBTn (and Ic)-log with borehole gamma ray log.
14CPTs from the 2008 field campaign throughout the study area were reprocessed for a number of sections and the correlation of the CPT derived kSBTn log proved to be a big improvement for the stratigraphic interpretation and understanding of the stratigraphy in the area (Wouters & Schiltz, 2013).
15The ONDRAF/NIRAS CPT campaigns consisted merely of classic electric cone penetration tests (CPTE). A minor number electric CPTs with pore pressure measurement (CPTU), conductivity (CPTR) and natural gamma (CPTG) were executed. Theoretically, pore pressure measurement provides an improvement for soil profiling. As no significant difference was observed between results from CPTE and CPTU for the interpretations discussed in this paper, and because of the large number of CPTE compared to the other CPTs, all CPTs were treated in the same way for consistency of the interpretations.
16In the following section the CPT technique, the difference with Gamma ray logging and the principle of CPT derived Ic and kSBTn is briefly discussed. It is followed by a section which showcases some results of the CPT-GR analogy and its consistent results for stratigraphic interpretation in the ONDRAF/NIRAS study area. Some other cases are briefly discussed to demonstrate how the Ic (and/or kSBTn) log responses have been used successfully in other situations.
2.2. Cone penetration test vs. gamma ray logging
17Analogy between CPT results and borehole gamma ray (GR) log results is not straightforward because of the intrinsic difference of measured features and measuring techniques.
18During cone penetration test, a special instrumented cone (electric or piezometric) is pushed into the soil at a constant speed. The classic measured parameters are the resistance of the cone tip (qc) and the friction along the surface of a sleeve above the cone tip (sleeve friction or local friction fs). Both parameters are the result of a mechanical reaction between the conus with sleeve and the soil (Fig. 2A). All other parameters such as Ic and kSBTn are derived from these two raw measured parameters. Typically CPTs are used for geotechnical issues.
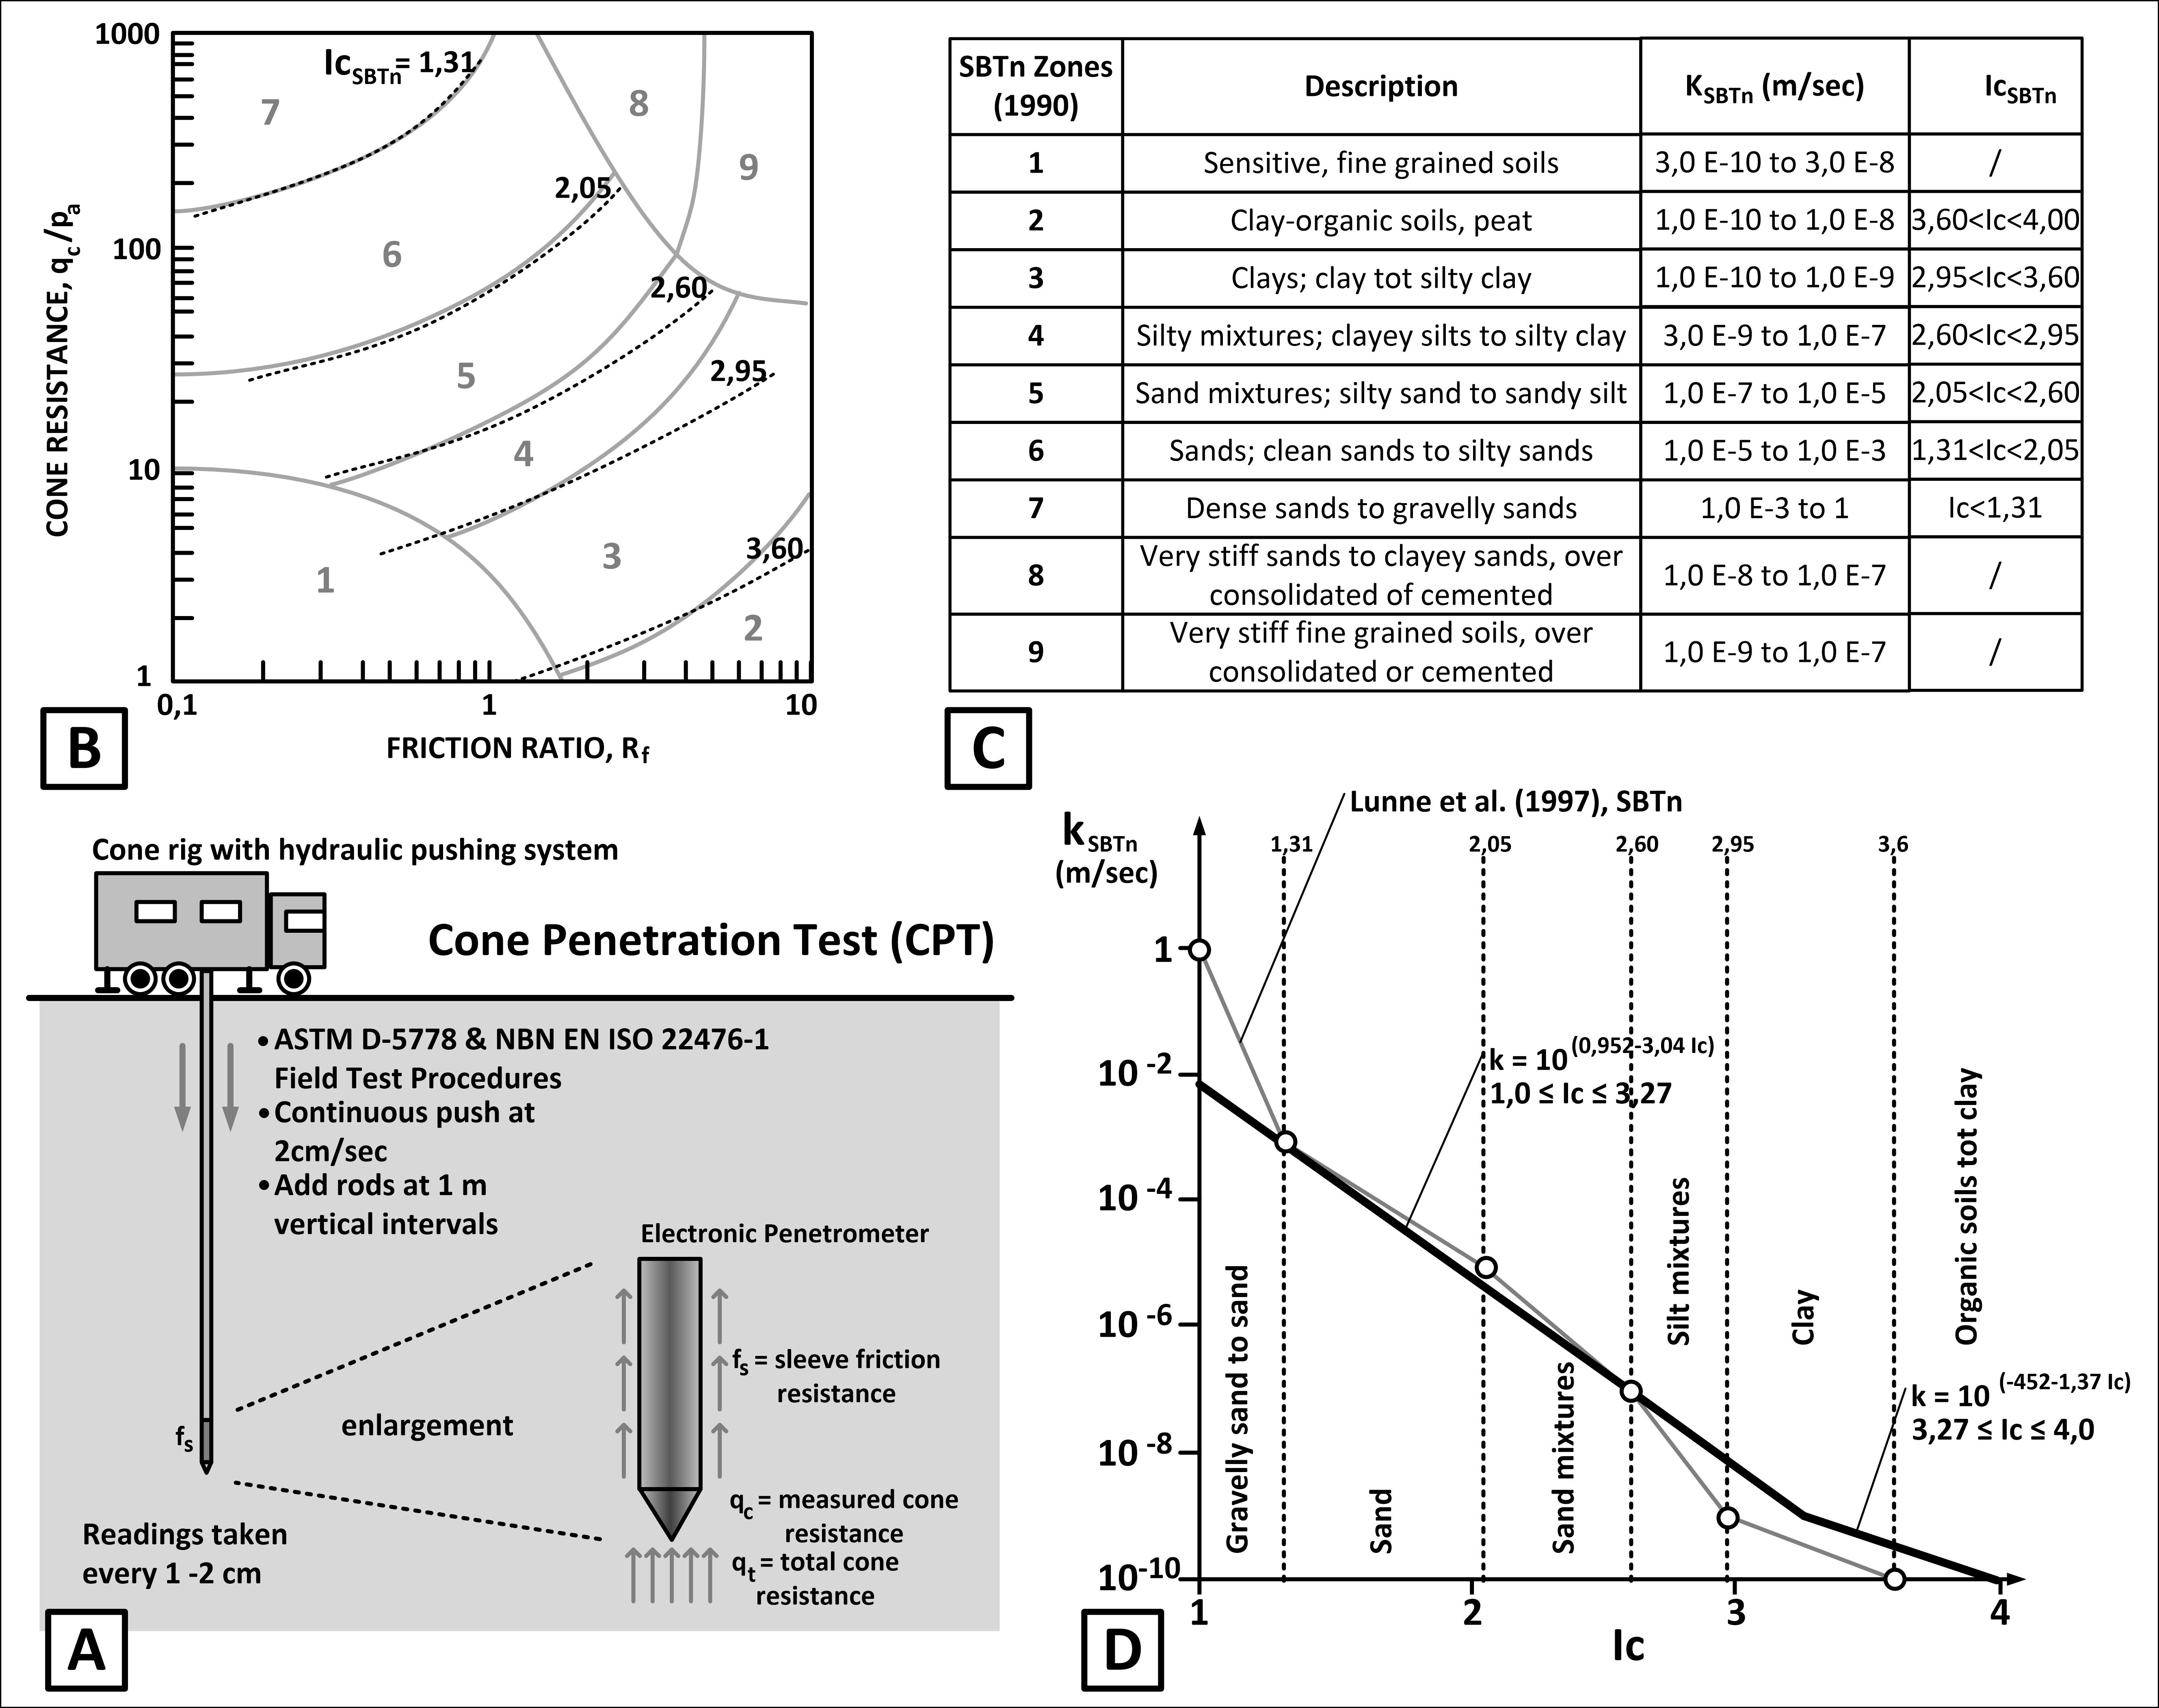
Figure 2. Cone penetration testing (CPT) and interpretation. A: CPT method showing a ballasted rig and an electric piezometric cone and the measured parameters. B: SBTn (normalized soil behavior types) chart with normalized cone resistance and friction ratio (Robertson, 2010a) showing the Ic as concentric circles corresponding with the SBTn boundaries (2 to 7). C: table (Robertson, 2010b) with normalized soil behavior types and corresponding Ic (normalized soil behavior index) and k intervals (proposed values in Lunne et al., 1997). D: diagram representing suggested variation of k vs normalized Ic (Robertson, 2010b).
19Common borehole gamma logging consists in lowering a tool in a predrilled borehole and recording the natural gamma radiation in the sediments (potassium, thorium and uranium) that are present in organic matter and the lattice of minerals in the sediments. Common minerals in sediments in the ONDRAF/NIRAS study area that incorporate such radioactive elements are in particular illite in the clay fraction and muscovite, glauconite pellets, K-feldspar in the sand fraction. The resulting log thus represents the variations of a chemical soil feature.
20The observed analogy between the gamma-log and kSBTn (or Ic) log can be explained partly because both parameters reflect a measure of clay content that is influenced by the sand-clay size fraction ratio but also by the glauconite and muscovite content in the sand fraction.
21The results of borehole logs are typically used for sequence stratigraphy analysis in oil and gas exploration. GR log shapes (Fig. 3) reflect unconformities, sequence boundaries and sedimentation cycles (Emery & Myers, 1996; Rider, 1999; Krassay, 1998). A proxy of these parameters is offered by the CPT-derived parameters kSBTn (or Ic) whose vertical log can be interpreted in an analogous way to the GR signal.
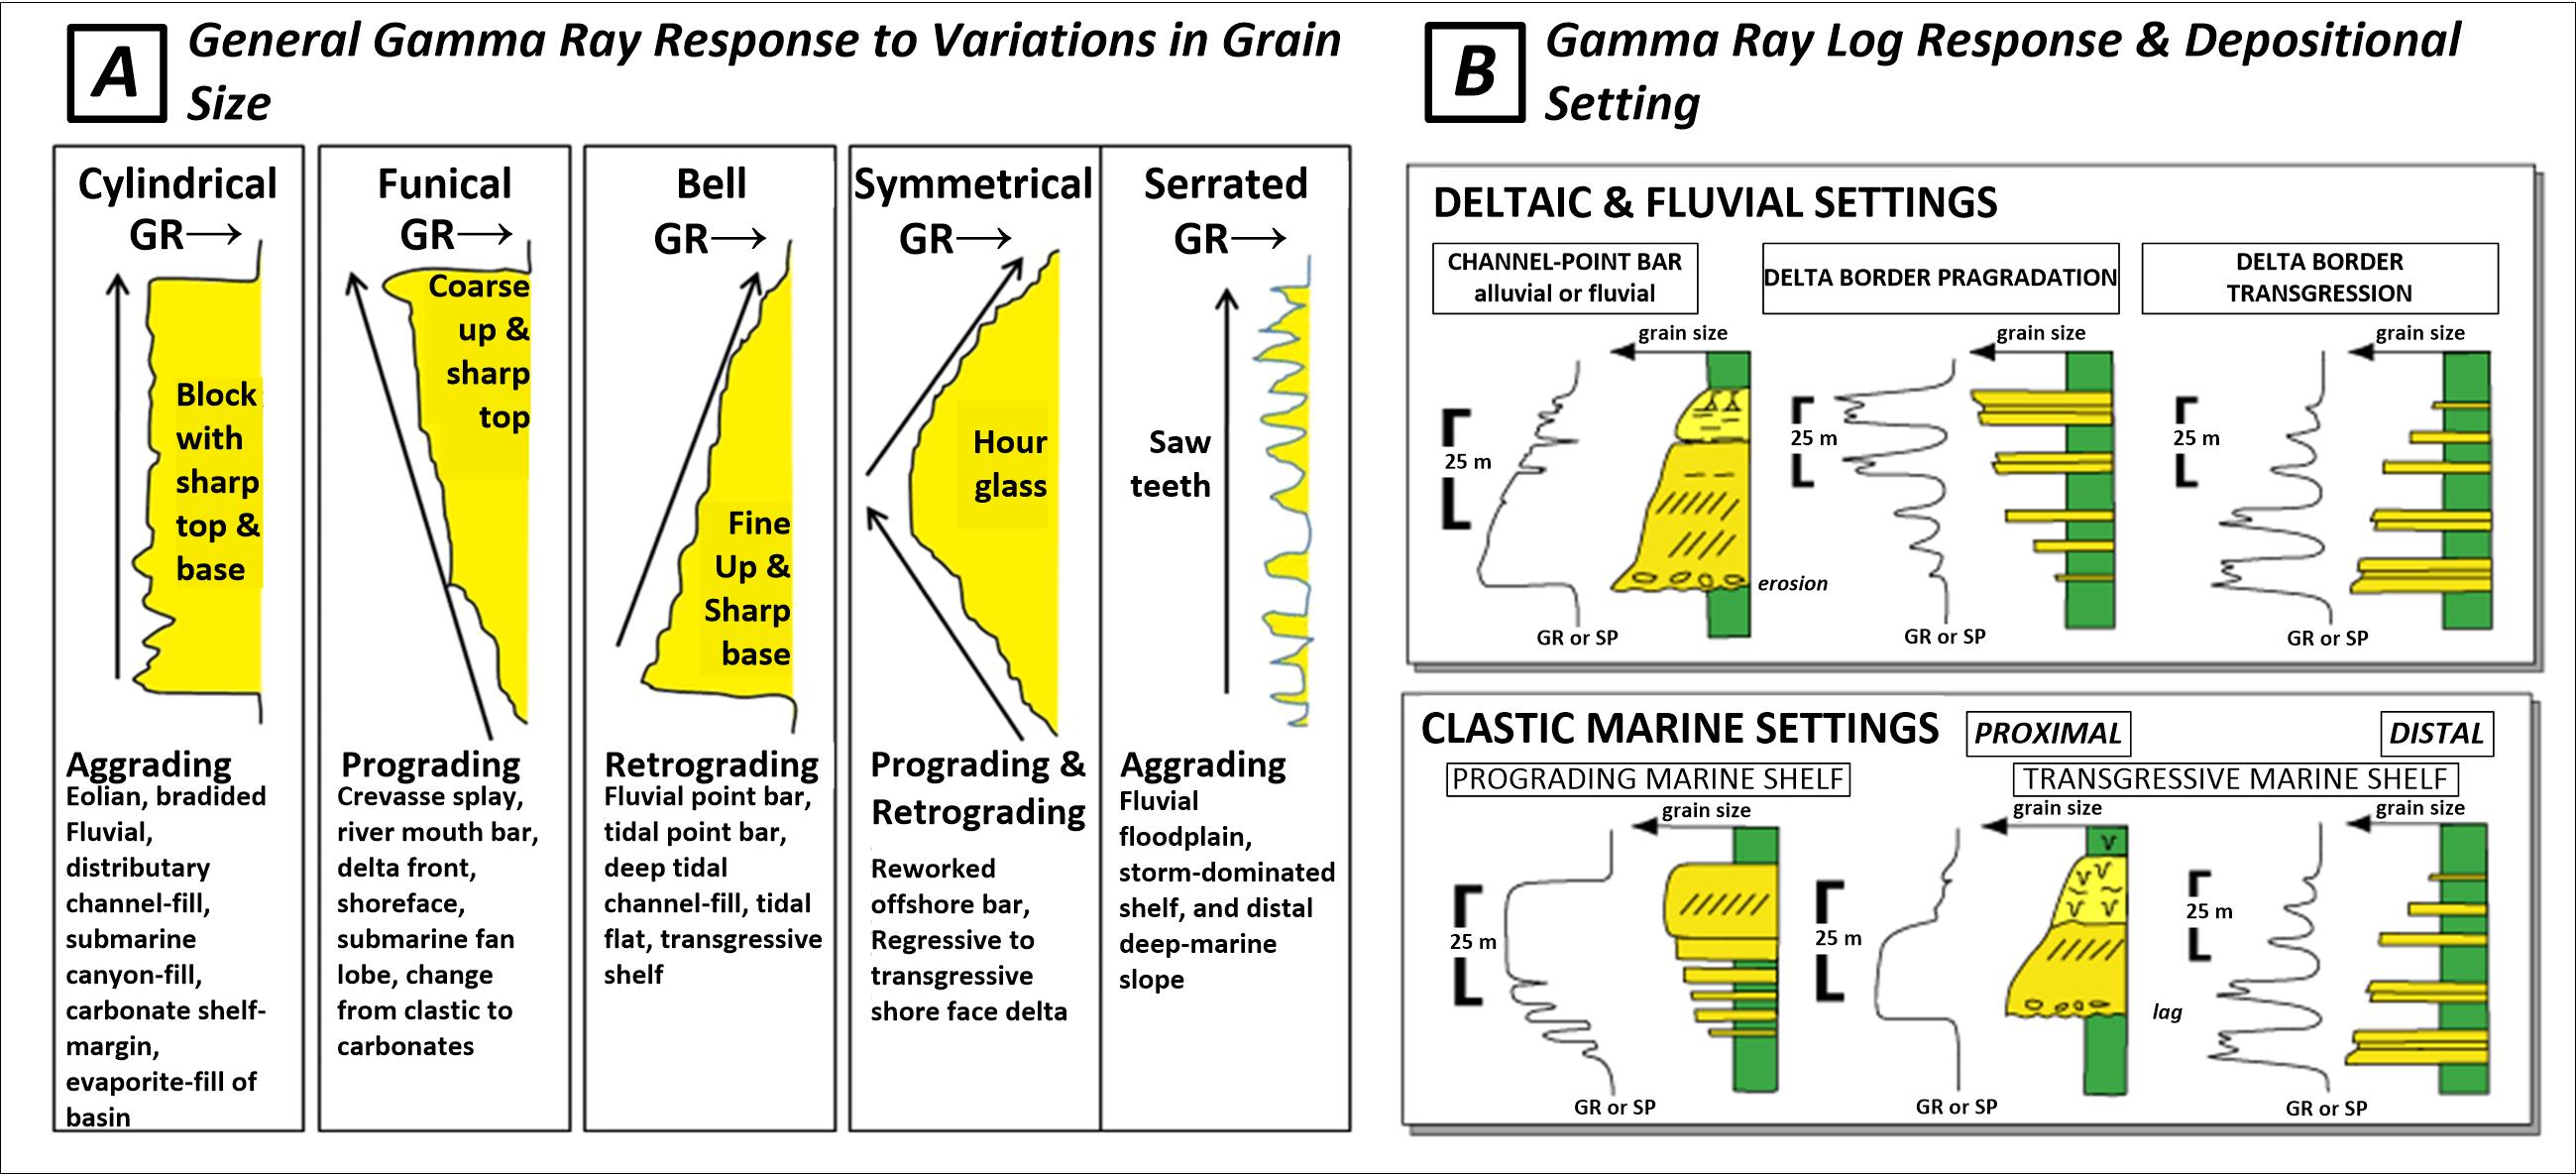
Figure 3. Gamma ray (GR) log response features and shapes for typical sedimentation settings used in a similar way to some extent for correlating units between CPT-derived kSBTn (or Ic) logs. A: Emery & Meyers (1996) B: Rider (1999), Krassay (1998); in SEPM, 2015.
2.3. Cone Penetration Test interpretation
22A brief discussion about the theoretical base behind the CPT-derived parameters Ic and kSBTn is presented below. For more background and detailed information reference is made to the extensive list of excellent publications of the research and experience of Robertson and colleagues (a.o. 1990, 2009, 2010a, 2010b, 2016).
23From two raw CPT parameters, cone resistance qc and sleeve friction fs, the friction ratio Rf is calculated:

24In general, coarse-grained sediments have high qc and low Rf values whereas the opposite is true for fine-grained sediments.
25Soil behavior charts like Robertson’s (1990, 2010a, 2016) and Robertson et al.’s (1986) basically use qc and Rf to define soil behavior types. These SBTs represent the behavior of the corresponding type of soils and mostly, but not necessary, coincide with their physical characteristics (e.g. granulometry, plasticity) and behavior (e.g. stiffness, compressibility).
26Figure 2B illustrates an updated SBTn chart (Robertson, 2010a) based on normalized equivalents of cone resistance and friction ratio. Using normalized parameters is a better practice in general because both qc and fs tend to increase with depth due to the increase of overburden stress.
27Robertson (2010b) presented a modified equation of SBT index Ic that essentially represents the radius of concentric circles that define the boundaries between the different soil types in the SBTn classification chart of Robertson (1990, 2009):

28where: Qt = the normalized (corrected for overburden stress) cone resistance, and Fr = the normalized friction ratio.
29The table in Figure 2C (Robertson, 2010a) lists the different soil behavior types SBTn, their corresponding range of Ic values and of kSBTn values.
30Figure 2D shows the graph that illustrates the relationship between Ic and kSBTn, from which a value of kSBTn can be calculated from each calculated Ic.
31Robertson (2010b) presented the following equations that give approximate estimates (!) for soil permeability:

32Sometimes, specific lithology or consolidation characteristics of soils result in underestimated kSBTn values. For example in the case of the glauconitic coarse sand of the Diest unit (see section 3.1.3) the high friction ratio gives clayey SBTn, high Ic and low kSBTn values. This effect can be explained from the crushing into clay of the glauconite (clay mineral) particles during penetration of the cone. A similar effect can be observed in overconsolidated sand with high friction ratio values.
3. Stratigraphic interpretation based on CPTs: some examples
3.1. Case of the Neogene in the Kasterlee–Dessel–Geel area in Belgium
3.1.1. General outline
33Figure 1 represents the mapped lithostratigraphic units (DOV, 2020) like assumed before the ONDRAF/NIRAS field site campaigns (blue contoured area on Fig. 1). The outcropping sediments are all of Miocene and Pliocene age and consist essentially of sand where the Pliocene sands show little contrast making stratigraphic interpretations of borehole samples difficult and uncertain (Vandenberghe et al., 2020, this volume).
34In the study area outlined in Figure 1, an integrated stratigraphic study led to the recognition of six Neogene stratigraphic units, four of which are newly proposed subdivisions that consistently can be correlated in the study area (Vandenberghe et al., 2020, this volume).
35Table 1 shows the lithostratigraphic relationship of these mapped units (respectively stating the existing geological interpretation, a recent update and a proposal for the ONDRAF/NIRAS study area based on the CPT logs), while an overlay on the map attempts to display the boundaries between the CPT derived units based on the Ic-kSBTn log analogy with the GR log.

Table 1. Lithostratigraphic table; (1) Schiltz et al. (1993); Gullentops & Vandenberghe (1995); VPO (Vlaams Planbureau voor Omgeving) (2019); Bm = Boom Formation (clay), Bc = Berchem Formation (glauconitic sand), Di = Diest Formation (glauconitic sand), c-KL = clayey Kasterlee, s-Kl (l-Ml?) = sandy unit between l-Ml and c-Kl interpreted as reworked c-Kl at the base of l-Ml (Vandenberghe et al., 2020, this volume; Adriaens & Vandenberghe, 2020, this volume), l-Ml = lower Mol sand, u-Ml = upper Mol sand, Pd-Ml = lateral sandy equivalent between Pd and Ml, Pd = Poederlee Formation (sand).
3.1.2. Methodology for a CPT interpretation and correlation approach
36The observation of the close relationship of the CPT derived hydraulic conductivity (kSBTn) and the normalised soil behavior type index (Ic) with the borehole gamma log (GR) and, to a much lesser extent, the electric resistivity log (RES), improved considerably the recognition of the different units in the ONDRAF/NIRAS study area. This was especially true for the Pliocene sandy units that are in this area characterized by a low lithologic contrast.
37The CPT-GR correlation is illustrated for three (Figs 4, 5 & 6) of the seven logged and cored boreholes in the research area to show the responses for the different units and their boundaries.
38The classical geologist’s approach is applied. It consists in a characterisation by using pattern changes and trends in the CPT logs and comparing them with the patterns and trends from the GR logs, the core descriptions and granulometry, determined on samples taken every 2 m.
39Relative changes and trends of the different parameters generally are of greater importance than their absolute values.
40Trends or changes of the classic parameters qc, fs and Rf do in general well for establishing the typical clay and sand alternations in a unit. As most of the sediments concerned are sandy with low lithologic contrast, the consistancy of these parameters is much lower.
41Sometimes they confirm the boundaries or the unit interval of the stratigraphic units defined by the kSBTn (Ic) and gamma log trend analogies, which show on the other hand excellent consistancy.
42Objective trend lines, that can be established in standard spread sheet program for these parameters, have been represented on the correlation graphs (see Figs 4, 5 & 6).
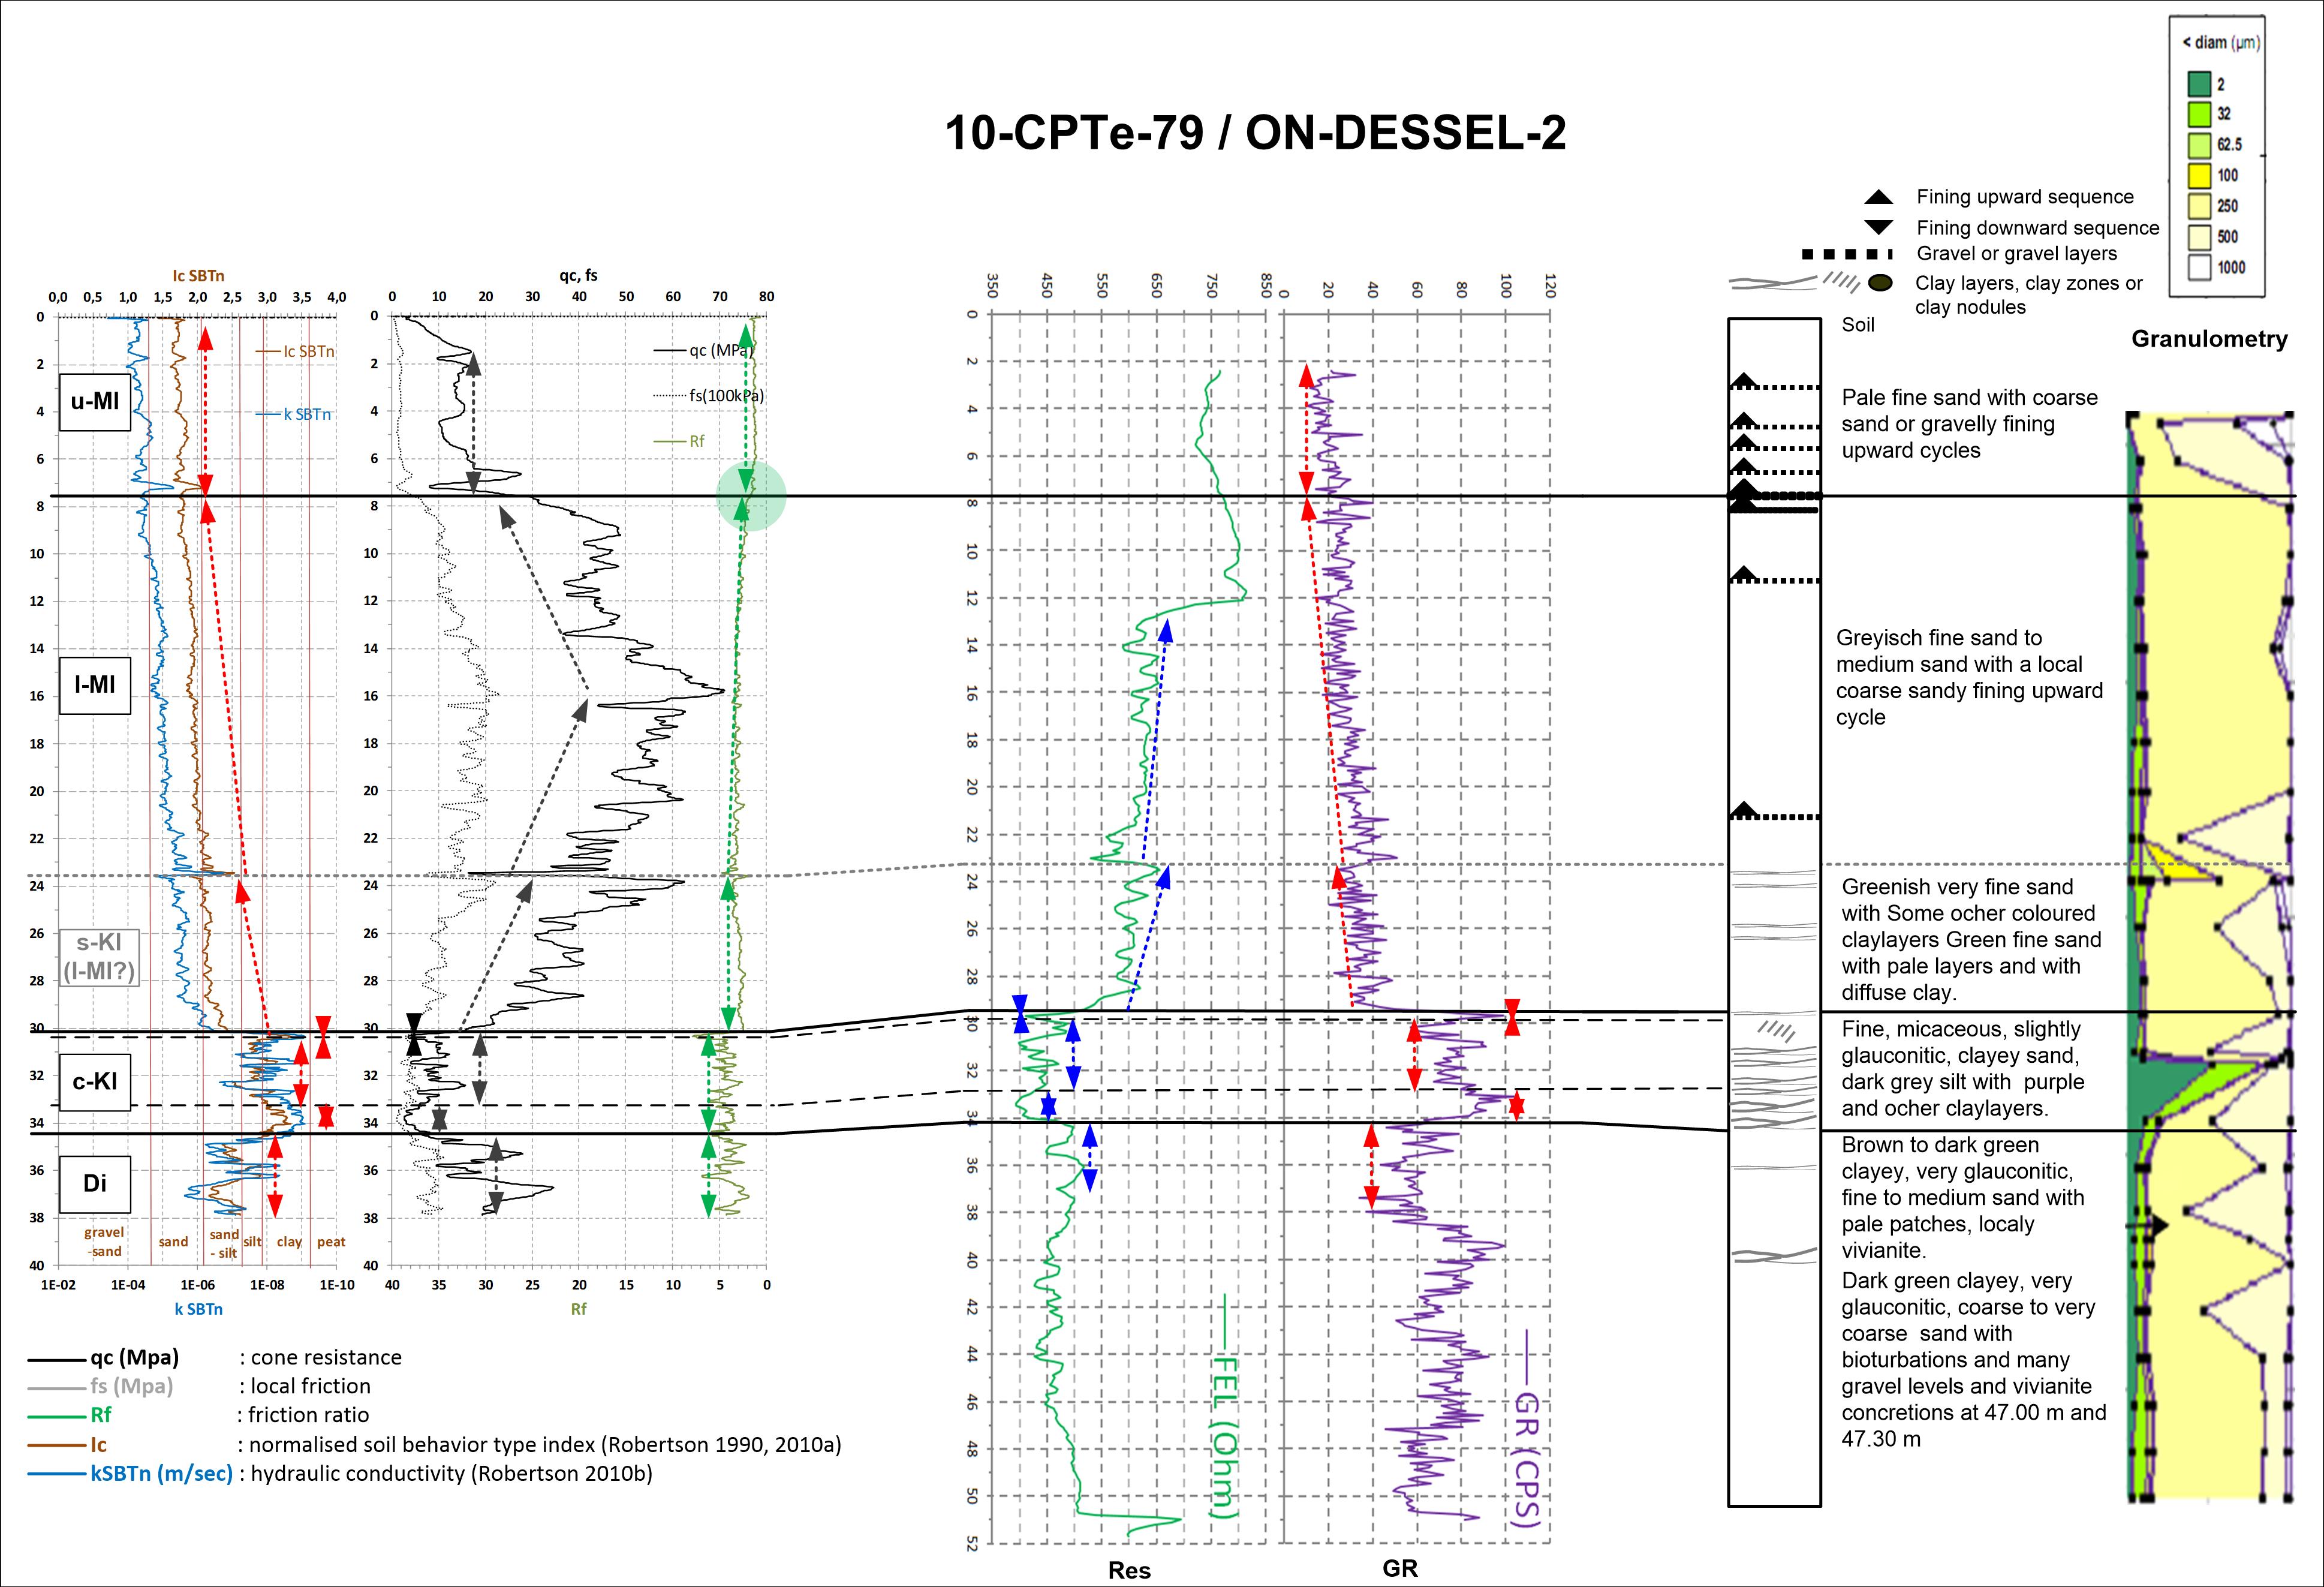
Figure 4. Correlation of CPT logs with cored and logged borehole ON-DESSEL-2 illustrating the consistent CPT-derived kSBTn (Ic) log response analogy with GR log response.
43Because of the high similarity of the CPT derived log subdivisions and the GR-RES established stratigraphy, stratigraphic correlations using only CPT logs, can be made in much the same way as geologists correlate classical geophysical borehole logs. Therefore the CPT log data have significantly contributed to establish the reliability and robustness of the integrated stratigraphy in Vandenberghe et al. (2020, this volume). Even in a case where no GR nor Resistivity log are available (ON-Geel-1 borehole) and even without a borehole (Poederlee hill, 10-CPTe-138), CPT data could be used to establish a succession comparable to the established stratigraphic succession in that area (Fig. 7).
44Therefore CPT characterisation of the established stratigraphic units can now be added for the ONDRAF/NIRAS research area.
45In what follows the description of the CPT characteristics, where needed extended with the description of some crucial other characteristics from borehole logs, granulometry or sample descriptions (Wouters & Schiltz, 2013; Vandenberghe et al., 2020, this volume) is discussed for each of the identified units following their stratigraphic position.
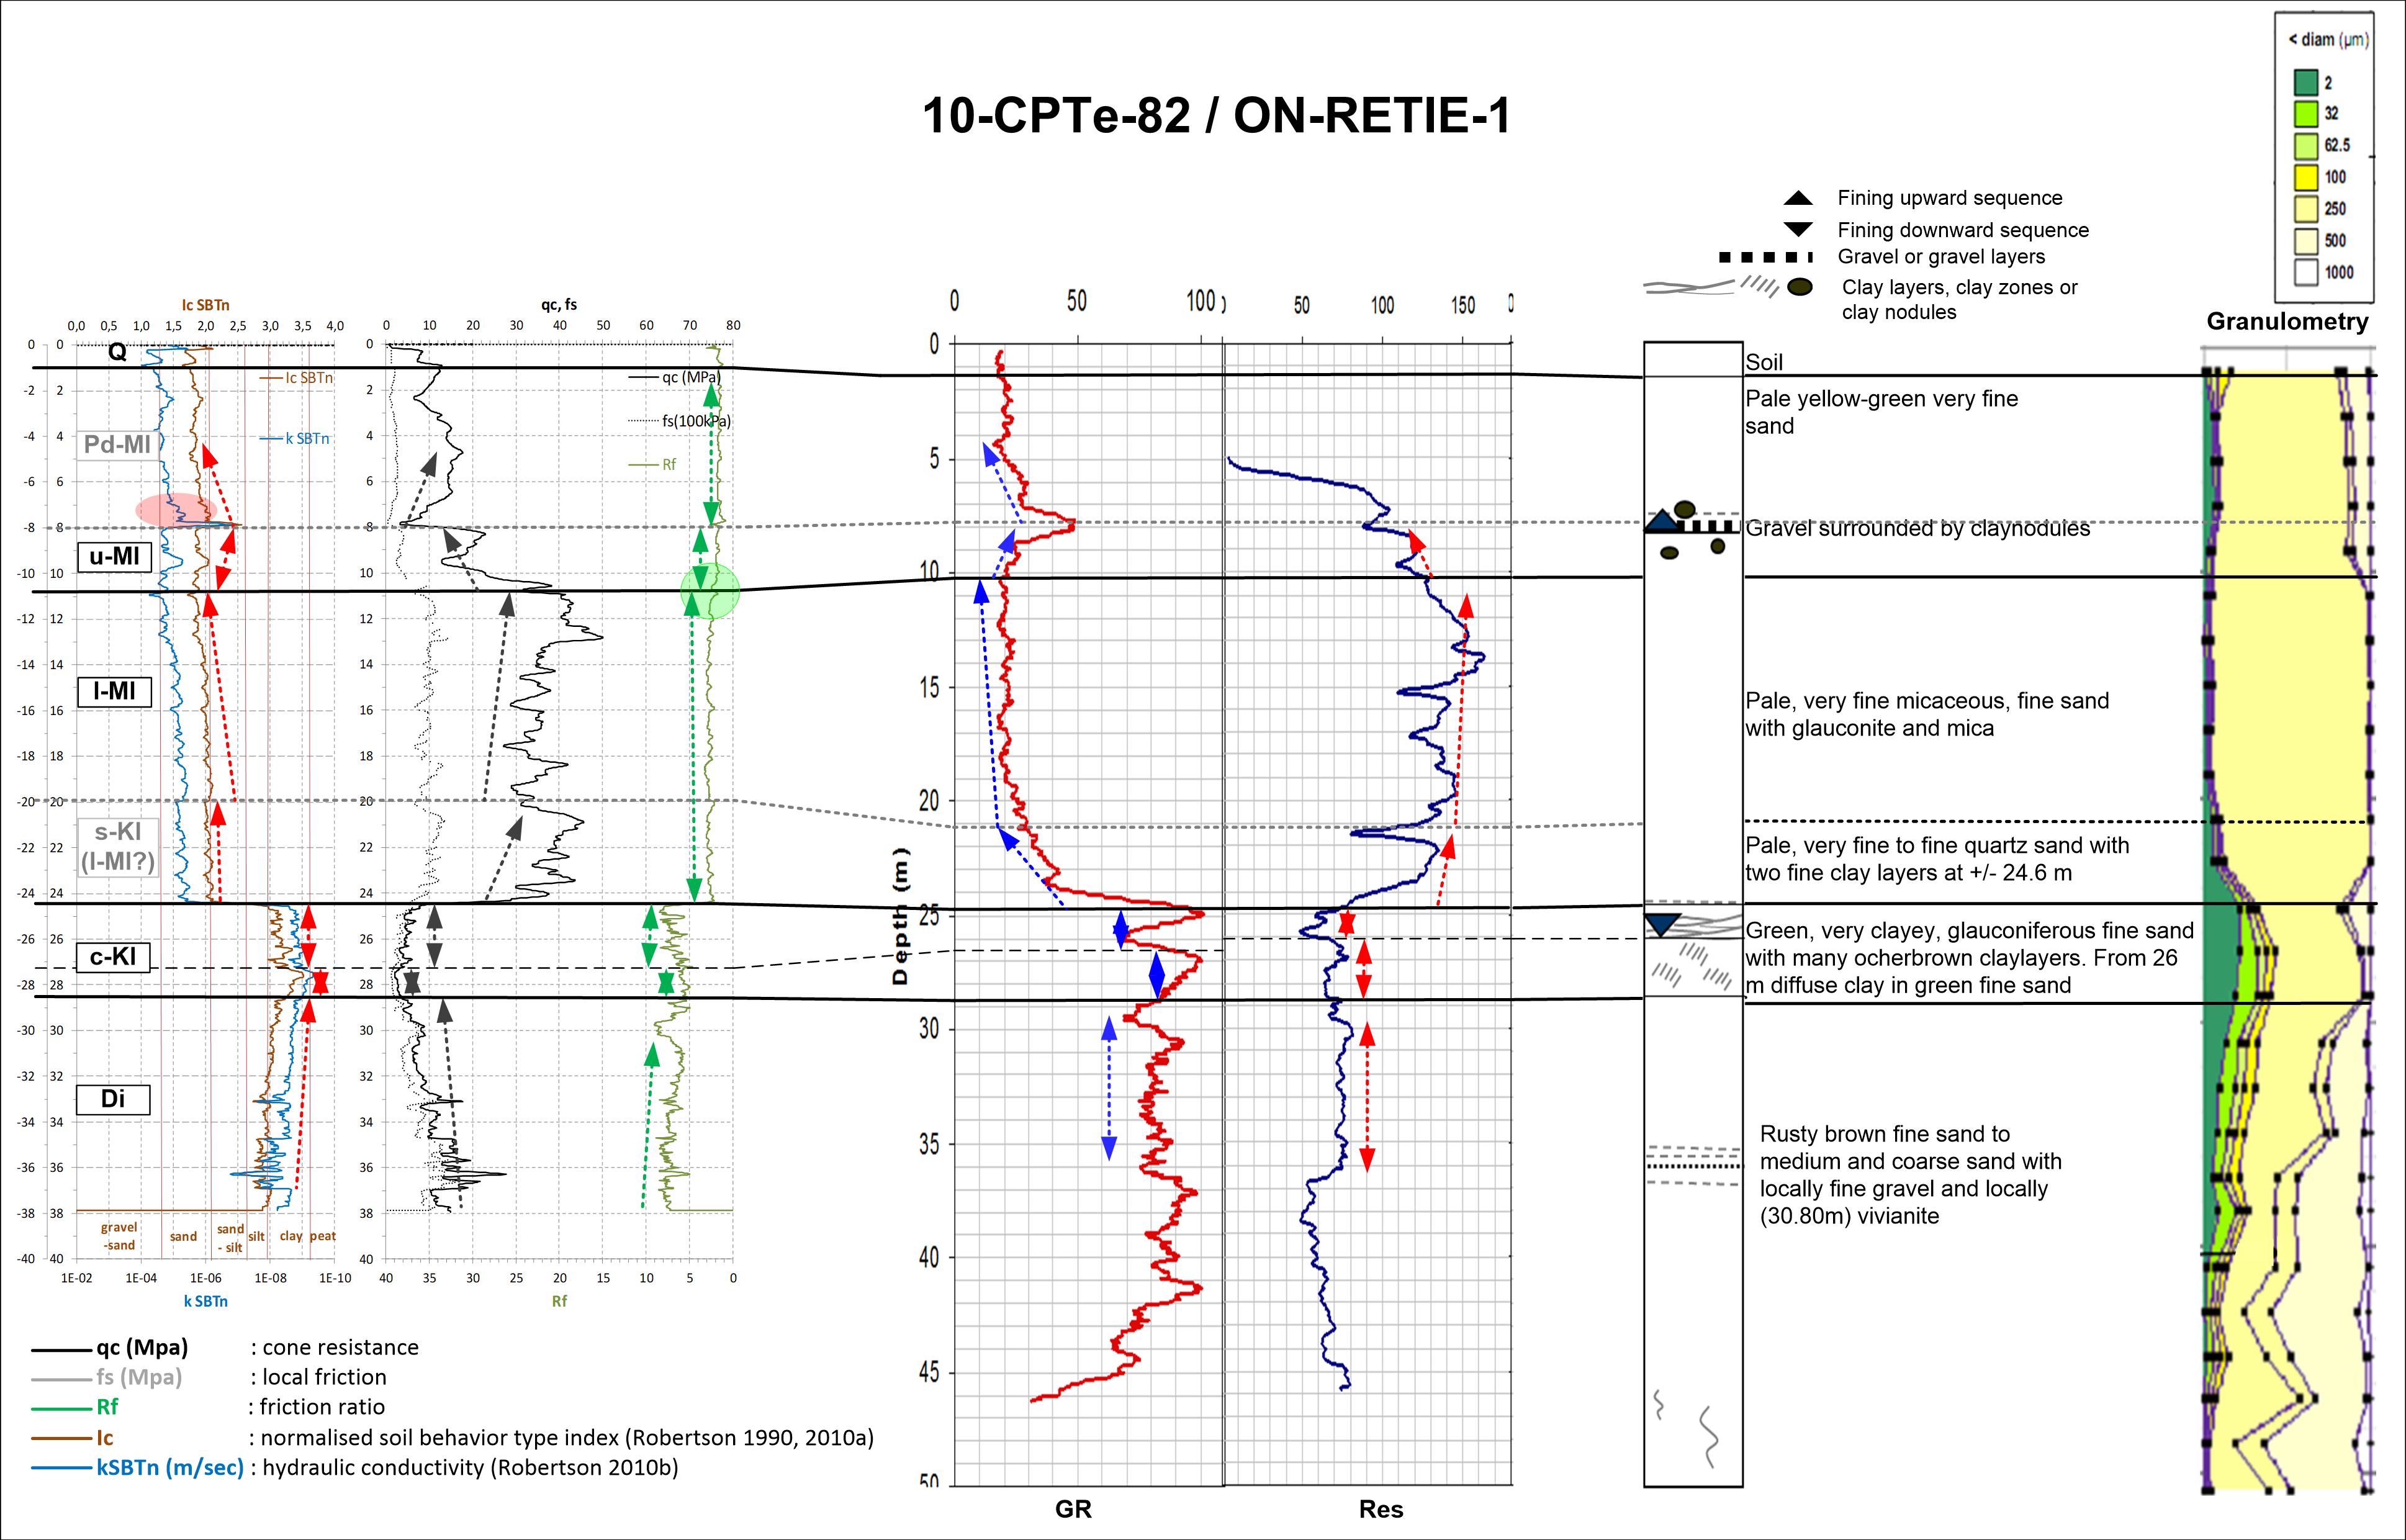
Figure 5. Correlation of CPT logs with cored and logged borehole ON-RETIE-1 illustrating the consistent CPT-derived kSBTn (Ic) log response analogy with GR log response. A Pd-Ml unit is defined above the l-Ml unit, showing a similar response with the Pd unit on the Kl unit in the Kasterlee hill and a different response with the response of the u-Ml unit in the other boreholes.
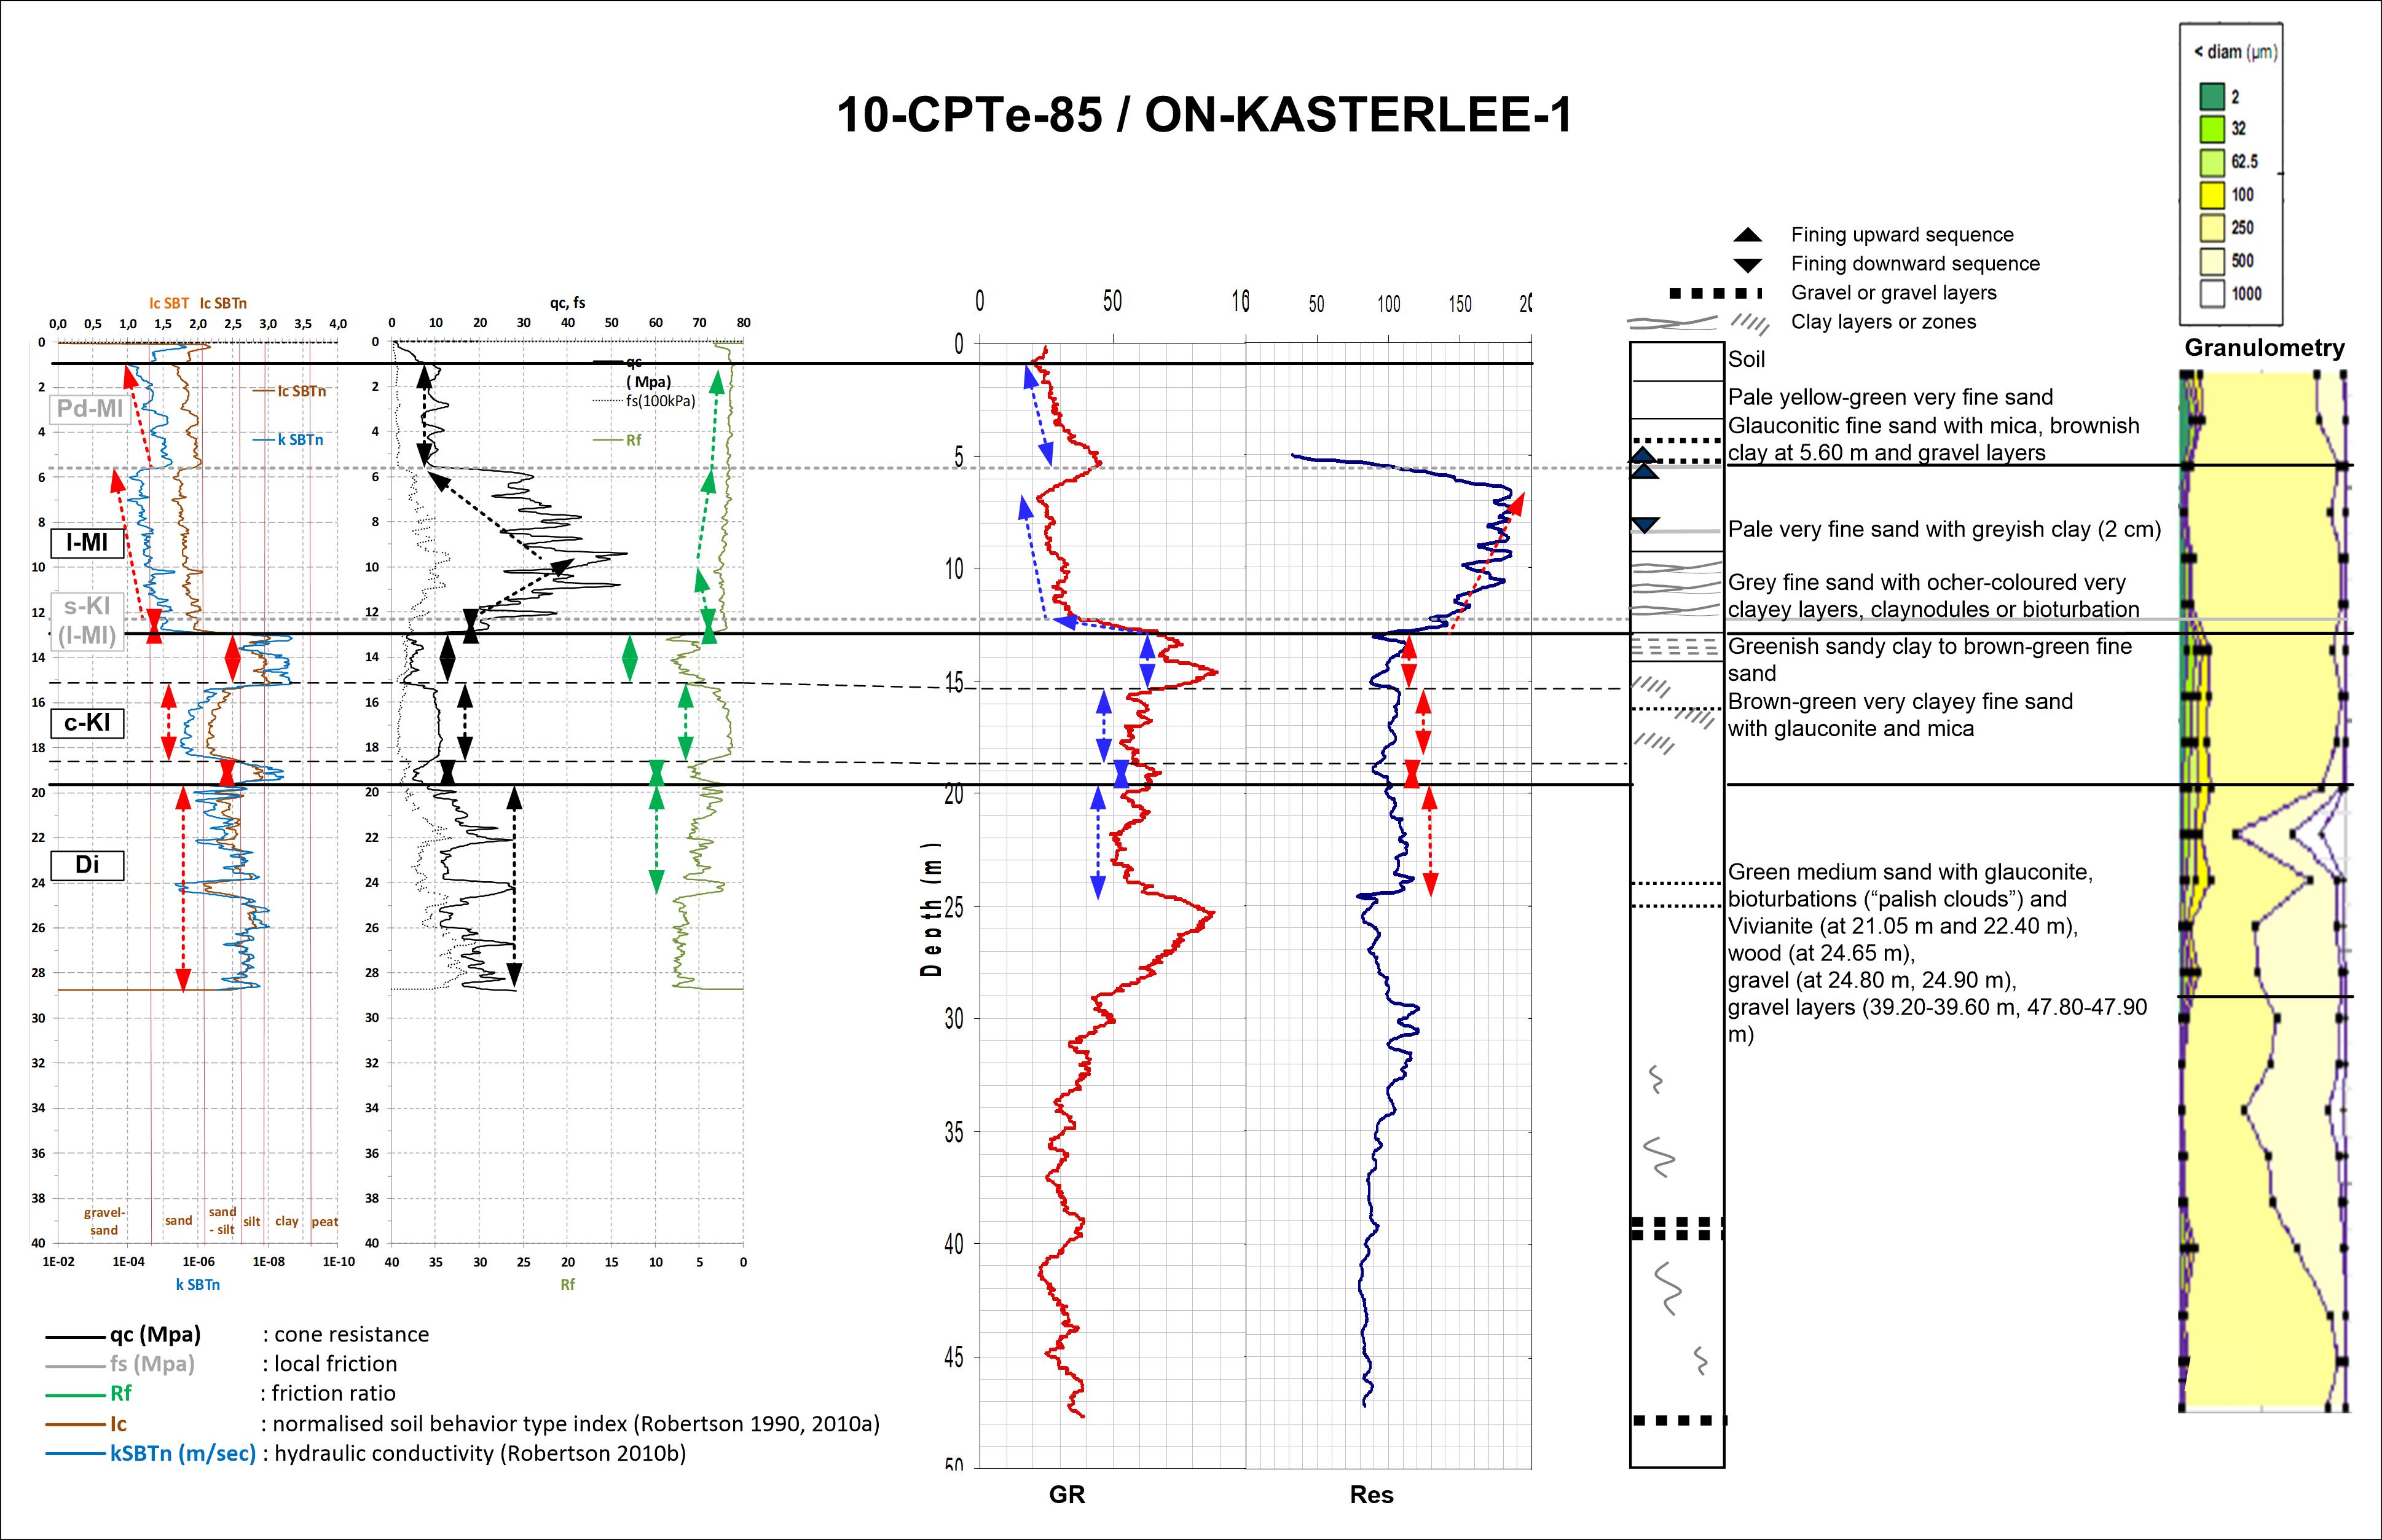
Figure 6. Correlation of CPT logs with cored and logged borehole ON-KASTERLEE-1 illustrating the consistent CPT-derived kSBTn (Ic) log response analogy with GR log response. A Pd-Ml unit is defined above the l-Ml unit, showing a similar response with the Pd unit on the Kl unit in the Kasterlee hill and a different response with the response of the u-Ml unit in the other boreholes.
3.1.3. Formal and informal stratigraphic units based on CPT response
46The different CPT derived units are described from bottom to top and compared to the integrated stratigraphic sequence established by Vandenberghe et al. (2020, this volume). The units are indicated on Figures 4 to 10 and the relation with the integrated stratigraphy is shown in Figures 4, 5 and 6.
47Di unit
48This unit does not crop out in the ONDRAF/NIRAS study area.
49Because of the limited depth (maximal up to 12 m) reached by CPTs in this geological formation the characterization is not necessarily representative for this Formation as a whole in the studied area.
50This unit is lithologically characterized by medium to coarse glauconitic sands and coincides with the Diest Formation.
51The kSBTn (Ic) logs are irregular, with medium to low values, showing an overall trend of upwards decreasing values of kSBTn (respectively increasing values of Ic) in general. The consistency with GR response is mostly clear for each of the borehole locations, but in between the boreholes, the responses can differ and sometimes even show opposing trends. In this sedimentary facies studied short and thin clay lenses and clay rip-up clasts can locally occur and influence the reading of GR and CPT logs.
52The boundary between this unit and the c-Kl unit above is well defined by lithological, granulometrical and mineralogical characteristics (Beerten et al, 2010; Adriaens, 2015; Vandenberghe et al., 2020, this volume) and the top of the CPT Di-unit coincides with the top of the Diest Formation.
53The top of the Di-unit is mostly characterized by a more or less marked drop or increase of the kSBTn value, corresponding with a generally well-marked increase or decrease of the GR log.
54However it should also be noted that although the contrast between the Di-unit and the overlying c-Kl unit is commonly well expressed, it may not always be so obvious.
55The most probable reason is the high glauconitic content of the Di-unit, causing high friction when being crushing to clay during penetration of the cone. This results in high Rf values with no or only poor contrast at the boundary between the Di and c-Kl units, the latter being typically clayey. This also explains the typical clayey and silty clay SBT returns for the processed CPTs according to the scheme outlined in Fig. 2B.
56c-Kl unit
57This unit is characterized by an irregular kSBTn log with an overall decreasing trend and with low to very low kSBTn (high Ic) values, expressing the very clayey content of this unit.
58In general this unit is characterized by 2 to 3 sublayers (clay/sand) that are mostly clearly individualized. The correspondence with GR-log is clear and consistent for every location and for the unit as a whole in the studied area.
59The consistency is also very clear for the top of this unit where it is characterized by a sharp increase of kSBTn (Ic decrease) and a sharp drop of the GR-log. This boundary is well represented by a response change for all of the CPT and borehole parameters.
60This CPT c-Kl unit is corresponding to the ‘clayey Kasterlee’ unit described in the integrated stratigraphy of the area by Vandenberghe et al. (2020, this volume).
61Importantly under the Lichtaart-Kasterlee hill ridge where control boreholes are lacking, the presence of the c-Kl unit still can be recognized beyond doubt below what is the stratotype Kasterlee Sand unit (see 10 CPTe-138 in Fig. 7).
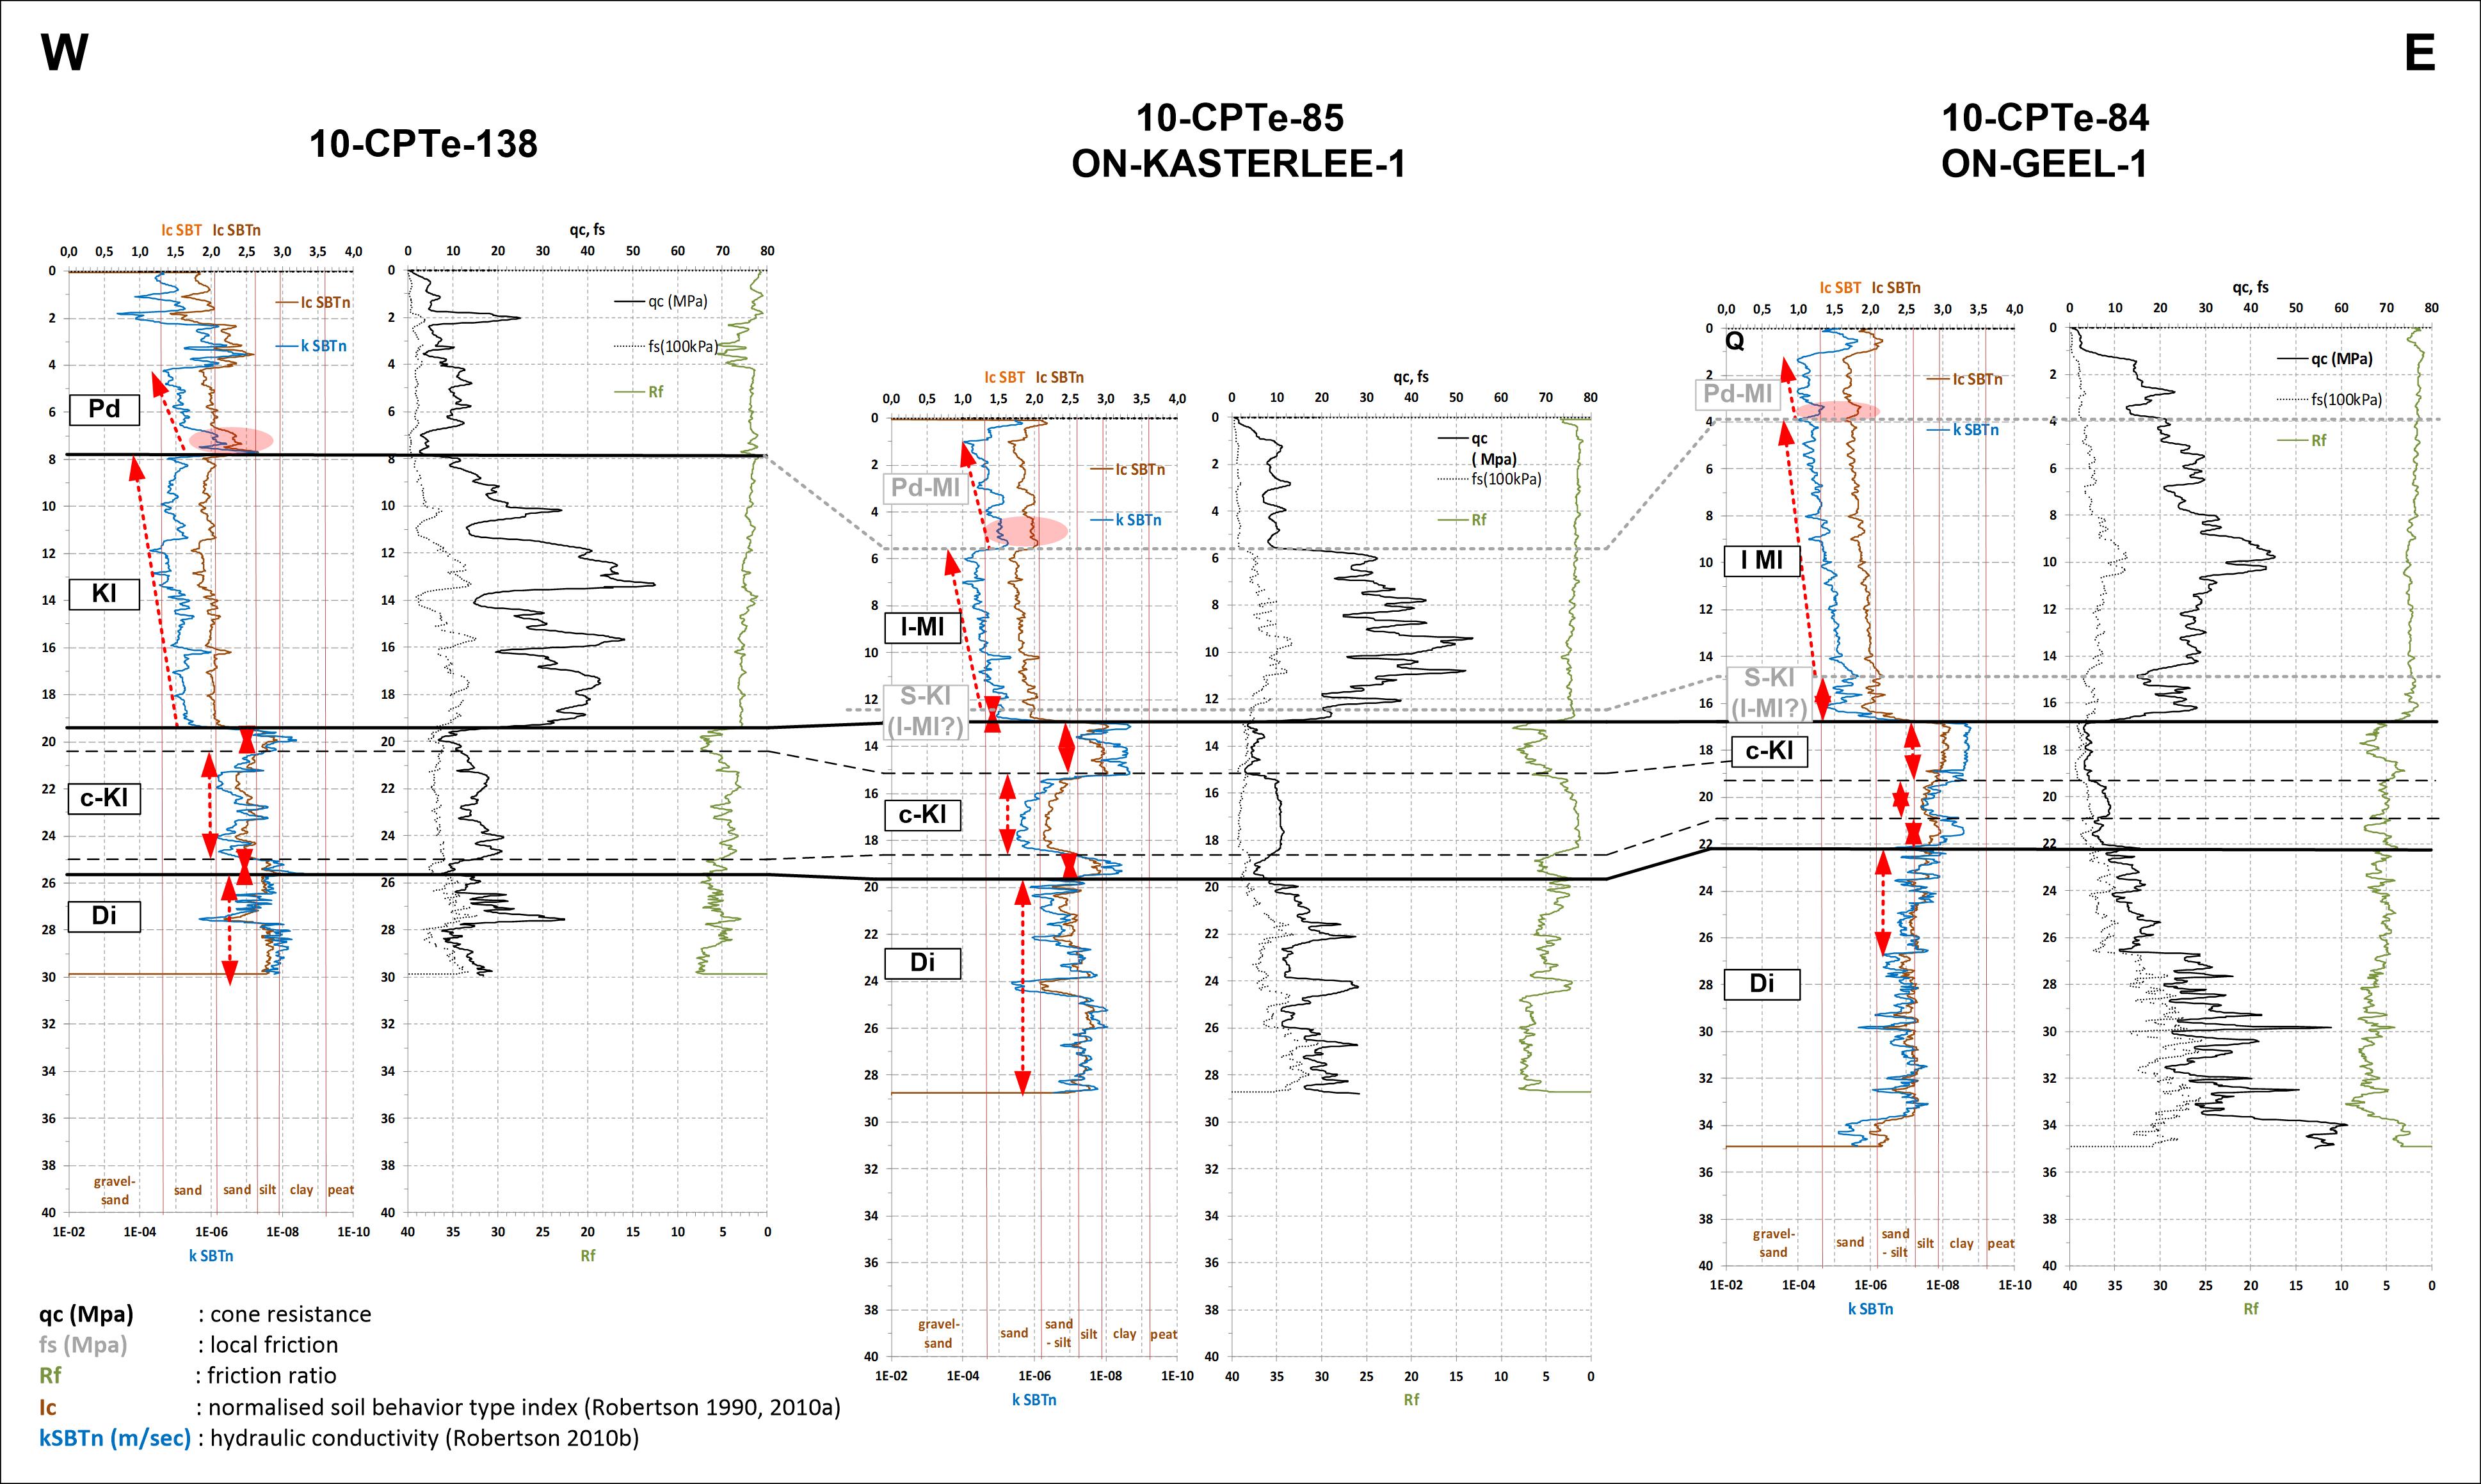
Figure 7. Correlation of CPT logs at cored and logged reference boreholes ON-GEEL-1 and ON-KASTERLEE-1 with the Kasterlee hill reference CPT (10-CPTE-138) illustrating the consistent CPT-derived kSBTn (Ic) log response (similar to GR log response) of the different defined units between the CPTs in general and especially the analogy of the CPT log response between Pd and Pd-Ml unit above Kl and l-Ml units.
62s-Kl unit
63In the CPT logs nearby the control ON-boreholes a few meters at maximum can be individualized as the s-Kl unit just above the c-Kl-unit, equivalent to the ‘clayey Kasterlee’ unit. This thin s-Kl unit occurs below a thicker and regularly trending l-Ml unit (Figs. 4–10).
64In the CPTs this s-Kl unit shows a somewhat irregular kSBTn and GR trend, with approximatively constant or slightly increasing kSBTn with low to medium values. The top of this unit is characterized by a kink of the kSBTn (Ic), Rf and GR logs, sometimes combined with a sharp increase or drop.
65This unit corresponds to large extent in the CPT close to borehole ON-Dessel-2 where based microfossils Kasterlee Formation was interpreted (Louwye et al, 2007), but the parameter responses in the CPT logs are in general less obvious.
66This s-Kl unit has been closely compared to the integrated stratigraphy in many ON-boreholes and the correspondence with the position and thickness of a reworked unit at the base of the ‘lower Mol’ or ‘Kasterlee sensu Gulinck’ unit as described in Vandenberghe et al. (2020, this volume) is excellent. It consists of slightly glauconitic and greenish colored sand also influencing the GR and RES logs at the base of the overlying paler grey sand as shown in Figures 5 and 6. This interval was micropaleontologically characterized by Louwye et al. (2007).
67l-Ml and Kl units
68This CPT l-Ml unit occurs in all CPT logs and is several meters thick. It is typically characterized by a gentle increase of kSBTn (decrease of Ic), generally coinciding with a gentle decrease of GR log.
69The top is in general characterized by a maximum of this increasing trend, followed by a pronounced drop in kSBTn.
70Also Rf shows a consistent kink, mostly with a small drop in value, in its log trend at the boundary between the l-Ml and u-Ml units. This kink coincides with the change between the finer granulometry of l-Ml and the coarser u-Ml as is known from ON-borehole core analyses (Schiltz, 2008; Beerten et al., 2010).
71A comparison with the units established in the integrated stratigraphy of the area (Vandenberghe et al., 2020, this volume) and the corresponding GR and RES subdivisions as shown e.g. in Figures 4, 5 and 6, shows an excellent correspondence with the ‘lower Mol’ or ‘Kasterlee sensu Gulinck’ unit.
72This pale quartz sand unit could geometrically be considered the eastward continuation of the type Kasterlee Sand as is done by Gulinck and coworkers at the Geological Survey of Belgium although lithologically it resembles more the overlying quartz sand of the Mol Formation.
73Also it is not clear whether this ‘lower Mol’ or ‘Kasterlee sensu Gulinck’ unit is a direct geometrically continuation of the type Kasterlee Sand or if it erodes it. This issue is discussed in Vandenberghe et al. (2020, this volume) but remains unsolved also because a cored reference borehole in the Kasterlee Sand type area just west of the ON-borehole area is lacking.
74The 10-CPTe-138 log is the best information available from that area (Fig.7) and it can be seen that the CPT response of the l-Ml unit very strongly resembles the CPT signature of the Kasterlee Sand in the type area. Both units show a constant trend or a generally gentle increase of kSBTn (Ic decrease) marked with a sharp drop or kink in the trend of kSBTn (Ic) at the top.
75u-Ml units
76This unit is typically represented by medium to coarse white or pale sand, sometimes with several thin fine gravel beds. It occurs in the eastern part of the research area above the l-Ml unit.
77The section in the CPT kSBTn (Ic) logs that corresponds with this unit has maximal kSBTn values. The high values make up an approximatively constant or slightly increasing trend after a kink at the base. This signature is more or less mirrored by the GR logs. Typically for many of the CPTs the base of this unit is characterized by a kink associated with a small drop in Rf.
78Examples of this succession l-Ml and u-Ml are nearby the boreholes ON-Retie-1, ON-Dessel-3, ON-Dessel-4 and ON-Dessel-2 (Figs 4, 5 & 8).
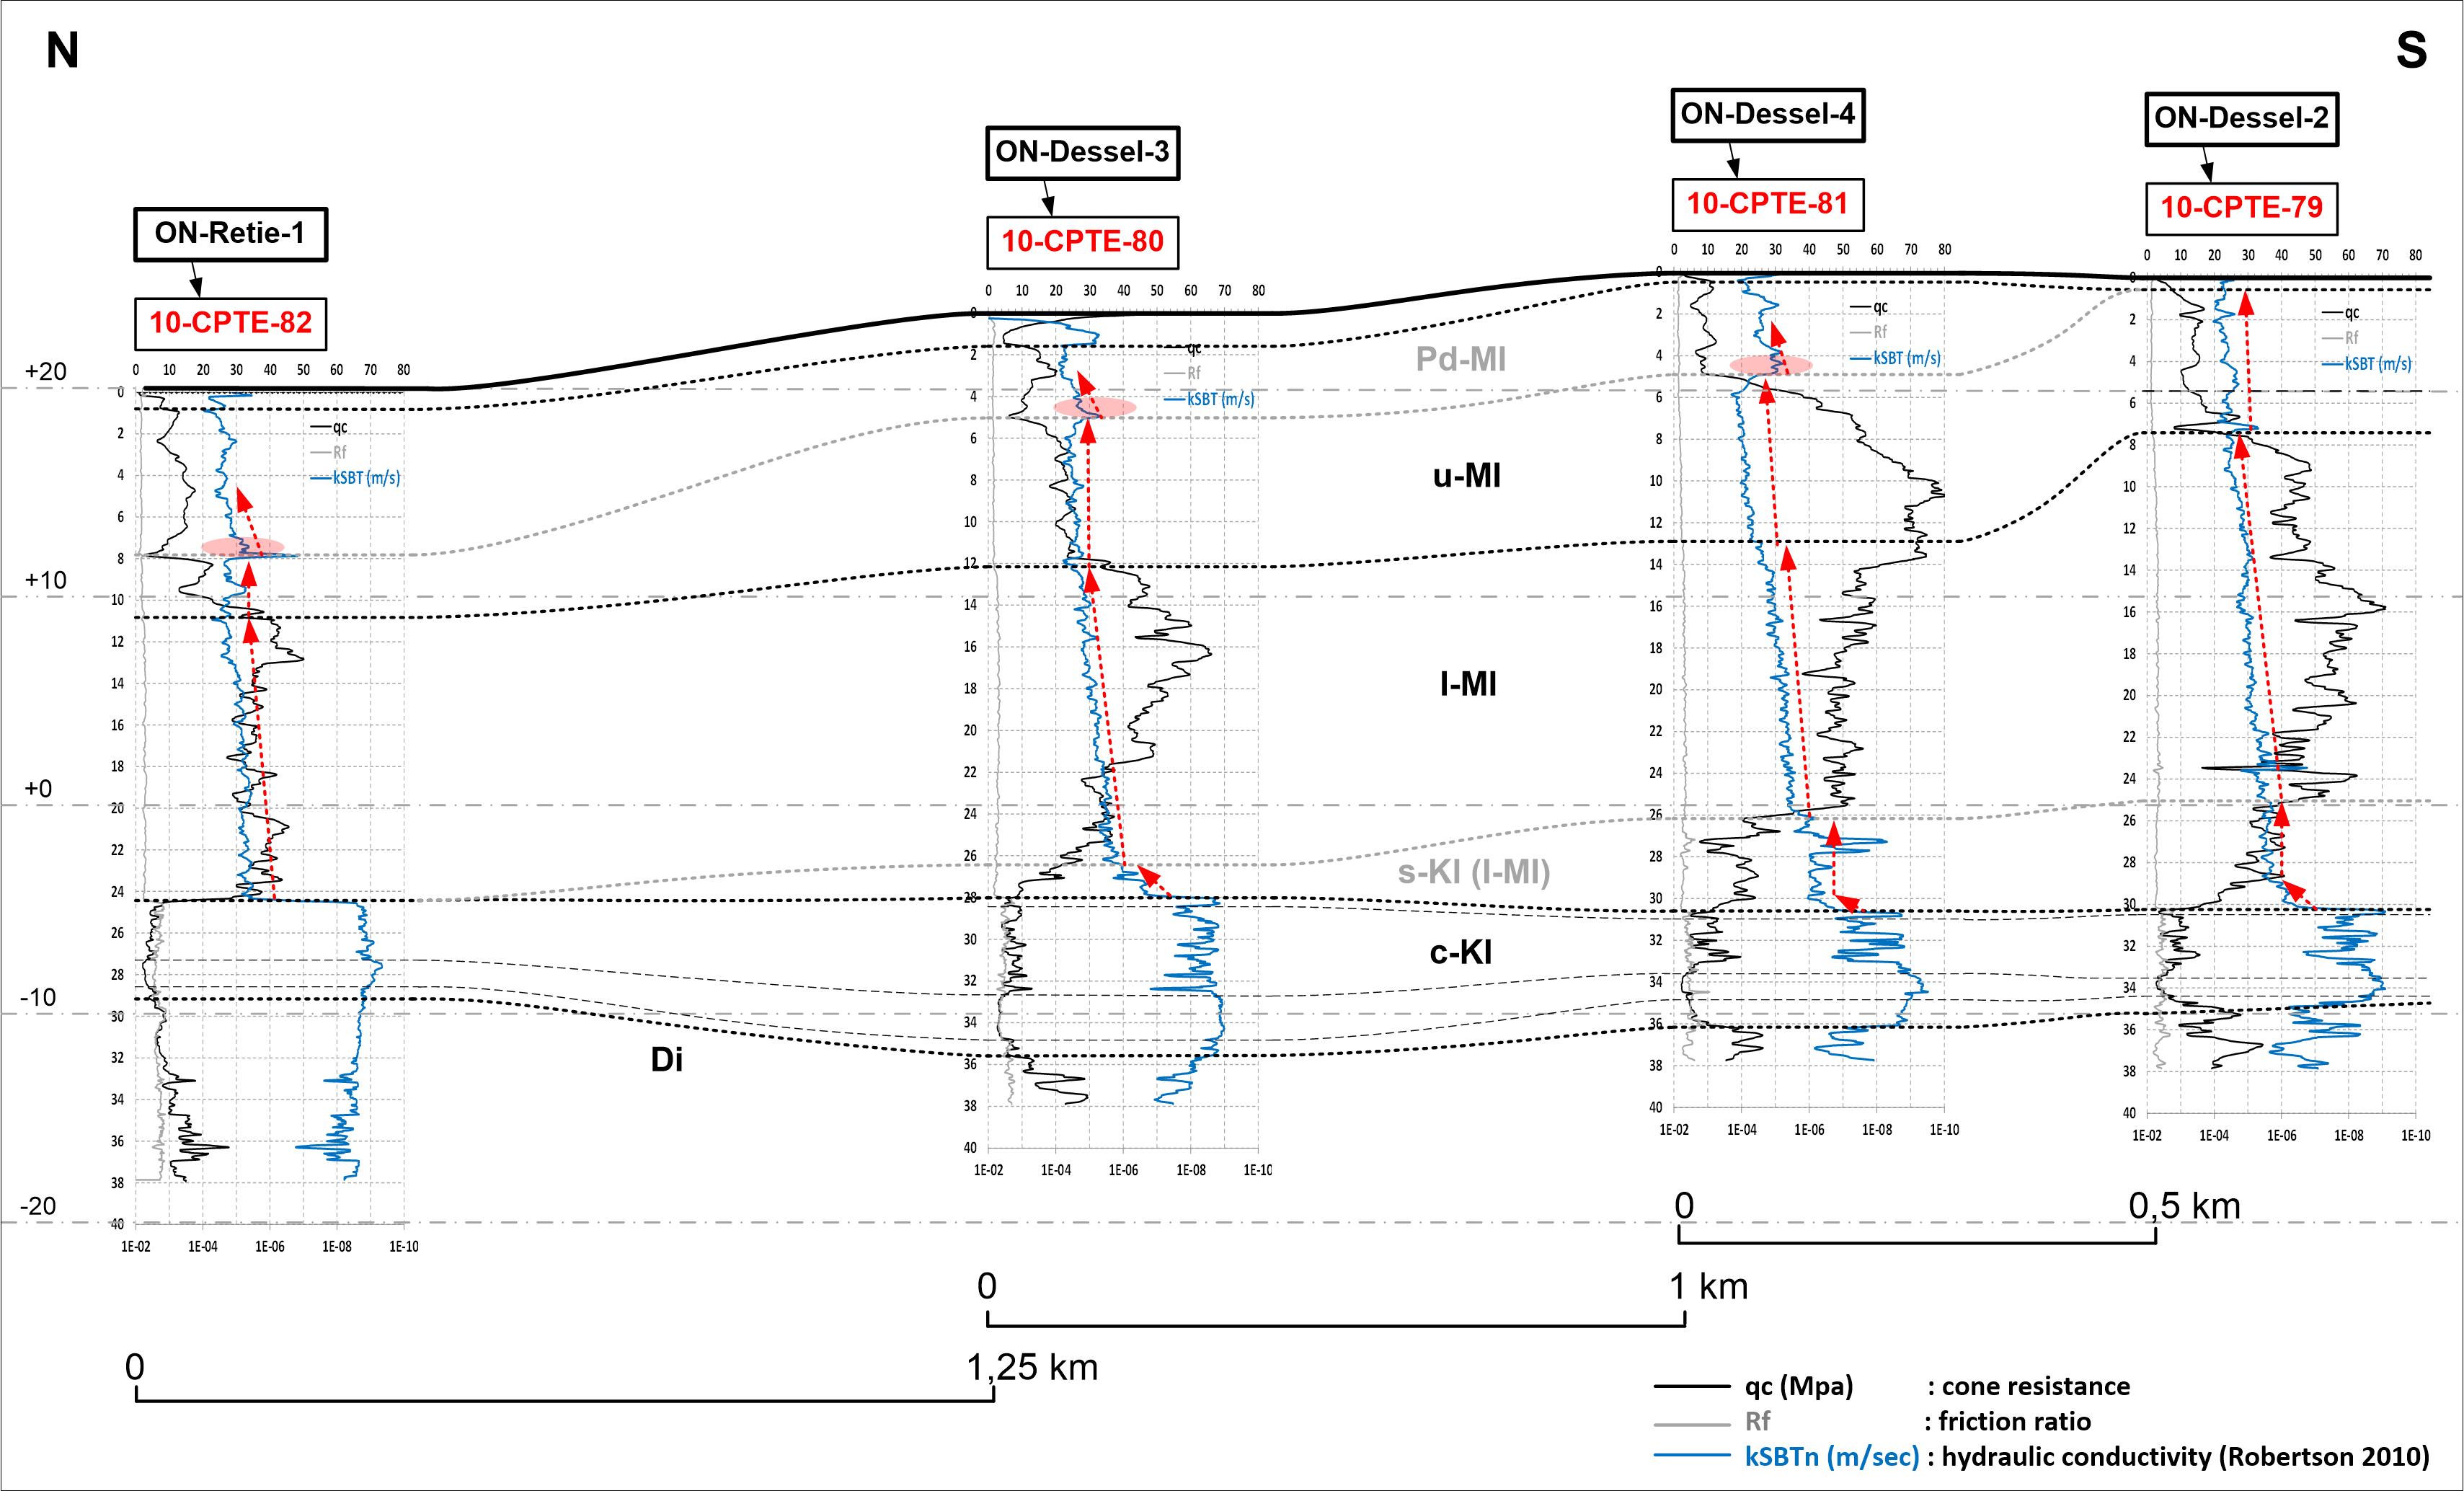
Figure 8. Section of CPTs from the ON-Dessel-2 cored and logged reference borehole to the N over the cored and logged reference boreholes ON-Dessel-4, ON-Dessel-3 to ON-Retie-1 the ONDRAF/NIRAS study area. Correlations based on CPT derived kSBTn log response after calibration with the boreholes. Unit codes see text and Figure 1.
79Pd and Pd-Ml units
80To the west, a unit Pd-Ml occurs on top of the u-Ml unit as shown in the CPTs near boreholes ON-Geel-1 and ON-Kasterlee-1 (Figs 6 & 7). This unit is generally characterized by a sharp drop and lower kSBTn (high Ic) values at the base followed by an increasing trend of the kSBTn log (decreasing Ic).
81In some cases the Pd-Ml unit is found above the u-Ml unit as is the case in the CPT log near ON-Retie-1 (Fig. 5) and ON-Dessel 3 and 4 (Fig. 8). The kSBTn (Ic) log response of this unit is clearly different from the one of the u-Ml unit.
82The kSBTn (Ic) log response of the Pd-Ml unit resembles very well, in particular in the lower part the signal from a CPT across the nearby (just NW of the ONDRAF/NIRAS research area) stratotype Poederlee Formation (10-CPTe-138 in Fig. 7), the CPT Pd-unit. The base of the Poederlee Formation in the CPT is localized based on a nearby incised road where it is characterized by a clayey base with fine gravel (Hukkelberg gravel) followed by pale fine sand that is often locally cemented into limonite concretions (DOV TO-20120101 in Vandenberghe et al., 2020, this volume).
83The core descriptions (Wouters & Schiltz, 2013) of some of the boreholes (ON-Retie-1, ON-Kasterlee-1) mention the presence of clay and gravel at or near the lower boundary that is represented by the lower boundary defined by the kSBTn trend of the Pd-Ml unit, analogous features that can be observed for the Pd-unit in the Kasterlee hill.
84Although the CPT signals suggest the presence of two different lithological units, u-Ml and Pd-Ml, occurring above the l-Ml unit, the established integrated stratigraphy (Vandenberghe et al., 2020, this volume) only recognizes one single lithostratigraphic unit, namely the Mol Formation corresponding to the u-Ml unit.
3.1.4. Stratigraphic correlation profiles in the Kasterlee-Dessel-Geel area based on the CPT derived units
85As the CPT units derived in individual boreholes are consistently recognized in the study area, correlation profiles were constructed to illustrate their potential in describing the geometrical build-up of the area (Figs 8, 9 & 10). The CPT nearby borehole ON-Dessel-2 is present in the three profiles.
86As the trends described in the previous section proved to be consistent and matched borehole trends, they were used to correlate these and additional CPTs to create different profiles (Figs 8, 9 & 10). The trends of the different parameters are indicated with arrows in these figures.
87The correlations in these sections are straightforward. Some specific observations are discussed below.
88In the NS section across the ONDRAF/NIRAS site some detailed vertical variations within the c-Kl or ‘clayey Kasterlee’ unit appear to occur consistently in the area. The northward thinning of the s-Kl unit, representing sediment at the base of the l-Ml unit reworked from the underlying unit, could point to more intense erosion of l-Ml into c-Kl in the south.
89The NS section (Fig. 8) is also added to show the consistency of the kSBTn log between the u-Ml unit and Pd-Ml unit above, characterized by an abrupt but small drop and by a lower-value basal part (indicated by a reddish spot) followed by an increasing trendline of kSBTn. Such a trend is not observed in the CPT at borehole ON-Dessel-2, where kSBTn trend remains at a constant high level after a maximum reached at the boundary with the l-Ml unit. This section can be interpreted as showing an incision of the Pd-Ml unit, becoming thicker towards the north, into the u-Ml unit and thus its younger stratigraphic position.
90The WE section (Fig. 9) is compatible with the incision hypothesis. From W to E the Poederlee Formation or Pd-unit extents eastward into the Pd-Ml unit. Both have a similar consistent kSBTn signature at their boundary (red spot in Fig.9) that differs from the Mol Formation or u-Ml unit more to the east. This lateral change from Pd-Ml over a short distance east of the ON-Retie-2 borehole location into the u-Ml unit could be erosive but also be just a lateral transition (see also discussion in Vandenberghe et al., 2020, this volume).
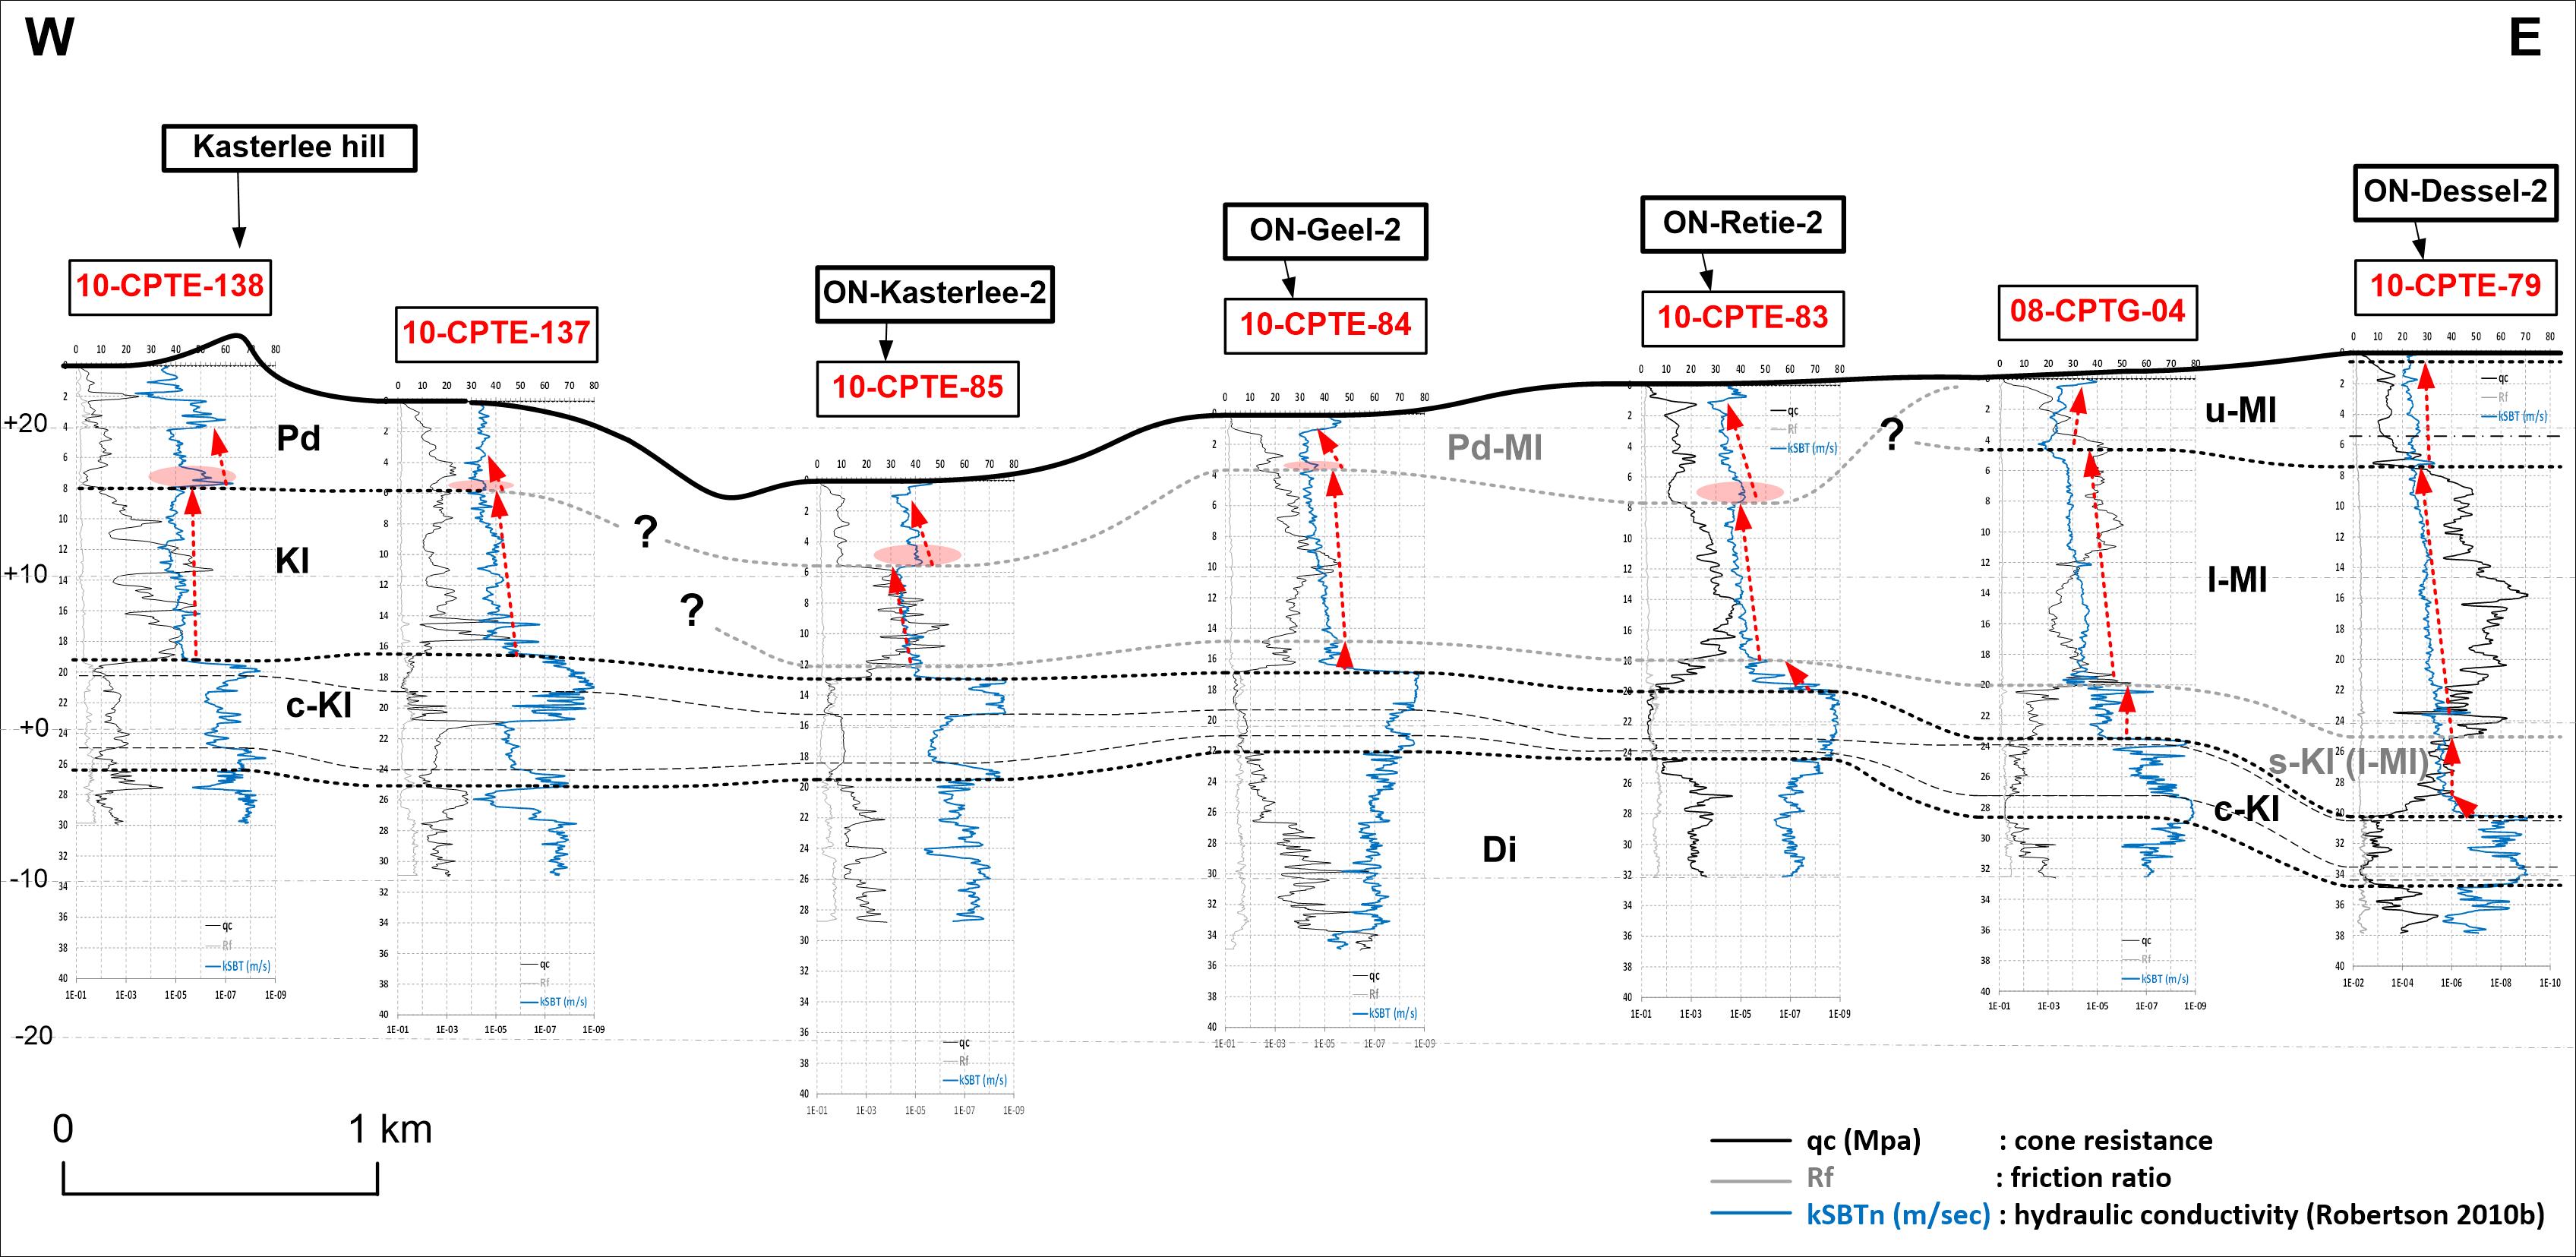
Figure 9. Section of CPTs from the Kasterlee hill over the cored and logged reference boreholes through the ONDRAF/NIRAS study area until the cored and logged reference borehole ON-Dessel-2. Correlations based on CPT derived kSBTn log response after calibration with the boreholes. Unit codes see text and Figure 1.
91In the WE section subdivisions in the c-Kl unit can be followed as is the case in the NS profile. The CPT signal of the c-Kl is beyond doubt present under the type Kasterlee Sand, the CPT Kl unit in the hill. The similarity in CPT response between the l-Ml unit together with its reworked base, the s-Kl unit, and the laterally occurring type Kasterlee Sand or Kl-unit under the hill seems to support a stratigraphic equivalence; the reworked sand unit s-Kl is absent at the base of the Kasterlee Sand in the hill.
92The SW-NE section between Heist-op-den-Berg and the ON-Dessel-2 (Fig.10) shows generally two to three subdivisions in the c-Kl that are supported by outcrops on the Heist-op-den-Berg hill (see Verhaegen et al., 2020, this volume). The subdivisions in c-Kl can be correlated in the CPT log near the Oevel site where a gravel occurs between the Diest and Kasterlee Formations (Verhaegen et al., 2014). Similarly as in the WE section (Fig. 9) but less outspoken, l-Ml with its basal unit s-Kl seems to grade laterally into unit Kl resembling type Kasterlee Sand and the Pd-Ml unit laterally (erosive?) into the u-Ml or Mol Formation.
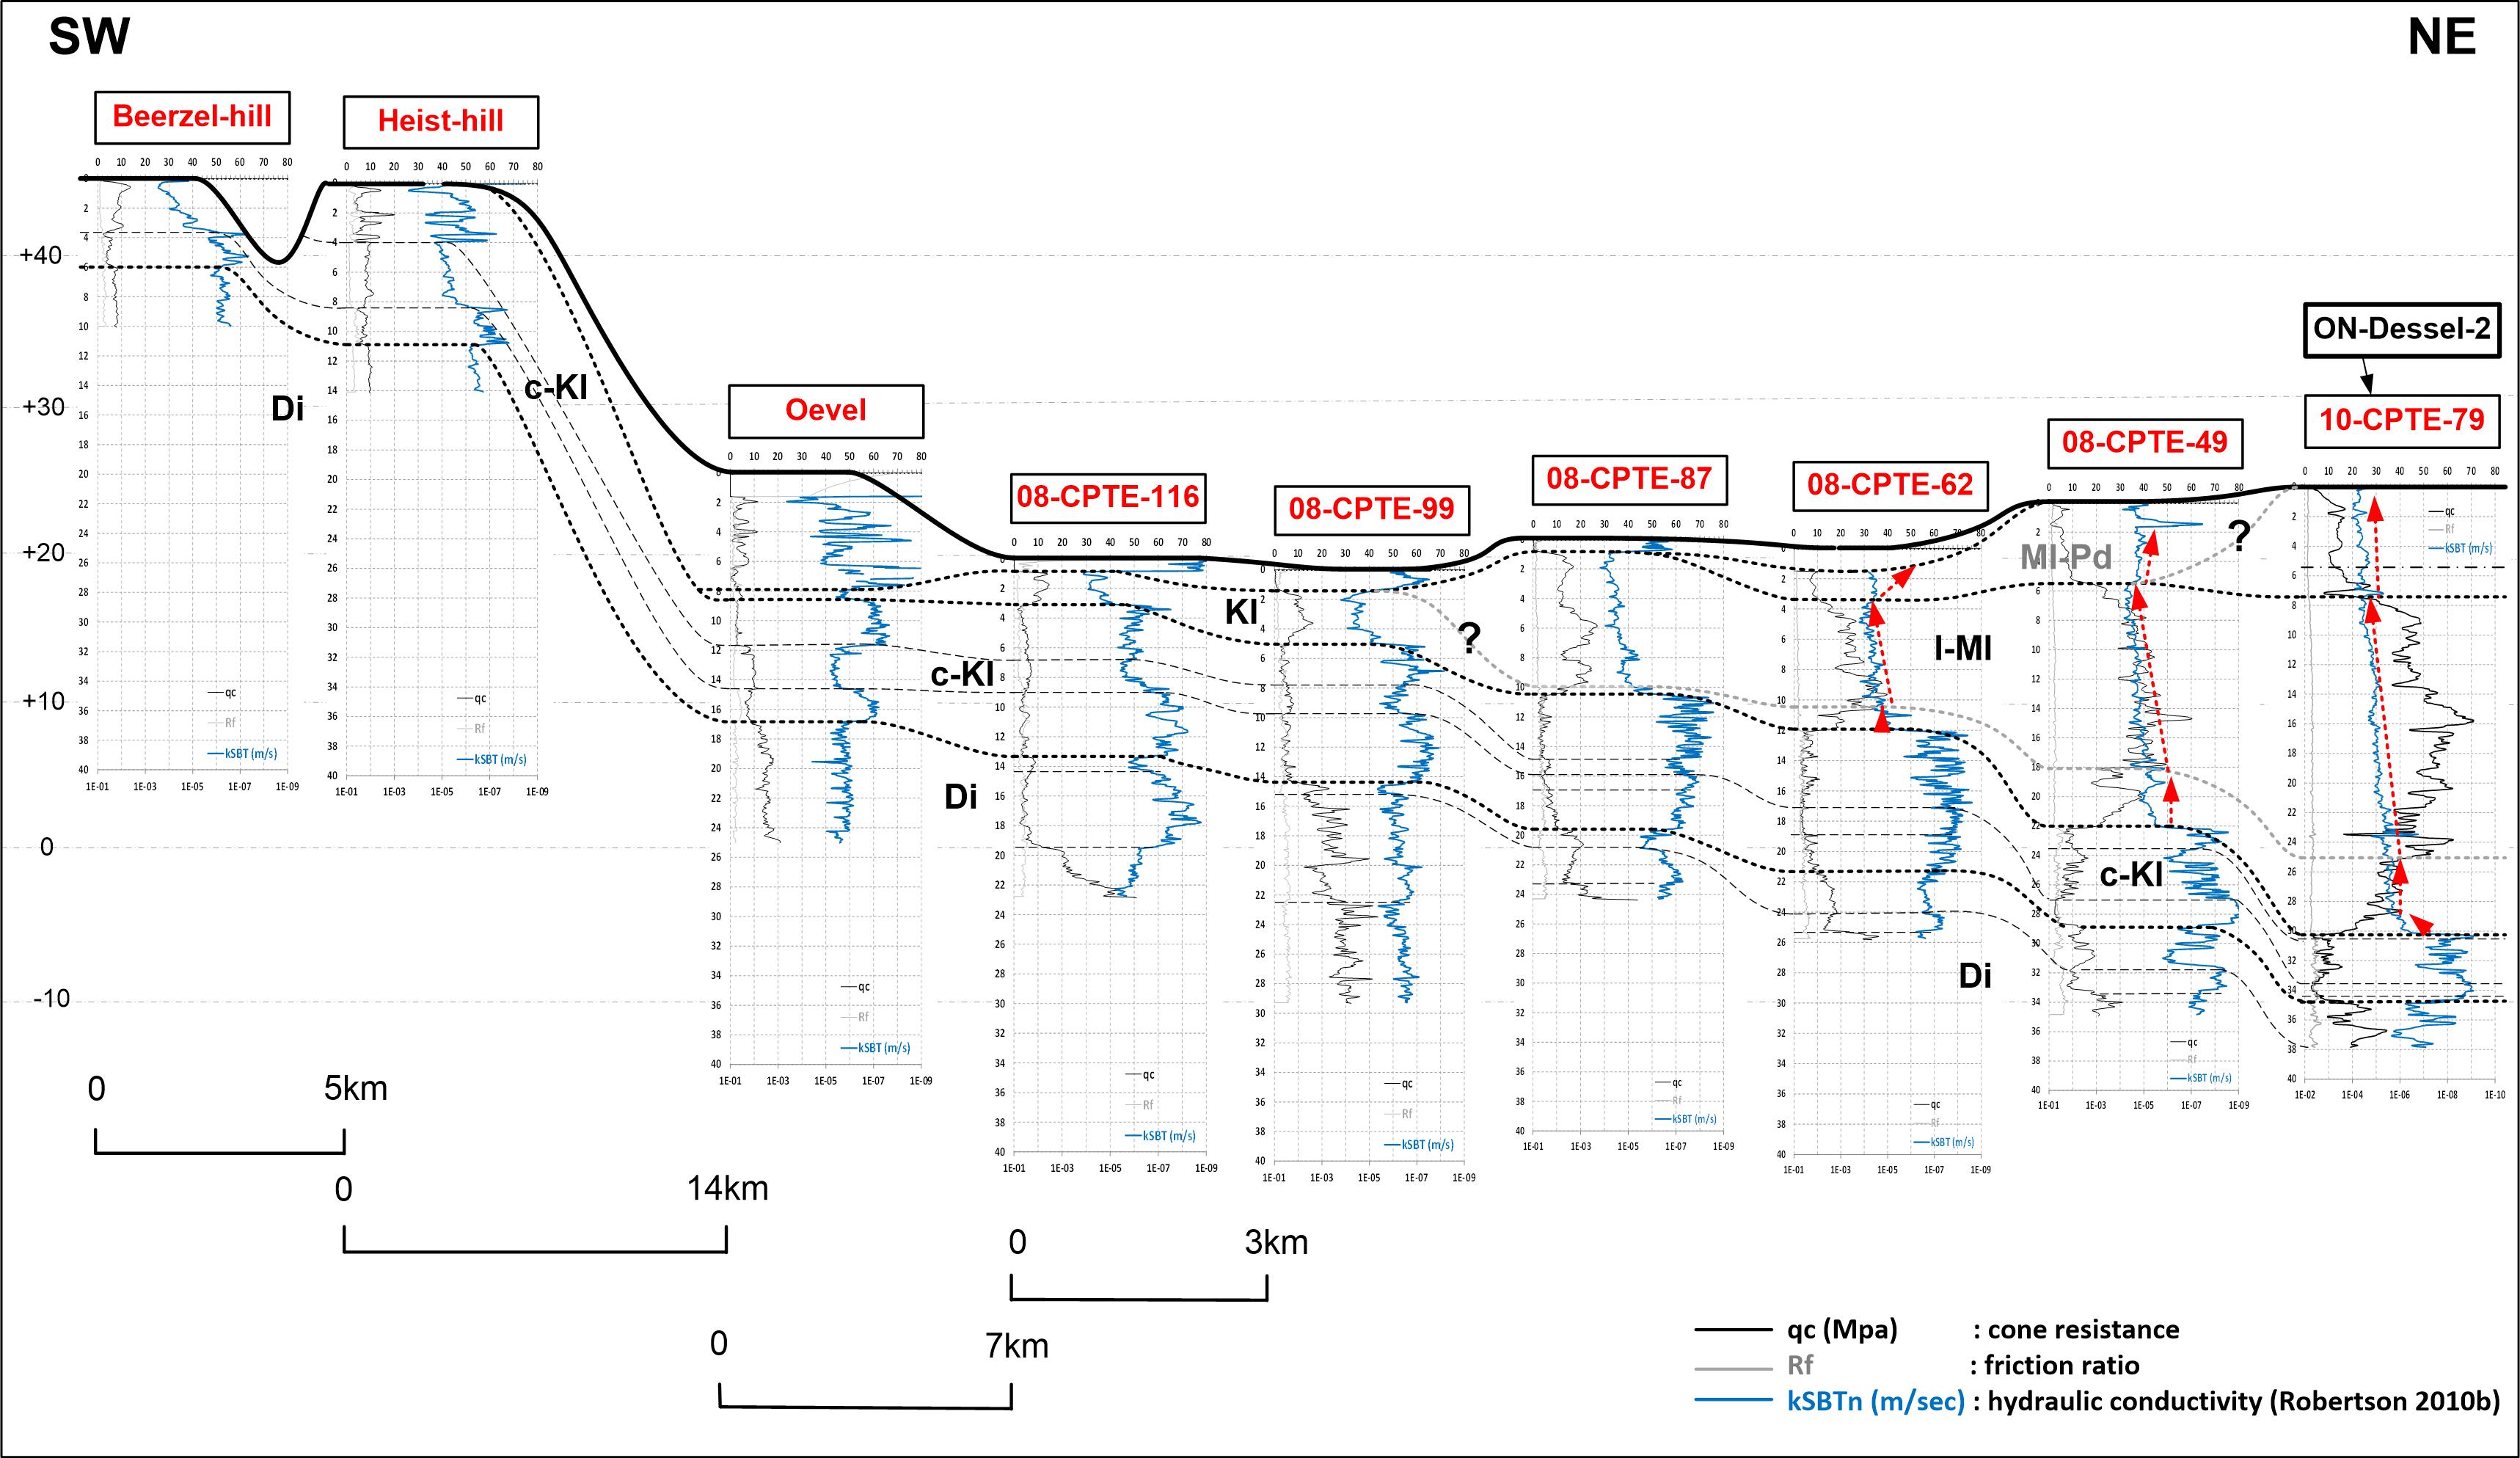
Figure 10. Section of CPTs from the Heist-Op-den-Berg hill over the Oevel outcrop location and through the ONDRAF/NIRAS study area until the cored and logged reference borehole ON-Dessel-2. Correlations based on CPT derived kSBTn log response after calibration with the reference boreholes. Unit codes see text and Figure 1.
93Based on the observed kSBTn log responses in the different sections a stratigraphic relationship is proposed between the seven units above the Miocene Diest Formation (see Figs 1 & 4).
94Different stratigraphic correlation hypotheses between the units defined in the ONDRAF/NIRAS study area and the Kasterlee hill were already presented earlier (Schiltz, 2011). The Kasterlee hill is also the reference location for the younger Pd unit (i.e. the Pliocene Poederlee Formation) on the Kasterlee Formation. The Pd unit is commonly considered older or possibly equivalent to the Mol Formation or u-Ml unit in the east.
95However, in the clayey base with fine gravel of the Pd unit, cm- to dm-scale concretions of white medium to coarse sand surrounded with a crust of limonite have been observed. They have been mentioned by Gulinck (1960) and Gullentops (1963) and were recently re-examined by Houthuys & Matthijs (pers. comm., 2019), who interpreted them as lumps of slightly cemented sand that were transported over a short distance during the incision associated with the base of the Poederlee Formation. This sand shows all characteristics of the sand of the u-Ml unit. A routine mineralogical and granulometric analysis of samples taken in the white sand lumps (Verhaeghe & Vos, Sibelco nv, pers. comm., 2017) confirm the correspondence with u-Ml sand.
96This suggests that the sedimentary cycle of the Pd unit cuts into the u-Ml unit and thus confirms the younger stratigraphic position of the Pd (Pd-Ml) unit supporting the correlations in the discussion of the sections above.
97From Kasterlee to the east, the Pd (or Pd-Ml) unit cuts in the Kl unit at the Kasterlee hill, then into the l-Ml unit and further to the east in the u-Ml unit.
98From the south to the north the Pd (or Pd-Ml) unit cuts into the u-Ml unit with an increasing thickness to the north and with a possible equivalence between the formal Pd-unit and the Pd-Ml unit based on kSBTn log response.
3.2. Some other illustrative cases of the use of CPT derived parameters kSBTn and Ic
3.2.1. Looking for faults in sediments with low lithological contrast
99Figure 11 shows part of a profile of closely spaced CPTs executed to find the exact location of a normal fault (Rauw Fault) at a little distance east of the ONDRAF/NIRAS study area (Fig. 1), discussed in the previous section (Verbeeck et al., 2017).The outcropping and deeper sediments are all sandy showing little internal differentiation as they all belong to the Pliocene upper part of the Mol Formation. A profile (EW) of 34 CPTs with 10 m between each CPT was obtained perpendicular to the fault direction.
100A similar approach as discussed in the previous section was used for the informal stratigraphic interpretation of the CPTs.
101Figure 11 shows both (A) classic diagrams and (B) CPT-derived kSBTn (Ic) logs to illustrate their differing expression of informal units for which a correlation has to be established.
102The kSBTn (and Ic) logs show a much more detailed and consistent log responses that allows to establish a framework of identifiable layers between the CPTs. This revealed a vertical offset of layers between the rightmost two CPTs in the profile, representing the location of the fault.
103The kSBTn (and Ic) logs showing a larger consistency of analogous log responses and trends to establish a succession of layers in each CPT that can easily be recognized in each CPT log, showing their vertical displacement between the last two CPT’s in this section, representing the location of the fault.
104Using the same method, a correlation of the l-Ml and u-Ml units could be extended CPTs at the west side of the fault to the CPTs near the ON-Dessel-2 borehole. The boundary between the two determined units was recognized at a depth between 38 and 39 m.
105Another fault where this method has successfully been used is the Grote Brogel fault (Deckers et al., 2018).
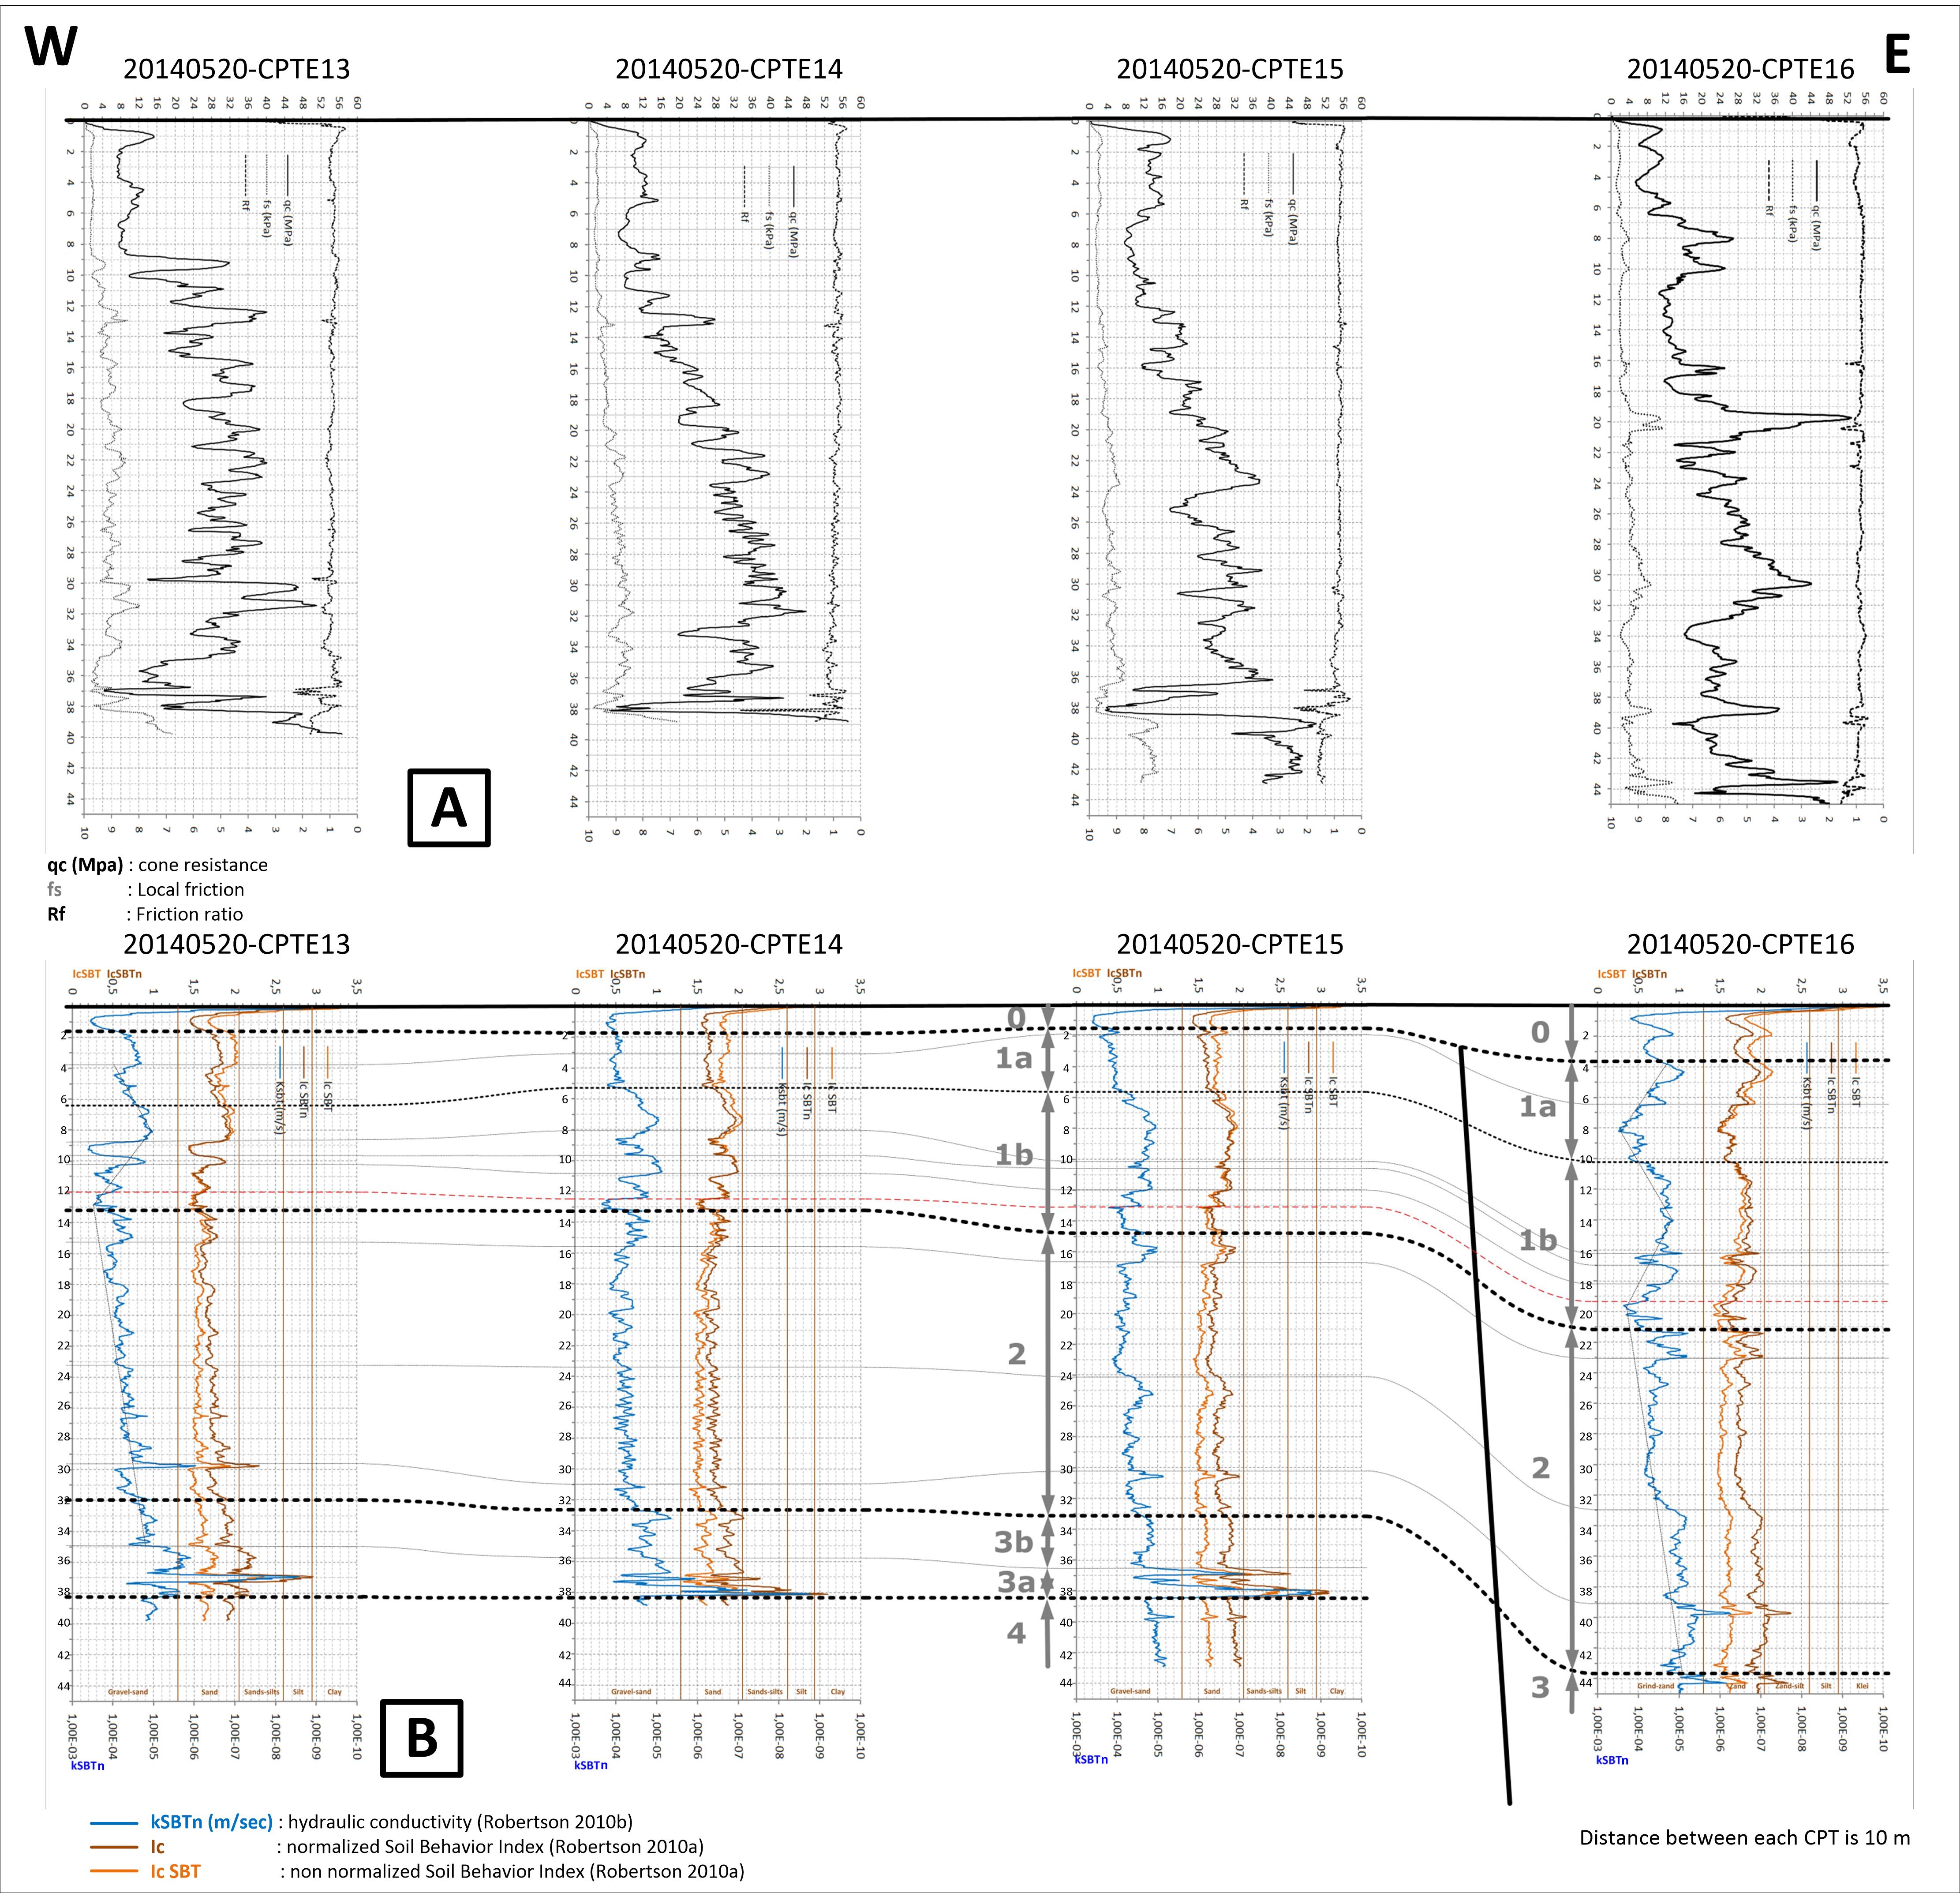
Figure 11. Part of the correlation of 40 CPT’s in a 10 m interval for localization of the normal Rauw fault in sandy Pliocene sediments with little lithological contrast (Verbeeck et al., 2017). A: classic CPT diagram representation, B: CPT derived kSBTn and non-normalized and normalized Ic logs based on the same CPT’s. The latter showing much higher log-response consistancy enabling the exact location of the fault.
3.2.2. Visualizing Quaternary sediments with high lithological contrast in a river valley
106The use of CPT-derived kSBTn and Ic parameters is not limited to lithological interpretations for stratigraphy or sedimentology.
107On a highly polluted formal industrial site in an alluvial sediment setting a lithological map of the subsoil was needed to evaluate the possible clean-up methods.
108Because boreholes and pump tests were not allowed, CPTs with electric cones were chosen because of their fast execution time and small diameter to minimize cross contamination. Some tests made use of a pore water pressure cone for dissipation tests to determine hydraulic conductivity in the different lithologies and for comparison with the k-results obtained with the direct Ic derived method (Robertson, 2010b method; see also section 2.3).
109Figure 12 shows a section throughout the alluvial deposits of a river valley with rubble infills cut into moderately compact Mesozoic chalk.
110The positive experience with the CPT-derived kSBTn (and Ic) parameters, discussed in the previous sections, was the reason why in this exploration the same parameters were determined. They were visualized in a profile and interpolated between the CPTs by a triangulation method.
111Because of the large lithologic contrasts present in the subsoil of the site, a good first view is obtained of the occurrence and extent of the permeable and impermeable layers throughout the section.
112It has also be demonstrated that the Ic proves to be a very appropriate parameter for computational and model based methods to establish stratigraphy and mapping based on large CPT datasets (e.g. Rogiers et al., 2012; Rogiers et al., 2017; Ching et al., 2015).
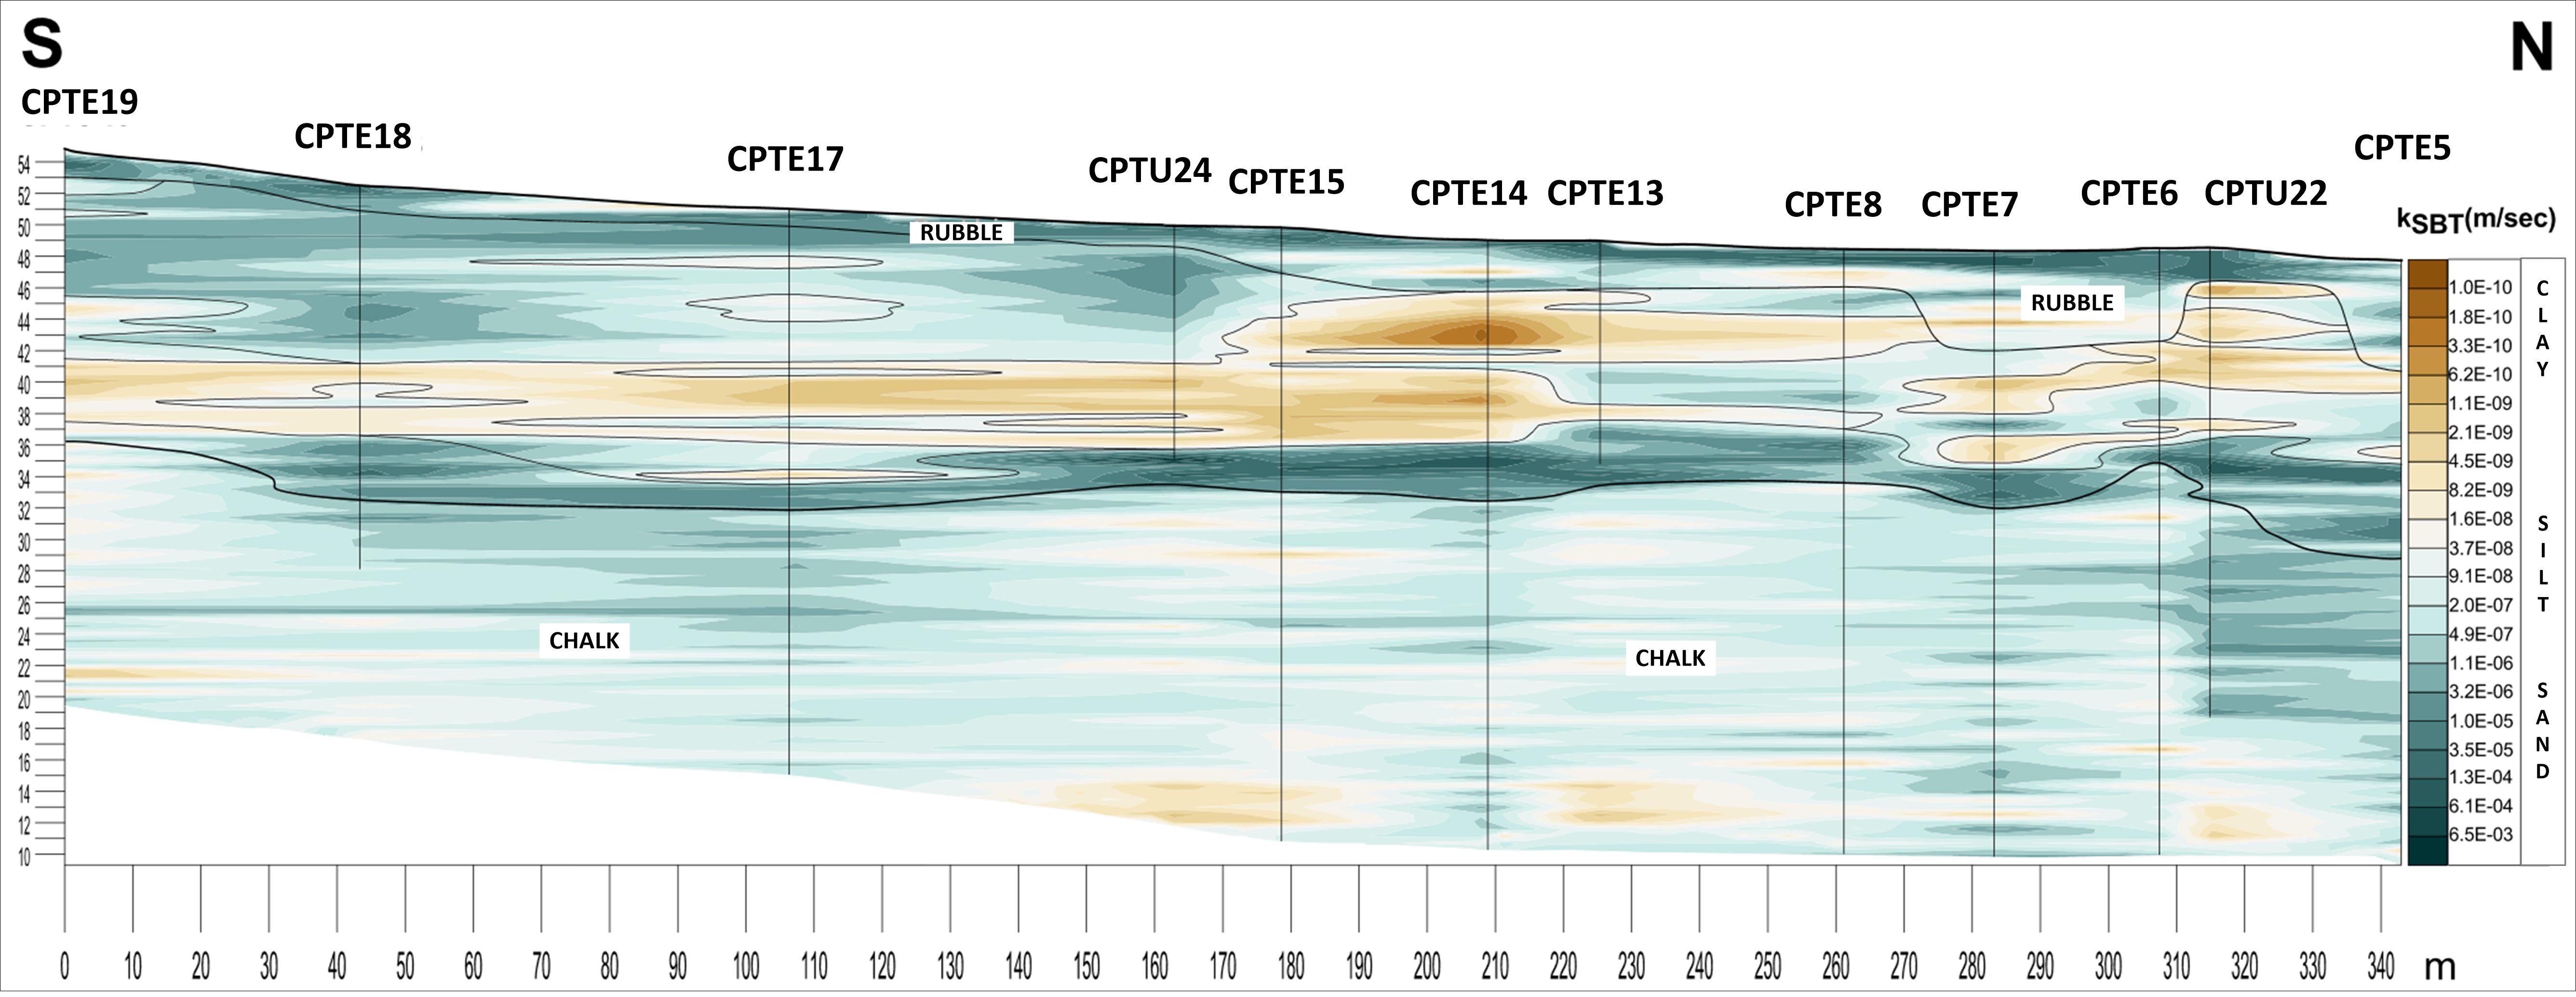
Figure 12. Section of static CPT’s with electric cone through a river valley cut in Cretaceous chalk and filled with Quaternary heterogeneous sediments. The section visualizes variations of kSBTn (Robertson, 2010b) obtained by triangulation between CPT’s, representing clayey (impermeable) and gravelly (permeable) zones.
3.2.3. Heist-op-den-Berg hill
113Verhaegen et al. (2020, this volume) discuss the stratigraphy and paleogeography of the Kasterlee Formation (c-Kl unit; see sections 3.1.3 and 3.1.4) based on a detailed granulometric and mineralogical study from new outcrops at the Heist-op-den-Berg hill (Figs 1 & 10). As explained, because of poor evidence, this unit was not indicated on the geological map revision of the Flemish region (Schiltz et al., 1993). Later on, Fobe (1995) provided evidence for the presence of the Kasterlee Formation from outcrops at Heist-op-den-Berg and the nearby Beerzel hill.
114Following the consistent results for local stratigraphy correlation based on the CPT derived parameters at the ONDRAF/NIRAS study area, where the clayey Kasterlee unit c-Kl was clearly defined, it was decided to execute some CPTs (WD-14-20140701-Sa and WD-14-20140701-Sb) as close to the hill tops as possible and perform a similar Ic and kSBTn log analysis. The results match well Fobe’s (1995) observations and the log responses for this unit in at least the west part of the ONDRAF/NIRAS study area (Schiltz, 2015; Verhaegen et al., 2020, this volume).
115The log trends of Ic and kSBTn are practically identical to the 32 µm boundary in the granulometric log in Verhaegen et al. (2020, this volume). The Ic and kSBTn represent as such a very accurate measure for indicative granulometric characteristics (Robertson, 2016).
116The good analogy between both features is probably the result of the high-resolution sample interval (30 cm for the granulometric analysis and 2 cm for the CPT measurements), well outperforming the 200 cm sample interval of the boreholes of the ONDRAF/NIRAS area (Figs 4, 5 & 6).
117This confirms that both CPT-derived parameters not only can be used for stratigraphic and lithologic correlation but also for interpreting sedimentological trends (upward coarsening, fining…) from log response trends and signature (see Fig. 3).
4. Conclusions and recommendations
118In this paper we examined how the CPTs available to the author from the ONDRAF/NIRAS project could be used in an optimal way for lithostratigraphic analysis.
119A consistent analogy of CPT derived soil behavior index Ic and of hydraulic conductivity kSBTn logs with GR borehole logs is observed from the correlation between six cored and logged boreholes and CPTs in the geological Neogene setting of the ONDRAF/NIRAS study area in NE Belgium.
120As a versatile, fast and cost effective field investigation method, this feature improves the use of CPT’s for soil profiling and stratigraphical analysis considerably, especially in a sandy geological setting with poor macroscopic lithologic contrast.
121The availability of a large number of CPTs and their high-sample resolution makes them highly effective to interpolate between other, more expensive field investigation methods. CPT derived lithology and permeability can be interpolated easily between CPT positions to obtain continuous images of the subsoil.
122The advantage of the larger number of CPTs and smaller distances between them, combined with the observed CPT-derived log features, makes it possible to propose boundaries and stratigraphic correlations offering a better spatial resolution and reliability.
123In analogy with the use of GR logs for stratigraphic interpretation, the trends in the CPT derived logs can be used for sedimentological interpretations such as cycles and coarsening or fining up sequences, trends and log shapes to define and correlate subdivisions between CPTs.
124The comparison of CPT based subdivisions with the complex stratigraphy, based on GR-RES logs, sedimentological data, and visual inspection of cores demonstrates that not only the CPT divisions closely reflect the stratigraphy but that they also can contribute to refine the stratigraphy of the ONDRAF/NIRAS study area.
125A particular stratigraphic contribution from CPT data is the extension of the ‘clayey Kasterlee’ unit into the stratotype area of the Kasterlee Formation and the similarity between the ‘lower Mol’ or ‘Kasterlee sensu Gulinck’ unit and the Kasterlee Sand in the stratotype area. Also the suggested possible extension of the Poederlee Formation beyond the Lichtaart-Kasterlee hill merits further investigation.
126A detailed granulometric study at the Heist-op-den-Berg hill based on closely spaced samples confirms that CPT-derived log features can also be used to define sedimentary sequences.
127This opens opportunities to further improve the local stratigraphic framework of the ONDRAF/NIRAS project site.
5. Acknowledgements
128Special thanks to Professor Noël Vandenberghe for the opportunity to present this paper and for reviewing and discussing previous versions of the paper, improving its quality. Thanks also to Rik Houthuys and Jasper Verhaegen for pre-reviewing the paper and for their advices, and to the reviewers Henk van der Graaf, Gauthier Van Alboom and an anonymous reviewer for their constructive remarks. ONDRAF/NIRAS is thanked for making the dataset of CPTs available for processing.
6. References
129Adriaens, R., 2015. Neogene and Quaternary clay minerals in the southern North Sea. Unpublished Ph.D. Thesis, KULeuven, Leuven, 272 p.
130Adriaens, R. & Vandenberghe, N., 2020. Quantitative clay mineralogy as a tool for lithostratigraphy of Neogene Formations in Belgium: a reconnaissance study. Geologica Belgica, 23/3-4, this volume. https://doi.org/10.20341/gb.2020.018
131Beerten, K., Wemaere, I., Gedeon, M., Labat, S., Rogiers, B., Mallants, D. & Salah, S., 2010. Geological, hydrogeological and hydrological data for the Dessel disposal site. Project near surface disposal of category A waste at Dessel. STB-SIE(HYD) – Version 1. NIROND-TR 2009-05 E. ONDRAF-NIRAS, Brussels, 259 p.
132Ching, J., Wang, J.S., Juang, C.H. & Ku, C.S., 2015. Cone penetration test (CPT)-based stratigraphic profiling using the wavelet transform modulus maxima method. Canadian Geotechnical Journal, 52/12, 1993–2007. https://doi.org/10.1139/cgj-2015-0027
133Deckers, J., Van Noten, K., Schiltz, M., Lecocq, T. & Vanneste, K., 2018. Integrated study on the topographic and shallow subsurface expression of the Grote Brogel Fault at the boundary of the Roer Valley Graben, Belgium. Tectonophysics, 722, 486–506. https://doi.org/10.1016/j.tecto.2017.11.019
134Douglas, B.J. & Olsen, R.S., 1981. Soil classification using electric cone penetrometer. Proceedings of Conference on Cone Penetration Testing and Experience, St. Louis, 26-30 October 1981, 209–227.
135DOV, 2020. Databank Ondergrond Vlaanderen [Flanders Soil and Subsurface Database]. https://www.dov.vlaanderen.be, accessed 20/04/2020.
136Emery, D. & Myers, K.J. (eds), 1996. Sequence Stratigraphy. Blackwell, Oxford, 297 p.
137Gulinck, M., 1960. Un gisement de kiezeloolithes à Lichtaart (Campine). Comparaison avec le cailloutis à kiezeloolithes des collines flamandes. Bulletin de la Société belge de Géologie, de Paléontologie et d’Hydrologie, 69, 191–210.
138Gullentops, F., 1963. Etude de divers faciès quaternaires et tertiaires dans le Nord et l’Est de la Belgique. Excursion O-P, 6e Congrès International de Sédimentologie 1963, Belgique et Pays-Bas, 20 p.
139Gullentops, F. & Vandenberghe, N., 1995. Toelichtingen bij de geologische kaart van België, Vlaams Gewest: kaartblad 17, Mol [1/50 000]. Belgische Geologische Dienst en Ministerie van de Vlaamse Gemeenschap, Afdeling Natuurlijke Rijkdommen en Energie, Brussel, 65 p.
140Krassay, A.A., 1998. Outcrop and drill core gamma-ray logging integrated with sequence stratigraphy: examples from Proterozoic sedimentary successions of northern Australia. AGSO Journal of Australian Geology & Geophysics, 17, 285–299.
141Louwye, S., De Schepper, S., Laga, P. & Vandenberghe, N., 2007. The Upper Miocene of the southern North Sea Basin (northern Belgium): a palaeoenvironmental and stratigraphical reconstruction using dinoflagellate cysts. Geological Magazine, 144, 33–52. https://doi.org/10.1017/S0016756806002627
142Lunne, T., Robertson, P.K. & Powell, J.J.M., 1997. Cone penetration testing in geotechnical practice. Blackie Academic, EF Spon/Routledge Publishing, New York, 312 p.
143NEN 5140, 1996. Nederlandse norm - Geotechniek. Bepaling van de conusweerstand en de plaatselijke wrijvingsweerstand van grond. Elektrische sondeermethode. Nederlands Normalisatie-instituut, Delft, 6 p.
144Rider, M.H., 1999. The Geological Interpretation of Well Logs. Gardners Books, Eastbourne, 288 p.
145Robertson, P.K., 1990. Soil classification using the cone penetration test. Canadian Geotechnical Journal, 27/1, 151–158. https://doi.org/10.1139/t90-014
146Robertson, P.K., 2009. Interpretation of cone penetration tests – a unified approach. Canadian Geotechnical Journal, 46/11, 1337–1355. https://doi.org/10.1139/T09-065
147Robertson, P.K., 2010a. Soil behaviour type from the CPT: an update. 2nd International Symposium on Cone Penetration Testing, Huntington Beach, CA, USA. Vol. 2, 575–583.
148Robertson, P.K., 2010b. Estimating in-situ soil permeability from CPT and CPTu. 2nd International Symposium on Cone Penetration Testing, Huntington Beach, CA, USA. Vol. 2, 535–542.
149Robertson, P.K., 2016. Cone penetration test (CPT)-based soil behaviour type (SBT) classification system – an update. Canadian Geotechnical Journal, 53/12, 1910–1927. https://doi.org/10.1139/cgj-2016-0044
150Robertson, P.K., Campanella, R.G., Gillespie, D. & Greig, J., 1986. Use of piezometer cone data. Proceedings of American Society of Civil Engineers, ASCE, IN-SITU ’86 ASCE Specialty Conference on Use of In-situ Testing in Geotechnical Engineering, Blacksburg, 23-25 June 1986, 1263–1280.
151Rogiers, B., Schiltz, M., Beerten, K., Gedeon, M., Mallants, D., Batelaan, O., Dessargeus, A. & Huysmans, M., 2010. Groundwater model parameter identification using a combination of cone-penetration tests and borehole data. IAHR International Groundwater Symposium Proceedings, Vol. 1. Valencia, Spain, 19 p.
152Rogiers, B., Mallants, D., Batelaan, O., Gedeon, M., Huysmans, M. & Dassargues, A., 2012. The usefulness of CPTs for deterministic spatially heterogeneous, large-scale aquitard parameterisation. In Oswald, S.E., Kolditz, O., Attinger, S., (eds), Models - Repositories of Knowledge. Proceedings ModelCare 2011, Leipzig, Germany, 18-22 September 2011. IAHS Publication, 355, 41–47.
153Rogiers, B., Mallants, D., Batelaan, O., Gedeon, M., Huysmans, M. & Dassargues, A., 2017. Model-based classification of CPT data and automated lithostratigraphic mapping for high-resolution characterization of a heterogeneous sedimentary aquifer. PLoS ONE 12/5, e0176656. https://doi.org/10.1371/journal.pone.017665
154Schiltz, M., 2008. Lithological and stratigraphical interpretation by means of cone penetration tests (CPT’s) in the Dessel-Kasterlee-Geel-Mol area. Unpublished report. Bvba SAMSUFFIT Geoservices, NIRAS Fieldsurvey cAt 2008, 46 p.
155Schiltz, M., 2011. Kasterlee. Problematiek relatie Formaties van Mol-Poederlee-Kasterlee. Verslag n° 20111123. Unpublished report. Samsuffit Geoservices, 15 p.
156Schiltz, M., 2015. CPT-proeven en hun lithostratigrafische interpretatie; G3D Workshop G3Dv3 Neogeen -30-11-2015 VITO/ALBON.
157Schiltz, M., Vandenberghe, N. & Gullentops, F., 1993. Toelichtingen bij de geologische kaart van België, Vlaams Gewest: kaartblad 16, Lier [1/50 000]. Belgische Geologische Dienst en Ministerie van de Vlaamse Gemeenschap, Bestuur Natuurlijke Rijkdommen en Energie, Brussel, 38 p.
158Searle, I.W., 1979. The interpretation of Begemann friction jacket cone results to give soil types and design parameters. Proceedings of the 7th European Conference on Soil Mechanics and Foundation Engineering, ECSMFE, Brighton, Vol. 2, 265–270.
159SEPM Strata, 2015. Well Log Interpretations, Character of Log Response. http://sepmstrata.org/page.aspx?&pageid=168&3, accessed 19/03/2020.
160Vandenberghe, N., Wouters, L., Schiltz, M., Beerten, K., Berwouts, I., Vos, K., Houthuys, R., Deckers, J., Louwye, S., Laga, P., Verhaegen, J., Adriaens, R. & Dusar, M., 2020. The Kasterlee Formation and its relation with the Diest and Mol Formations in the Belgian Campine. Geologica Belgica, 23, 3-4, this volume. https://doi.org/10.20341/gb.2020.014
161Verbeeck, K., Wouters, L., Vanneste, K., Camelbeeck, T., Vandenberghe, D., Beerten, K., Rogiers, B., Schiltz, M., Burow, C., Mees, F., De Grave, J. & Vandenberghe, N., 2017. Episodic activity of a dormant fault in tectonically stable Europe: The Rauw fault (NE Belgium). Tectonophysics, 699, 146–163. https://doi.org/10.1016/j.tecto.2017.01.023
162Verhaegen, J., Adriaens, R., Louwye, S., Vandenberghe, N. & Vos, K., 2014. Sediment‐petrological study supporting the presence of the Kasterlee Formation in the Heist‐op‐den‐Berg and Beerzel hills, southern Antwerp Campine, Belgium. Geologica Belgica, 17, 323–332.
163Verhaegen, J., Frederickx, L. & Schiltz, M., 2020. New insights into the stratigraphy and paleogeography of the Messinian Kasterlee Formation from the analysis of a temporary outcrop. Geologica Belgica, 23, 3-4, this volume. https://doi.org/10.20341/gb.2020.015
164VPO (Vlaams Planbureau voor Omgeving), 2019. Stratigrafische tabel voor het Neogeen en Paleogeen van Vlaanderen. Databank Ondergrond Vlaanderen, https://dov.vlaanderen.be/sites/default/files/pfiles_files/StratigrafischeTabel_NeogeenPaleogeen_DOV2019_2.pdf, accessed 20/04/2020.
165Wouters, L. & Schiltz, M., 2013. Overview of the field investigations in and around the nuclear site of Mol-Dessel. Project near surface disposal of category A waste at Dessel. Version 1 - NIROND-TR 2011–42 E, 109 p.
166Manuscript received 24.03.2020, accepted in revised form 09.06.2020, available online 08.09.2020.
