


- Accueil
- Volume 24 (2021)
- number 3-4
- Trace-element imaging at macroscopic scale in a Belgian sphalerite-galena ore using Laser-Induced Breakdown Spectroscopy (LIBS)


Visualisation(s): 5291 (67 ULiège)
Téléchargement(s): 2291 (30 ULiège)

Trace-element imaging at macroscopic scale in a Belgian sphalerite-galena ore using Laser-Induced Breakdown Spectroscopy (LIBS)

Abstract
Laser-Induced Breakdown Spectroscopy (LIBS) is a fast in-situ analytical technique based on spectroscopic analysis of atomic emission in laser-induced plasmas. Geochemical mapping at macroscopic scale using LIBS was applied to a decimetric Zn-Pb ore sample from east Belgium, which consists of alternating sphalerite and galena bands. A range of elements was detected with no or minimal spectral correction, including elements of interest for beneficiation such as Ge, Ag and Ga (although the detection of gallium could not be confirmed), and remediation, especially As and Tl. The comparison between LIBS and Energy Dispersive Spectroscopy (EDS) analyses showed that LIBS intensities reliably relate to elemental concentration although differences in spot size and detection limits exist between both techniques. The elemental images of minor and trace elements (Fe, Cu, Ag, Cd, Sb, As, Tl, Ge, Ni and Ba) obtained with LIBS revealed with great detail the compositional heterogeneity of the ore, including growth zones that were not visible on the specimen. In addition, each mineral generation has a distinct trace-element composition, reflecting a geochemical sequence whose potential metallogenic significance at the district scale should be addressed in further work. Although qualitative and preliminary, the obtained LIBS dataset already produced a wealth of information that allowed to initiate discussion on some genetical and crystallochemical aspects. Above all, LIBS appears as a powerful tool for screening geochemically large samples for the selection of zones of particular interest for further analysis.
Table des matières
1. Introduction
1Currently, there is a regain of interest for Zn-Pb ores because they host considerable resources in rare metals such as Ge and Ga that are considered as Critical Raw Materials for Europe (EC, 2017). On the other hand, they represent a potential source of heavy metal contamination (Cd, As, Pb, Zn) for the environment during their exploitation and storage of waste. For both beneficiation and remediation applications, it is essential to survey and locate these elements at various scales. While there is already a range of available bulk and in-situ geochemical techniques for elemental mapping at the field and microscopic scales, few technologies are capable of fast geochemical exploration at macroscopic (hand sample) scale for screening purposes.
2Laser-Induced Breakdown Spectroscopy (LIBS) mapping is a powerful technique for visualizing the textural and mineralogical heterogeneity of samples simultaneously with minor and trace-element distribution (e.g., Fabre, 2020 and references therein). The screening capability of LIBS is enhanced by high-speed measurement, large scanning area and relatively low operation cost. Quantitative chemical and mineralogical analysis using LIBS on ores is possible (Pořízka et al., 2014; Diaz et al., 2017; El Haddad et al., 2019; Rifai et al., 2020), while not widely available yet but the advantages above compensate for this current limitation. Qualitative or semi-quantitative LIBS analysis is already very informative and allows more effective preparation for further quantitative or more sensitive analysis, if needed.
3LIBS analysis consists in focusing high-energy laser pulses on the surface of a sample and measuring the spectrum of the light emitted by the short-lived plasma that results from laser-matter interaction (photo-ablation) (Fig. 1). The plasma light carries the different emission wavelengths of the excited chemical species from the target (ions, atoms and molecules). Time-resolved acquisition of these emission lines is used for fast chemical analysis of a wide range of materials including solids, liquids and gases (e.g., Cremers & Radziemski, 2006).
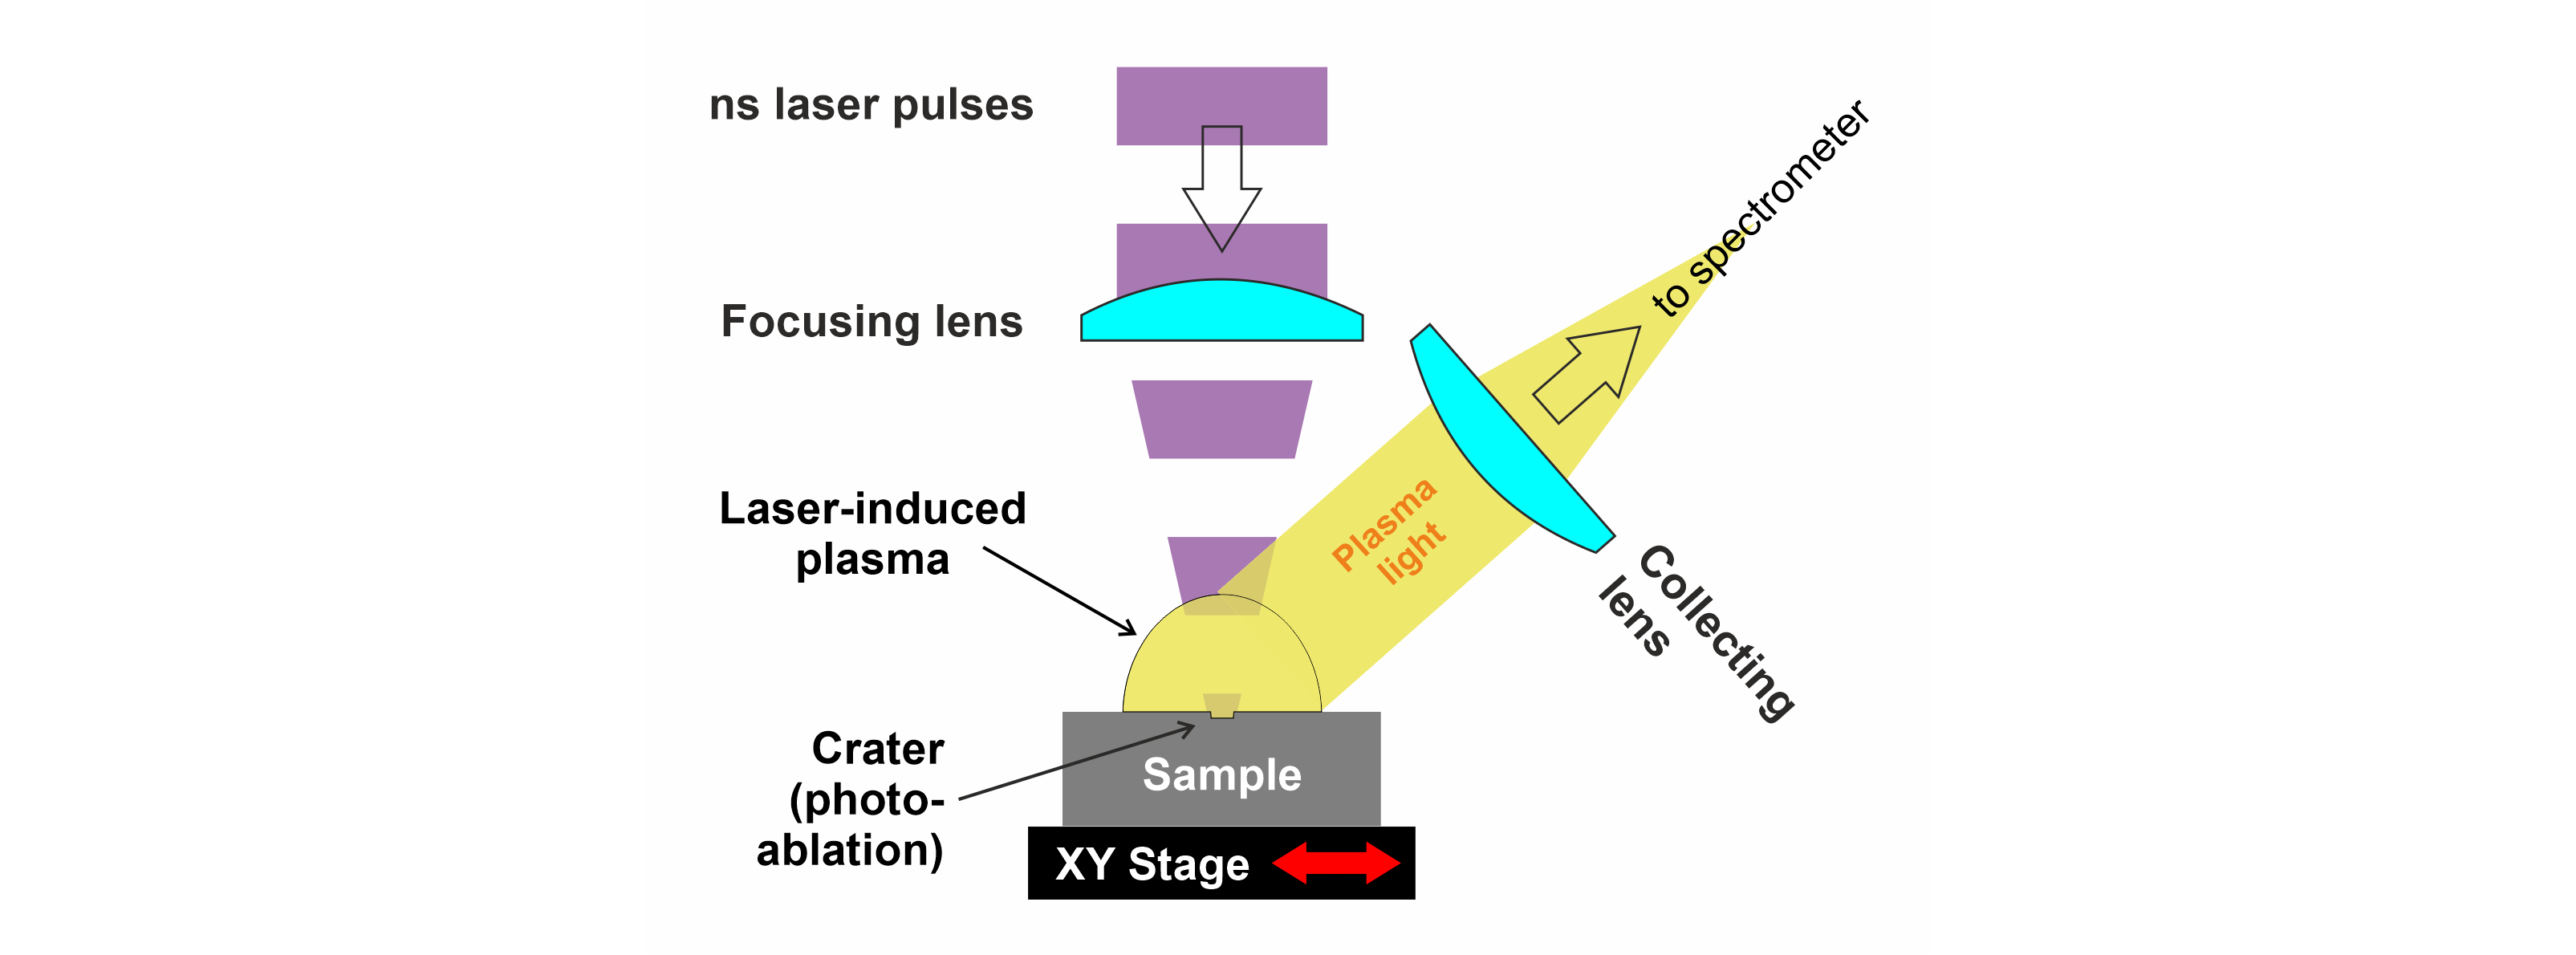
Figure 1. Principle of LIBS measurement (see text for details).
4Scanning geochemically large areas by LIBS (e.g., Novotny et al., 2008) or in combination with new micro-XRF techniques (Nikonow et al., 2019) is a substantial advantage that is already attractive for geoscientists. It allows the observation of geochemical features at the macroscopic scale, bridging the gap between field and microscopic scales. Moreover, it helps in selecting more effectively particular zones of interest for further investigation. Note that depending on its design, a LIBS system can also operate at the microscopic scale, with a spot size down to 3 µm (e.g., Menut et al., 2003; Jolivet et al., 2019). LIBS thus appears as a very flexible technique and already finds a wide range of applications in earth sciences and mineral exploration (e.g., Senesi, 2014; Harmon et al., 2019), especially for geochemical mapping (e.g., Fabre et al., 2018; Rifai et al., 2018), including germanium in sphalerite (Cugerone et al., 2020; 2021).
5Here we demonstrate that qualitative geochemical mapping using LIBS is a powerful method for visualizing the distribution of chemical elements at a macroscopic scale in a Zn-Pb ore sample from east Belgium. Owing to its exceptionally well-displayed banded texture and the inferred changes of chemistry expected from one layer to the other, this sample offers a unique opportunity to investigate textural and mineralogical heterogeneities using LIBS. We establish the reliability of the LIBS intensity as an indicator of elemental concentration based on a detailed spectroscopic study and a comparison with Energy-dispersive X-ray Spectroscopy (EDS) analysis, at least for the elements that were effectively detected by this technique. EDS was chosen because of its wide availability and growing use in mining research and industry. The results obtained so far are discussed and bring insights into geochemical signatures, ore-forming processes and substitution mechanisms.
2. Materials and methods
2.1. The sample
6The sample analyzed for this study is a Zn-Pb ore sample of more than 10 cm long displaying at places a typical schalenblende texture. It originates from an old MVT (Mississippi-Valley Type) mining district situated in the East of Belgium (Dejonghe, 1998). The sample was taken from the University of Mons (UMONS) collection, but its exact location within the metalliferous district is unknown. A comparison with samples from the large collection of Royal Belgian Institute of Natural Sciences suggests that this sample is very close to typical Pb-Zn ore from the Schmalgraf mine, the deepest (290 m) metal mine of the district (Dejonghe & Ladeuze, 1994).
7The ore sample shows conspicuous zoning with alternating galena (PbS) and sphalerite (Zn,Fe)S bands, which is interpreted as the result of the growth process by deposition of successive generations of sulfide minerals (Fig. 2). The deposition sequence starts with massive galena onto which is attached an elongated cluster of galena crystals forming the core of a pseudostalactitic structure. This galena is considered the earliest mineral generation in the sample (gal_1). It is overgrown by a succession of sulfides:
-
a first generation of sphalerite (sphal_1), dark in color and with faint colloform texture and banding;
-
a second generation of galena (gal_2);
-
a second generation of sphalerite (sphal_2), light in color and with conspicuous colloform texture and more contrasted banding;
-
a third generation of galena (gal_3).
8The sample was minimally prepared by grinding with a fine SiC abrasive suspension to achieve a flat surface (±10 µm) with uniform rugosity and cleaning with deionized water. The planarity of the surface is crucial as any change in lens-to-sample distance during acquisition will greatly affect laser irradiance and plasma emission.
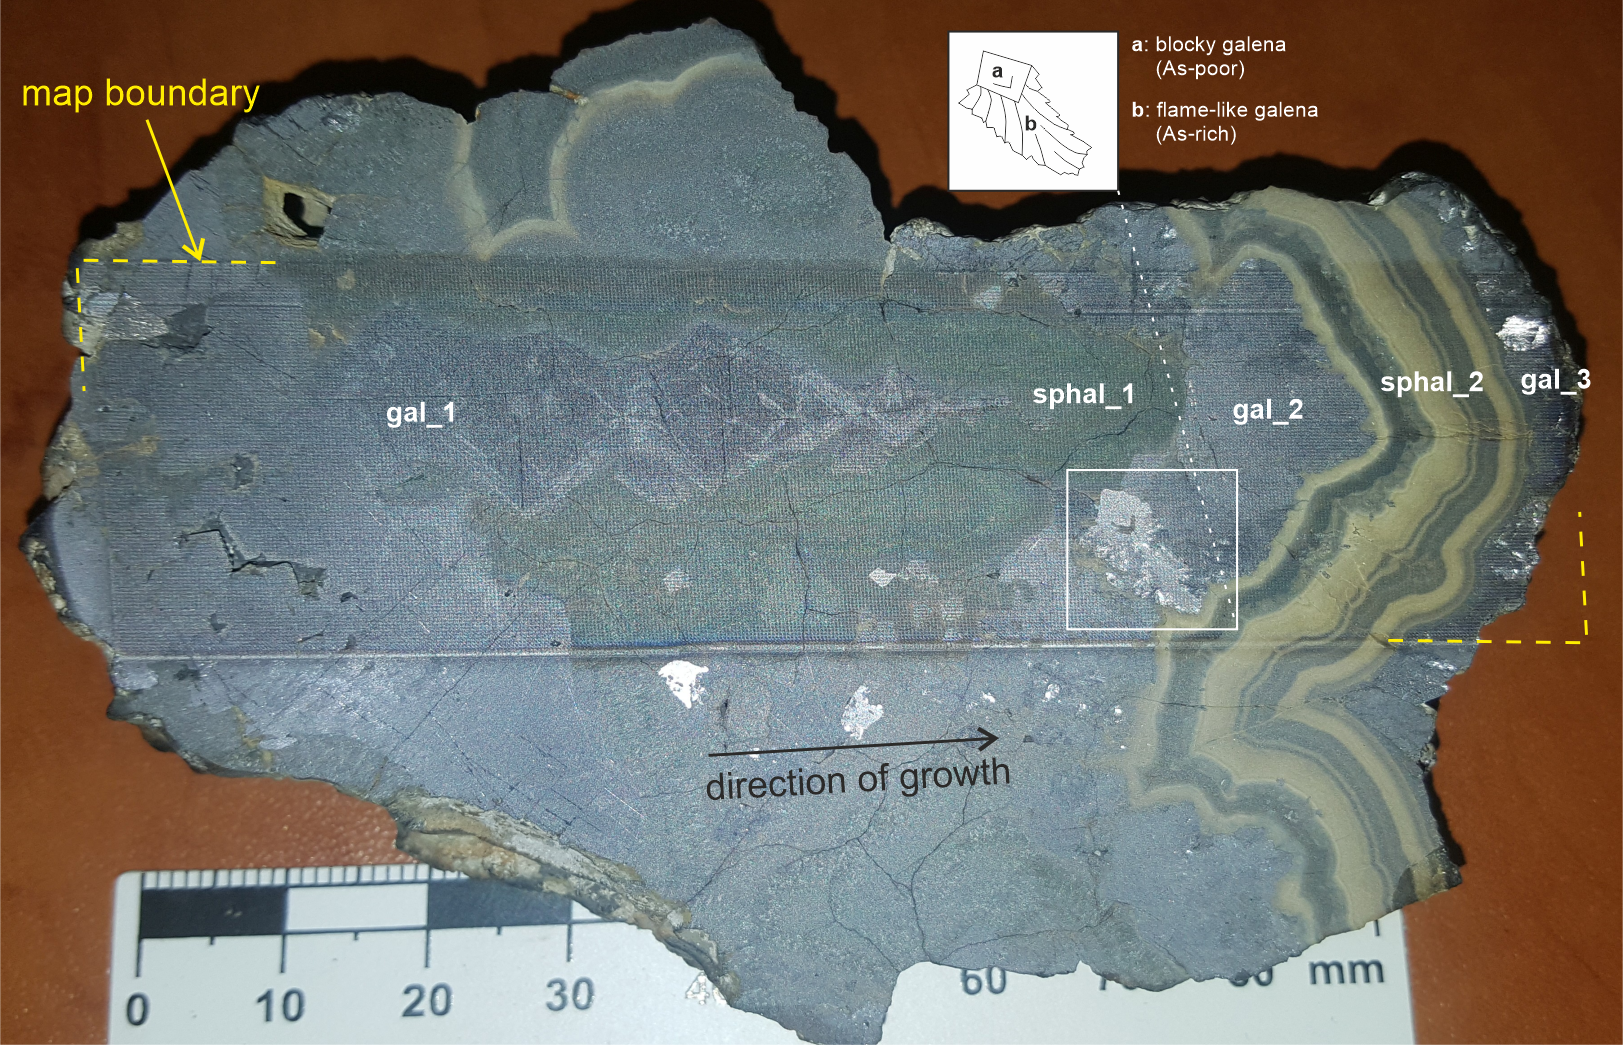
Figure 2. Macrophotograph of the 100 mm-wide banded-colloform Zn-Pb ore sample that was analyzed by LIBS in this study (coll. UMONS; provenance: east Belgium, probably from Schmalgraf Mine). The sample exhibits three galena generations (gal_1 to gal_3) and two generations of sphalerite (sphal_1 and sphal_2, dark and light-colored, respectively) that deposited from left to right over time. The photograph was taken after LIBS analysis so the dotted pattern that is visible results from the impact of the laser shots. The inset shows a sketch of the distinctive crystal fabric in gal_2, which is blocky with “flame-like” overgrowths. This texture is visible on a particular crystal assemblage because of its specular reflection when the photograph was taken but is ubiquitous in gal_2 band.
2.2. LIBS experiment
9For the LIBS experiment, a flashlamp-pumped Nd:YAG Q-switched laser (Lumibird-Quantel QSmart 450) with 5 ns pulse duration was used at 266 nm wavelength (quadrupled-frequency). Laser energy was set to 15 mJ and the spot size achieved by focusing with an f=150 mm planoconvex lens was ~200 µm on anodized aluminum, resulting in a fluence of 48 J.cm-2 and an irradiance (power density) of 10 GW.cm-2. With these settings, variations in lens-to-sample distance of up to 1.5 mm have no dramatic effect on the recorded LIBS spectra. Anyhow, the horizontality of the sample surface, which can be quickly adjusted with a laser pointer in our system, has a precision much better than 1 mm. Laser energy was monitored by sampling the beam with a silica window at 45° and measuring the energy with a pyroelectric sensor (Thorlabs ES120C). The plasma light was collected with an f=10 mm planoconvex lens, which injected the light into a multifurcated optical fiber connected to the spectrometer. The LIBS spectra were recorded from 191 to 475 nm by a high-resolution multichannel spectrometer (Avantes ULS2048) with 11379 wavelength datapoints, 0.05 to 0.10 nm resolution (Fig. 3). Each channel of the spectrometer is equipped with a Couple Charge Device (CCD) detector set at 1 µs delay between the laser pulse and the start of integration to avoid the early continuum emission of the plasma. The integration time was set at 1 ms. These delay and integration time values correspond to the minimum that can be set with typical CCD detectors. Therefore, contrarily to much faster detectors that are popular in LIBS experiments such as Intensified CCD (ICCD) or new CMOS, it was not possible to gate the measurement and optimize the signal over noise ratio. Acquisition and pre-processing were performed with Spectragryph spectroscopy software (Menges, 2020), which was also used for spectra exploration and evaluation.
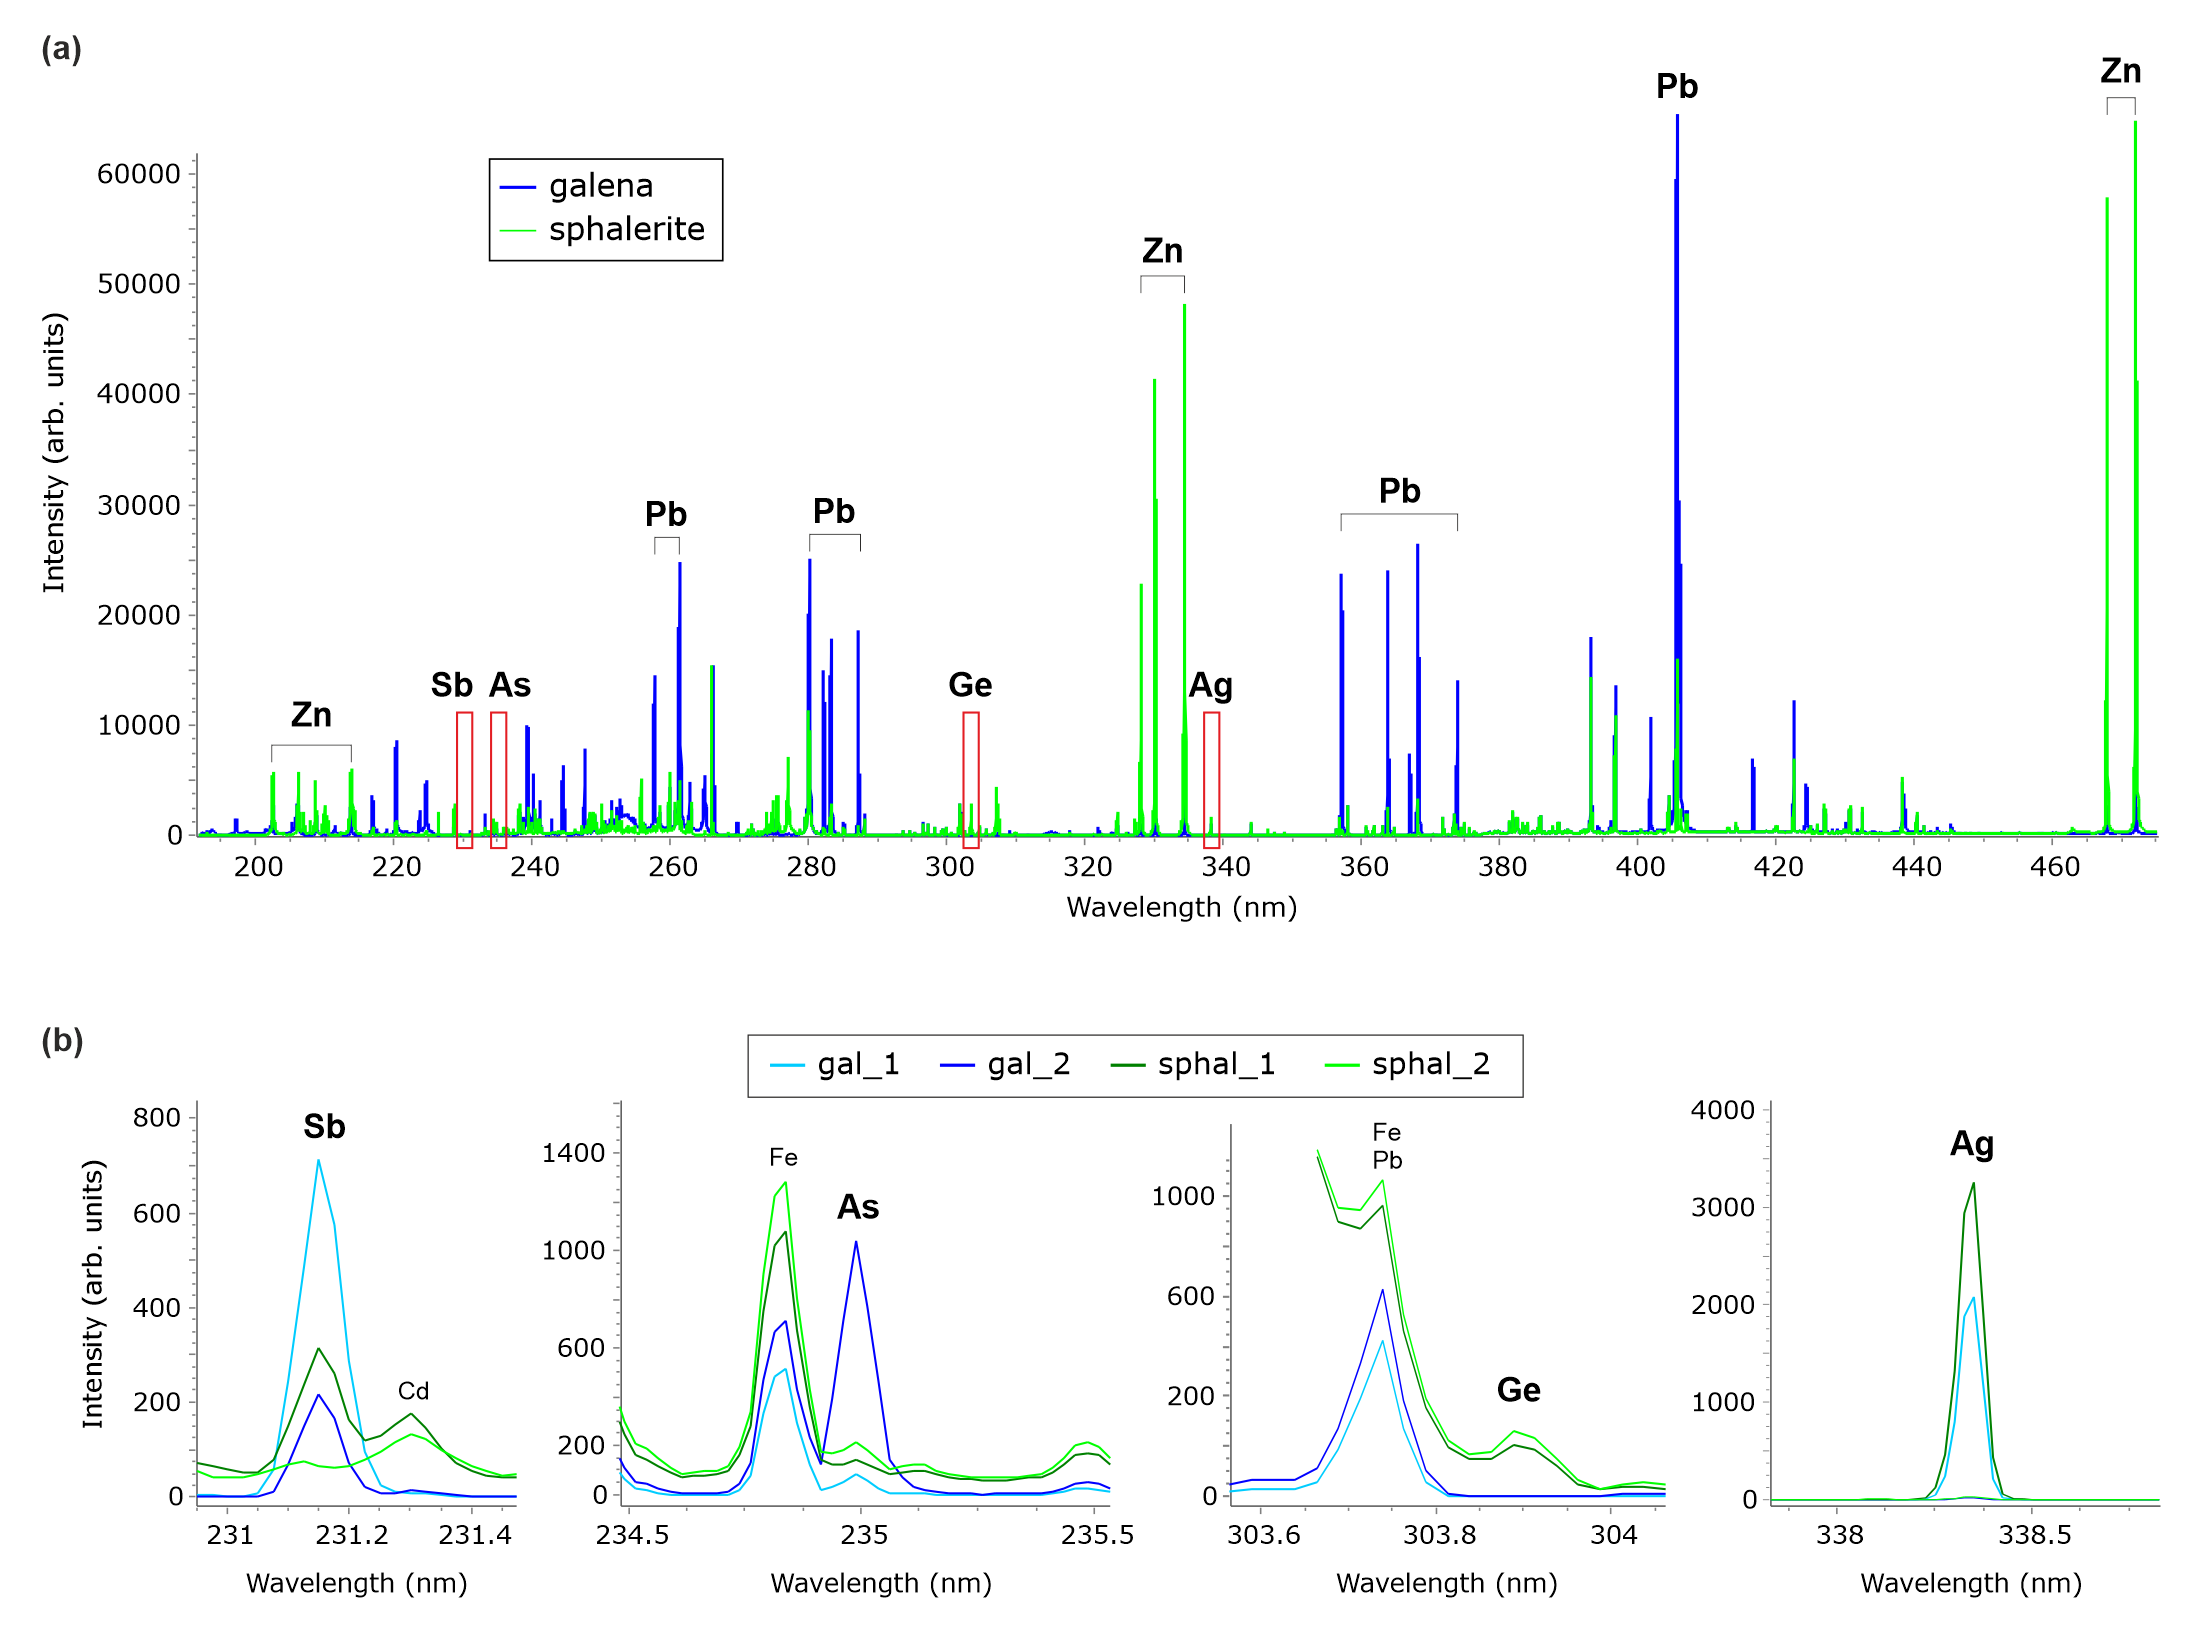
Figure 3. Experimental LIBS spectra of galena and sphalerite in the studied Zn-Pb ore sample. (a) Average spectra of galena and sphalerite with assignment of the most intense emission lines. (b) Average spectra of the main generations of galena and sphalerite centered on the emission line of Sb, As, Ge and Ag.
10LIBS mapping was achieved by moving the sample in synchronization with the laser (max 20 Hz repetition rate with the laser used) and simultaneously recording the LIBS spectrum at each point of the map (single-shot measurement). The map parameters were: 400 x 100 pixels and 250 µm pixel size, corresponding to a scanned area of 100 x 25 mm. The acquisition time for scanning this area is about 60 or 30 minutes at 10 or 20 Hz laser repetition rate, respectively. A hyperspectral datacube was then built using Jython/Java scripting under Fiji/ImageJ image analysis software environment (e.g., Rueden et al., 2017).
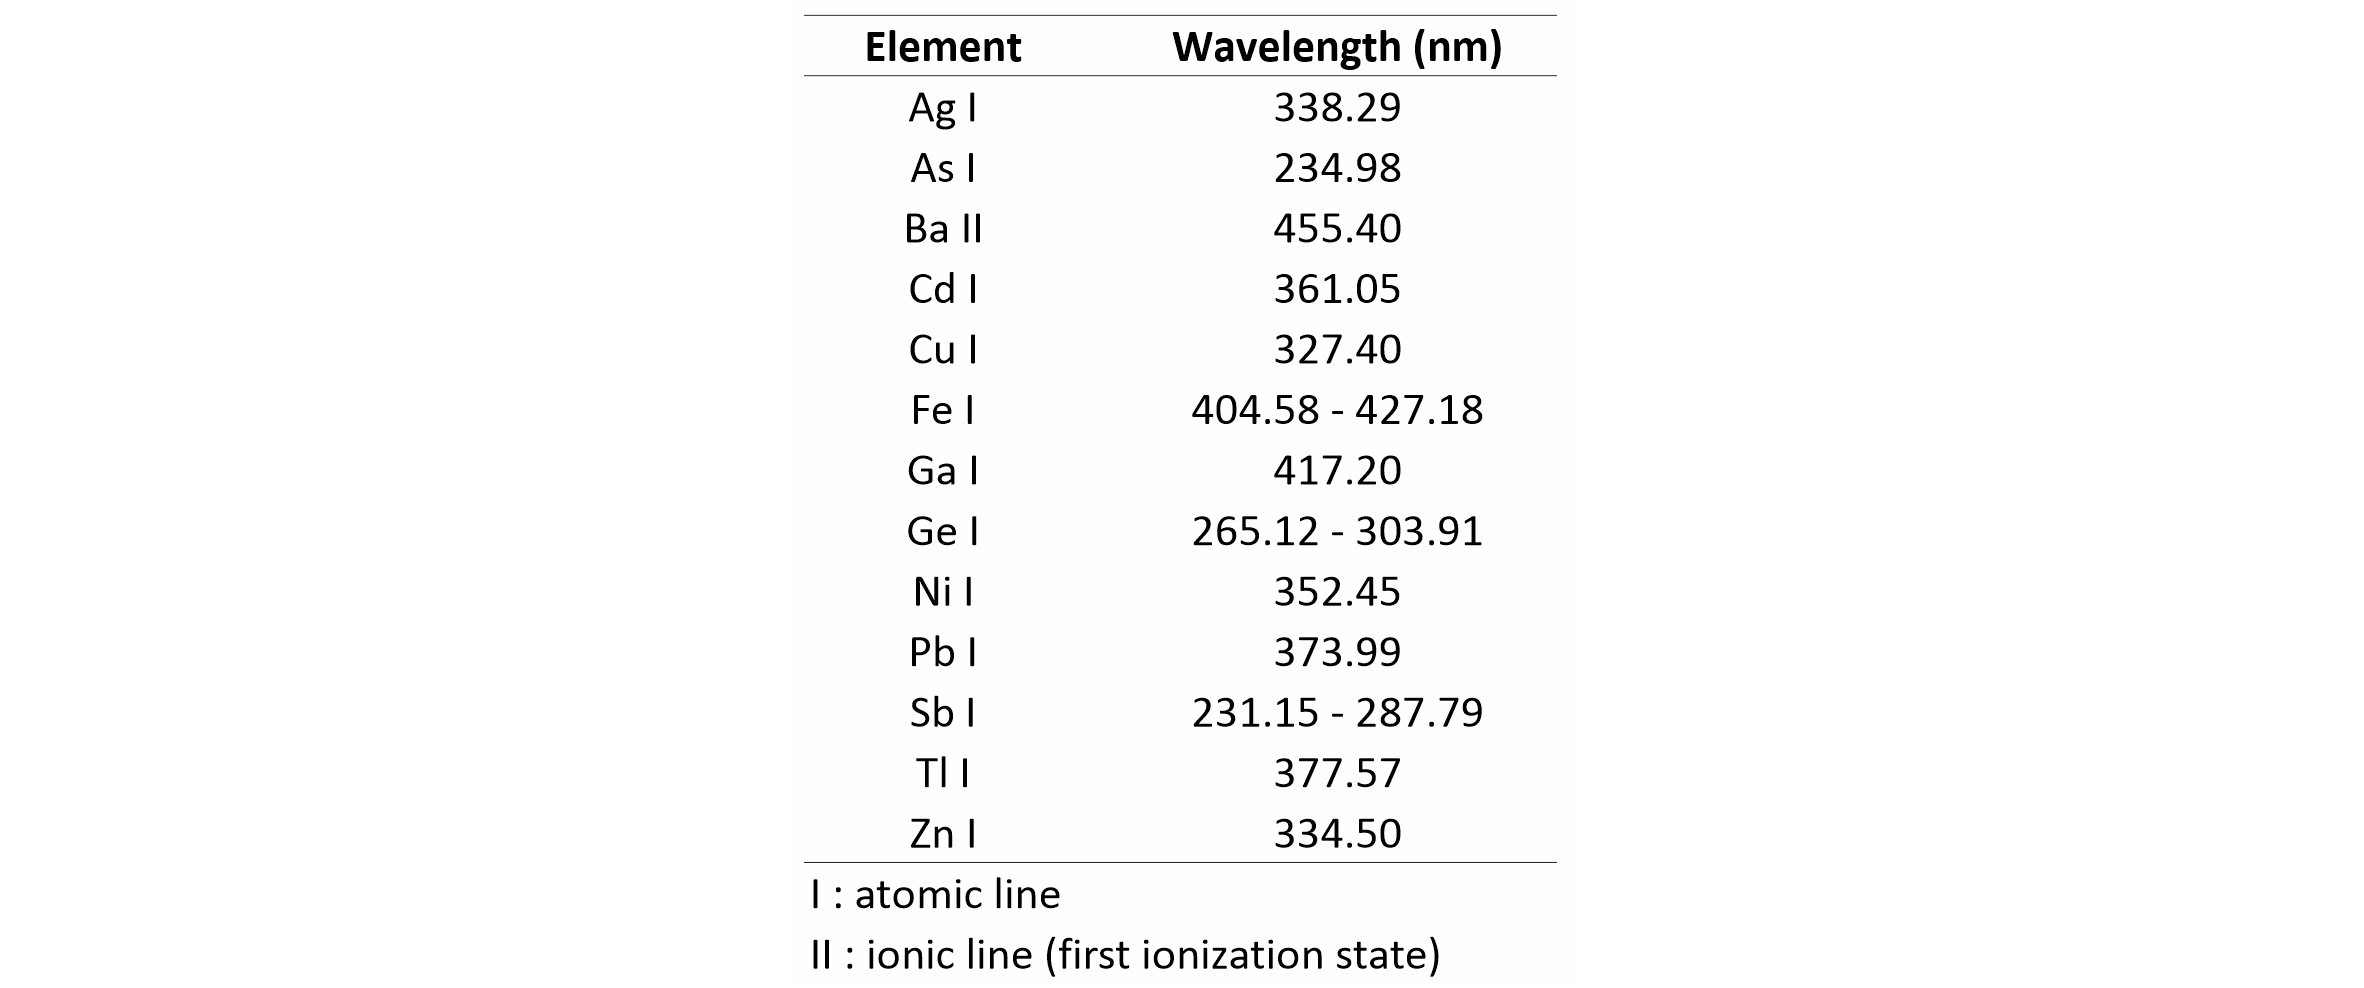
11LIBS images were extracted from the datacube after background subtraction and corrected for spectral interferences when needed. Despite the high complexity of LIBS spectra, peak overlap from spectral interference was not a major concern for most elements and correction for overlap was mostly used to enhance the elemental images. We used a series of reference materials and free atomic emission tables (Kramida et al., 2019) to select the lines with maximum intensity and minimum peak overlap (see Table 1 for the selected lines and Fig. 3 for example spectra). Auto-absorbed lines, which were only observed in strong emissions from major elements (and in reference spectra), were avoided.
Table 1. Wavelength of the atomic and ionic emission lines used to generate the LIBS images in this study.
12When analyzing multi-elemental, heterogeneous materials, the spectral overlap is easily detected by comparing the images from different lines of the same element, which should mirror each other if no interference occurs. When different, the search for the interfering element(s) is facilitated by the observation of the images from other elements together with the reference spectra and spectral database. Our spectral correction method was inspired from the procedures that are widely used in X-Ray WDS (Wavelength-Dispersive Spectroscopy) analysis in electron microprobe, i.e. linear background interpolation based on measurements on both sides of the peak, where possible, or overlap removal by subtracting from the signal the rescaled intensity of another line from the overlapping element. The overlap removal method, which requires a set of previously acquired reference spectra, relies on the fact that the intensity ratio between the different atomic lines of a given element remains the same. This can be assumed if analytical conditions, including excitation conditions (laser irradiance) for the reference and the unknown samples, are also the same and matrix effects can be neglected. The consistency of the results obtained so far suggests that, under the conditions we have used, matrix effects have no tangible influence. Another technique to tackle with spectral overlap, which was not used here because there are only two major mineralogical phases, is to use a different, overlap-free emission line of the same element for each mineralogical phase in the sample (e.g., Cugerone et al., 2021).
13Few scanning artifacts such as spurious lines or offsets are visible in the maps suggesting fairly good reproducibility of both positioning and plasma emission throughout the acquisition process. The repeatability of plasma emission depends on the shot-to-shot variability of the laser (measurable) and other geometrical and sample-dependent factors such as lens-to-sample distance and surface properties (hardly or not measurable). Here, the measured relative standard deviation of shot-to-shot fluctuation of laser energy was 4.2% and the surface was processed and adjusted to achieve maximum flatness and maximum uniformity for both lens-to-sample distance and rugosity. However, a band with a slight shift may appear in the uppermost part of the maps due to a technical problem during acquisition, which resulted in a stop, repositioning and a restart of the acquisition process.
2.3. EDS analysis
14SEM-EDS analyses were conducted at the University of Liège (ULg) to compare the results with those obtained with the LIBS for major and minor elements with a well-established technique that is growingly used for mineral exploration (e.g., in so-called mineral mappers). The goal was not to compare measurement accuracy and precision for both techniques, which makes little sense notably because their spot size is very different (9.4 µm for EDS vs 200 µm for LIBS). However, we aimed at verifying the overall consistency of the results, especially the adequacy between LIBS intensity at specific wavelengths, as indicated by the height of spectral lines, and corresponding elemental concentration.
15Prior to EDS analyses, the sample was roughly polished using diamond suspension (diam. 6 µm) to remove the layer of material that was damaged by the laser during LIBS analysis. Then the entire sample surface was scanned with a motorized optical microscope. Each image (tile) of the resulting mosaic is referenced to three marks engraved on the sample. Correlative microscopy software (Zeiss Shuttle & find with ZEN 2 Core operating software) was used to scan exactly the same areas that were previously analyzed by LIBS.
16The sample has been mounted on a custom holder to ensure that the surface to be analyzed is as horizontal as possible, and carbon coated (Quorum Q150R-ES).
17The EDS analyses were performed using a ZEISS (Sigma 300) Field emission Gun (FEG) Scanning Electron microscope (SEM) equipped with two Bruker (xFlash 6|30) Silicon Drift Energy-dispersive X-ray Spectrometers. A probe current of 2.3 nA was used with an accelerating voltage of 20 kV at a working distance of 8.5 mm. The acquisition time of each spectrum was set to 30 seconds allowing enough time for trace elements to be detected. With such a long acquisition time, EDS analyses were performed in point analysis and not mapping mode.
3. LIBS imaging
18The following elements were detected in the 190–470 nm plasma emission range: Zn, Pb, Fe, Cu, Ag, Cd, Sb, As, Tl, Ge, Ni, Ba, Mn, Al, Si, Ca, Mg, Sr, V and C. The distribution of Pb and Zn accurately delineates galena and sphalerite, respectively (Fig. 4), and the other elemental images provide the distribution of minor and trace elements as discussed below in more detail. Only Fe, Cu, Ag, Cd, Sb, As, Tl, Ge, Ni and Ba were considered in this study. Other elements typically found in sulfide ores such as, for example, Co, Mo, Bi, Hg, Se and Te were not detected. Ga and In, for which sphalerite is an important resource, were not directly detected in the spectra neither. However, correction for overlap with a Fe line occurring at the wavelength of a strong Ga line yielded a distribution pattern that could correspond to gallium (see below). The emission lines of S, K, Na, H and Li lie outside the wavelength range (191 to 470 nm) used in this study.
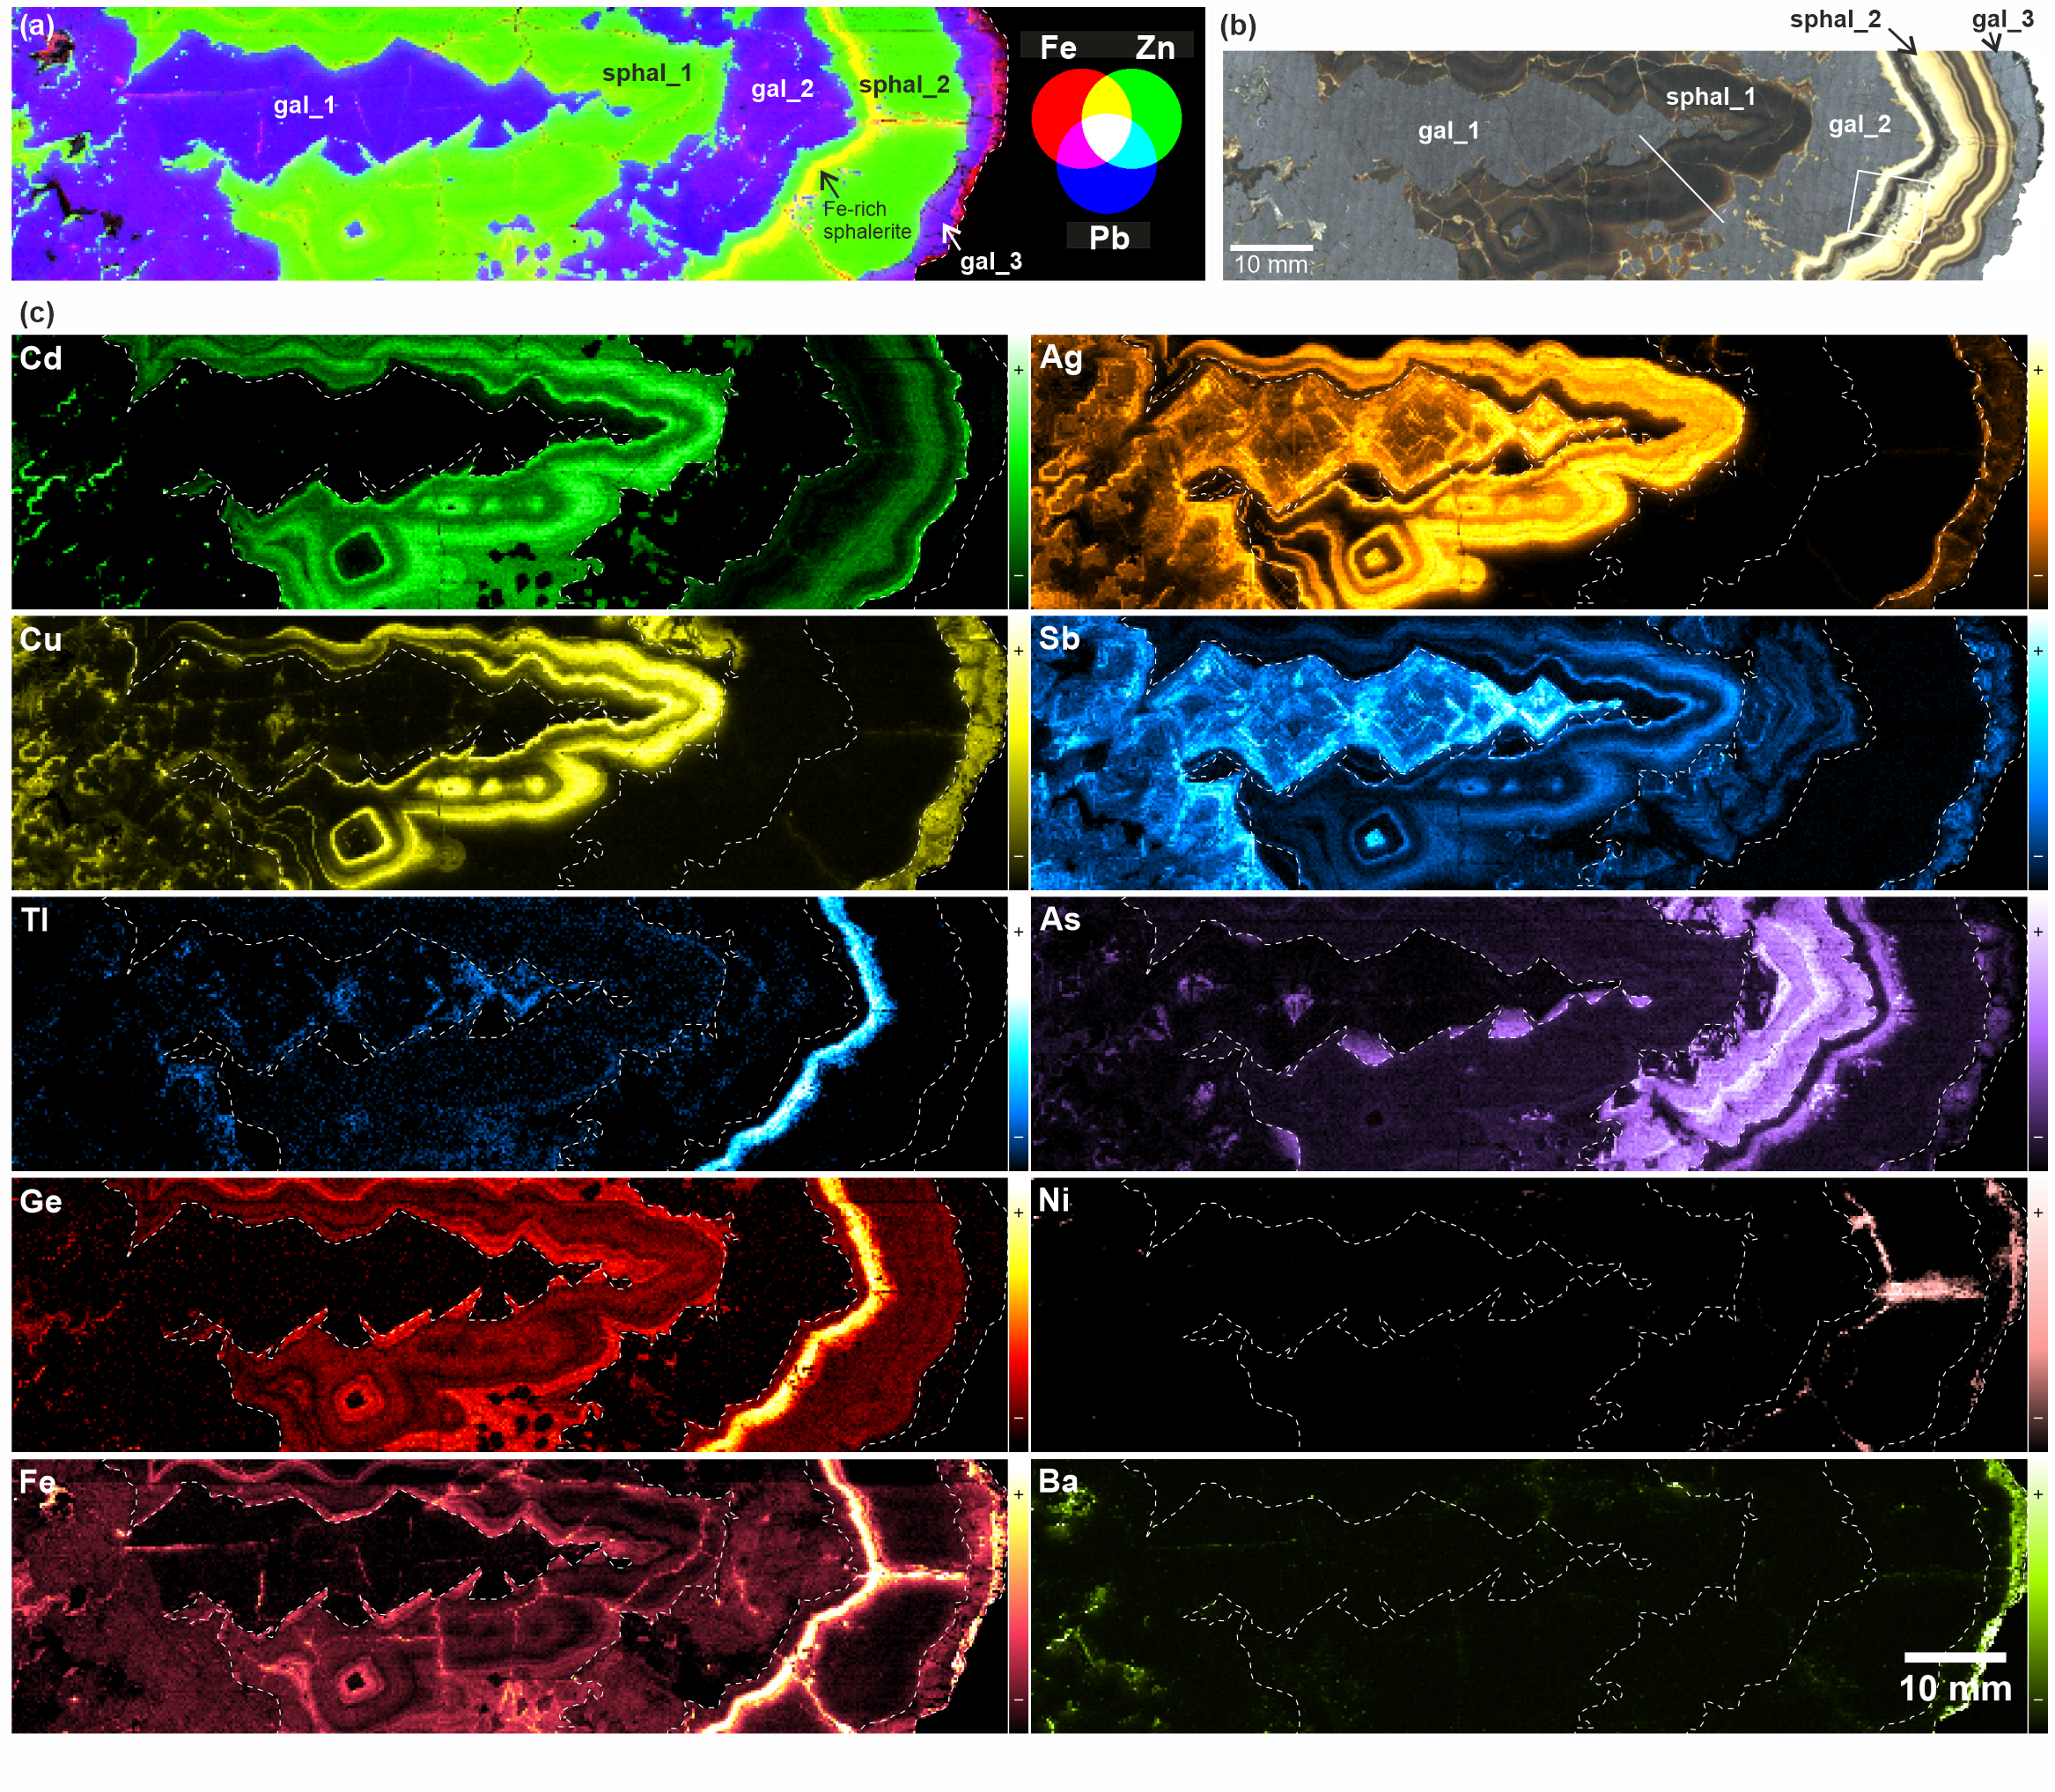
Figure 4. LIBS images of selected elements for the studied Zn-Pb ore sample. (a) Composite RGB image of major elements (red: Fe, green: Zn, blue: Pb). Iron sulfide is not present in this sample but a Fe-rich band is observed in sphal_2. (b) Tiled image from crossed-polars reflected light micrographs. The square and the line show the regions where EDS analyses were performed (see Figs 6 and 7). (c) Elemental images of cadmium, silver, copper, antimony, thallium, arsenic, germanium, nickel, iron and barium. The main boundaries between the different galena and sphalerite generations are outlined by a dashed line. LIBS intensity is plotted with a color scale from weak (-) to strong (+) values, as shown to the right of the images.
19LIBS spectra are complex, with a relatively high probability for spectral overlap, especially in the presence of elements producing a high number of emission lines such as iron. Therefore, it is good practice to examine the elemental images of different spectral lines for a given element to validate its detection. Germanium, for example, displays a strong line at 265.12 nm but this line suffers from spectral interference with Pb (Fig. 5), which would result in false detection of Ge in galena. After subtracting the intensity of the Pb line measured at its low-wavelength side, i.e. outside the interference region, Ge distribution looks identical to that in the elemental image extracted from the 303.91 nm line, which has a lower intensity but is overlap-free (Fig. 6). In addition, in this case, the influence of the background formed by the coalescence of multiple but weak Fe lines is diminished. Therefore, the similarity of the Fe and Ge distribution patterns as depicted in Figure 4 is not the result of a spectral artifact, as confirmed by the two iron-rich radial veins crosscutting sphal_2, which are not visible in the Ge image, nor are the iron-bearing zones in both gal_1 and gal_2 visible. Thus, both the corrected and uncorrected Ge images identically show the distribution of germanium in the studied sample. Also, note that the presence of an overlapping Sb line to the high-wavelength side of the Ge 265.12 nm line is not an issue as the distribution pattern determined by the brightest pixels in the Sb image (which are located near the tip of the stalactite-like gal_1 crystal aggregate) are not visible at all in the Ge image. Obviously, the low-wavelength tail of this Sb line constitutes a negligible contribution to the LIBS signal at 265.12 nm, where the intensity of Ge is measured.
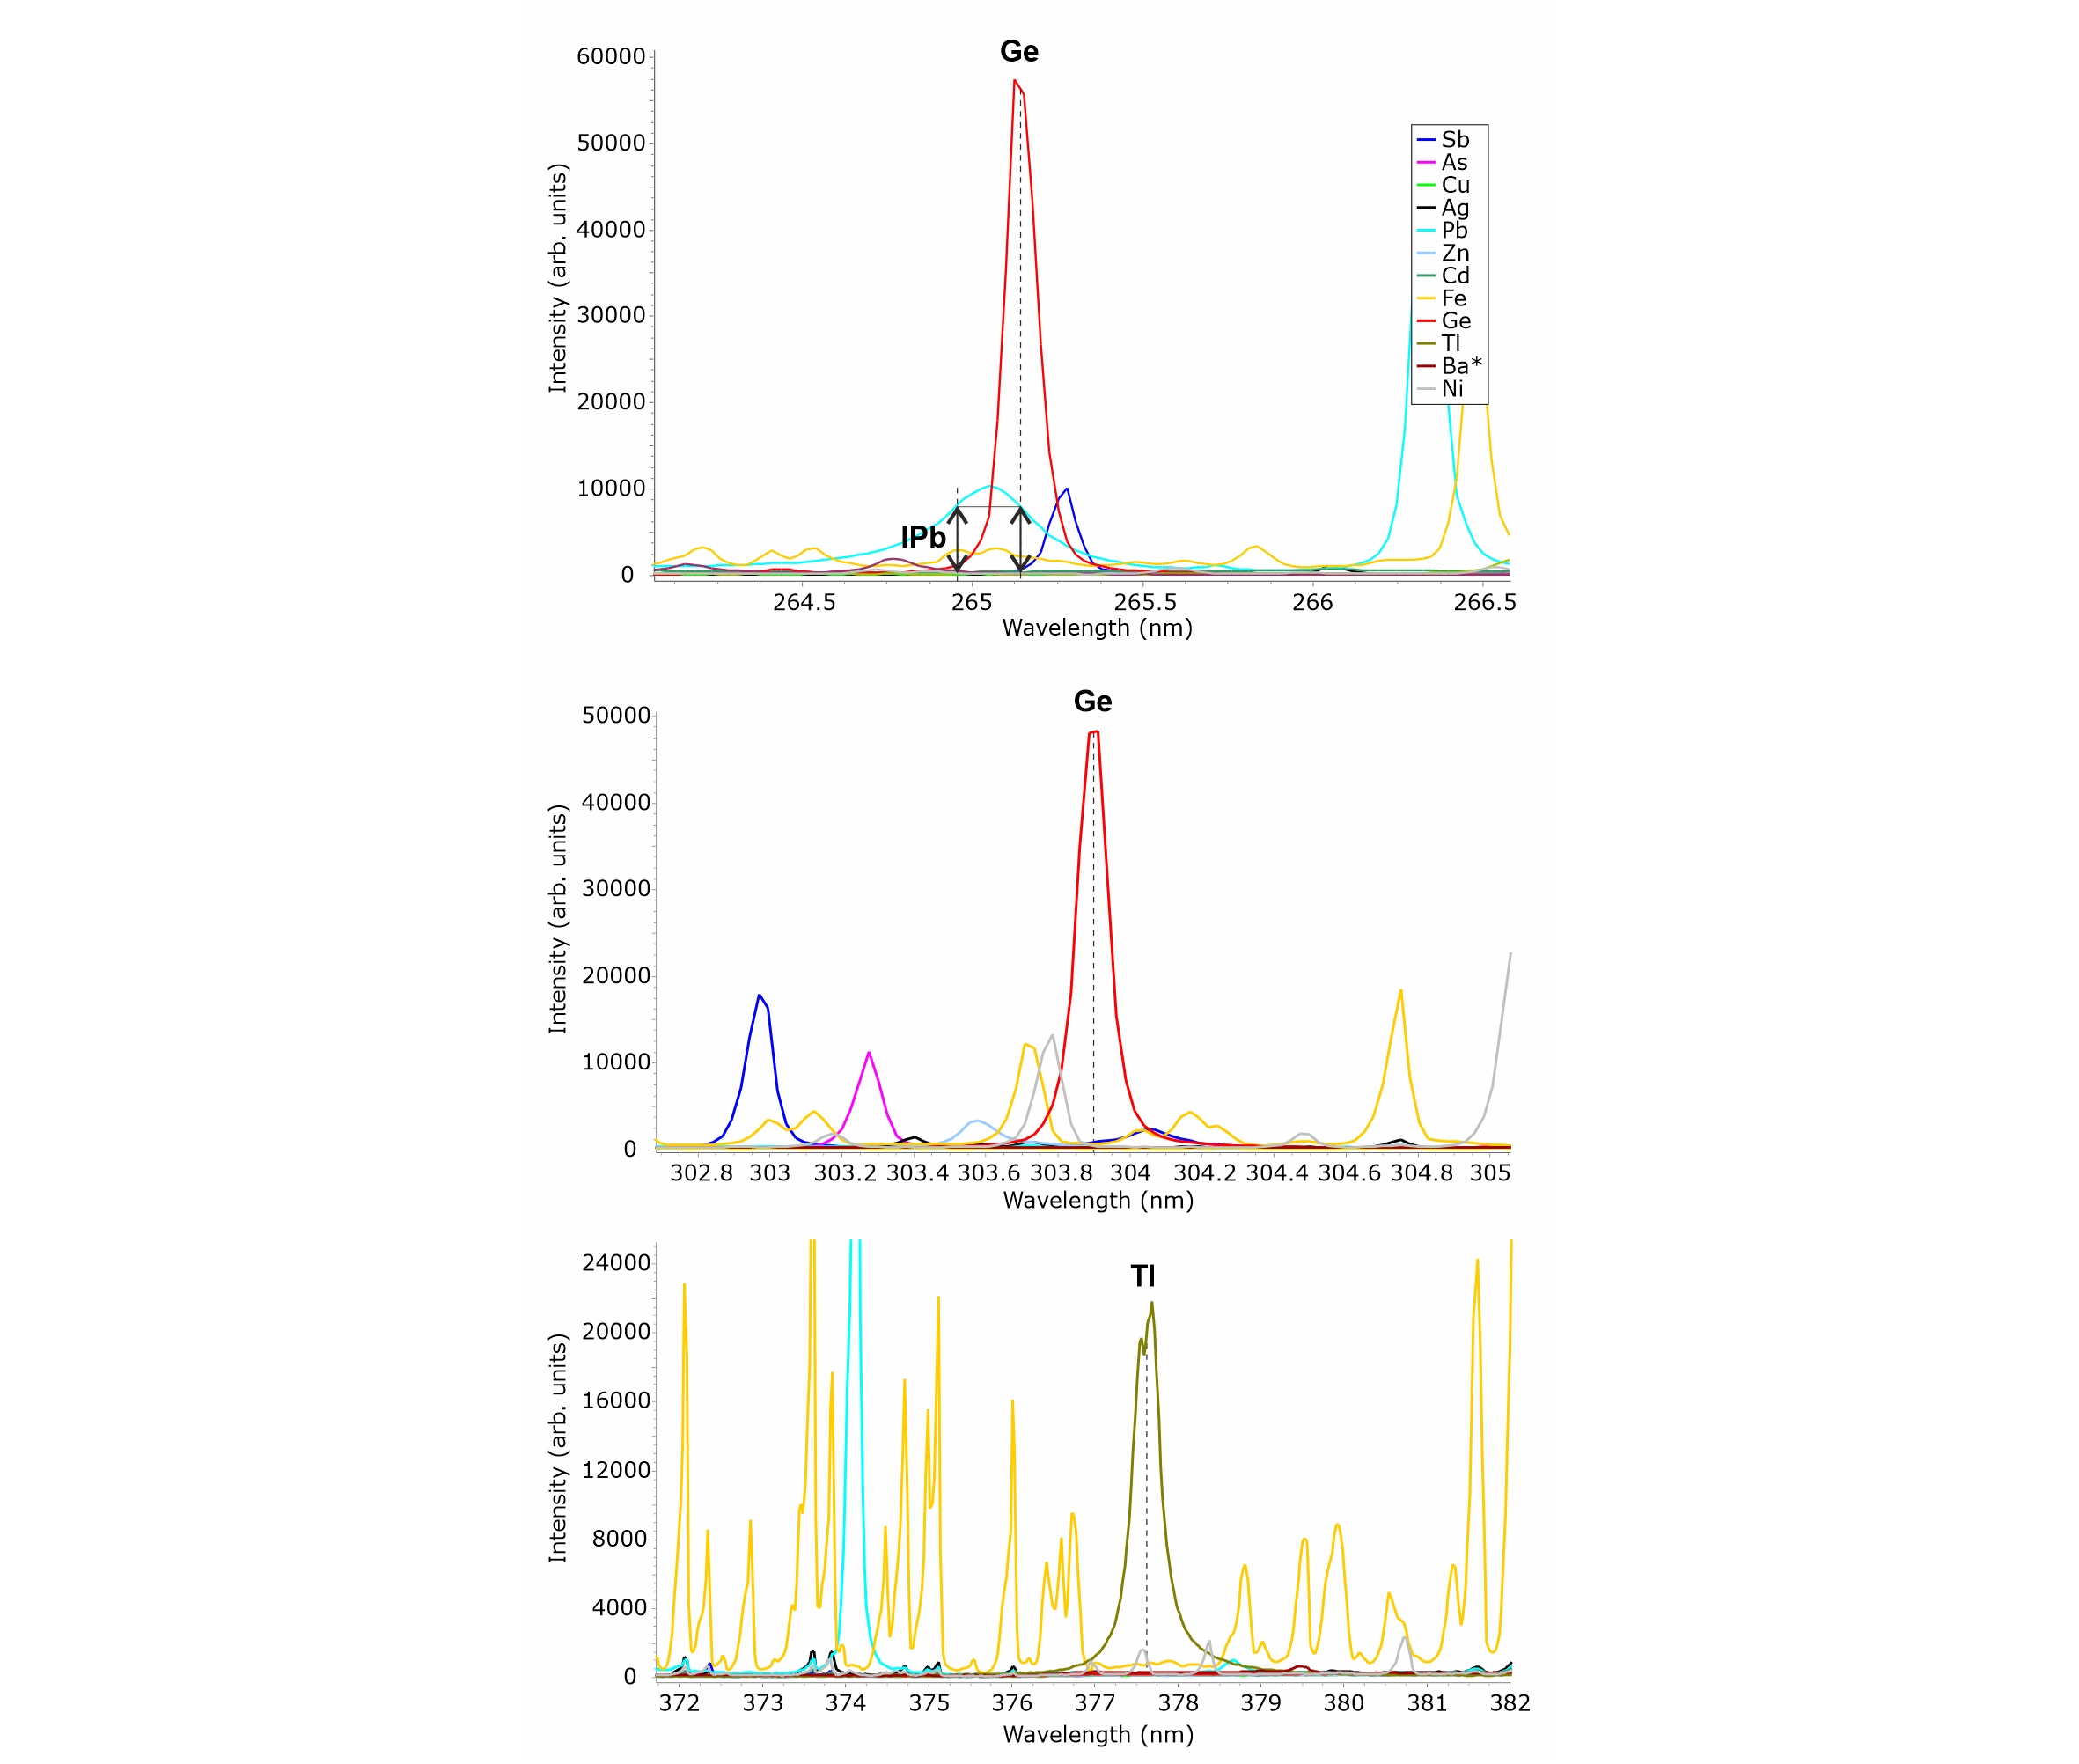
Figure 5. LIBS spectra from selected reference materials showing that there is no major spectral overlap for Ge and Tl lines, except for the Ge line at 265.12 nm, where correction for an overlapping Pb line is required. This correction consists in subtracting from the intensity at 265.12 nm the intensity of the overlapping Pb line, which can be measured outside the interference region on the low-wavelength side of the peak (IPb). Note auto-absorption affecting Tl line, where the peak is self-reversed. * in the legend indicates that the reference material for Ba is not a pure element but a compound (baryte).
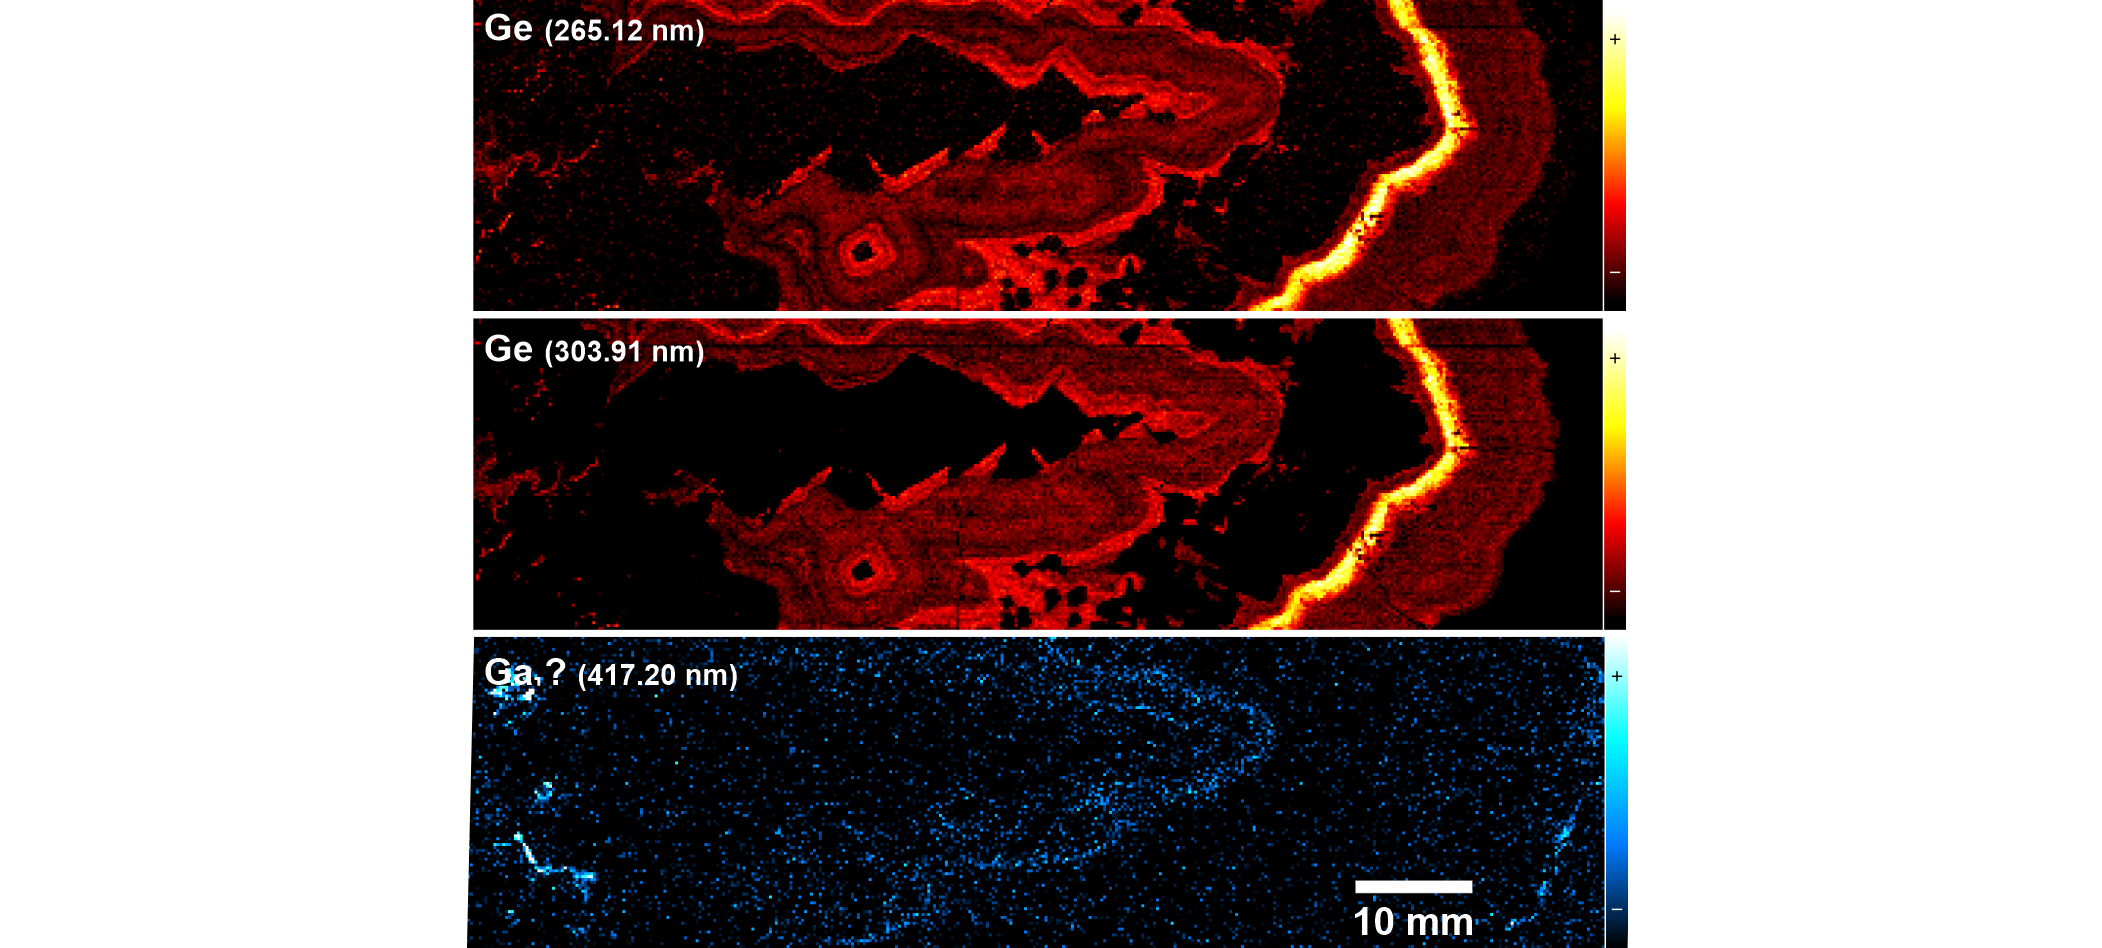
Figure 6. LIBS images of Ge and possibly Ga for the studied Zn-Pb ore sample. Upper: elemental image of Ge at 265.12 nm after correction for Pb overlap (see Fig. 5). Middle: elemental image of Ge at 303.91 nm, where no correction is needed but more noise is seen due to lower peak intensity. This image is almost identical to the map at 265.12 nm, demonstrating the effectiveness of the correction. Lower: image at 417.20 nm corrected for Fe overlap and tentatively assigned to Ga (see text for detail). LIBS intensity is plotted with a color scale from weak (-) to strong (+) values, as shown to the right of the images.
20The case of thallium illustrates well the benefit of elemental imaging. This element was not detected directly in the spectra because its concentration is likely close to the limit of detection of our LIBS and therefore it would have been difficult to visualize this element in the spectrum representative of the whole scanned area, i.e. with all spectra averaged together. Moreover, the 40,000 spectra that were acquired to build the hyperspectral cube would have been unreadable simultaneously. Instead, thallium was detected based on its distribution pattern (Fig. 4), which does not match the pattern from any other single element. An alternative explanation for the pattern observed for thallium may be the combination of Sb and Fe distribution patterns, although, as said before, the iron-rich radial veins in sphal_2 are not visible, invalidating any Fe contribution to the measured signal. In addition, no Sb or prominent Fe lines, susceptible to overlap with the Tl line at 377.57 nm (Fig. 5), are given by our reference spectra. Only Ni can, although weakly, interfere at this wavelength but the distribution pattern of this element (Fig. 4) is not observed in the Tl image. Finally, the distribution pattern of another Tl line at 351.92 nm exactly mimics that at 377.57 nm. Therefore, the LIBS image at 377.57 and 351.92 nm can be confidently ascribed to thallium distribution.
21Gallium is the only element for which it was not possible to confirm the presence by comparing the distribution images of several emission lines. Gallium lines were searched in the LIBS spectra because this element is a critical raw material commonly associated with Zn ores. After correction for moderate Fe overlap, the LIBS emission at 417.20 nm, where one of the four strongest Ga lines occurs, produced a low intensity, noisy image with a faint but discernible banding similar to that of Cu or Cd in sphal_2 (Fig. 6). However, only a weak ionic Cu line at 417.19 nm is mentioned in the reference atomic emission database. Moreover, since the associated electronic transition requires a lot of energy (15 eV lower energy), this line is not expected to show up as also demonstrated by the absence of signal in our spectra from a close Cu line (416.11 nm) with the same lower transition energy and three times the intensity of the 417.19 nm line. Unfortunately, other Ga lines could not be evaluated because they strongly interfere with high-intensity Fe or Pb lines, for which simple correction procedures cannot work. Therefore, the presence of detectable gallium remains putative. Hot spots to the left and to the right in the Ga image are most probably caused by edge effects (that are exaggerated at such a low signal level) as they are located on both the edge of small cavities and on the edge of the sample.
4. Comparison with EDS
4.1. Spot analysis in sphalerite
22In a first step, 13 spot EDS analyses were performed across the Fe-rich sphalerite band in sphal_2, where the LIBS signal is high for Fe, As, Ge and Tl (see Fig. 4 and Fig. 7 for their location). Germanium and thallium were not detected by EDS but iron and arsenic were successfully detected at 0.1–3.6 and 0.3–1.2 wt% concentration ranges, respectively. EDS spots were located as accurately as possible on the LIBS images by registration techniques with Fiji image analysis software. The average LIBS signal of four pixels in a square centered on the EDS spots was compared to the EDS data. Overall, and despite the difference in analytical spot size (a few µm diameters for EDS and 200 µm for LIBS), a good overall agreement is observed between elemental concentrations and LIBS intensities for these two elements although deviations occur at low concentrations, especially for As (<0.6 wt%) (Fig. 7).
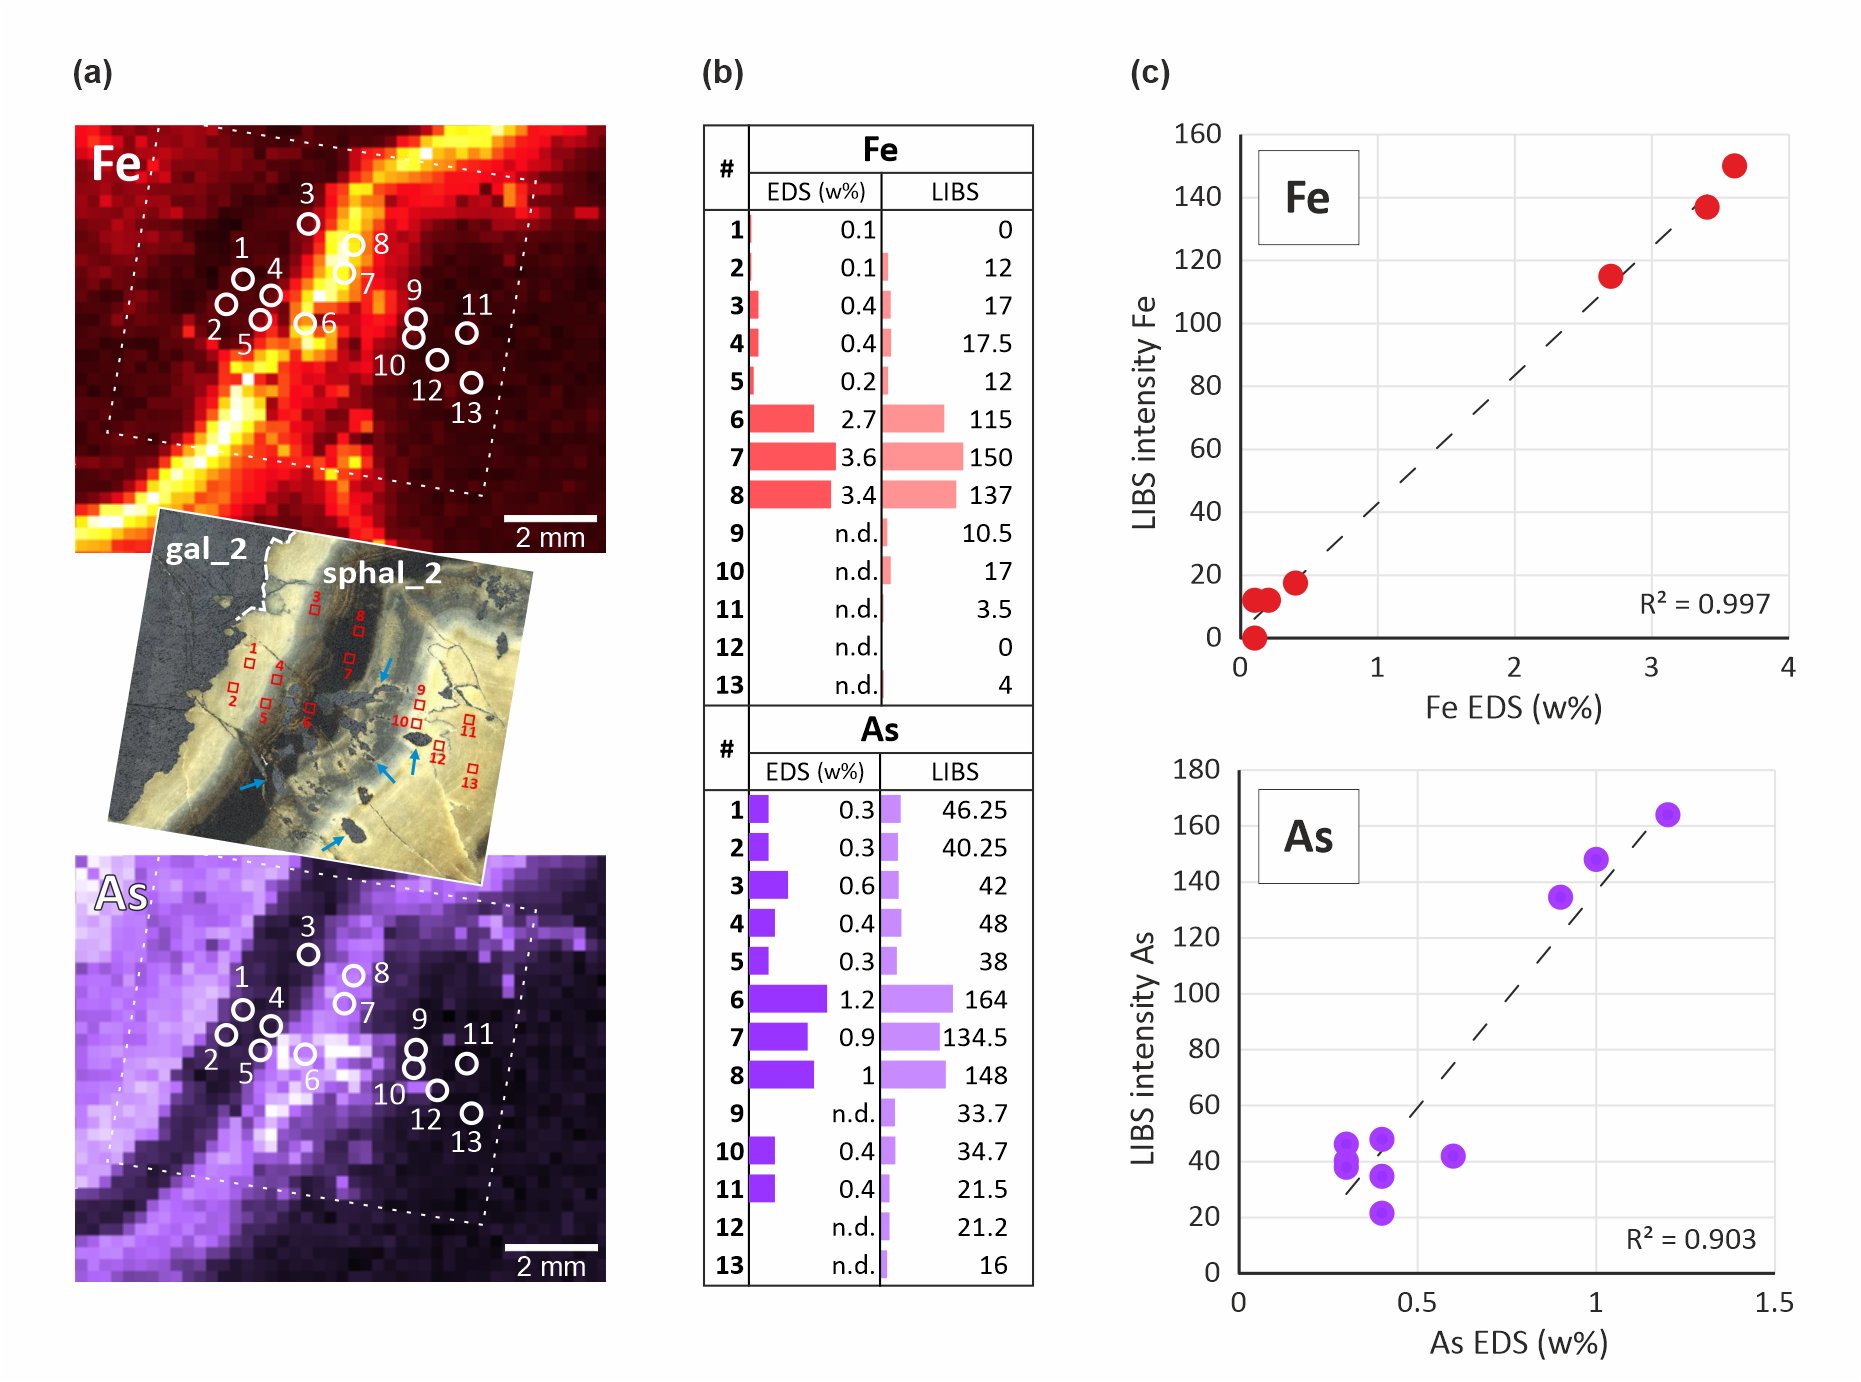
Figure 7. Comparison between LIBS images and 13 spot-EDS analyses across the Fe-Ge-Tl-As-rich sphalerite in sphal_2. (a) Location of the EDS spot measurements indicated on the Fe and As LIBS images. The micrograph in the middle shows the EDS spot locations on the original sample. The As-(and Ge-Tl)-rich sphalerite band where analytical spots #6 to #8 are located appears in dark. Note the galena blebs enclosed in sphalerite (arrows). (b) EDS and LIBS datasets for spot analysis. Note the consistency between the results from both techniques. (c) EDS vs LIBS scatterplot showing linearity between quantitative EDS analyses and LIBS intensities. LIBS intensity in arbitrary units.
4.2. Line profiles in sphalerite and galena
23In a second step, 52 EDS analyses of Pb, Zn, Cd, Cu, Sb and Ag were done along a line from gal_1 to gal_2 and crosscutting sphal_1 (see Fig. 4 and Fig. 8 for their location). After analysis, the trail of EDS spots was clearly visible on the BSE (Back-Scattered Electron) image and could be relocated on the LIBS images, where a line profile of the LIBS intensity was subsequently measured by image analysis. However, the pixels in the LIBS images cannot be confidently related to individual EDS spots because of the difference in resolution of the LIBS images and EDS spots (there are ca. 15% more LIBS pixels than EDS spots along the profile). Therefore, pairwise comparison of LIBS and EDS spot data is not possible, and only the trends of the profiles should be compared.
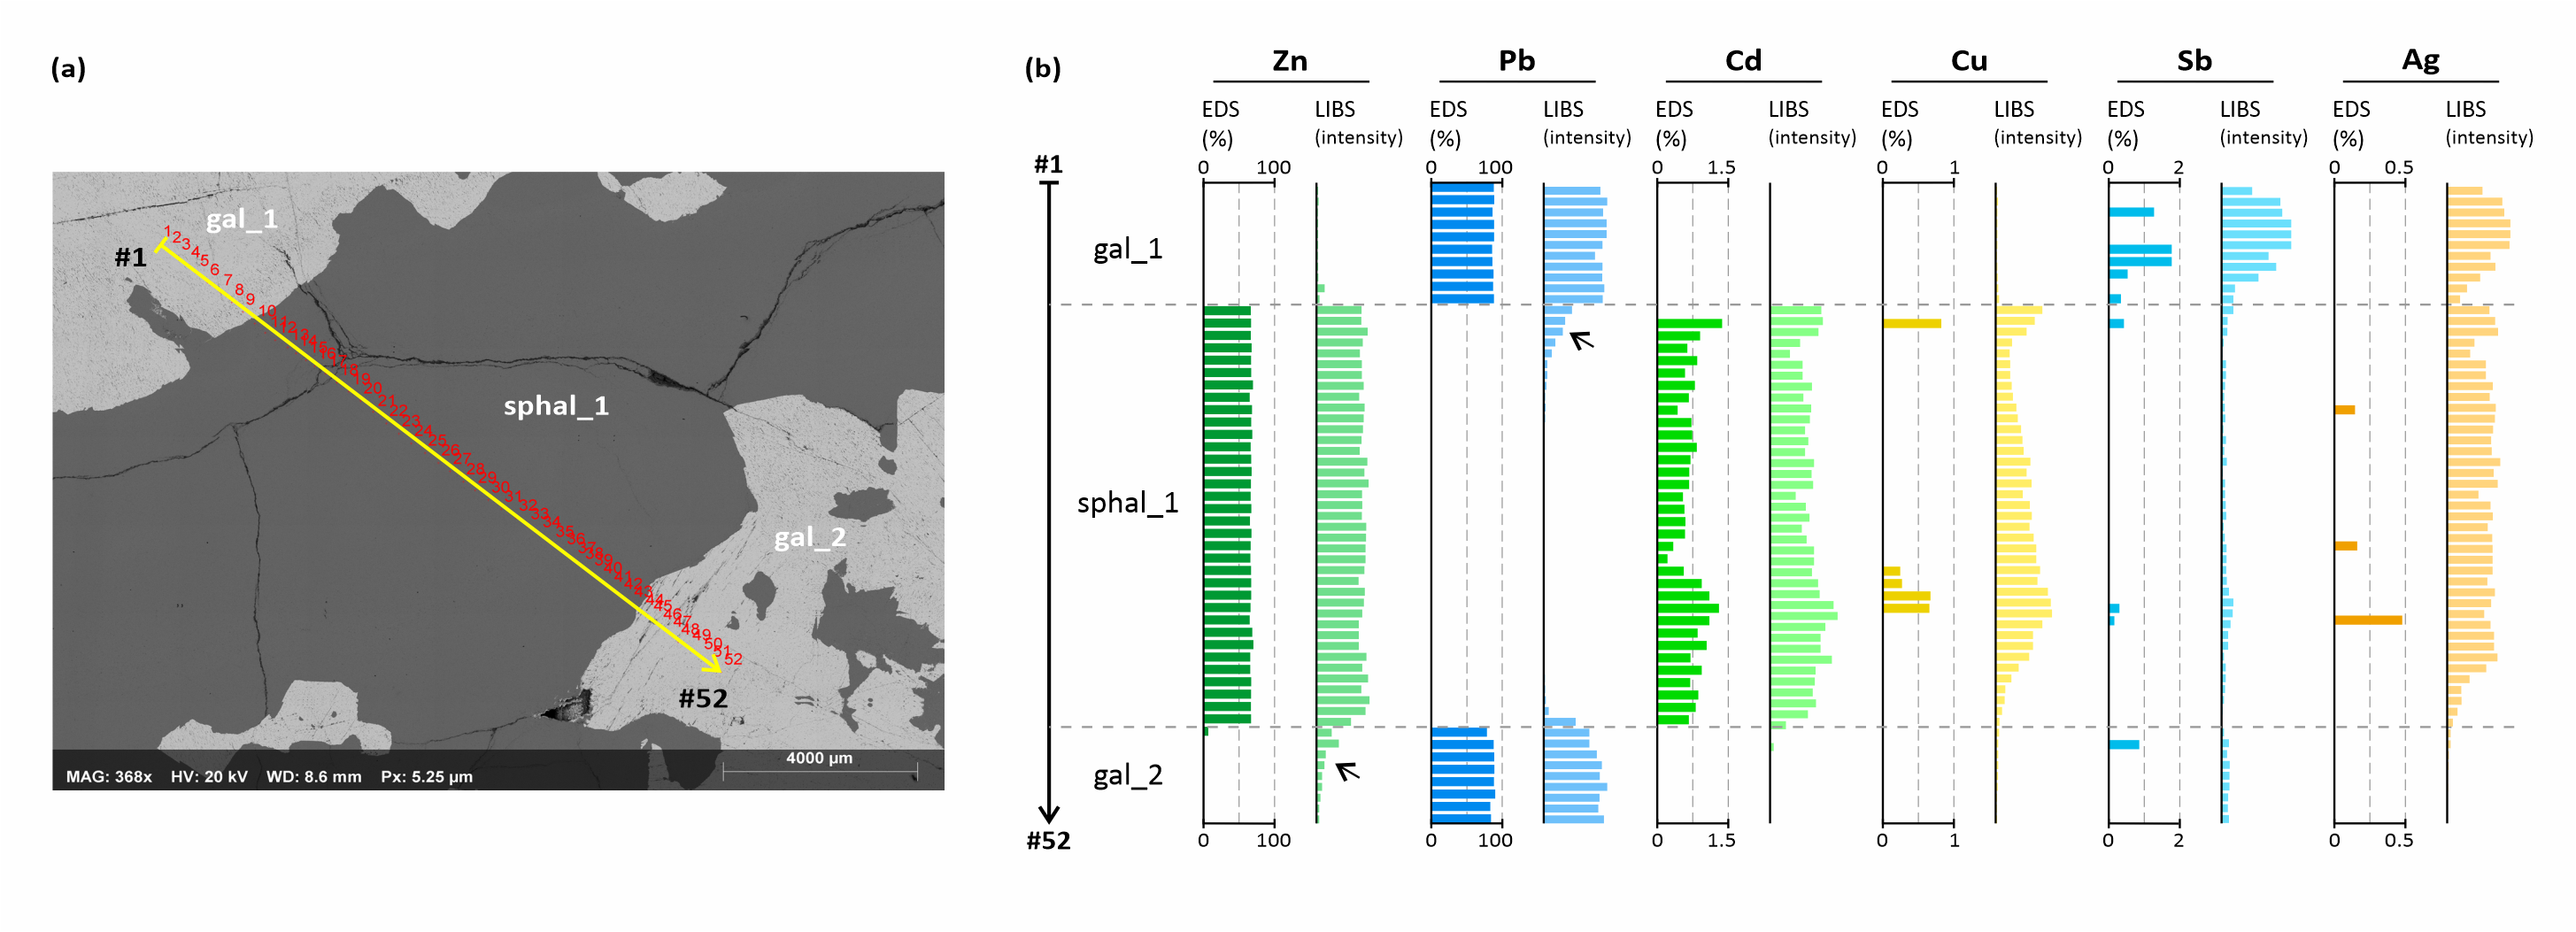
Figure 8. Comparison between a LIBS and EDS profile made of 52 analytical spots crosscutting sphal_1 band. (a) BSE (Back-Scattered Electron) image showing the location of the analytical spots. (b) Comparison between EDS and LIBS profiles (LIBS intensity in arbitrary units). The arrows point to contamination artifacts (see text for detail).
24LIBS and EDS analysis show consistent results for major elements, Pb and Zn (Fig. 8). However, larger fluctuations in LIBS intensity occur and may be related to the higher sensitivity of LIBS to surface defects such as pitting and fractures, which influence the interaction between the laser and the sample and degrade plasma reproducibility. As a more conspicuous difference, the lower boundary between galena and sphalerite in the Zn LIBS profile is not sharp as in the EDS profile. Instead, LIBS data seemingly indicate a gradual decrease in Zn concentration in adjacent galena. The same is observed for Pb in the upper boundary between galena and sphalerite. This phenomenon, currently under investigation, is an artifact particularly apparent for major elements in LIBS images (although it is barely visible in composite RGB images such as in Fig. 4). It is thought to be caused by contamination of the sample surface by successive falls of plasma condensates, which can spread over more than 1 mm away from the ablation crater. The fact that the other boundaries are not or less affected is explained by the scanning process during LIBS mapping, which operates line by line from top to bottom. Then, for example, the last scan lines in gal_1 could not be contaminated (or contaminated much) by Zn until sphal_1 is reached by the laser, where the lines that are going to be scanned are already contaminated by Pb from the previous lines.
25For minor and trace elements (Fig. 8), there is an overall good agreement between LIBS and EDS profiles and the observed discrepancies can be explained by the different spot size, detection limit and matrix effects of the two techniques.
26Cadmium profiles, with up to ca. 1.5 wt% Cd as determined by EDS, are overall similar although hills and valleys do not always match, which would indicate that Cd distribution is heterogeneous at the microscopic scale and this heterogeneity is better recorded by the small spot size of EDS. Copper (up to 0.8 wt%) illustrates well the difference regarding the detection limit between EDS and LIBS, with effective detection of this element by EDS only where the LIBS signal is highest. The same would apply to antimony (up to 1.8 wt% Sb), which, in addition, seems to be heterogeneously distributed at the microscopic scale, as suggested by the sparser hits in the EDS profile. Silver (up to 0.5 wt% Ag) shows the most noticeable differences between EDS and LIBS profiles. In addition to the previous comments about the influence of spot size and detection limit, silver is undetected by EDS in galena despite that its LIBS signal remains as high as in sphalerite, where silver is effectively detected by both techniques. We interpret this as a result of the degradation of the detection limit of Ag in galena by EDS due to both interferences between Ag and Pb lines (as seen on EDS spectra) and higher absorption of Ag X-rays by Pb atoms.
5. Trace-element distribution in sphalerite and galena
5.1. Silver, cadmium, copper and antimony
27The individual (Fig. 4) and composite (Fig. 9) LIBS images clearly display the elemental occurrence and co-occurrence of Ag, Cd, Cu and Sb. The earliest deposited sulfides (gal_1 and sphal_1) are the most enriched in trace elements, except for Cd, which is preferentially hosted by sphalerite. Ag and Sb are clearly colocalized in gal_1 (with a slight predominance of Sb in the early growth stage) and highlight some zonal growth in gal_1 (Fig. 9). In sphal_1, Cd, Ag, Cu and Sb exhibit zonal growth expressed by a double bright layer, similar for Cu, Sb and Cd (Fig. 9) but slightly different for Ag (Fig. 4). Cd is still detected in later overgrowth where Cu, Sb and Ag are undetected. Cd is usually not detected in galena except when it is related to small sphalerite domains (such as for example in gal_1 to the left in the image; Fig. 4). In sphal_2, Cd is remarkably low in the lower half of the band and increases in the upper half. The uppermost millimeter-thick layer is enriched in Cd together with Ag but the intensity of the LIBS signal for both elements remains lower than in sphal_1. The distribution of Sb in gal_2 exhibits a zonal growth of low intensity relative to previously deposited sulfides. Cu and Sb are undetected in sphal_2. Cu, Ag and Sb reappear in gal_3 but also with a rather lower intensity. Some galena visible in the upper region of the image (at the base of gal_2) is puzzling. It is Cu-bearing with a LIBS intensity that is similar to that in gal_3 but it is also arsenic-rich like gal_2 (see below).
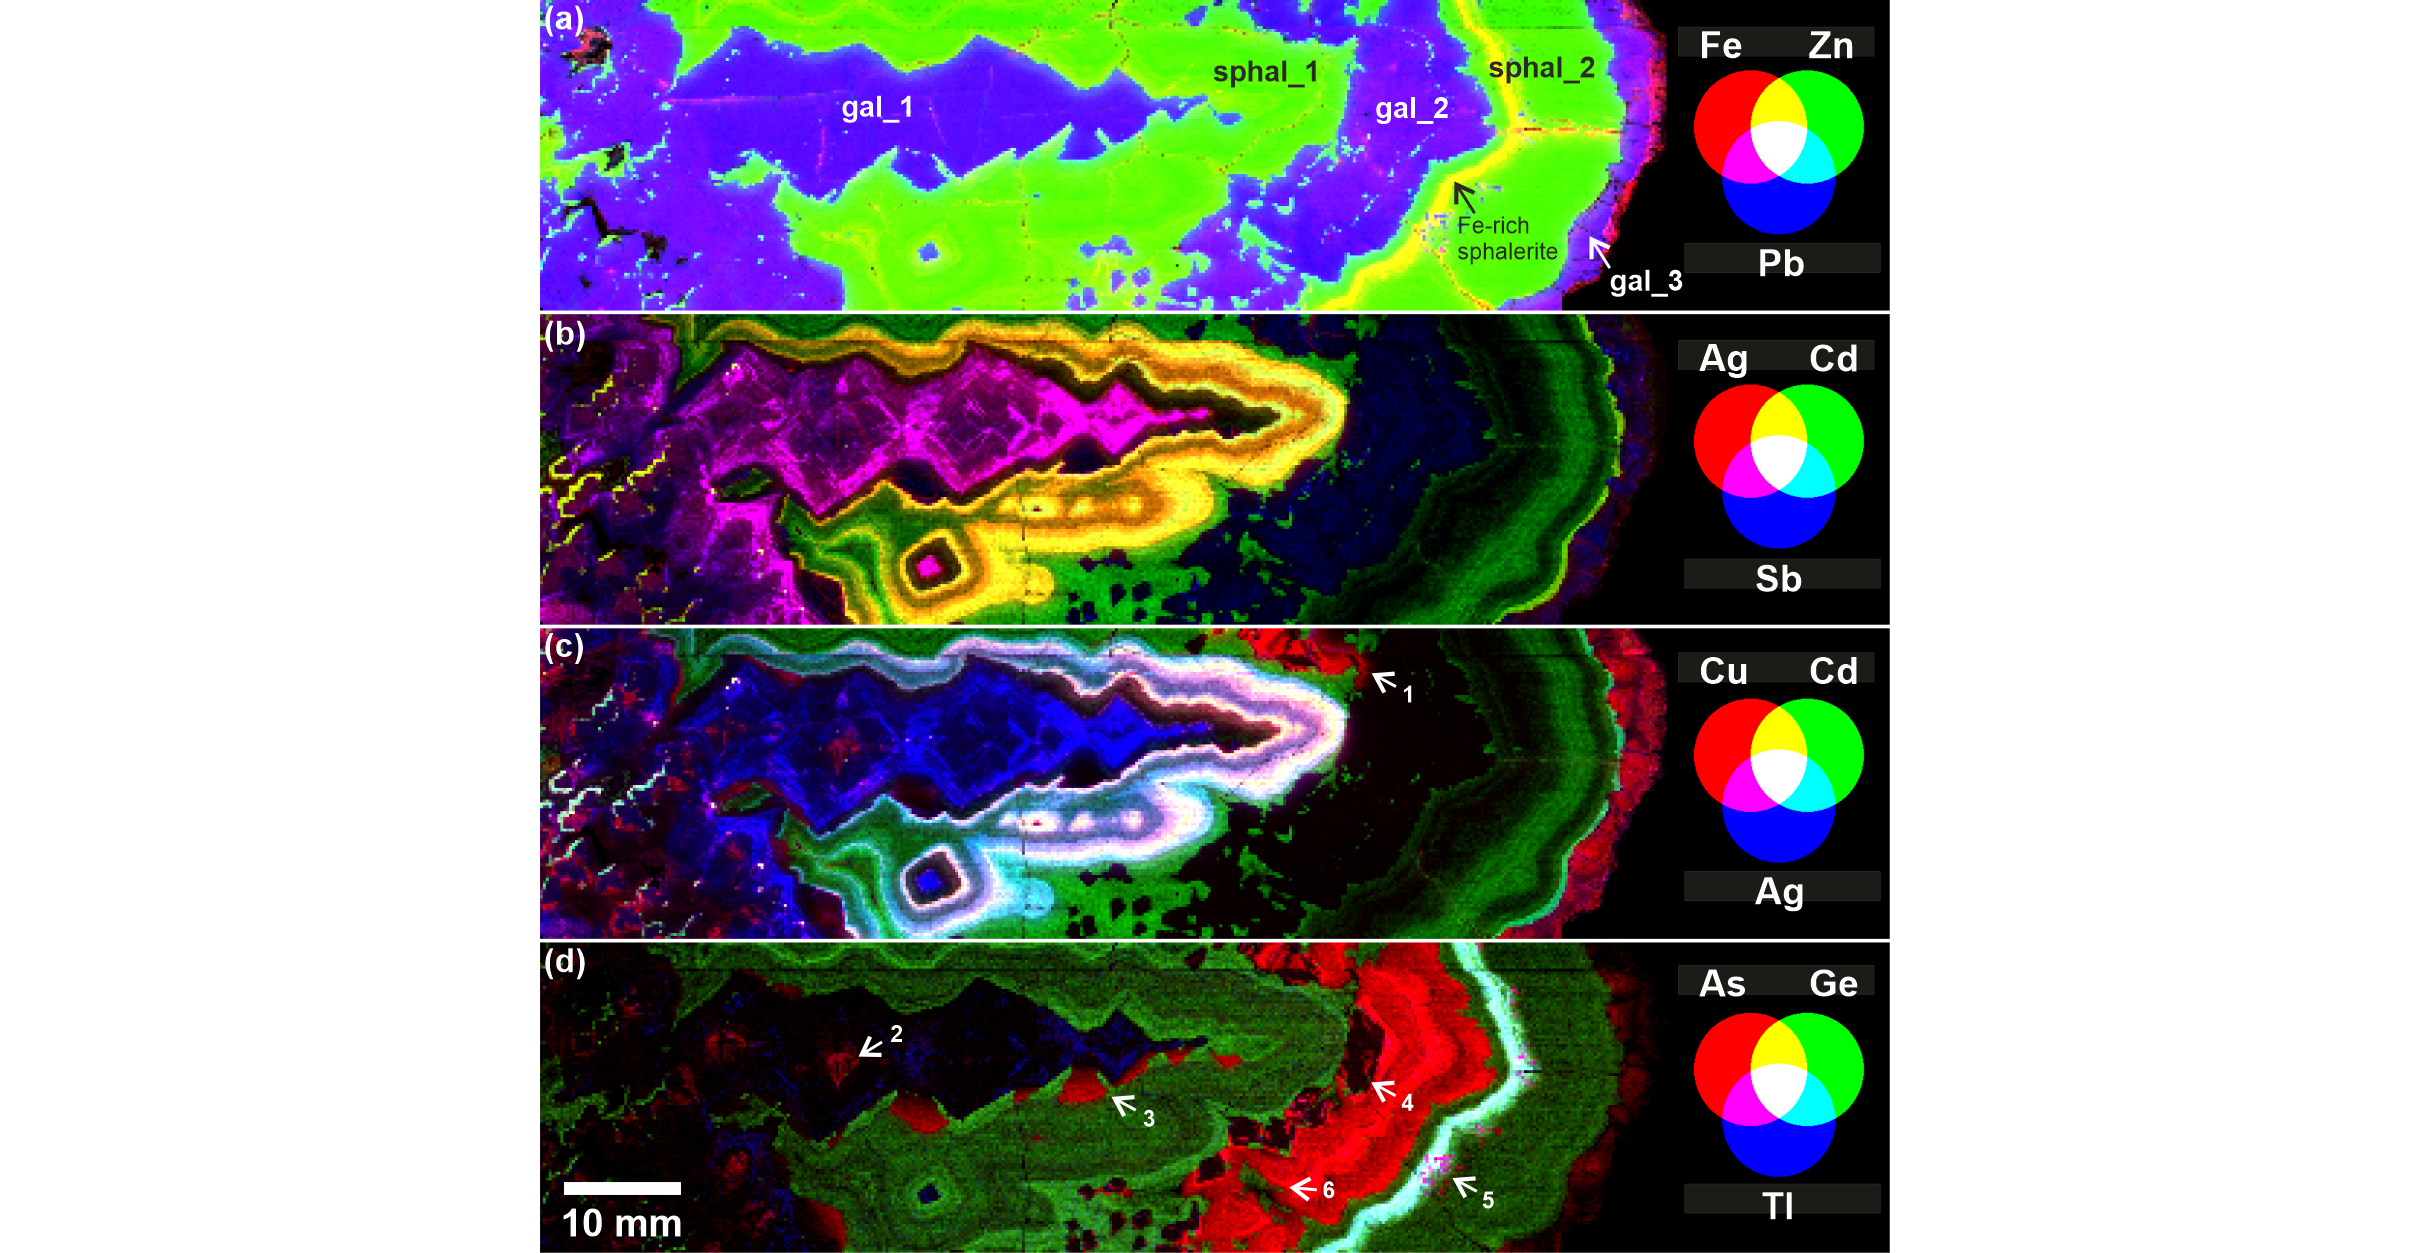
Figure 9. Composite RGB images from normalized LIBS images of selected elements to study their colocalization: (a) Fe-Zn-Pb, (b) Ag-Cd-Sb, (c) Cu-Cd-Ag, (d) As-Ge-Tl. The simultaneous presence of two elements results in shades of purple, yellow or cyan, while the simultaneous presence of all three elements produces a white color. Arrow 1: Cu-(and As-)bearing galena enclosed within gal_2. Arrow 2: early As-bearing crystal cores in gal_1. Arrow 3: As-bearing galena appendices that grew simultaneously with the early, Cd-rich sphalerite layer in sphal_1. Arrow 4: early As-free galena crystals at the base of gal_2, with some As-bearing sectors. Note the change in crystal morphology within the successive overgrowths. Arrow 5: a cluster of small As-Tl-bearing galena crystals within sphal_2. Arrow 6: sphalerite bleb that grew simultaneously with galena in gal_2.
5.2. Arsenic and thallium
28Arsenic is detected by LIBS within:
-
the core of gal_1 crystals, although with low intensity. These cores are also weakly Cu-bearing;
-
the latest overgrowth in gal_1, which forms sort of appendices in the lower side of the pseudostalactite structure;
-
in gal_2, with high overall concentration and conspicuous zonal growth;
-
in the Fe-rich millimetric layer in sphal_2;
-
in gal_3, with low intensity.
29The appendices in gal_1 are interpreted as resulting from late galena overgrowth that formed simultaneously with sphal_1. This interpretation is based on 1) the fan-like shape of the galena crystals and 2) the relation with the first bright growth zone of Cd, Ag, Cu and Sb, which unconformably covers the galena fans and the sphalerite in between. Yet, the sphalerite which is contemporaneous with galena is not enriched in arsenic, which would indicate preferential incorporation of this element into galena.
30Arsenic is detected with the highest LIBS intensity in gal_2 and displays zonal growth with a clear polyhedral (crystal) morphology at the base evolving towards a more colloform morphology along the successive overgrowths. This morphological gradation in zonal growth corroborates the crystal texture in this galena band, which grades from a “blocky” towards a “flame-like” texture consisting in the spreading of curved fibrous/lamellar crystals (see inset in Fig. 2). Note that gal_2 nucleated onto the surface of sphal_2 with sparse or clustered As-free crystals. In these earliest gal_2 crystals, some As-rich sectors are visible although it is barely resolved by the low resolution of the image (a less apparent crossed texture, tentatively interpreted as sector zoning is also visible in the As-bearing cores in gal_1).
31In gal_2, some sphalerite blebs that coprecipitated with galena (see the lower region in the images in Fig. 4 and Fig. 9) show no enrichment in arsenic, which also suggests preferential uptake of As by galena relative to cogenetic sphalerite. The same would apply for the bright, As-Tl-rich spots that are visible in the Fe-Ge-As-Tl-rich layer in sphal_2, which represent small galena blebs enclosed in and cogenetic with sphalerite (see Fig. 7 for an optical micrograph with higher magnification). Finally, arsenic is also detected in gal_3 but with a low LIBS intensity.
32The highest LIBS intensity of thallium is found in the Fe-Ge-As-rich layer in sphal_2 (Fig. 4). Thallium is also detected in gal_1 and its distribution pattern superimposes to the brightest regions of the distribution patterns of Ag and Sb.
5.3. Germanium and iron
33As discussed earlier (see Section 3), Ge and Fe have a strikingly similar distribution pattern in sphalerite, especially in sphal_1 and in the Fe-Ge-As-Tl-rich layer in sphal_2 (Fig. 9). Fe is also found in veins originating from late precipitation in fissures. In galena, only Fe is detected but this element is more heterogeneously distributed and does not follow the growth zoning observed with other elements.
5.4. Other elements
34Ni is only detected in the Fe-Ge-As-Tl-rich layer and in some Fe-rich veins in sphal_2 (Fig. 4). Mn (not shown) exhibits the same distribution pattern and is also detected in sphalerite in general but with rather homogeneous distribution. Ba is only detected in the small cavities in gal_1 and in the latest overgrowth in gal_3, where the iron signal is also higher (Fig. 4). This element was imaged because its emission lines are susceptible to overlap with the lines from other elements of interest.
6. Discussion
6.1. Trace-element association and genetic aspects
35The comparison with EDS above indicates that LIBS intensities from the studied ore sample can be confidently used for qualitative trace-element analysis. However, techniques with lower detection limits such as wet chemistry and LA-ICP-MS should be used to determine the concentration of those elements that were not quantified by EDS like Ge and Tl, or confidently detected by LIBS like Ga. Published data on minor and trace elements in Belgian sulfides are scarce: Evrard (1945) detected Fe, Cu, Mn, Cd, Ag and Ge in bulk sphalerites, Duchesne et al. (1983) reported thallium concentrations up to 6800 ppm in vein sulfides, Dejonghe (1990) studied Ni-minerals in Zn-Pb ores from east Belgium and, more recently, Goffin et al. (2015) focused on critical metals in Belgian MVT deposits. The latter study reported mean concentrations of Ge = 302 ppm, Ga = 2.2 ppm and In < 0.06 ppm, as determined by LA-ICP-MS.
36Overall, each mineral generation in the studied sample has a distinct trace-element composition as determined by LIBS, which likely relates to changing physico-chemical conditions and elemental concentration of the ore-forming fluids over time. The gradual decrease in trace-element concentration observed along the different mineral generations could reflect a general trend of the parameters that controlled mineral precipitation such as, but not only, a decrease in the concentration of dissolved metals, sulfide and/or in temperature of the mineralizing fluids (which is assumed to have generally remained below 150 °C, see the review of fluid inclusion investigations in Dejonghe, 1998). Note that the occurrence of arsenic and thallium in late mineral stages (gal_2 and sphal_2) is consistent with the hypothesis of an overall decrease in temperature over time as these elements are preferentially precipitated at low temperature (Pfaff et al., 2011).
37Looking at minor and trace-element evolution over time, an Ag-Sb-rich earliest phase that encompasses mineralogical boundaries (gal_1 and sphal_1) is observed in the depositional sequence (Fig. 10). This phase is overlapped by a second, Cu-Cd-rich phase (more restricted to sphal_1, which is also Ge-bearing) and followed by a Fe-As-Tl-Ge-rich phase (in gal_2 and sphal_2). Cd and Ge are hosted into sphalerite only as these elements have a high affinity for this mineral. In contrast, Ag, Sb, Cu and As are more independent to host mineralogy (although As seems to partition preferentially into galena when coeval sphalerite is observed).
38Among the different types of Zn-Pb deposits identified in Belgium, some are thought to be of karstic origin (Dejonghe, 1998; Dejonghe & Boni, 2004). Indeed, speleothem-like morphologies are manifest on the external surface of some ore samples. Together with abundant breccia textures, such morphologies are indicative of karst-related ore-forming processes, which are common in MVT deposits (e.g., Paradis et al., 2007 and references therein). In our LIBS images, a conspicuous pseudostalactitic structure is formed by a core of linearly arranged galena crystals (gal_1) overgrown by colloform sphalerite (sphal_1). The Ag-, Cu- and Sb-rich layers in sphal_1 show an increase in thickness and/or in brightness (i.e. in elemental concentration) towards the tip of the pseudostalactite (to the right on the images; see Fig. 4 and Fig. 9). Assuming the paleo-gravity was oriented from left to right in the sample when the ore formed at this stage, this could suggest that sulfide precipitation was influenced by dripping water in a vadose or near water-table environment, at least episodically. Alternatively, if the ore formed by mixing of different fluids in the deeper, saturated zone (e.g., Pfaff et al., 2011), the flow rate in large open spaces was likely higher in the central region of the cavity, which resulted in enhanced mixing and rejuvenation of the mineralizing fluids. Therefore, compared to the region close to the wall, the protruding part of the pseudostalactite may have been formed with a slightly higher precipitation rate and/or under more supersaturated fluid conditions. The latter hypothesis is preferred as the reducing conditions that are needed for sulfide precipitation are more likely to occur in the saturated zone than above it.
39The sphalerite in our sample shares some striking geochemical similarities with the sphalerite from the Ge-rich, low-temperature MVT deposit Tres Marias (Chihuahua, Mexico; Saini-Eidukat et al., 2009), especially concerning arsenic and the correlation between germanium and iron (see below). A comparison between Belgian and Tres Marias MVT deposits was already reported by Goffin et al. (2015). As noted by Cook et al. (2009) the Ge-Fe correlation could be typical of either the Tres Marias deposit or more generally to low-T stratabound (MVT) deposits. Our results would favor the latter hypothesis. However, quantitative data and a more comprehensive sample set are needed for establishing a more detailed comparison, which is currently undertaken.
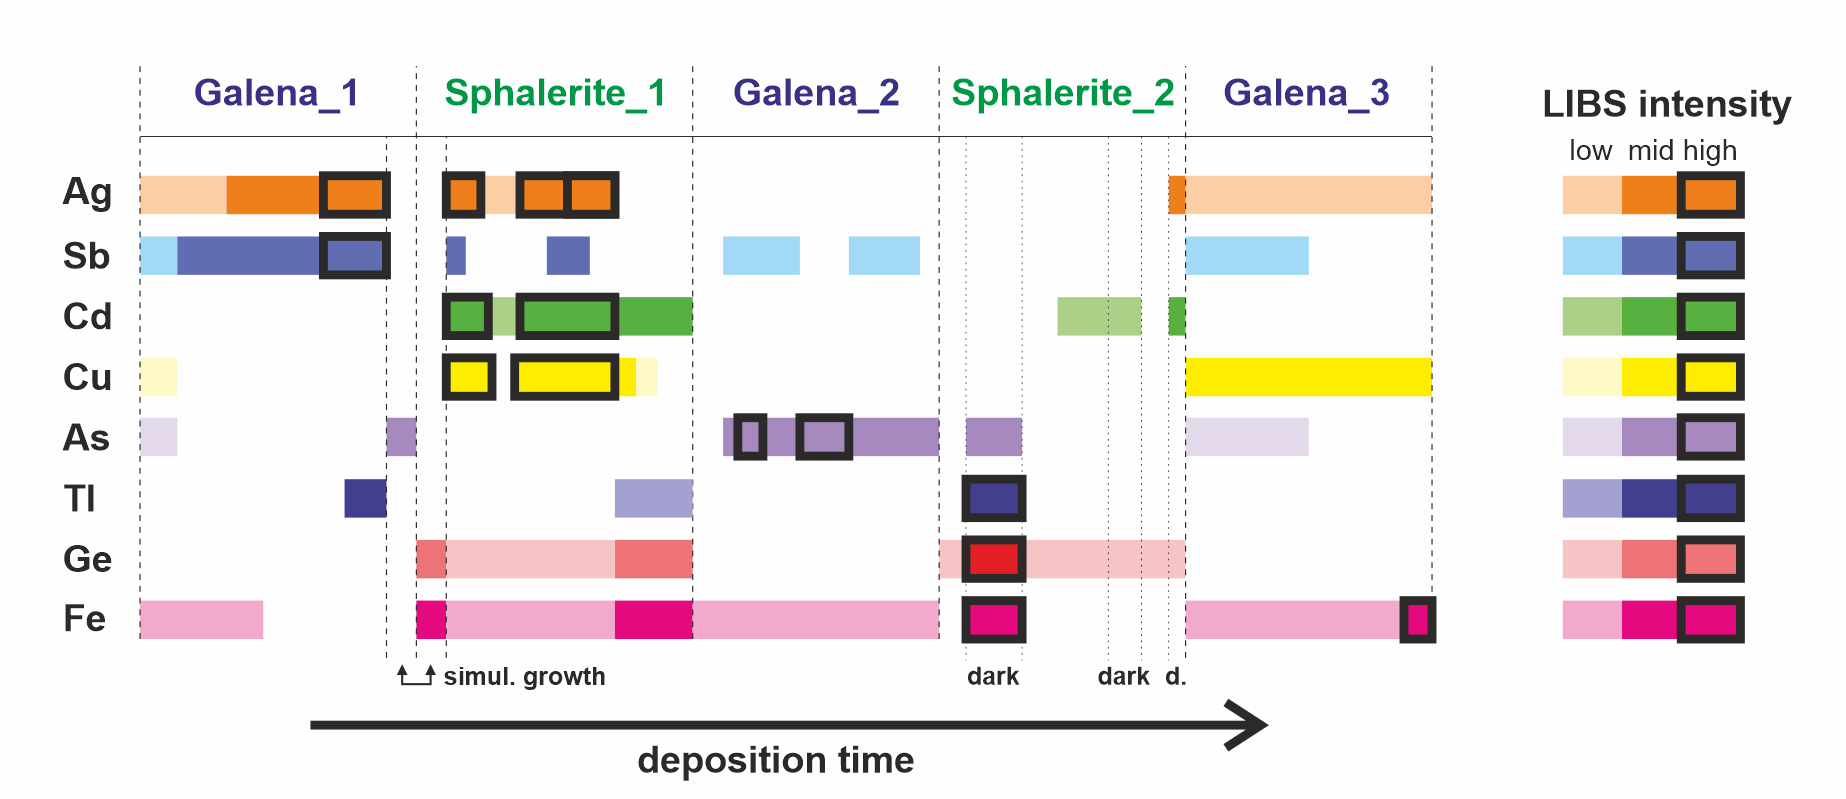
Figure 10. Summary of the qualitative trace-element composition obtained by LIBS analysis of the different sulfide generations in the studied Zn-Pb ore sample.
6.2. The particular case of arsenic
40The detection of arsenic in almost all the sulfide generations in our sample is surprising as this element is very uncommon in galena and sphalerite. Using LA-ICP-MS, Cook et al. (2009) detected hundreds of ppm As in sphalerite samples from only one deposit (Tres Marias) out of 26 deposits from various environments (epithermal, skarn and stratabound). With the same high sensitivity technique, George et al. (2015) detected no arsenic in galena samples from 15 sulfide deposits around the world. The maximum arsenic concentration as determined by EDS in our sphalerite is 1.2 wt%. However, providing there is no marked matrix effect between sphalerite and galena, higher arsenic concentrations are expected in gal_2, where the LIBS intensity of As can be much higher than in sphalerite. Note that even if the LIBS has a low spatial resolution, the location of arsenic in minute inclusions of other As-rich minerals than galena or sphalerite in our sample is less likely than substitution because of 1) the extensive arsenic distribution in gal_2 (almost the whole band is As-bearing), 2) the observation of zoning in arsenic distribution, including sector zoning, which is a compositional heterogeneity of typical substitutional origin, 3) the consistency between LIBS and EDS spot analyses despite their difference in spot size and 4) the absence of observable microscopic inclusions under the SEM. The existence of nanometer-sized As-rich inclusions remains possible but seems unlikely to us compared to the substitution of arsenic in galena.
41Substitution mechanisms of As3+ into sphalerite and galena are unknown although Clark (1970) has proposed possible Zn(As,S) isomorphic series for arsenian sphalerite from a deposit in Chile. Arsenic incorporation could explain the peculiar “flame-like” texture of galena by lattice distortion. Alternatively, independent environmental factors could have increased the growth rate and crystal imperfection of galena thereby facilitating its enrichment in arsenic. The latter interpretation seems improbable as arsenic is the only element that is detected with high concentration. Sb is also detected in gal_2 but in lower concentration than in gal_1, which, in addition, is significantly more enriched in other minor and trace elements while retaining a seemingly unstrained, “blocky” crystal morphology.
42Finally, addressing the issue of arsenic substitution will require the use of more advanced and quantitative analytical techniques and higher spatial resolution.
6.3. Substitution mechanisms
43Although no quantitative data have been obtained with the LIBS, some discussion can be initiated regarding substitution mechanisms of trace elements other than arsenic in our Zn-Pb ore sample.
44The covariation of Ag and Sb in galena could be explained by the coupled substitution Ag+ + Sb3+ ↔ 2 Pb2+ (George et al., 2015). The coupled substitution Cu+ / Ag+ + Sb3+ ↔ 2 Zn2+ could account for the trace-element patterns in sphal_1 although Cu could also be directly (isomorphically) incorporated as Cu2+ (Cook et al., 2009). Like Fe2+, Cd2+ is known to substitute isomorphically for Zn2+ in sphalerite (e.g., Cook et al., 2009; Ye et al., 2011). Therefore, its distribution pattern in the early growth stage of sphal_1, which parallels that of Ag, Cu and Sb (Fig. 4 and Fig. 9), could indicate that the zoning in the investigated sphalerite relates primarily to pulses in trace-element concentration in the growing fluid.
45The similarity between the distribution patterns of Tl and Ag/Sb in galena would suggest Tl+ / Ag+ + Sb3+ ↔ 2 Pb2+ as coupled substitution mechanism (George et al., 2015). For sphalerite, Cook et al. (2009) noted that sulfosalt inclusions rather than substitution best explain the presence of thallium except maybe in the Tres Marias stratabound deposit mentioned earlier. In our case, thallium is strongly associated with arsenic, germanium and iron in sphal_2, which makes it difficult to discuss substitution mechanisms (such as Tl+ + As3+ ↔ 2 Zn2+?) based on our limited dataset and because the relationship between Ge and Fe is also unclear (see below).
46It is remarkable that in sphal_1, the distribution patterns of Ge and Fe are very similar and antinomic to that of Cd, Cu, Sb and Ag. A germanium–iron correlation was observed in sphalerite from Tres Marias as a notable exception in the sample set investigated by Cook et al. (2009). However, from recent studies, it is not clear whether germanium in sphalerite is in tetravalent state and involved in a coupled substitution with divalent cations (e.g., Ge4+ + 2 Fe2+ ↔ 4 Zn2+), monovalent cations or vacancies, or in divalent state with isomorphic substitution, i.e. Ge2+ ↔ Zn2+ (Cook et al., 2009; Ye et al., 2011; Belissont et al., 2014). While the occurrence of both Ge2+ and Ge4+ has been evidenced by Bonnet et al. (2017) and Bonnet et al. (2014) in sphalerite from Tennessee, an X-ray Absorption Near Edge Structure (XANES) and Focused Ion Beam Scanning Electron Microscopy (FIB-SEM) study of the Tres Marias sphalerite would favor a tetravalent state for Ge and the introduction of vacancies for charge balancing (Cook et al., 2015). However, from these studies, the correlation between Ge and Fe that is observed in some sphalerites remains obscure, especially since this correlation is not the same between Belgian and Tres Marias deposits (Goffin et al., 2015).
47Finally, although the presence of detectable gallium is not confirmed yet, it could be corroborated by the similarity of its distribution pattern to that of Cu and Ag, which could relate to the coupled substitution mechanism Ag+ / Cu+ + Ga3+ ↔ 2 Zn2+ (Cook et al., 2009; Cugerone et al., 2021).
7. Concluding remarks and perspectives
48Using geochemical mapping with LIBS, our study provides for the first time the compositional heterogeneity of a Belgian Zn-Pb ore at hand sample scale. Our measurements reveal the distribution of minor and trace elements, including elements of interest for beneficiation (Ge, Ag and possibly Ga) and remediation problems (especially As and Tl). Although this preliminary study was limited to only one sample, mainly for evaluating the application of LIBS to this particular type of ore, a wealth of information was already collected.
49The effective detection of germanium (and possibly gallium) with our LIBS system opens interesting perspectives in using handheld systems for direct evaluation of this(these) element(s) on the field together with establishing geochemical signatures or analyzing core samples in their storage facility. However, due to the limitation of the CCD detector, our LIBS system could not be gated and hence optimized for detecting these elements or for application to sulfide minerals in general. Therefore, it is possible that better detection performances could be achieved depending on the LIBS configuration and the settings used.
50Although peak overlap was not a critical issue as it only hampered the detection of gallium, the situation could be different in Fe-rich minerals such as pyrite/marcasite, hematite, etc., for which processing and analysis of LIBS spectra are expected to be more complex.
51A more effective analytical plan can now be drawn up based on LIBS images, which reveal compositional and textural heterogeneities and delineate regions of special interest for further investigation, such as the arseniferous galena (gal_2) and the Fe-Ge-Tl-As-rich sphalerite layer in sphal_2. Additional samples from other localities in east Belgium are being analyzed in the framework of the LIBS-SCReeN project in order to check whether or not there is a consistent mineralogical and/or geochemical sequence at the regional scale, which could give insights into ore-forming processes in east-Belgium Zn-Pb district.
8. Acknowledgements
52The LIBS system was partly funded by the regional-EU Feder grant (IMAWA-Matsub project) and by two Belgian Federal Science Policy Office (BELSPO) grants related to the Brain.be and BRAIN.be 2.0 funding programs (Coldcase and LIBS-SCReeN projects). Cécile Fabre and Vincent Motto-Ros are warmly thanked for the thorough review and improvements they brought to the manuscript.
9. References
53Belissont, R., Boiron, M.C., Luais, B. & Cathelineau, M., 2014. LA-ICP-MS analyses of minor and trace elements and bulk Ge isotopes in zoned Ge-rich sphalerites from the Noailhac – Saint-Salvy deposit (France): Insights into incorporation mechanisms and ore deposition processes. Geochimica et Cosmochimica Acta, 126, 518–540. https://doi.org/10.1016/j.gca.2013.10.052
54Bonnet, J., Mösser-Ruck, R., Cauzid, J., Bailly, L. & André, A., 2014. Crystallographic control of trace element (Cu-Ga-Ge-Fe-Cd) distribution in MVT sphalerites, Tennessee, USA. In Deshenthree, C. et al. (eds), Proceedings of the 21st IMA Meeting, Johannesburg, South Africa, 1–5 Sep 2014, p. 129.
55Bonnet, J., Cauzid, J., Testemale, D., Kieffer, I., Proux, O., Lecomte, A. & Bailly, L., 2017. Characterization of germanium speciation in sphalerite (ZnS) from Central and Eastern Tennessee, USA, by X-ray absorption spectroscopy. Minerals, 7/5, 79. https://doi.org/10.3390/min7050079
56Clark, A.H., 1970. Arsenian sphalerite from Mina Alcaran, Pampa Larga, Copiapo, Chile. American Mineralogist, 55, 1794–1797.
57Cook, N.J., Ciobanu, C.L., Pring, A., Skinner, W., Shimizu, M., Danyushevsky, L., Saini-Eidukat, B. & Melcher, F., 2009. Trace and minor elements in sphalerite: a LA-ICPMS study. Geochimica et Cosmochimica Acta, 73, 4761–4791. https://doi.org/10.1016/j.gca.2009.05.045
58Cook, N.J., Etschmann, B., Ciobanu, C.L., Geraki, K., Howard D.L., Williams, T., Rae, N., Pring, A., Chen, G., Johannessen, B. & Brugger, J., 2015. Distribution and substitution mechanism of Ge in a Ge-(Fe)-bearing sphalerite. Minerals, 5, 117–132. https://doi.org/10.3390/min5020117
59Cremers, D.A. & Radziemski, L.J., 2006. Handbook of Laser-Induced Breakdown Spectroscopy. John Wiley & sons, Chichester, 313 p.
60Cugerone, A., Cenki-Tok, B., Oliot, E., Muñoz, M., Barou, F., Motto-Ros V. & Le Goff, E. 2020. Redistribution of germanium during dynamic recrystallization of sphalerite. Geology, 48, 236–241. https://doi.org/10.1130/G46791.1
61Cugerone, A., Cenki-Tok, B., Munoz, M., Kouzmanov, K., Oliot, E., Motto-Ros, V. & Le Goff, E., 2021. Behavior of critical metals in metamorphosed Pb-Zn ore deposits: example from the Pyrenean Axial Zone. Mineralium Deposita, 56, 685–705. https://doi.org/10.1007/s00126-020-01000-9
62Dejonghe, L., 1990. Présence de gersdorffite et de nickeline dans le filon plombo-zincifère de Bleiberg (Belgique). Bulletin de la Société belge de Géologie, 99, 1, 93–96.
63Dejonghe, L., 1998. Zinc-lead deposits of Belgium. Ore Geology Reviews, 12, 329–354. https://doi.org/10.1016/S0169-1368(98)00007-9
64Dejonghe, L. & Ladeuze, F., 1994. Schmalgraf: un gisement plombo-zincifère dans le calcaire carbonifère de l’Est de la Belgique. Bulletin de la Société belge de Géologie, 103/1-2, 135–147.
65Dejonghe, L. & Boni, M., 2004. The “Calamine-type” zinc-lead deposits in Belgium and West Germany: a product of Mesozoic paleoweathering processes. Geologica Belgica, 8/3, 3–14.
66Díaz, D., Hahn, D.W. & Molina, A., 2017. Quantification of gold and silver in minerals by laser-induced breakdown spectroscopy. Spectrochimica Acta Part B: Atomic Spectroscopy, 136, 106–115. https://doi.org/10.1016/j.sab.2017.08.008
67Duchesne, J.C., Rouhart, A., Schoumacher, C. & Dillen, H., 1983. Thallium, nickel, cobalt and other trace elements in iron sulfides from Belgian lead-zinc vein deposits. Mineralium Deposita, 18, 303–313. https://doi.org/10.1007/BF00206481
68EC, 2017, Communication from the Commission to the European Parliament, the Council, the European economic and social committee and the Committee of the Regions on the 2017 list of Critical Raw Materials for the EU. European Commission, COM/2017/0490 final. https://eur-lex.europa.eu/legal-content/EN/TXT/?uri=CELEX:52017DC0490
69El Haddad, J., de Lima Filho, E.S, Vanier, F., Harhira, A., Padioleau, C., Sabsabi, M., Wilkie, G. & Blouin A., 2019. Multiphase mineral identification and quantification by laser-induced breakdown spectroscopy. Minerals Engineering, 134, 281–290. https://doi.org/10.1016/j.mineng.2019.02.025
70Evrard, P., 1945. Minor elements in sphalerites from Belgium. Economic Geology, 40, 568–574. https://doi.org/10.2113/gsecongeo.40.8.568
71Fabre, C., 2020. Advances in Laser-Induced Breakdown Spectroscopy analysis for geology: A critical review. Spectrochimica Acta Part B: Atomic Spectroscopy, 166, 105799. https://doi.org/10.1016/j.sab.2020.105799
72Fabre, C., Devismes, D., Moncayo, S., Pelascini, F., Trichard, F., Lecomte, A., Bousquet, B., Cauzid, J. & Motto-Ros, V., 2018. Elemental imaging by laser-induced breakdown spectroscopy for the geological characterization of minerals. Journal of Analytical Atomic Spectrometry, 33, 1345–1353. https://doi.org/10.1039/C8JA00048D
73George, L., Cook, N.J., Ciobanu, C.L. & Wade, B.P., 2015. Trace and minor elements in galena: A reconnaissance LA-ICP-MS study. American Mineralogist, 100, 548–569. https://doi.org/10.2138/am-2015-4862
74Goffin V., Evrard, M. & Pirard, E., 2015. Critical metals in sphalerites from Belgian MVT deposits. In Proceedings of the 13th SGA Biennial Meeting, Nancy, France, 24-27 August 2015, 741–744.
75Harmon, R.S., Lawley, C.J., Watts, J., Harraden, C.L., Somers, A.M. & Hark, R.R., 2019. Laser-Induced Breakdown Spectroscopy—An emerging analytical tool for mineral exploration. Minerals, 9, 718. https://doi.org/10.3390/min9120718
76Jolivet, L., Leprince, M., Moncayo, S., Sorbier, L., Lienemann, C.P. & Motto-Ros, V., 2019. Review of recent advances and applications of LIBS-base imaging. Spectrochimica Acta Part B: Atomic Spectroscopy, 151, 41–53. https://doi.org/10.1016/j.sab.2018.11.008
77Kramida, A., Ralchenko, Yu., Reader, J., and NIST ASD Team, 2019. NIST Atomic Spectra Database (ver. 5.7.1). National Institute of Standards and Technology, Gaithersburg, MD. https://doi.org/10.18434/T4W30F
78Menges, F. 2020. Spectragryph: optical spectroscopy software, version 1.2.15. https://www.effemm2.de/spectragryph/, accessed 12/20/2020.
79Menut, D., Fichet, P., Lacour, J.L., Rivoallan, A. & Mauchien, P., 2003. Micro-laser-induced breakdown spectroscopy technique: a powerful method for performing quantitative surface mapping on conductive and nonconductive samples. Applied Optics, 42/30, 6063–6071. https://doi.org/10.1364/AO.42.006063
80Nikonow, W., Rammlmair, D., Meima, J.A. & Schodlok, M.C., 2019. Advanced mineral characterization and petrographic analysis by μ-EDXRF, LIBS, HSI and hyperspectral data merging. Mineralogy and Petrology, 113, 417–431. https://doi.org/10.1007/s00710-019-00657-z
81Novotny, K., Kaiser, J., Galiova, M., Konecna, V., Novotny, J., Malina, R., Liska, M., Kanucky, V. & Otruba, V., 2008. Mapping of different structures on large area of granite sample using laser-induced ablation based analytical techniques, an exploratory study. Spectrochimica Acta Part B: Atomic Spectroscopy, 63, 1139–1144. https://doi.org/10.1016/j.sab.2008.06.011
82Paradis, S., Hannigan, P. & Dewing, K., 2007. Mississippi Valley-type lead-zinc deposits (MVT). In Goodfellow, W.D. (ed.), Mineral Deposits of Canada: A Synthesis of Major Deposit-Types, District Metallogeny, the Evolution of Geological Provinces, and Exploration Methods. Geological Association of Canada, Mineral Deposits Division, Special Publication, 5, 185–203.
83Pfaff, K., Koenig, A., Wenzel, T., Ridley, I., Hildebrandt, L.H., Leach, D.L. & Markl, G., 2011. Trace and minor elements variations and sulfur isotopes in crystalline and colloform ZnS: Incorporation mechanisms and implications for their genesis. Chemical Geology, 286, 118–134. https://doi.org/10.1016/j.chemgeo.2011.04.018
84Pořízka, P., Demidov, A., Kaiser, J., Keivaniand, J., Gornushkin, I., Panne, U. & Riedel, J., 2014. Laser-induced breakdown spectroscopy for in situ qualitative and quantitative analysis of mineral ores. Spectrochimica Acta Part B: Atomic Spectroscopy, 101, 155–163. https://doi.org/10.1016/j.sab.2014.08.027
85Rifai, K., Doucet, F., Özcan, L. & Vidal, F., 2018. LIBS core imaging at kHz speed: Paving the way for real-time geochemical applications. Spectrochimica Acta Part B: Atomic Spectroscopy, 150, 43–48. https://doi.org/10.1016/j.sab.2018.10.007
86Rifai, K., Özcan, L., Doucet, F. & Vidal, F., 2020. Quantification of copper, nickel and other elements in copper-nickel ore samples using laser-induced breakdown spectroscopy. Spectrochimica Acta Part B: Atomic Spectroscopy, 165, 105766, https://doi.org/10.1016/j.sab.2020.105766
87Rueden, C.T., Schindelin, J., Hiner, M.C., DeZonia, B.E., Walter, A.E., Arena, E.T. & Eliceiri, K.W., 2017. ImageJ2: ImageJ for the next generation of scientific image data. BMC Bioinformatics, 18, 529. https://doi.org/10.1186/s12859-017-1934-z
88Saini-Eidukat, B., Melcher, F. & Lodziak, J., 2009. Zinc-germanium ores of the Tres Marias Mine, Chihuahua, Mexico. Mineralium Deposita, 44, 363–370. https://doi.org/10.1007/s00126-008-0222-2
89Senesi, G.S., 2014. Laser-Induced Breakdown Spectroscopy (LIBS) applied to terrestrial and extraterrestrial analogue geomaterials with emphasis to minerals and rocks. Earth-Science Reviews, 139, 231–267. https://doi.org/10.1016/j.earscirev.2014.09.008
90Ye, L., Cook, N.J., Ciobanu, C.L., Yuping, L., Qian, Z., Tiegeng, L., Wei, G., Yulong, Y. & Danyushevskiy, L., 2011. Trace and minor elements in sphalerite from base metal deposits in South China: A LA-ICPMS study. Ore Geology Reviews, 39, 4, 188–217. https://doi.org/10.1016/j.oregeorev.2011.03.001
91Manuscript received 31.08.2020, accepted in revised form 25.05.2021, available online 08.11.2021.
