


- Home
- Volume 24 (2021)
- number 3-4
- Characterization by Cone Penetration Tests of the decalcified Zandvliet Sand (Lillo Formation, North Belgium)


View(s): 4323 (25 ULiège)
Download(s): 1933 (21 ULiège)

Characterization by Cone Penetration Tests of the decalcified Zandvliet Sand (Lillo Formation, North Belgium)

Abstract
The sandy Zandvliet Member represents a particular, decalcified facies in the top of the Pliocene Lillo Formation in northern Belgium. Based on the correlation with nearby boreholes at the type locality of the Zandvliet Member, we were able to characterize this unit on Cone Penetration Tests. Compared to the underlying Merksem Member, the Zandvliet Member generally shows markedly lower cone resistance values. Since besides the decalcification, the Zandvliet Member is lithologically nearly identical to the underlying Merksem Member, the lower cone resistance values in the Zandvliet Member compared to the Merksem Member can only be the result of the decalcification of the Zandvliet Member. Indeed, the partly decalcified top of the Merksem Member also gives similar cone resistance values as the Zandvliet Member. Decalcification of the Eocene Brussel Sand in central Belgium is also known to have resulted in lower cone resistance values.
Our Cone Penetration Test interpretations show that the thickness of the Zandvliet Member strongly varies across short distances (>10 m across 1 km). As the Zandvliet Member thickens, the underlying Merksem Member thins and vice versa. This trend is not in line with that of the under- and overlying strata, i.e. intraformational, nor with the depositional environment of these units. The thickness changes of the Zandvliet Member therefore purely reflect changes in depth of the post-depositional decalcification into the original shell-bearing sand (i.e. original Merksem Member). This confirms the existing hypothesis that the Zandvliet Member actually represents the decalcified part of the Merksem Member. The anomalous heavy mineralogy of the Zandvliet Member compared to the other members of the Lillo Formation cannot be readily explained by the acid chemical weathering which caused the decalcification. This may rather be related to a change in the primary heavy mineral signal of the upper part of the Merksem Member and equivalent Zandvliet Member compared to the underlying sequences of the Lillo Formation.
The reason for the post-depositional decalcification could be similar to the Pleistocene changes in soil acidity invoked for decalcification of time-equivalent Red Crag sand in England.
Table of content
1. Introduction
1The shelly and generally sandy Lillo Formation was deposited along the southern margin of the North Sea Basin during the Pliocene (Fig. 1A, B). The Zandvliet Member is a particular unit at the top of the Lillo Formation (Fig. 2). Lithologically it is very similar to the underlying Merksem Member, as they are both composed of fine, glauconite-bearing sand. Contrary to the latter, however, the Zandvliet Member is lacking carbonate or shells. The Zandvliet Member is therefore often considered informally as the decalcified Merksem Member (Louwye et al., 2020). The geographic occurrence of the Zandvliet Member is only known in the northern part of the Port of Antwerp (northern Belgium), where it was defined at the Zandvliet Lock (De Meuter & Laga, 1976; Fig. 1C). As the result of this limited geographic extent, with hardly any outcrops besides the Zandvliet Lock and few boreholes in the surroundings, it remained the least known and studied member of the Lillo Formation. It was consequently, contrary to other members of the Lillo Formation, not mapped or modelled as a separate unit in subsurface models, but included in the Merksem Member (Jacobs et al., 2010; Deckers et al., 2019).
2However, many Cone Penetration Tests (CPTs) exist in the area for geotechnical reconnaissance in the Port of Antwerp. These CPTs significantly extend the data set characterizing the Zandvliet Member. Deckers et al. (2020) have furthermore shown that CPTs allow the distinction of the several geotechnical units within the Lillo Formation in the Port of Antwerp area, some of which also represent formal lithostratigraphic units. They selected CPTs near the type sections of the Lillo Formation in the central Port of Antwerp area, excluding the type section for the Zandvliet Member at the Zandvliet Lock in the northern Port of Antwerp area. It is the purpose of this study to extend the use of CPTs to study the Zandvliet Member at and around its type sections and its relationship with the other members of the Lillo Formation. Borehole and CPT data were extracted from the Databank Ondergrond Vlaanderen (DOV) and Geological Survey of Belgium (GSB) databases.
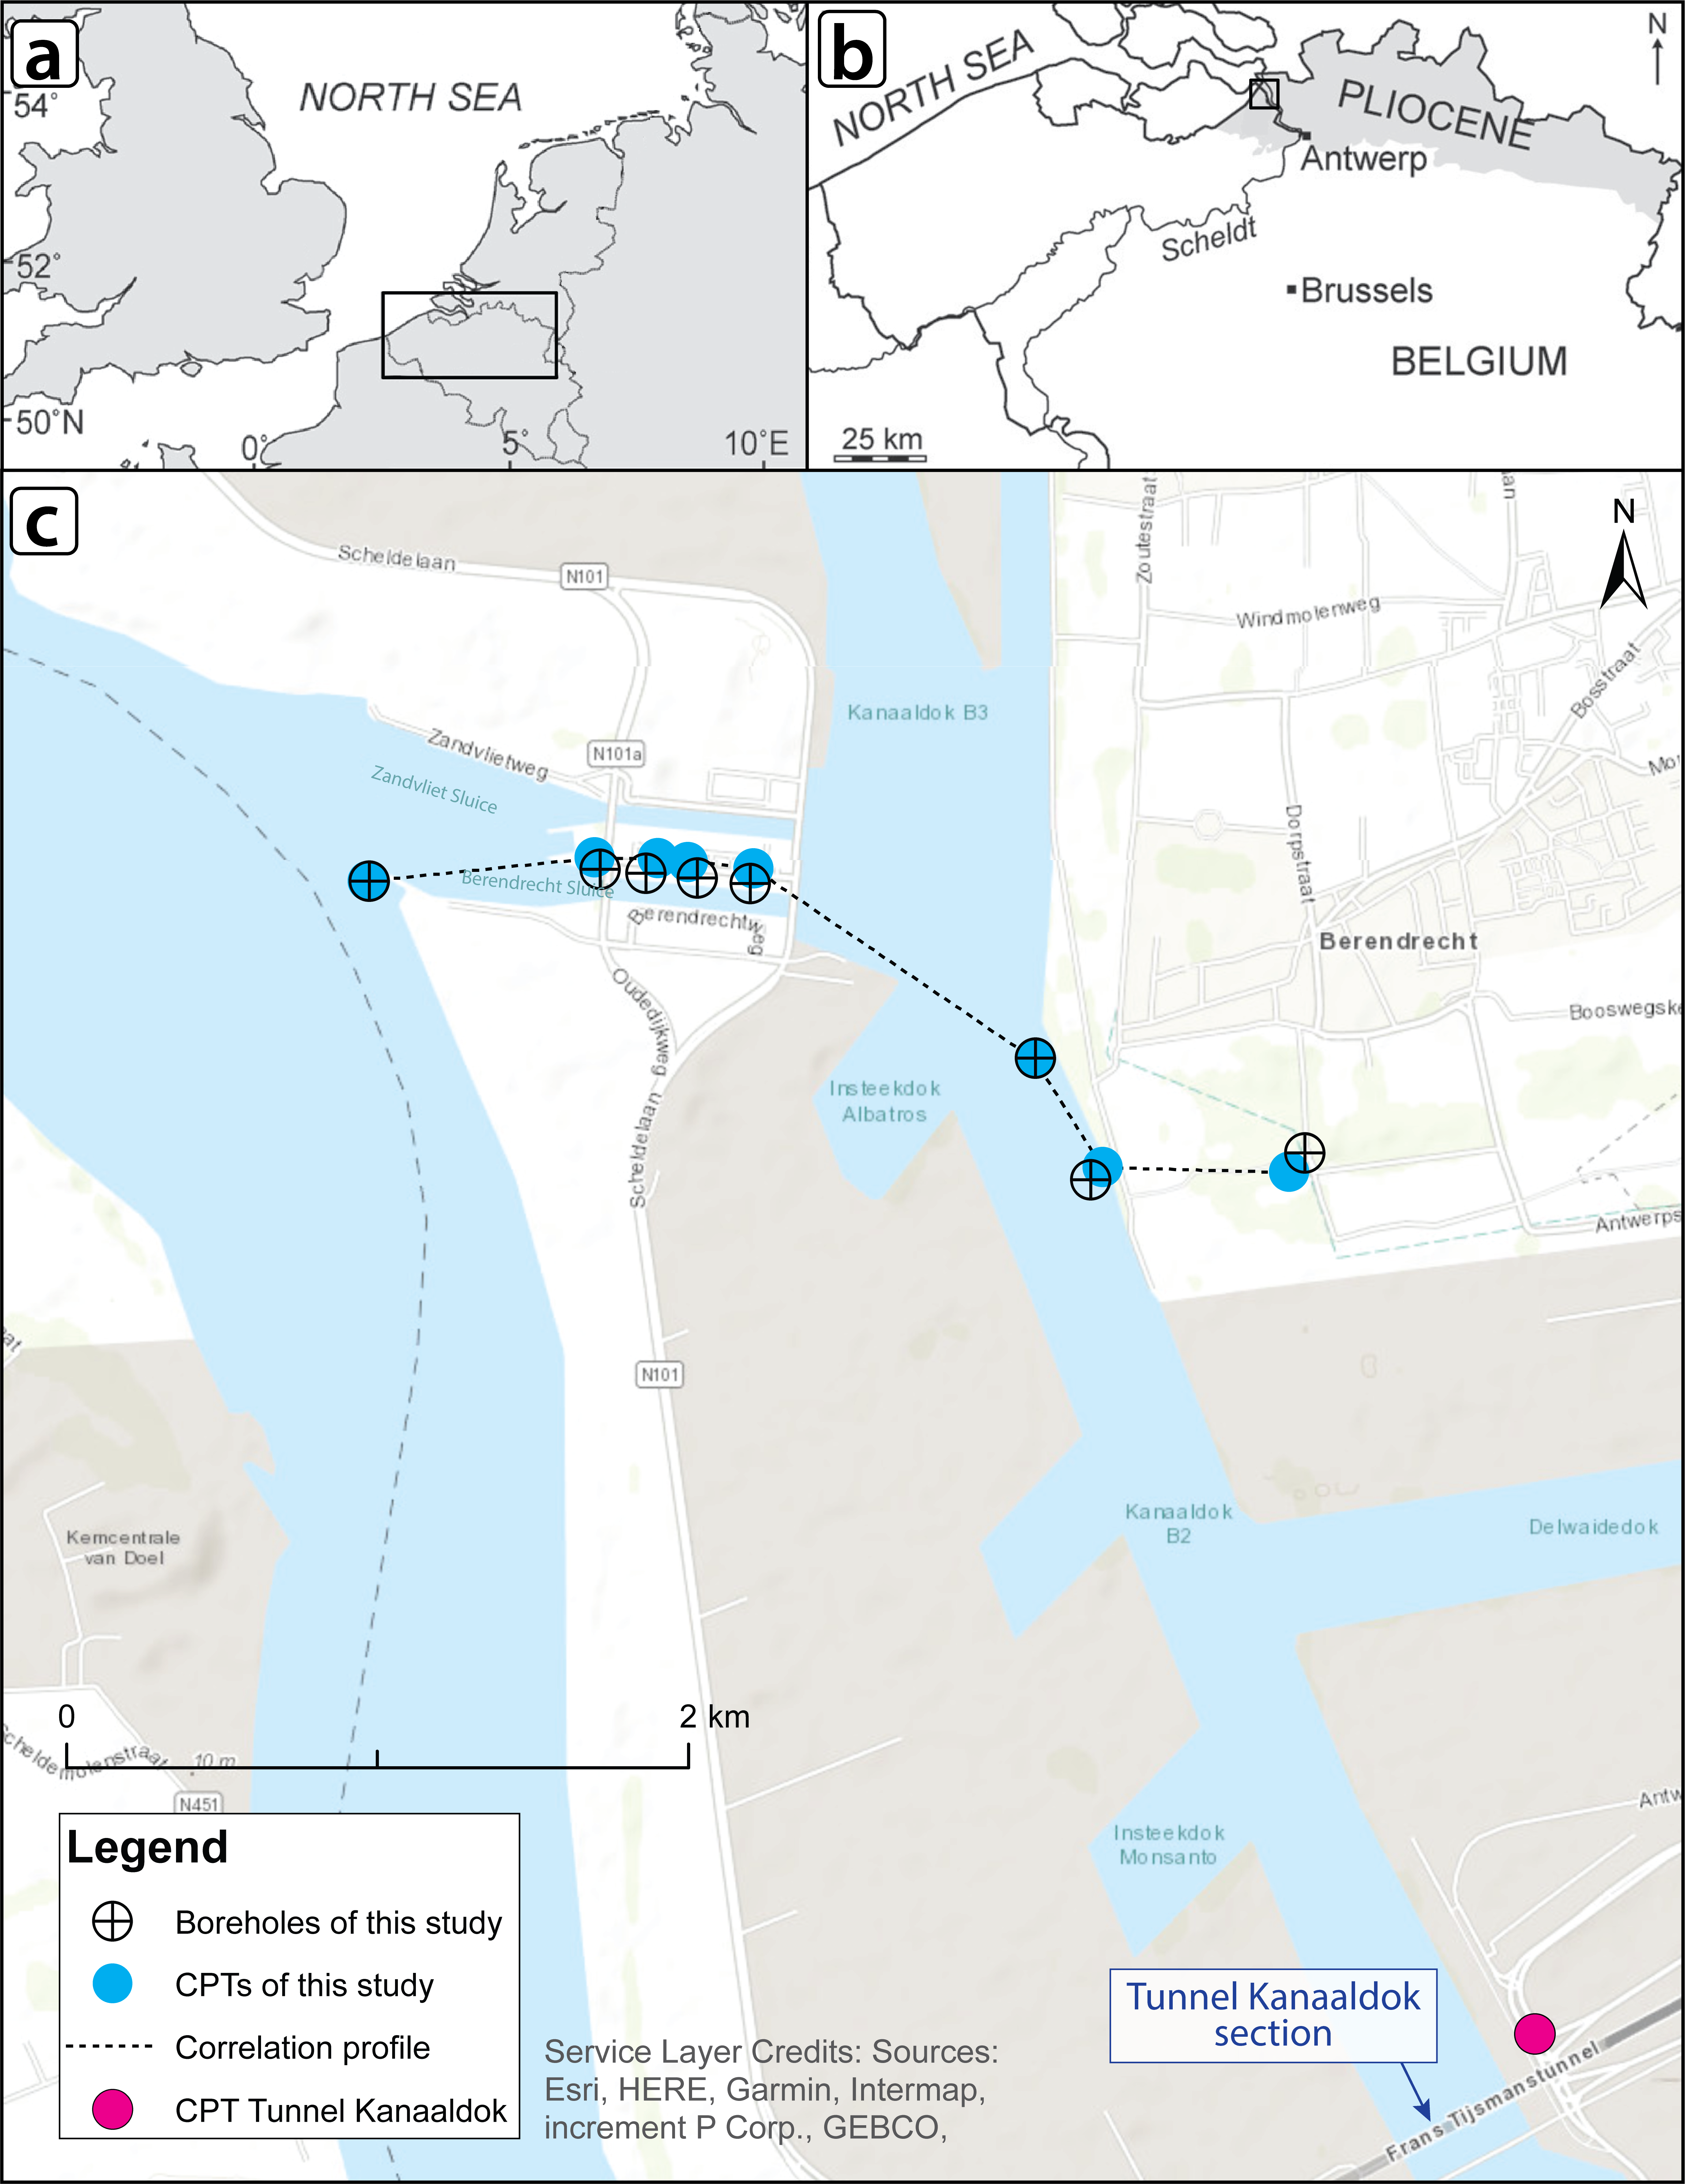
Figure 1. A) Northern Belgium (rectangle) at the southern margin of the North Sea Basin; B) Distribution of marine Pliocene deposits (shaded in gray) and the location of the study area (square) in northern Belgium; C) Study area with the locations of the CPT and stratotype section of the Lillo Formation at the Tunnel Kanaaldok section (Fig. 3) and the CPTs and boreholes as shown on Figures 5 to 7 of this study. Sections A and B from Deckers et al. (2020) based on De Schepper et al. (2009).
2. The stratigraphic position and characteristics of the Merksem and Zandvliet Members
3De Meuter & Laga (1976) formally defined the Lillo Formation as a gray, gray-brown and light gray-brown shelly sand. It is clayey in the lower part with several shell layers, whereas in the upper part the clay content and the thick shell layers gradually decrease. In the uppermost parts, shells gradually disappear. The type section of the Lillo Formation was visible in a temporary outcrop during the digging of the Tunnel Kanaaldok, later called the Tijsmanstunnel (DOV BGD015W0304; Fig. 1C). The formation is further subdivided, from base to top, into the Luchtbal Member, the Oorderen Member, the Kruisschans Member, the Merksem Member and the Zandvliet Member (Fig. 2). In the area around the Scheldt River, the Lillo Formation is unconformably overlain either by Pleistocene sand or Holocene peat layers.
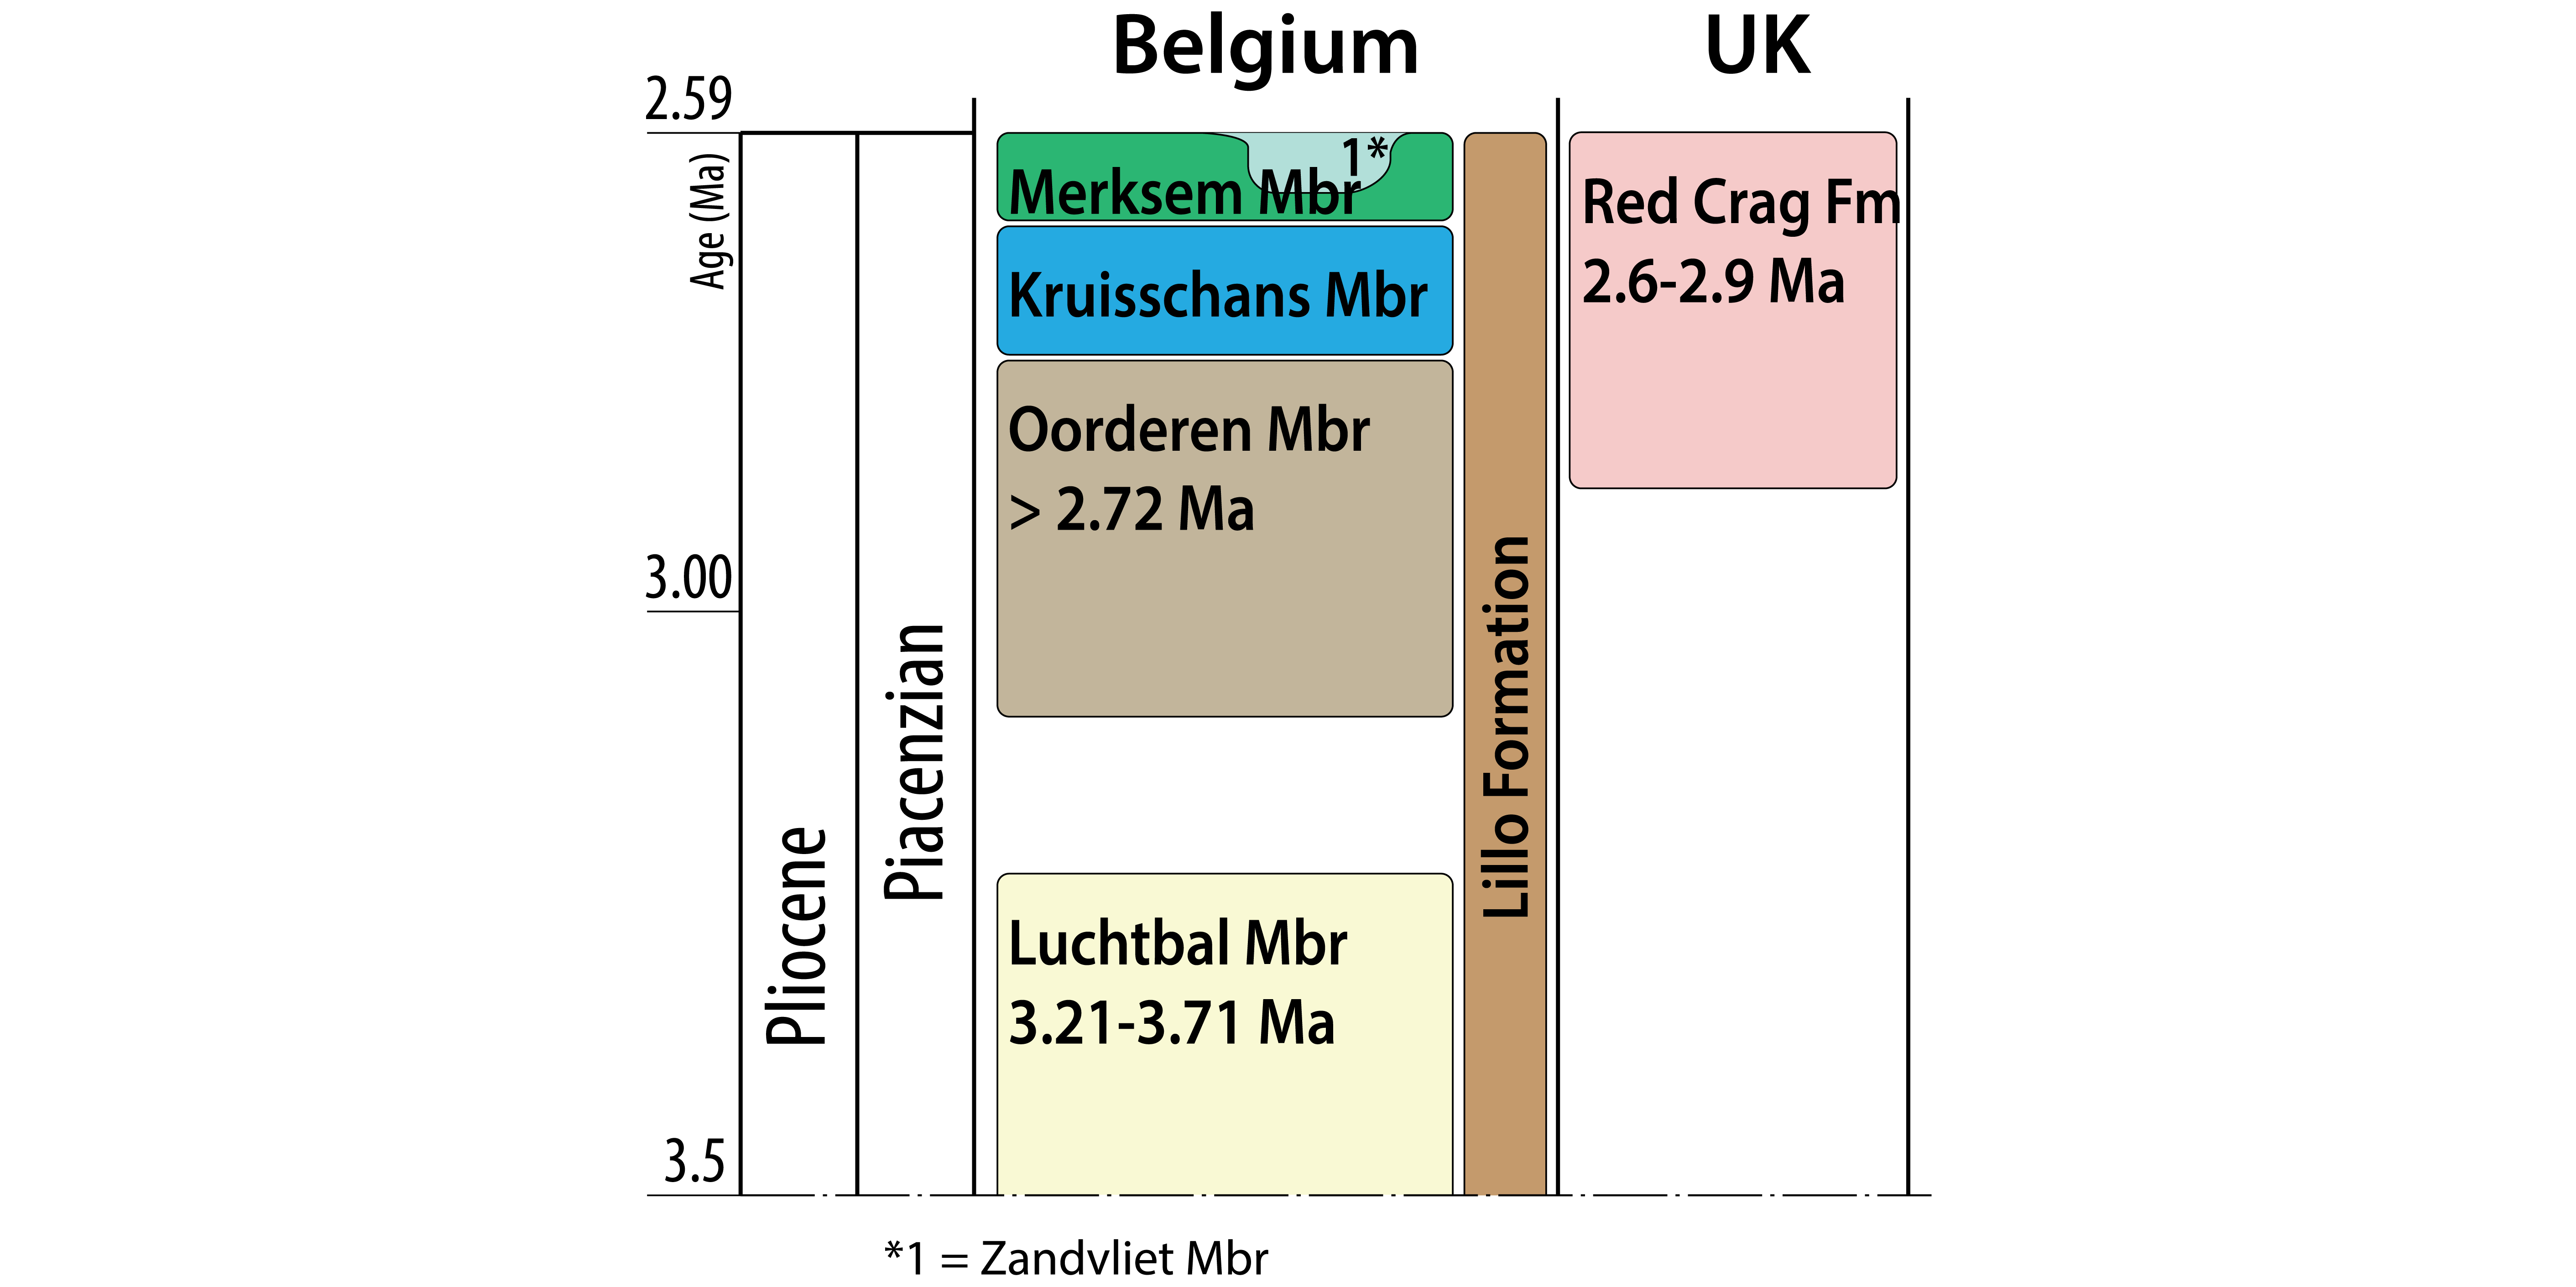
Figure 2. Stratigraphic framework of upper Pliocene units in the study area (Belgium) and the UK. This figure was modified after Vervoenen et al. (2014) and Wesselingh et al. (2020).
4The Merksem and Zandvliet Members in the top of the Lillo Formation were introduced as members by De Meuter & Laga (1976). The Merksem Member is described as fine-grained (sometimes coarse), gray-yellow, loose glauconiferous sand, fairly homogeneous, fossiliferous with frequent mollusks and with sandstone and sideritic concretions. Laga (1972) identified two subunits within the Merksem Member without a distinct boundary: a lower subunit B4 with oblique and cross-bedded sand which is sometimes separated by thin, laterally continuous clay layers, indicative for a high-energy depositional environment, and an upper subunit B5 with horizontal to slightly oblique stratification and only rare clay layers or nodules, and a return towards higher numbers of foraminifera and bioturbation, which are indicative for a lower energetic depositional environment (Fig. 3). In the Tunnel Kanaaldok section, the Merksem Member shows glauconite contents of around 10% (Laga, 1972).
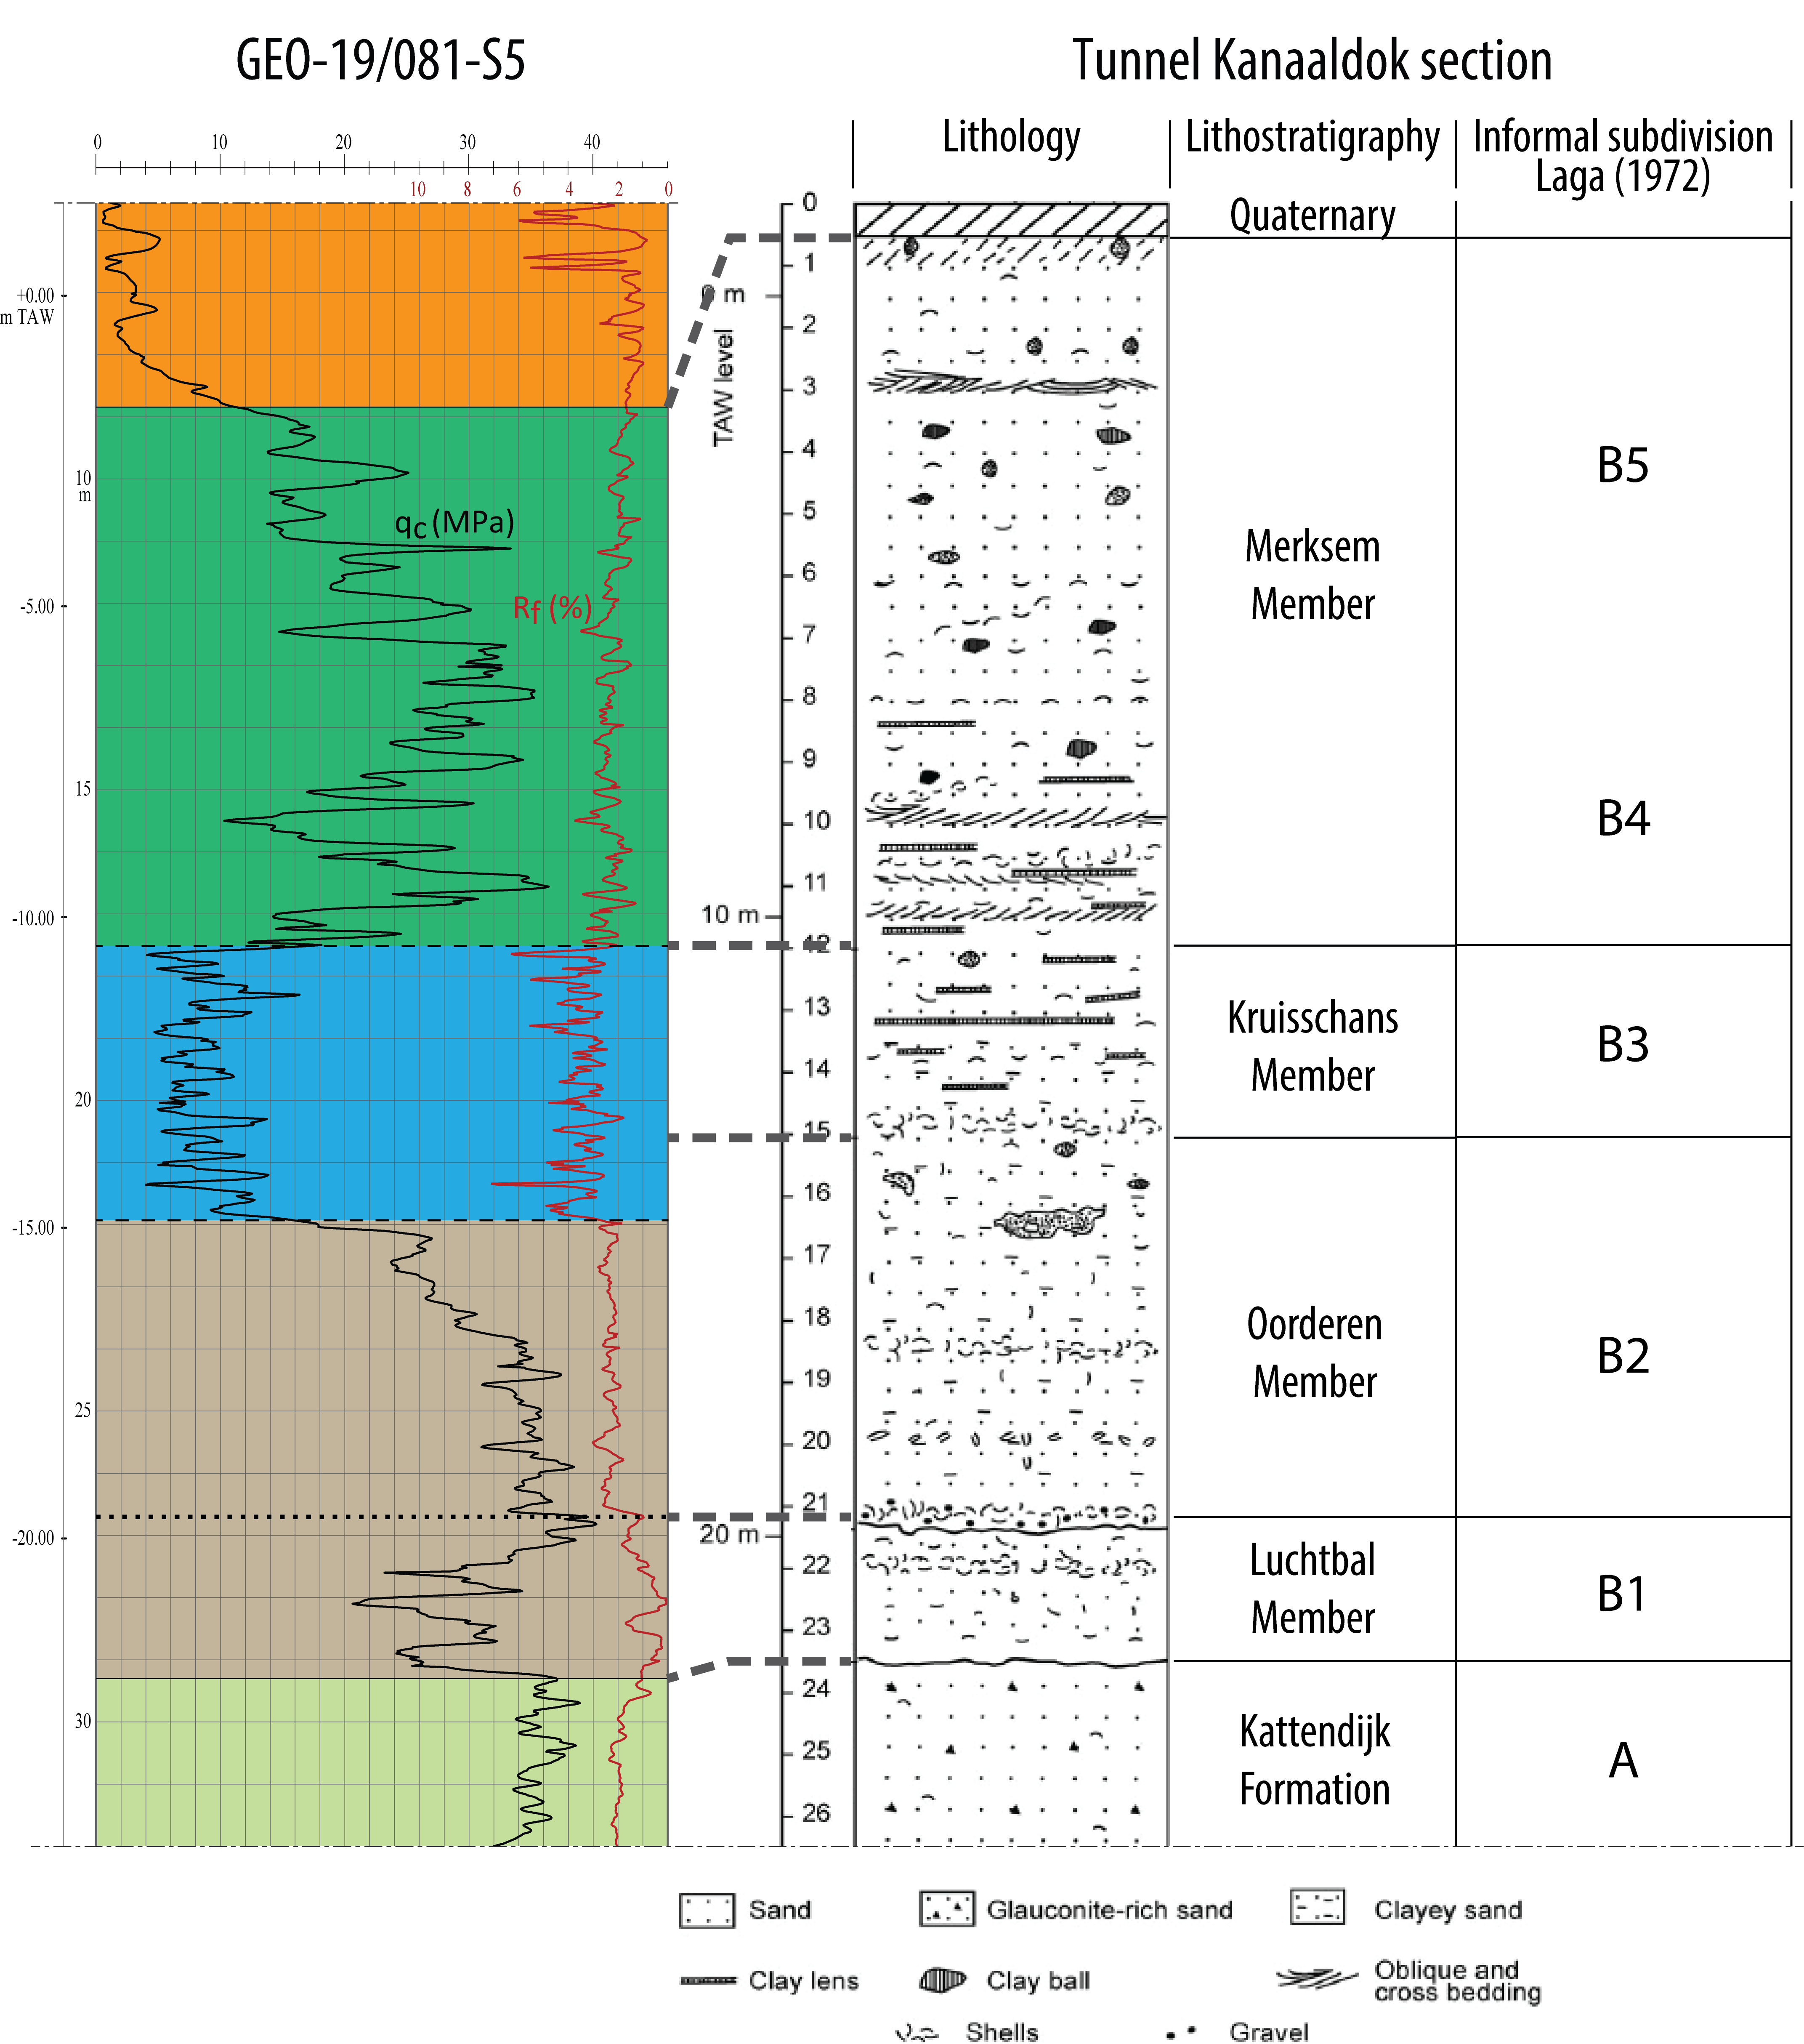
Figure 3. Correlations between a CPT (GEO-19/081-S5) and the stratotype section of the Lillo Formation at the Tunnel Kanaaldok temporary outcrop (DOV BGD015W0304) after Deckers et al. (2020). The lithological drawing was based on De Schepper et al. (2009). The colors of the CPT units are consistent with those of this study. For the location of this outcrop and the CPT, see Figure 1C.
5The Zandvliet Member is described as a fine-grained, slightly clayey and glauconitic sand, horizontally stratified with siderite concretions. The Zandvliet Member lacks carbonate or shells. De Meuter & Laga (1976) noted that the boundary between the Merksem and Zandvliet Members is transitional rather than a sharp level, preventing a precise definition of the boundary: the Zandvliet Member is sometimes considered informally as the decalcified upper part of the Merksem Member (Louwye et al., 2020). Indeed, besides the presence of carbonate or shells, no major differences can be noted between both members.
6The type locality of the Zandvliet Member is the village Zandvliet, located north of Antwerp. The type section is in a temporary outcrop for the construction of the Zandvliet Lock (see Fig. 1C for location). For the construction of the second Zandvliet Lock, four closely spaced boreholes were drilled and lithostratigraphically interpreted by Piet Laga (GSB 014E0153, 014E0154, 014E0155, 014E0156; DOV GEO-79/205-A, GEO-79/205-B, GEO-79/205-C, GEO-79/205-D). These boreholes can be considered as the type section for the Zandvliet Member (Louwye et al., 2020).
7The type locality of the Merksem Member is the village Merksem near Antwerp. In the type section in the Tunnel Kanaaldok section, the Merksem Member lies between 12 m and 3 m depth (Fig. 3). In the latter section, the Zandvliet Member is absent, and the Merksem Member forms the top of the Lillo Formation. When both members are present, the Zandvliet Member always overlies the Merksem Member. The age of the Merksem Member was estimated to be late Pliocene based on dinocyst analyses on samples at the Tunnel Kanaaldok section by De Schepper et al. (2009; Fig. 2). For the Zandvliet Member, no direct age information is available. However, the traditional linking of the Zandvliet Member to the Merksem Member indirectly attributes also a top Pliocene age to the Zandvliet Member.
8Data on heavy mineral composition for the different members of the Lillo Formation are available from Geets & De Breuck (1991). These data are based on samples taken from the Antwerp harbor area for the Oorderen, Kruisschans and Merksem Members, two samples of the town of Merksem for the Merksem Member, and five samples of the town of Zandvliet for the Zandvliet Member. Exact locations and depths are not available in Geets & De Breuck (1991). Based on these data, there is no significant change throughout the Lillo Formation in the content of tourmaline (8 to 14% on average per member), staurolite (2 to 5% on average per member), Al2SiO5 polymorphs (mainly kyanite and andalusite; 3 to 5% on average per member) or epidote (7 to 12% on average per member) (Fig. 4). However, a significant change is observed in the number of ultrastable minerals (zircon and rutile) which are the most important components in the lower three members of the Lillo Formation (34 to 48% on average per member) and drop strongly in the Zandvliet Member (13% on average). Along with this drop in ultrastable minerals, there is also a less outspoken drop in the garnet content, from 18 to 19% in the lower three members down to 10% in the Zandvliet Member (Fig. 4). The drop in ultrastable minerals and garnet is compensated by a very sharp increase in the number of inosilicates (mainly hornblende) from 8 to 15% on average in the lower three members to 45% in the Zandvliet Member (Fig. 4). Notable as well is the significant drop in the number of opaque minerals in the Zandvliet Member compared to the other members of the Lillo Formation (Geets & De Breuck, 1991).
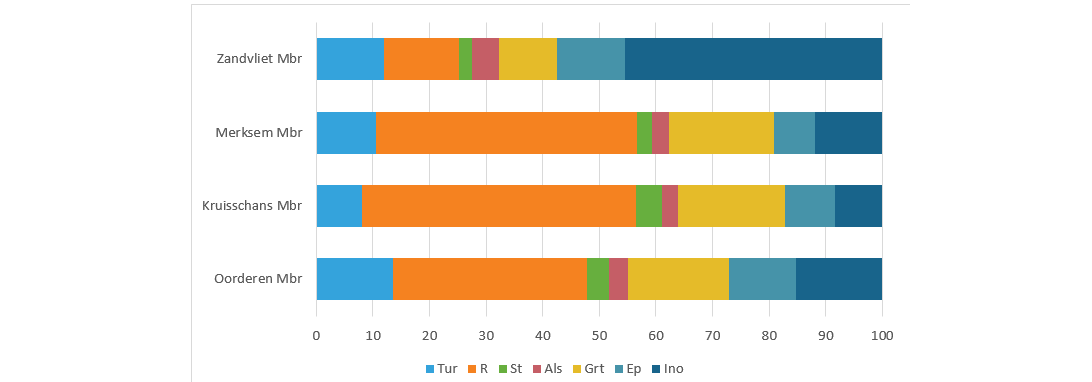
Figure 4. Average heavy mineral composition of the members of the Lillo Formation based on data published by Geets & De Breuck (1991). No data for the Luchtbal Member are available. Averages are based on 12 samples for the Oorderen Member (Mbr), eight samples for the Kruisschans Member, 14 samples for the Merksem Member and five samples for the Zandvliet Member. Tur = Tourmaline, R = rest group including ultrastable minerals (zircon and rutile) and accessory minerals, St = staurolite, Als = Al2SiO5 polymorphs (kyanite, andalusite and sillimanite), Grt = Garnet, Ep = Epidote, Ino = inosilicates (mainly hornblende).
3. Material and methodology
9As a starting point, boreholes were inventoried in which the Zandvliet Member was described and interpreted. The four boreholes that were part of the type section of the Zandvliet Member at the Zandvliet Lock were first selected. The samples of these boreholes have been described and interpreted by Laga (1979). We thereafter added four boreholes to the selection set, one to the west and three to the east of the type section boreholes. The borehole to the west (GSB 014E0176; DOV GEO-86/002-B1(CK1)) was described and interpreted by Laga & Utens (1986). From the three boreholes in the east of the type section, the two westernmost (GSB 014E200 and 014E0201; DOV GEO-88/134-B and GEO-88/134-C) were described and interpreted by Van Burm (1988) and the easternmost (GSB 015W0276; DOV GEO-94/073-B.C7) by Van der Sluys (1996). The correlation of the lithostratigraphically interpreted boreholes is shown in Figure 5 and is discussed in Section 4.
10Next, eight CPTs were selected that were located near the eight boreholes and were deep enough to reach the base of the Merksem Member (Fig. 1C; GEO-86/001-SI (CK1); GEO-79/202-SIII; GEO-83/033-SXXXV; GEO-79/202-SVI; GEO-79/202-SVIII; GEO-88/133-SLXXXIV; GEO-98/193-S5; GEO-94/072-SC6). Near the locations of the westernmost six selected boreholes, only mechanical CPTs are available on DOV. Only near the two easternmost boreholes, electric CPTs are present. The CPTs were put in a more or less east-west correlation profile and the CPT parameters were shown: qc (cone resistance) values of all CPTs and the Rf (friction ratio) value only for the easternmost CPTs (Fig. 6). The CPTs on this profile were subdivided into units with similar qc and Rf patterns and values and correlated in a traditional geotechnical stratigraphy, further discussed in Section 5.
11Finally, the existing lithostratigraphic interpretations of the boreholes of Figure 5 were plotted on the CPT correlation profile of Figure 6 as black, dotted lines, which resulted in Figure 7. This figure clearly allows the correlation between lithostratigraphy as established by the abovementioned authors in the boreholes with the geotechnical stratigraphy as defined by this study. This correlation is discussed in Section 6.
12For a good comparison between the depths in the boreholes and CPTs, all data were repositioned in reference to the 0 m TAW level (TAW: Belgian Ordnance Datum). Note that the selected CPTs and boreholes/outcrops are not always located at exactly the same spot, and the distance between them amounts up to 80 m, which may explain some of the small differences (less than 2 m) in depth between the boundaries on the CPTs and those described in the outcrops. All CPTs are labeled with their code in the DOV database.
4. Borehole correlation profile (Fig. 5)
13In all eight selected boreholes, the Zandvliet Member was identified below a thin cover of Quaternary strata and on top of the Merksem Member.
14The transition from the Quaternary towards the Zandvliet Member coincides with the appearance of glauconite, which characterizes the entire Lillo Formation and provides the green tint of its green-gray sand. The Zandvliet Member is very uniform in the lithological descriptions as a gray-green fine, slightly clayey, glauconite-bearing, non-calcareous sand. Sandstone nodules were described in the Zandvliet Member in boreholes 014E0153, 014E0156, 014E0200 and 015W0276. The thickness of the Zandvliet Member strongly varies across the different boreholes, from less than 5 m in the westernmost borehole to over 15 m in the boreholes further east. This thickness variation is caused by changes in the depth of the base of the Zandvliet Member, from -7 m TAW in the westernmost borehole to almost -20 m TAW in the boreholes further east.
15The description of carbonate marks the transition from the Zandvliet Member towards the Merksem Member. Generally, a few meters below the carbonate-bearing or -rich uppermost part of the Merksem Member, shells or fine shell-grid is described characterizing the entire underlying part of the Lillo Formation. Sand- and claystone fragments and siderite nodules are frequently described within the Merksem Member. As the clay content increases downwards, the Merksem Member transitions into the Kruisschans Member. The boundary between the Merksem and Kruisschans Members is gradual and therefore not easily pinpointed (De Meuter & Laga, 1976). In the correlation profile, the base of the Merksem Member fluctuates around -20 m TAW. The Kruisschans Member is between 2 and 4 m thick in the profile. As the clay content decreases downwards again, the Kruisschans Member transitions towards the Oorderen Member which forms the lower part of the correlation profile.
Figure 5. Borehole correlation profile with the lithostratigraphic units of this study. The base(s) of the Merksem and/or Kruisschans Member(s) is (were) not interpreted or reached in all boreholes. When available in the borehole reports, the descriptions of glauconite, carbonate and shells are given. The location of the boreholes in this profile is shown in Figure 1C.
5. CPT correlation profile (Fig. 6)
16Based on the qc and Rf patterns and values of the CPT in the correlation profile, we created a geotechnical stratigraphy consisting of five units, herein referred from bottom to top as A, B, C, D and E:
-
Unit A: At the basal part of the profile with consistently high qc values that gradually decrease upwards from 45 MPa towards 35 MPa. The Rf values are rather uniform around 1%. The top of this unit coincides with a sharp drop in qc values towards unit B.
-
Unit B: Interval of about 2 to 3 m thickness, consisting of low qc values. Within this interval, qc values increase upwards from 10 MPa or less at the base towards 20 MPa at the top. The top usually coincides with a strong upwards increase in qc values towards those of unit C. The Rf values of this unit are relatively high and strongly fluctuate between 2% and 3%.
-
Unit C: Interval of relatively high qc values, and stronger variation in qc values compared to unit A. Background qc values are about 25–30 MPa, additionally with spikes that can reach over 40 MPa. The Rf values decrease upwards from frequently >2% towards <2%. This unit shows strongly varying thicknesses, from a minimum of just over 2 m in the center of the profile towards more than 13 m in the west of the profile. The top of this unit coincides with a sharp decrease in qc values towards unit D.
-
Unit D: Interval with relatively low qc values. The qc values remain at a rather uniform level around 10–20 MPa, excluding local spikes to 20–30 MPa. In the easternmost CPT of the profile, the upper part of unit D is characterized by a relatively large number of spikes of >20 MPa. The Rf values are very uniform and <2%. As is the case for unit C, the thickness of unit D also shows strongly varying thicknesses. The thickness trend of unit D is, however, opposite to that of unit C: with minima of 4 m in the west and maxima of 18 m in the center of the profile. The top of this unit coincides with a sharp upwards decrease in qc values.
-
Unit E: Forms the top section of the profile, with consistently low qc values of less than 5 MPa.
Figure 6. CPT correlation profile with the geotechnical stratigraphy as defined by this study. The location of this profile is shown in Figure 1C.
6. Correlating the geotechnical stratigraphy with lithostratigraphy (Fig. 7)
17Figure 7 shows the same background as Figure 6, but with the lithostratigraphic interpretations of the nearby boreholes of Figure 5 on top as black, dashed lines. This figure thus allows the correlation of the geotechnical stratigraphy of this study (Fig. 6) with the lithostratigraphy as interpreted in the boreholes by Laga (1979), Laga & Utens (1986), Van Burm (1988) and Van der Sluys (1996; Fig. 5). Note that the CPTs and boreholes are not located at exactly the same spot, but near to each other (<100 m), which may explain some of the small differences (generally less than 2 m) in depth between the boundaries on the CPTs and those described in the boreholes:
-
CPT units A and B correlate with the Oorderen and Kruisschans Members of the Lillo Formation, respectively. This agrees with the CPT interpretations at the nearby Tunnel Kanaaldok section by Deckers et al. (2020) where the sandy Oorderen Member also shows a high plateau of qc values that drop towards low qc values for the clayey Kruisschans Member (Fig. 3). The Rf values show the opposite trend in our correlation profile as well as at the Tunnel Kanaaldok section. Contrary to the Tunnel Kanaaldok section, the lower part of the Oorderen Member as well as the Luchtbal Member are lacking in our correlation profile.
-
Unit C, which is characterized by relatively high qc values, correlates entirely with the Merksem Member. This is also in agreement with the CPT interpretations at the nearby Tunnel Kanaaldok section by Deckers et al. (2020) where the Merksem Member also shows generally high, fluctuating qc values (Fig. 3). The qc spikes probably coincide with clay- or sandstone fragments or siderite nodules that are frequently described in the Merksem Member. The Rf values are generally higher and more fluctuating at the basal part of the Merksem Member, and become lower and more uniform in the upper part. This probably reflects the upwards decrease in clay content within the Merksem Member as described for the Tunnel Kanaaldok section by Laga (1972).
-
Unit D, which is characterized by relatively low qc values, correlates entirely with the Zandvliet Member, and near boreholes 014E0154 and 014E0155 also with the upper 6 m of the Merksem Member. In the latter boreholes, unit D correlates with a calcareous interval of the Merksem Member, whereas the underlying unit C correlates to the carbonate-rich part of the Merksem Member. Near borehole 014E0156, the uppermost meter of unit D, which consists of relatively high qc values, is interpreted as belonging to the Quaternary sand. Local spikes in the qc values of >20 MPa probably represent sandstone bearing levels in the Zandvliet Member. Indeed, in borehole 015W0276, a small sandstone nodule (of 3 mm) was observed at 9–9.5 m depth, which is at the interval where plenty of qc spikes are present in the upper part of the Zandvliet Member in the nearby CPT.
-
Unit E correlates entirely with the Quaternary strata. The very low qc values in the basal part of the Quaternary are due to the presence of peat/clay layers. Locally, such as near borehole 014E0156, however, the base of the Quaternary consists of about 1 m of coarse sand with higher qc values in the top of unit D. In these cases, it becomes difficult to distinguish the qc values of the Quaternary sand from these of the older Zandvliet Member.
Figure 7. CPT correlation profile with the geotechnical stratigraphy of Figure 6 as well as the lithostratigraphy as interpreted in the nearby boreholes of Figure 5. The geotechnical stratigraphy is shown in colors, whereas the lithostratigraphy in the nearby boreholes is indicated with a black, dashed line. The boreholes that represent the type sections of the Zandvliet Member are indicated. Note the difference between the geotechnical stratigraphy and the lithostratigraphy at boreholes 014E0154 and 014E0155 in the center of the profile. The carbonate-bearing and carbonate-rich sections of the Merksem Member as described in the latter boreholes are indicated. The location of this profile is shown in Figure 1C.
7. Discussion and conclusions
18The correlations between lithostratigraphic borehole interpretations and nearby CPTs at the Zandvliet Lock in the northern Port of Antwerp allow the lithostratigraphic interpretation of five geotechnical units that were identified in this study. For the Oorderen, Kruisschans and Merksem Members of the Lillo Formation, the results of this study are in good agreement with the CPT analyses further south in the Port of Antwerp area by Deckers et al. (2020). The latter study did not include the Zandvliet Member in the top of the Lillo Formation. The results are also quite comparable with the CPT interpretations at the Berendrecht Lock on figure 3 of Goetinck et al. (1983). The latter study, however, seems to have also included higher qc values (of our CPT unit C) in the lower part of the Zandvliet Member. The results of this study on the other hand indicate that the Zandvliet Member is consistently expressed by low qc values, in the order of 10–20 MPa, with locally higher qc spikes that are probably related to dispersed sandstone concretions (Fig. 7). The carbonate-rich underlying Merksem Member then again shows generally higher qc values with background values in the order of 25–30 MPa and spikes of up to 40 MPa (Fig. 7). Borehole descriptions indicate that the Merksem and Zandvliet Members share a very similar lithology: fine-grained, glauconite-bearing sand with some sandstone nodules (De Meuter & Laga, 1976). This similarity seems confirmed by the lack of changes in Rf values across the boundary between the Merksem and Zandvliet Members on the electric, easternmost CPTs of our correlation profile (Fig. 7). The only obvious lithological difference between the two members is the lack of carbonate/shells in the Zandvliet Member, whereas the Merksem Member contains carbonate and (sometimes numerous) shells or shell-grid. This shows that the low qc values in the Zandvliet Member compared to the Merksem Member can solely be related to the absence of carbonate in the former. Indeed, on CPTs where the Merksem Member shows low qc values which are in the same order of the Zandvliet Member, the Merksem Member contains markedly less carbonate (carbonate-bearing) compared to the underlying intervals of the Merksem Member with higher qc values (carbonate-rich). The reduction of qc values due to decalcification of carbonate-rich sand is also observed elsewhere, such as, for example, for the middle Eocene Brussel Formation further south in central Belgium (Van Calster & Borry, 1991; Van der Sluys, 1996).
19Our correlation profile indicates that the depth of the base of the Zandvliet Member varies strongly in the east-west direction (Fig. 7). The bases of the subjacent Merksem Member or superjacent Quaternary strata do not share a similar trend. As no indications of erosion whatsoever occur between both members, sedimentary incision of the Zandvliet Member into the Merksem Member can be excluded. Furthermore, the sediments of both members are so similar—except for the carbonate content—that the observed irregular depositional facies thickness distribution can hardly be expected in an estuarine environment (Laga, 1972). Therefore it must be concluded that a post-depositional diagenetic decalcification occurred in an original Merksem type Sand leading to what is now identified as a carbonate-free Zandvliet Sand. For local reasons, the decalcification reached different depths explaining the depth relationships between both members. Decalcification was at some places only partial, explaining why the top of the Merksem Member sometimes has a poorer carbonate content. Partial decalcification of the top of the Merksem Member (from carbonate-rich to carbonate-bearing) resulted in a similar geotechnical facies as the completely decalcified, overlying Zandvliet Member. This study thereby validates the general perception that the Zandvliet Member represents a decalcified Merksem Member (Louwye et al., 2020).
20A similar case of decalcification of the upper Pliocene shelly sand occurred in England, where the Red Crag shelly sand, which is lateral equivalent to the Merksem Member (Fig. 2), was locally decalcified (Kendall & Clegg, 2000). The latter authors associated the decalcification of the Red Crag sand to post-depositional processes, invoking the evolution of Pleistocene permafrost: when climatic conditions improved and the top of the permafrost ice in the soil shifted downwards, boreal forest replaced tundra with the development of highly acidic podzolic soils; consequently, the underlying calcareous shelly sediment could dissolve. The lower boundary of decalcification of the Red Crag sand is very sharp. This is also the case in the study area where the lower boundary of the Zandvliet Member coincides with an abrupt increase in qc values. As permafrost also developed during the Pleistocene in our study area (Vandenberghe, 2001), the model of Kendall & Clegg (2000) provides a possible explanation for the irregular decalcification of the original shell-bearing Merksem sand into the Zandvliet sand. Kendall & Clegg (2000) reported Red Crag decalcification depths of up to 6 m. In the case of the study area, maximum decalcification depths reached up to -20 m TAW (Fig. 7).
21Decalcification, caused by acidic chemical weathering or diagenetic processes, is not reflected in the heavy mineral association of the Zandvliet Member as reported by Geets & De Breuck (1991). Acidic chemical weathering of the sediment would be expected to lead to a decrease in the number of minerals that are unstable in acidic conditions such as garnet and hornblende, and an increase in ultrastable minerals such as zircon, rutile and tourmaline (Morton & Hallsworth, 1999). This is opposite to what is observed in the Zandvliet Member, with a strong increase in hornblende and decrease in zircon, rutile and garnet, while other mineral species remain relatively constant between the members of the Lillo Formation (Fig. 4). Consequently, the heavy mineral composition apparently has not been affected by the decalcification process and the heavy mineral signature is likely to be a primary signal. Such an extremely high content of hornblende is only known in the Belgian Neogene from the upper Miocene Lichtaart member of the Kasterlee Formation at the base of the Lichtaart outcrop, where it is also accompanied by a decrease in zircon, rutile and garnet (Gullentops & Huyghebaert, 1999). These authors relate these changes to a sorting effect by winnowing during long-shore transport, in a very shallow marine to estuarine environment. For the Zandvliet Member as well, it are the minerals with the highest density—zircon, rutile, garnet and opaques—which are selectively sorted out of its mineral association, for which hydraulic sorting processes are the most likely cause. The Merksem Member is interpreted as a near-shore beach to estuarine deposit, strongly influenced by wave action (Laga, 1972). The latter author distinguished two subunits within the Merksem Member, called B4 and B5 (Fig. 3). Subunit B4 in the lower part of the Merksem Member shows oblique to cross-bedded sand that is separated by clay layers/lenses, which is indicative for a high energetic depositional environment, whereas B5 in the upper part of the Merksem Member shows horizontal to only slightly oblique bedding and a return towards higher numbers of foraminifera and bioturbation, which are indicative for a lower energetic depositional environment. Since the Zandvliet Member is equivalent to the upper part of the Merksem Member or roughly subunit B5, it was deposited in a lower energetic environment compared to the underlying Merksem Member, or roughly subunit B4. The uniform Rf values on CPTs for the Zandvliet Member indeed suggest homogeneous sediments whereas the stronger fluctuating Rf values for the underlying Merksem Member suggest a stronger sedimentological heterogeneity with clay layers or lenses within the sand. Continued reworking in this shallow wave-dominated environment may have led to the mineral association becoming more dominated by lighter heavy minerals towards the top of the section as the denser minerals are no longer picked up or freshly supplied, certainly in the less-energetic environment of subunit B5.
22It is important to note that this heavy mineral analysis is based on a limited set of samples of only few and spread out locations, which are not precisely reported in Geets & De Breuck (1991). The observed mineral association of the Zandvliet Member may only be a local phenomenon and further studies on new and stratigraphically well-constrained samples are necessary to get a better idea of the heavy mineral associations of the Merksem and Zandvliet Members and how they vary within these members and across the unit boundaries.
8. Acknowledgements
23This article was constructed within the framework of a project called “Geological questions for the Neogene” for the VLAKO-reference task as ordered by the Bureau for Environment and Spatial Development – Flanders, VPO. We are grateful to Katrien De Nil, Jan van Roo and Jasper Verhaegen from VPO for the fruitful collaboration that made the work on this project possible. Katrien De Nil and Chandra Algoe (MOW) are thanked for the constructive discussions that shaped this article. Katrijn Dirix (VITO) is thanked for database support and Katleen van Baelen (VITO) is thanked for her excellent work on the figures. Reviews by Gauthier van Alboom and Noël Vandenberghe led to substantial improvements of the article.
9. References
24Deckers, J., De Koninck, R., Bos, S., Broothaers, M., Dirix, K., Hambsch, L., Lagrou, D., Lanckacker, T., Matthijs, J., Rombaut, B., Van Baelen, K. & Van Haren, T., 2019. Geologisch (G3Dv3) en hydrogeologisch (H3D) 3D-lagenmodel van Vlaanderen. Studie uitgevoerd in opdracht van het Vlaams Planbureau voor Omgeving, departement Omgeving en de Vlaamse Milieumaatschappij. VITO, Mol, VITO-rapport 2018/RMA/R/1569. https://archief-algemeen.omgeving.vlaanderen.be/xmlui/handle/acd/251494, accessed 01/04/2021.
25Deckers, J., Louwye, S. & Goolaerts, S., 2020. The internal division of the Pliocene Lillo Formation: correlation between Cone Penetration Tests and lithostratigraphic type sections. Geologica Belgica, 23/3-4, 333–343. https://doi.org/10.20341/gb.2020.027
26De Meuter, F.J. & Laga, P.G., 1976. Lithostratigraphy and biostratigraphy based on benthonic foraminifera of the Neogene deposits of Northern Belgium. Bulletin de la Société belge de Géologie, 85/4, 133–152.
27De Schepper, S., Head, M.J. & Louwye, S., 2009. Pliocene dinoflagellate cyst stratigraphy, palaeoecology and sequence stratigraphy of the Tunnel-Canal Dock, Belgium. Geological Magazine, 146/1, 92–112. https://doi.org/10.1017/S0016756808005438
28Geets, S. & De Breuck, W., 1991. De zware-mineraleninhoud van Belgische mesozoïsche en cenozoïsche afzettingen. G. Neogeen. Natuurwetenschappelijk Tijdschrift, 73, 3–37.
29Goetinck, R., Thomas, H., Maertens, J. & Van Marcke, S., 1983. Controlled dewatering techniques for the construction of the Berendrecht sealock at Antwerp. 8th International Harbour Congress, Antwerp, 13-17 June 1983, 1.163-1.167.
30Gullentops, F. & Huyghebaert, L., 1999. A profile through the Pliocene of the Northern Kempen, Belgium. Aardkundige Mededelingen, 9, 191–202.
31Jacobs, P., Polfliet, T. & Moerkerke, G., 2010. Toelichtingen bij de geologische kaart van België, Vlaams Gewest: kaartblad 1 - 7, Essen-Kapellen [1/50 000]. Belgische Geologische Dienst en Ministerie van de Vlaamse Gemeenschap, Afdeling Natuurlijke Rijkdommen en Energie, Brussel, 44 p.
32Kendall, A.C. & Clegg, N.M., 2000, Pleistocene decalcification of Late Pliocene Red Crag shelly sands from Walton-on-the-Naze, England. Sedimentology, 47, 1199–1209. https://doi.org/10.1046/j.1365-3091.2000.00349.x
33Laga, P., 1972. Stratigrafie van de mariene Plio-Pleistocene afzettingen uit de omgeving van Antwerpen met een bijzondere studie van de foraminiferen. Unpublished Ph.D. Thesis, Katholieke Universiteit Leuven - Faculteit Wetenschappen, Leuven, 252 p.
34Laga, P., 1979. Borehole descriptions Zandvliet 014E0153, 014E0154, 014E0155 and 014E0156. https://collections.naturalsciences.be/ssh-geology-archives/profiles-boreholes/Varia%20profiles%20boreholes/pgl/neogeen/pgl-80-217.jpg, accessed 01/04/2021.
35Laga, P. & Utens, G., 1986. Borehole description Berendrecht (containerkaai aan de Schelde) 014E0176. http://collections.naturalsciences.be/ssh-geology-archives/arch/014e/014e0176.txt, accessed 01/04/2021.
36Louwye, S., Deckers, J. & Vandenberghe, N., 2020. The Pliocene Lillo, Poederlee, Merksplas, Mol and Kieseloolite Formations in northern Belgium: a synthesis. Geologica Belgica, 23/3-4, 297–313. https://doi.org/10.20341/gb.2020.016
37Morton, A.C. & Hallsworth, C.R., 1999. Processes controlling the composition of detrital heavy mineral assemblages in sandstones. Sedimentary Geology, 124, 3–29. http://dx.doi.org/10.1016/S0037-0738(98)00118-3
38Van Burm, Ph., 1988. Borehole descriptions Berendrecht (bij Kanaaldok B2-B3) 014E0200 and 014E0201. http://collections.naturalsciences.be/ssh-geology-archives/arch/014e/014e0200.txt and http://collections.naturalsciences.be/ssh-geology-archives/arch/014e/014e0201.txt, accessed 01/04/2021.
39Van Calster, P. & Borry, P., 1991. Geologische interpretatie van diepsonderingen in de eocene formaties ten NO van Brussel. In Vandenberghe, N. & Laga, P. (eds), De aarde als fundament. Een inleiding tot de geologie voor ingenieurs. Acco, Leuven, 241–260.
40Vandenberghe, J., 2001. Permafrost during the Pleistocene in North West and Central Europe. In Paepe, R. & Melnikov, V. (eds), Permafrost Response on Economic Development, Environmental Security and Natural Resources. Kluwer, Dordrecht, NATO Science Series (Series 2, Environment Security), 76, 185–194. https://doi.org/10.1007/978-94-010-0684-2_12
41Van der Sluys, J., 1996. Geologisch onderzoek langs de hogesnelheidslijn tussen Brussel en Leuven. Belgische Geologische Dienst, Professional Paper, 282, 28 p.
42Vervoenen, M., van Nieulande, F., Fraussen, K., Wesselingh, F.P. & Pouwer, R. 2014. Pliocene to Quaternary sinistral Neptunea species (Mollusca, Gastropoda, Buccinidae) from the NE Atlantic. Cainozoic Research, 14, 17–34.
43Wesselingh, F.P., Busschers, F.S. & Goolaerts, S., 2020. Observations on the Pliocene sediments exposed at Antwerp International Airport (northern Belgium) constrain the stratigraphic position of the Broechem fauna. Geologica Belgica, 23/3-4, 315–321. https://doi.org/10.20341/gb.2020.026
44Manuscript received 18.08.2021, accepted in revised form 11.10.2021, available online 15.12.2021.
