


- Accueil
- Volume 25 (2022)
- number 3-4
- Cone Penetration Test characterization of middle and upper Miocene lithostratigraphic units near Antwerp International Airport


Visualisation(s): 4542 (39 ULiège)
Téléchargement(s): 1590 (13 ULiège)

Cone Penetration Test characterization of middle and upper Miocene lithostratigraphic units near Antwerp International Airport

Abstract
Recently published multidisciplinary studies discussed the glauconiferous sand units of the Berchem and Diest formations in large temporary outcrops near the Antwerp International Airport, east of the City of Antwerp, northern Belgium. At this location, the upper Miocene Diest Formation was subdivided into an upper Deurne Member and a lower, recently introduced, Borsbeek Member. In the current study, Cone Penetration Tests performed near the outcrops were used to geotechnically characterize the exposed units for regional correlations. For the Kiel and Antwerpen members of the middle Miocene Berchem Formation, the geotechnical expressions are nearly identical to those recently described further west in the City of Antwerp area. Contrary to the latter area, however, the upper part of the Antwerpen Member is missing, due to erosion below the Borsbeek Member. This erosion reached up to the level of a regionally occurring, compact shell bed in the middle of the Antwerpen Member, which may have protected the underlying sand from further erosion. Throughout the study area, the Borsbeek and Deurne members each show a consistent geotechnical facies, allowing for them to be distinguished on electric CPTs and thus for more reliable predictions of their areas of occurrence.
Table des matières
1. Introduction
1Recently published multidisciplinary studies on the Neogene deposits exposed at large temporary outcrops just south of Antwerp International Airport (AIA) in the municipalities of Borsbeek and Mortsel (northern Belgium, just southeast of the City of Antwerp; for location see Figs 1, 2) enabled furthering the understanding of the Neogene history of northern Belgium (Hoedemakers & Dufraing, 2015; De Nil et al., 2020; Goolaerts et al., 2020; Houthuys et al., 2020; Vandenberghe & Louwye, 2020; Wesselingh et al., 2020; Alfsen et al., 2021, Lambert & Goolaerts, 2022; Van Boeckel & Everaert, 2022). While previously upper Miocene Diest Formation deposits of the Antwerp area were generally attributed to the Deurne Member by De Meuter & Laga (1976), Goolaerts et al. (2020) revealed that the Diest Formation in this area is twofold, with the newly proposed Borsbeek Member at the base and the redefined Deurne Member at the top. Next to AIA, Goolaerts et al. (2020) also recognized the new Borsbeek Member at the MIDDELARES section of Bosselaers et al. (2004; Fig. 1) and discussed the possibility of its occurrence at several temporary outcrops described in the 19th and 20th centuries. Two additional temporary outcrops, named MONICA (August 2020; located just next to MIDDELARES; Lambert & Goolaerts, 2022 & S.G. pers. obs.; Fig. 1) and AQUABOE (April 2021; located at the Aquafin water treatment station of Boechout, nearly 1 km SE of AIA; S.G. pers. obs.; Fig. 1) enabled to test the validity of the proposed twofold division and allowed for additional observations on the lithology, sedimentology, and paleontology of both the Borsbeek and Deurne members. Regardless, the understanding of the regional distribution of both members in the Antwerp area remains limited, as well as their possible continuation and correlation with the Diest Formation elsewhere.
Figure 1. Geography of the study area (map from www.geopunt.be) with the indication of the temporary outcrops and correlation panels discussed in the text. Correlation panel 1 (Fig. 4) integrates data from CPTs with data from temporary outcrops and one borehole near Antwerp International Airport (AIA; see Fig. 2 for detailed map). Correlation panel 2 (Fig. 5) does the same along a trajectory following the E313 Highway and outcrops described by De Meuter et al. (1976). The trace of the correlation panel of Deckers & Everaert (2022) in the east of the City of Antwerp area is also added, next to the location of the MIDDELARES, MONICA and AQUABOE temporary outcrops at which the presence of the twofold division of the Diest Formation into Borsbeek and Deurne members was identified.
Figure 2. Detailed map (from www.geopunt.be) revealing the location of the six CPTs, the GEO-03/145-B17 borehole and the five outcrop sections that are used to construct correlation panel 1 (Fig. 4A-B).
2The following sources of data may lead to a further understanding of the geographic extent of both members of the Diest Formation and their relationship with underlying sediments, being 1) new temporary outcrops, 2) boreholes and 3) Cone Penetration Tests (CPTs). While obviously the first category holds the highest potential for qualitative data, these also have the lowest probability to occur in the immediate future, especially in an already densely constructed area. Within the second category, for the Antwerp area, due to the many lithological similarities of the glauconite-bearing stratigraphic units on top of the clays of the Oligocene Boom Formation, destructive boreholes provide often too limited detail for their distinctions and qualitative data may only come from the (re)study of well-preserved non-distorted cores. Unfortunately, the latter are absent in the area of interest. The third category holds the most potential as a dense network of CPTs exists, and their data can be easily harvested from the public DOV-database (‘Databank Ondergrond Vlaanderen’; https://www.dov.vlaanderen.be). In addition, the implementation of CPT data in scientific research on the Belgian Neogene reveals promising results (Deckers & Louwye, 2020; Deckers et al., 2020; Schiltz, 2020; Verhaegen et al., 2020; Deckers et al., 2021; Deckers & Everaert, 2022).
3However, to be able to harvest lithostratigraphic data from CPTs, a translation key is to be found. In this study, the detailed descriptions—also including laboratory analyses on grain size and glauconite content of the AIA outcrops (Fig. 3) by Goolaerts et al. (2020)—are integrated with CPT data. This allows for a detailed CPT characterization of the middle and upper Miocene sediments near AIA. This is then also compared and correlated with the results of a recently published CPT characterization of the Kiel and Antwerpen members of the lower to middle Miocene Berchem Formation in the City of Antwerp area by Deckers & Everaert (2022), further aiding to improve our understanding of all these deposits.
Figure 3. Composite litholog section with summary of the laboratory analyses on glauconite content and grain size and formal lithostratigraphic interpretation of the AIA temporary outcrops (modified from fig. 15 of Goolaerts et al., 2020) plotted next to a CPT. The integration reveals that several successive intervals characterized by differing values and trends in qc, fs and Rf can be recognized, and that these intervals correspond closely to the lithostratigraphic interpretation of the succession by Goolaerts et al. (2020), providing evidence that CPTs can be used to predict the presence of these lithostratigraphic units, in particular of the Borsbeek and Deurne members of the Diest Formation. The integration also reveals a close correlation between the CPT expression and the lithology of the deposits and the trends therein.
2. Dataset and methodology
4All data points (outcrops, boreholes, and CPTs) used by this study, with their codes in the DOV database and GSB (Geological Survey of Belgium) archive, are gathered in Table 1.
|
Datapoint this study |
Type of data |
Reference |
DOV code |
GSB code |
|
|
1 |
CPT |
This study |
|||
|
2 |
outcrop |
LP1-B in Goolaerts et al. (2020) |
028e0919 |
||
|
3 |
outcrop |
LP1-A in Goolaerts et al. (2020) |
028e0919 |
||
|
4 |
CPT |
This study |
|||
|
5 |
outcrop |
LP1-D in Goolaerts et al. (2020) |
028e0919 |
||
|
Correlation |
6 |
CPT |
This study |
||
|
panel 1 |
7 |
borehole |
This study |
||
|
8 |
CPT |
This study |
|||
|
9 |
outcrop |
LP2-A in Goolaerts et al. (2020) |
028e0920 |
||
|
10 |
CPT |
This study |
|||
|
11 |
outcrop |
LP2-B in Goolaerts et al. (2020) |
028e0920 |
||
|
12 |
CPT |
This study |
|||
|
A |
outcrop |
XI B.R. in De Meuter et al. (1976) |
028e0499 |
||
|
B |
CPT |
This study |
|||
|
Correlation |
C |
outcrop |
VII B.R. De Meuter et al. (1976) |
028e0498 |
|
|
panel 2 |
D |
CPT |
This study |
||
|
E |
CPT |
This study |
|||
|
F |
CPT |
This study |
|||
Table 1. Overview on the data points used by this study with references and their DOV (Databank Ondergrond Vlaanderen) and GSB (Geological Survey of Belgium) codes.
2.1. Correlation panel 1: AIA (Fig. 4)
5The AIA temporary outcrops were dug in 2014 for the construction of a tunnel on the R11 road between Mortsel and Borsbeek just south of Antwerp International Airport (Figs 1, 2). They consisted out of two large pits named AIA LP1 (southern pit) and AIA LP2 (northern pit). Both pits were separated by a middle part that was inaccessible for observations and sampling (due to safety reasons) and that constituted the middle transect of the tunnel. Five lithostratigraphically interpreted outcrop descriptions of Goolaerts et al. (2020) identifying the exposed middle to upper Miocene deposits were selected for this study, namely LP1-A, LP1-B, LP1-D, LP2-A and LP2-B (DOV TO-20140101C; TO-20140101D; TO-20140101F; TO-20140101G; TO-20140101H). The outcrop locations and interpretations were inventoried by De Nil et al. (2020) and added to the DOV-database, from which these data were extracted.
6These five sections were then supplemented with borehole GEO-03/145-B17 (Fig. 2), located at the northern edge of AIA LP1. The lithostratigraphy of this borehole is reinterpreted as follows:
-
0–2 m: Quaternary
-
2–7 m: Diest Formation (no differentiation into members possible)
-
7–10 m: Berchem Formation: Antwerpen Member
-
10–20 m: Berchem Formation: Kiel Member and possibly top of the Edegem Member.
7Next, from the DOV-database, a total of six CPTs were selected that are located near the five selected outcrop descriptions (<40 m distance) and the selected borehole (3.5 m distance; Fig. 2) for which the data on the qc (cone resistance), fs (sleeve friction) and Rf (friction ratio) were plotted onto vertical logs.
8In a further step, the five outcrops, the borehole, and the qc, fs and Rf values of the CPTs were compiled onto a more-or-less N-S oriented correlation panel 1, allowing to correlate the lithological observations and lithostratigraphic interpretations from outcrops and the borehole with the CPT expressions (Fig. 4).
9All data plotted onto this correlation panel 1 were repositioned in reference to the 0 m TAW level (TAW: Belgian Ordnance Datum). This allowed for the comparison of depths in the outcrops and on the CPTs and borehole. It also showed a possible error towards TAW level translated data of the outcrop sections of Goolaerts et al. (2020) of the northern pit in the DOV-database. Due to outcrop conditions, lateral changes, and the erosive nature of several of the contacts between the units and layers, it was not possible to reference to TAW level the boundaries of all the lithostratigraphic units exactly at their point of observation. Even more, the single TAW referenced level of all outcrop descriptions supplied by Goolaerts et al. (2020), the boundary between the Berchem and Diest formations, was measured close to section LP1-A, at +4.9 m TAW. While the latter corroborates well with the CPT data for the southern pit (LP1), it does not for the northern pit. For the latter, due to Neogene strata dipping in the northern direction in the region, the same boundary must locate at greater depth. Based on correlations with the CPTs, this boundary must situate at about +2.5 m TAW, meaning a downwards shift by 2.4 m. Thus, on correlation panel 1, sections LP2-A and LP2-B (9 and 11 on Fig. 4B) are positioned based on these new insights.
Figure 4. Correlation panel 1 (AIA) (see Fig. 2 for detailed location) integrates lithostratigraphic interpretations of five outcrop sections of Goolaerts et al. (2020) with those of one borehole and six CPTs (this study). Section A integrates the data from AIA LP1 (southern pit) and section B those from AIA LP2 (northern pit). The different depths of the boundary between the Borsbeek and Deurne members along the correlation panel identified from CPTs corroborates well with the observations from the temporary outcrop on its erosive nature. The deep incision by the Deurne Member removing nearly completely the Borsbeek Member just north of the tunnel transect can also be recognized on point 8.
2.2. Correlation panel 2: E313 highway (Fig. 5)
10A series of electric CPTs were selected along a west-east transect parallel to the E313 highway 2.5 km north of AIA (Fig. 1). The transect starts at Borgerhout in the west, at the stratotype section XI B.R. of the Antwerpen Member of the Berchem Formation as described by De Meuter et al. (1976, A on Fig. 5; DOV kb15d28e-B580). Deckers & Everaert (2022) correlated XI B.R. with a nearby CPT (B on Fig. 5; DOV GEO-07/154-S11), and we use their CPT interpretations and that of the shell beds S3 to S5 in the Antwerpen Member and extended them further east across the different CPTs, using the insights from correlation panel 1 at AIA to also identify the Borsbeek Member. Further east lies the stratotype section VII B.R. of the Deurne Member as described by De Meuter et al. (1976; C on Fig. 5; DOV kb15d28e-B579), and even more to the east, between CPTs D and E of Figure 5 (DOV GEO-20/008-S4 and GEO-18/017-S4), the transect passes 500 m north of the MIDDELARES and MONICA temporary outcrops, up to CPT F of Figure 5 (DOV GEO-15/158-S11), northeast of the AIA and AQUABOE temporary outcrops. This allowed connecting the stratotype area of the Deurne Member in the west to the area where the Borsbeek Member is expected in the subsurface further east.
11Outcrops VII B.R. and XI B.R. of De Meuter et al. (1976; kb15d28e-B580 and kb15d28e-B579) in Borgerhout and the qc, fs, and Rf logs of the four CPTs were compiled onto a more-or-less E-W oriented correlation panel 2 (Figs 1 & 5). All data plotted onto this correlation panel 2 was repositioned in reference to the top of the S3 Glycymeris crag as characterized by Deckers & Everaert (2022) in outcrops and CPTs.
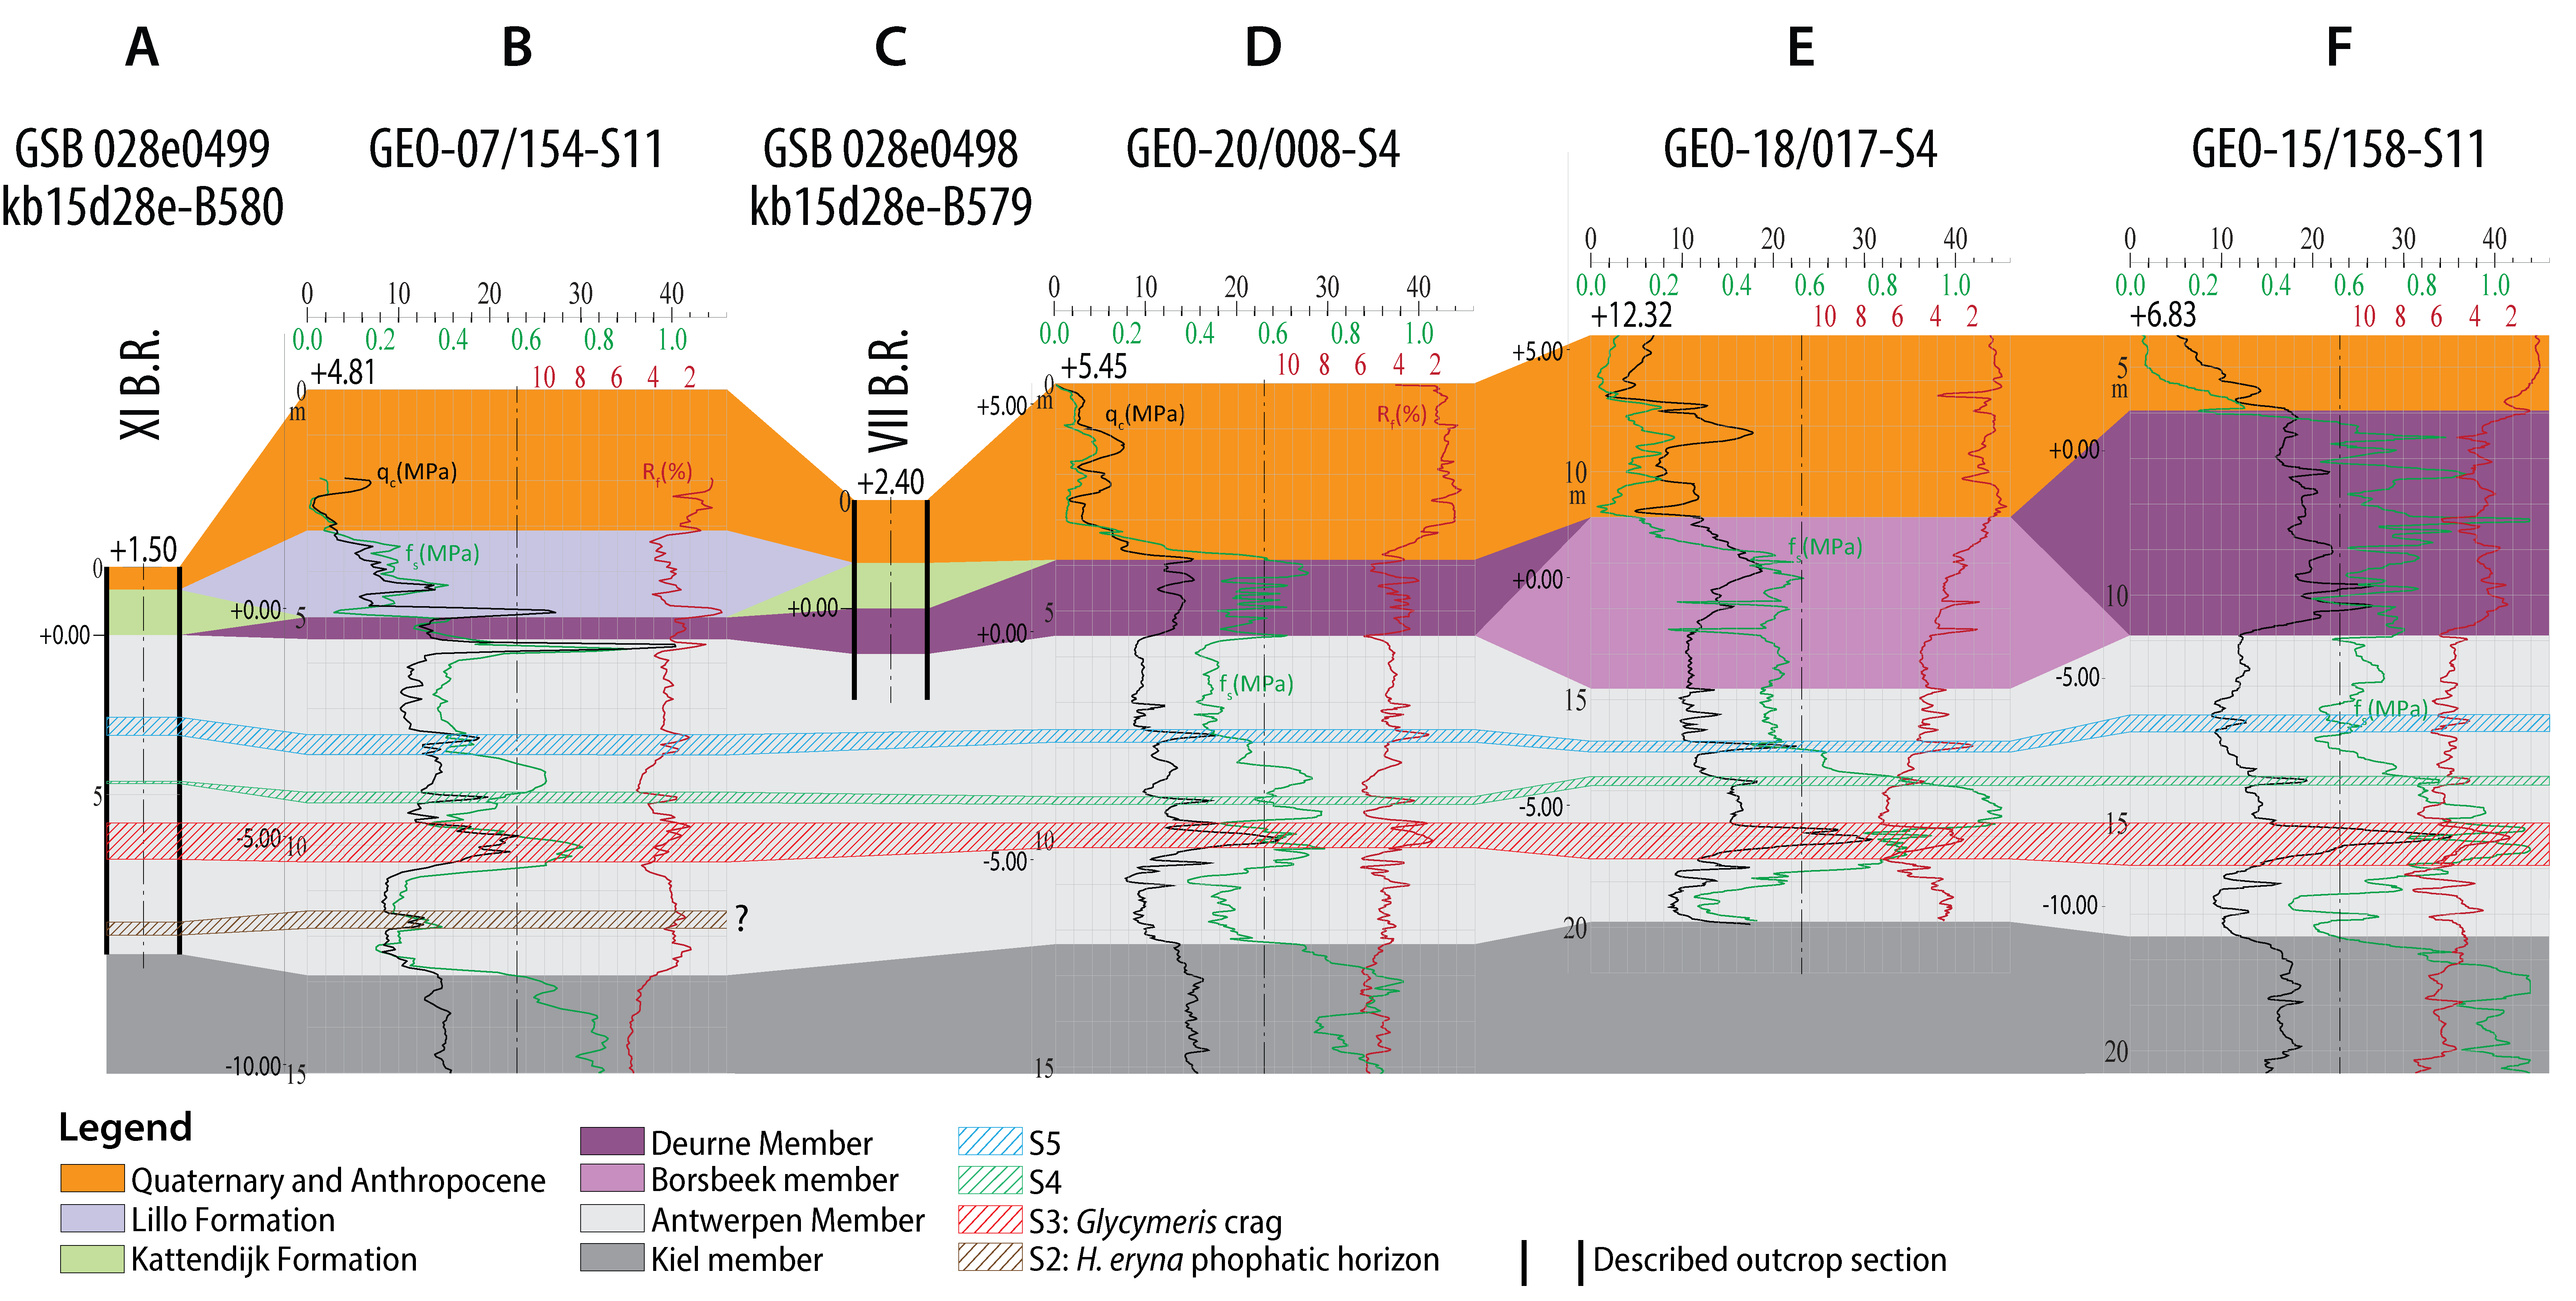
Figure 5. Correlation panel 2 (E313 Highway) integrates lithostratigraphic interpretations of two temporary outcrops described by De Meuter et al. (1976; XI B.R. and VII B.R.) with those of four electric CPTs (this study, with exception of CPT GEO-07/154-S11 for which the interpretation of Deckers & Everaert, 2022 is used). For location, see Figure 1.
The correlation panel reveals the lateral continuity of the CPT expression of different beds in the Antwerpen Member. It provides evidence that, contrary to correlation panel 1, there is considerably more Antwerpen Member preserved, including several meters above the S3 Glycymeris crag. It also reveals that the Deurne Member directly overlays the Berchem Formation except for in GEO-18/017-S4. In the latter, a previously unidentified presence of the Borsbeek Member in the shallow subsurface is revealed, locating 800 m to the northeast of the MIDDELARES and MONICA temporary outcrops described by Goolaerts et al. (2020) and Lambert & Goolaerts (2022). However, the interpretation of the base of the Borsbeek Member at GEO-18/017-S4 is rather uncertain, and could also be positioned one or two meters higher.
3. CPT characterizations and correlations
12In this chapter, we will characterize the different middle and upper Miocene lithostratigraphic units as observed on CPTs at AIA. This is then compared with field observations and laboratory analyses of these units of Goolaerts et al. (2020). For the Kiel and Antwerpen members of the Berchem Formation, the CPT expression at AIA will also be compared to their CPT expression in the City of Antwerpen area as recently described by Deckers & Everaert (2022).
Berchem Formation - Kiel Member
13qc and Rf values around 12–15 MPa and 6–8%, respectively, characterize the interval below +2 m TAW on correlation panel 1A and below +0 m TAW on correlation panel 1B (Fig. 4). Based on the data presented by Deckers & Everaert (2022) for the city of Antwerp area, this interval may correlate to the Kiel Member of the Berchem Formation. Confirmation for this interpretation, at least for the upper part of the interval on correlation panel 1, is sustained by field observations from the AIA temporary outcrops. Goolaerts et al. (2020) detailed that the upper part of the Kiel Member, together with the lower part of the Antwerpen Member, was observed at AIA, but only in two small pits (see fig. 5 of Goolaerts et al., 2020) in which for safety reasons detailed observations and sampling were not possible. Nevertheless, a change in color was used to identify the boundary between these two members. This boundary nearly coincides with the first up-section presence of shell beds in which the bivalve fauna is characterized by an overwhelming presence of the genus Glycymeris (see also fig. 5A of Goolaerts et al., 2020). Based on the available data, the depth estimates for the top of the Kiel Member from CPTs on correlation panel 1 are in agreement with the field observations.
14On top of the background values of 12–15 MPa, several qc spikes with values of >20 MPa are present in the Kiel Member. One such qc spike, near -3 m TAW, is identified all along AIA LP1 (southern pit) up to borehole GEO-03/145-B17 (7 in Fig. 4A). From the borehole description, one may deduce that this spike correlates to a sandstone horizon, described as: light green, almost white, sandy limestone. Only one CPT penetrates deep into the Kiel Member at AIA LP2 (12 in Fig. 4B). On this CPT, the qc spike was not observed, which may indicate discontinuities in the sandstone horizon. Similar lateral discontinuities in the qc spikes were also observed for Kiel Member sandstone-bearing horizons in the City of Antwerp area by Deckers & Everaert (2022).
Berchem Formation – Antwerpen Member
15qc values around 7–9 MPa and Rf values between 4–6% characterize the interval between +4.5 and +2 m TAW on correlation panel 1A and between +2 and +0 m TAW on correlation panel 1B (Fig. 4). This unit could be correlated to the Antwerpen Member of the Berchem Formation as interpreted at the AIA outcrops by Goolaerts et al. (2020). In the City of Antwerp area, the lower part of the Antwerpen Member holds similar CPT characteristics according to Deckers & Everaert (2022).
16The relatively low qc values of the Antwerpen Member are topped by a thick qc spike, with values around 16–20 MPa and relatively low Rf values of around 4%. This qc spike could be correlated to a thick shell bed in the top of the Antwerpen Member as interpreted at the AIA outcrops by Goolaerts et al. (2020). Further west, in the City of Antwerp area, a similar qc spike was observed a few meters above the base of the Antwerpen Member by Deckers & Everaert (2022), and referred to as the so-called “S3 Glycymeris crag”. As is the case in the City of Antwerp area, this shell bed consists of thousands of shells that lie imbricated convex side upwards at AIA. This layer marked the top of the Antwerpen Member at every observation point in both LP1 and LP2.
17In AIA LP1 (southern pit), the qc spike of S3 seems to locally be split into two spikes with similar qc values (Fig. 4A). This corroborates well with the observation of the presence of a sand body in the middle of S3 in outcrop section LP1-B of Goolaerts et al. (2020). Secondary qc spikes at AIA underneath S3 may be related to the thin, not always laterally continuous shell beds. The so-called “S2 Haustator eryna shell bed” in the lower part of the Antwerpen Member as described by Deckers & Everaert (2022) in the City of Antwerp area was not clearly expressed on correlation panel 1. Correlation panel 2 indeed shows that the CPT characteristics of this layer disappear east of Borgerhout (from B to D on Fig. 5). In the Borgerhout area in the west of correlation panel 2, several more qc spikes are located in the Antwerpen Member on top of the S3 Glycymeris crag that were correlated with shell beds by Deckers and Everaert (2022; B in Fig. 5).
Diest Formation – Borsbeek Member
18Upwards decreasing Rf values from 6% to 2% characterize the interval between +8.5 and +4.5 m TAW on correlation panel 1A and between +5.5 and +2 m TAW on correlation panel 1B (Fig. 4). This unit could be correlated to the newly introduced Borsbeek Member of the Diest Formation as interpreted at the AIA outcrops by Goolaerts et al. (2020). This member starts with rather low qc and high Rf values in its basal part, which are very similar to those of the Antwerpen Member (outside the shell beds). Laboratory analyses of the grain size and glauconite content indeed revealed lots of similarities between the basal part of the Borsbeek Member and Antwerpen Member. Consequently, it becomes difficult to distinguish the Antwerpen Member and the lower part of the Borsbeek Member on CPTs. One of the main differences appears to be the lack of thin qc spikes within the Borsbeek Member and the regular abundance of such spikes within the Antwerpen Member, related to the compact shell beds within the latter. Indeed, contrary to those of the Antwerpen Member, that are mainly composed out of densely stacked thick Glycymeris shells, shell beds of the Borsbeek Member have a much lower number of shells, which lie more dispersed and are predominantly of small and thin-shelled pectinids and pycnodontid bivalves and terebratulid brachiopods.
19From the basal section of the Borsbeek Member, the qc values increase towards values between 10–20 MPa and Rf values more consistently decrease upwards, from 6% at the base towards 2% at the top of the member (Figs 3, 4). This decrease in Rf values may reflect the upwards decrease in clay content (from 10% to 2%) and other fines, and possibly also the decrease in glauconite (from 45–60% to 30%), although gaps in the analyzed samples hinder a straightforward correlation.
20Small negative spikes are present on top of this upwards decreasing Rf trend, which cause local decreases of 2% in Rf values. Given their apparent irregular occurrence within the Borsbeek Member, it remains uncertain what causes these negative spikes in Rf value.
21On correlation panel 2, the CPT signature of the Borsbeek member was interpreted in GEO-18/017-S4 (E in Fig. 5). This CPT situates 800 m to the northeast of the MIDDELARES and MONICA temporary outcrops (Fig. 1), thus not far from where the member was positively identified by Goolaerts et al. (2020) and Lambert & Goolaerts (2022). Therefore, it constitutes the most northernly occurrence at which the member is currently positively identified.
Diest Formation – Deurne Member
22The trend of upwards decreasing Rf values for the Borsbeek member abruptly ends as values climb back up from 2% towards 3–4% (correlation panel 1, Fig. 4). This increase in Rf values also generally coincides with an increase in qc values. Data presented by Goolaerts et al. (2020) allow to correlate this change in trend as coinciding with the boundary between the Borsbeek and Deurne members. The depth of this change in Rf trend variates laterally, which can be explained by the erosive nature of the base of the Deurne Member as shown by Goolaerts et al. (2020).
23The higher Rf values of the Deurne Member are probably the result from the increased glauconite-content, 39–49% in the Deurne Member compared to 30% in the middle and upper part of the Borsbeek Member (Fig. 3). The coarser grain size of the Deurne Member compared to the top part of the Borsbeek member is probably also why the former shows overall higher qc values (in the order of 14 MPa) compared to the latter (around 12 MPa).
24North of the tunnel entrance (outcrop point AIA LP-2A, 9 on Fig. 4B), the Deurne Member is thickest developed in a large trough deeply incising into the Borsbeek member and removing it fully. The nearby CPT GEO-06/067-S20 (8 on Fig. 4B) shows that the CPT facies of the Borsbeek member as described above is absent here in between the Antwerpen and Deurne members. Indeed, the basal low qc values and trend of upwards decreasing Rf values of the Borsbeek Member are missing, and instead Rf values show an upwards increasing trend. However, the low Rf values as observed in the basal part of the Deurne Member differ from those for the Deurne Member elsewhere at AIA, and may reflect intermixing with eroded Borsbeek Member sediment. Evidence for such intermixing is supplied by the lowermost grain-size sample of the Deurne Member from a much less deeply incised trough (Fig 3, LP1-17). On correlation panel 2, a very similar CPT facies with upwards increasing Rf values and relatively high qc values can be observed on CPT GEO-15/158-S11 (F in Fig. 5) and was also interpreted as the Deurne Member. At CPTs GEO-06/067-S20 and GEO-06/067-S21 (8 and 10 on correlation panel 1, Fig. 4B), about 1 and 0.5 m above the base of the Deurne Member, the qc levels spike up to over 20 MPa. These spikes probably correlate to sandstone formed after deposition in the foresets, similar to the sandstone interval observed in the field above the base of the deep trough of AIA LP2-A.
25The contact of the Diest Formation with the overlying Quaternary or Anthropocene deposits can be identified on the CPTs along panels 1 and 2 by a decrease in qc values towards very low values of <5 MPa (Figs 3, 4).
4. Insights gained from the CPT characterization of the middle and upper Miocene lithostratigraphic units
4.1. Incision of the Borsbeek Member into the Antwerpen Member
26In this study, we were able to characterize on CPTs the Neogene units exposed in outcrops at AIA and described therein by Goolaerts et al. (2020). As discussed in the previous chapter, the CPT signatures for the Antwerpen and Kiel members of the Berchem Formation at AIA (this study; Figs 3, 4) are almost identical to those identified by Deckers & Everaert (2022) for the City of Antwerp area. In the latter study, several qc spikes in the Antwerpen Member were correlated to compact shell beds. The largest qc spike correlates with a thick accumulation of Glycymeris shell beds in the central part of the Antwerpen Member, the so-called S3 Glycymeris crag (Deckers & Everaert, 2022). At AIA, the S3 Glycymeris crag was also interpreted by the current study and composes the top of the Antwerpen Member (Fig. 4). This study thus shows the continued presence of the S3 Glycymeris crag east of the City of the Antwerp. In the northeastern part of the City of Antwerp area (Borgerhout district), and along correlation panel 2, the S3 Glycymeris crag is located only about halfway in the Antwerpen Member (Deckers & Everaert, 2022; Fig. 5). Therefore, the upper part of the Antwerpen Member, located above the S3 Glycymeris crag, must be missing at AIA. Since this upper part of the Antwerpen Member is present across large parts of the City of Antwerp area as shown in Deckers & Everaert (2022), its absence at AIA is most likely related to erosion, either before or at the start of the deposition of the overlying Borsbeek Member. The lowermost part of the Borsbeek Member indeed contains some reworked material of the Antwerpen Member, and the sharp truncation of the Glycymeris shells in the top of the Antwerpen Member as illustrated by Goolaerts et al. (2020) are indicative of strong erosion. Furthermore, the sand body that locally appears in the basal part of the Borsbeek Member was interpreted as a subaquatic mass flow deposit, demonstrating that the Borsbeek transgression flooded a surface with some relief (Goolaerts et al., 2020). The compact nature of the S3 Glycymeris crag, as evidenced by the relatively high qc values, probably formed a strong enough resistance against erosion to prevent it from penetrating deeper into the Antwerpen Member. This could explain why the S3 Glycymeris crag consistently composes the top of the Antwerpen Member at the AIA. For possibly the same reason, this crag also locally forms the top of the Antwerpen Member below the Quaternary cover in the southern City of Antwerp area or below the incision by the Kattendijk Formation in the northern City of Antwerp area (Deckers & Everaert, 2022). The new information from the CPTs underpins earlier correlations by Goolaerts et al. (2020), correlating the AIA section with that of Posthofbrug temporary outcrop further west in the City of Antwerp area as described by Louwye et al. (2010), meaning that the upper part of the Antwerpen Member, frequently also characterized by the presence of corals, was not observed at AIA.
27The amount of eroded Antwerpen Member sediment at AIA can only be roughly estimated. In the Borgerhout – Rivierenhof temporary outcrop XI B.R. in the northeastern City of Antwerp (A in Fig 5), about 4 m of Antwerpen Member is present on top of the S3 Glycymeris crag, and thus missing at AIA. However, in this City of Antwerp localities, the Antwerpen Member is disconformably overlain by lower Pliocene sediments of the Kattendijk Formation (De Meuter et al., 1976; Deckers & Everaert, 2022; A in Fig. 5). This means that the abovementioned 4 m are supposedly an underestimate, not yet considering for possible thinning in southern direction. These 4 m correspond to the maximal observed thickness of the Borsbeek Member preserved below the Deurne Member at AIA.
28At the newly identified Borsbeek Member occurrence on correlation panel 2 not far north from outcrops MIDDELARES and MONICA, a lesser amount of Antwerpen Member was eroded than at AIA and probably limited to only a few meters, since the S5 shell bed of the Antwerpen Member is probably still preserved here above the S3 Glycymeris crag. More limited incision in northern direction should not be surprising given the structural dip of Neogene layers in northeastern direction, away from the relatively uplifting Brabant Massif further south. So the deepening of incision in the Antwerpen Member is expected to increase in southern direction, in accordance with the few datapoints of this study. This hypothesis, however, has to be supported by a lot more data in order to validate it. The results of this study show that electric CPTs provides a useful tool to do this.
4.2. Further interpretation of the Borsbeek and Deurne members on CPTs
29The CPT signatures for the Borsbeek and Deurne members of the Diest Formation at AIA (this study; Figs 3, 4) are revealed for the first time. These signatures can now be used to identify the presence of these members in the shallow subsurface without the strict need of outcrops, at least when several meters of them have remained preserved and were not removed by post-depositional erosion. Nevertheless, the identification of the Borsbeek Member based on qc values alone proved to be difficult, and mainly relies on the characteristic upwards decreasing Rf values on electric CPTs. Since Rf values are not measured by mechanical CPTs, the identification of the Borsbeek member and its base is very difficult and definitely not straightforward therein. However, even on electric CPTs, the interpretation of the base of the Borsbeek member is not always straightforward as is shown on correlation panel 2 (Fig. 5). The Deurne Member generally shows higher qc values compared to the Borsbeek member as the result of its coarser grain size and is therefore more easily identified on mechanical as well as on electrical CPT logs. The main heterogeneity of this member relates to the presence of local qc spikes, correlating to sandstone formation in the foresets.
5. Conclusions
30Based on the correlation of CPT data with nearby detailed descriptions and analyses on outcrops, a geotechnical characterization of the Berchem and Diest formations at the Antwerp International Airport, to the east of the City of Antwerp is developed. For the Kiel and Antwerpen members, the CPTs in the study area show a very similar values and trends compared to those recently described further west in the City of Antwerp area. qc spikes correlated to horizons with (discontinuous) sandstones in the Kiel Member and shell beds in the Antwerpen Member. The thickest and most compact accumulation of shell beds in the Antwerpen Member as observed in the City of Antwerp area could be traced up to Antwerp International Airport. In the latter area, it formed the top of the Antwerpen Member. The overlying part of the Antwerpen Member, which reached 4 m thickness in the northern City of Antwerp area, is missing as it was eroded, making space for thick Borsbeek Member deposits remaining preserved at the Antwerp International Airport. The Borsbeek Member is best characterized by its upwards decreasing Rf values, which probably reflects the upwards decrease in fines in this unit. The importance of Rf values exclude the use of mechanical CPTs to identify the Borsbeek Member.
31The boundary between the Borsbeek Member and overlying Deurne Member is characterized by an upwards increase in qc and Rf values, reflecting the increase in glauconite and coarser sand in the basal part of the latter member. Small qc spikes within the Deurne Member probably reflect sandstone formation within the foresets. The CPT characterization of both Diest Formation members presented in this study now allows making more reliable predictions on their areas of occurrence. In addition, the incisive and erosive nature of the contact between both members was further documented on the assembled transects integrating CPT data with those of the AIA outcrops and one borehole.
6. Acknowledgments
32This article was constructed within the framework of a project called “Geological questions for the Neogene” for the VLAKO-reference task as ordered by the Bureau for Environment and Spatial Development – Flanders, VPO. We are grateful to Katrien De Nil, Jan van Roo and Jasper Verhaegen from VPO for the fruitful collaboration that made the work on this project possible. The same persons are also thanked, together with Ilse Vergauwen and Chandra Algoe (MOW) for the constructive discussions that shaped this article. Katrijn Dirix (VITO) is thanked for database support and Katleen van Baelen (VITO) is thanked for her excellent work on the figures. Stijn Everaert is thanked for providing his insights on the Neogene of the area. Katrien De Nil (VPO) is thanked for her efforts to integrate the datapoints (outcrops, borehole and CPTs) of this article and their interpretations into a separate project in the database of DOV: https://www.dov.vlaanderen.be/data/opdracht/2022-028886. SG is grateful to all those who assisted him in the field, during the collecting of data and samples, as well as to all those who shared observations and kept him updated on new temporary outcrops and their progress, as well as to those persons who granted him access to outcrops under their care. The authors are grateful to reviewers Jasper Verhaegen and Gauthier van Alboom for their constructive comments which helped to improve the quality of this paper.
7. Author contribution
33Jef Deckers conceptualized the paper, integrated the CPT and outcrop data, and performed the correlations of panels 1 and 2. Stijn Goolaerts provided insights on the Miocene units exposed at the AIA outcrops and aided to integrate outcrop data with that of CPT’s. Both authors contributed equally to the writing of this article. Jef Deckers, together with his colleague Katleen van Baelen, created the figures.
8. Data availability
34The outcrop, borehole and CPT data that support the findings of this study are openly available through https://www.dov.vlaanderen.be/data/opdracht/2022-028886 and https://doi.org/10.20341/gb.2020.011.
9. References
35Alfsen, A., Bosselaers, M. & Lambert, O., 2021. New sperm whale remains from the late Miocene of the North Sea and a revised family attribution for the small crown physeteroid Thalassocetus Abel, 1905. Comptes Rendus Palevol, 20/39, 807–822. https://doi.org/10.5852/cr-palevol2021v20a39
36Bosselaers, M., Herman, J., Hoedemakers, K., Lambert, O., Marquet, R. & Wouters, K., 2004. Geology and palaeontology of a temporary exposure of the Late Miocene Deurne Sand Member in Antwerpen (N. Belgium). Geologica Belgica, 7/1-2, 27–39.
37Deckers, J. & Louwye, S., 2020. The architecture of the Kattendijk Formation and the implications on the early Pliocene depositional evolution of the southern margin of the North Sea Basin. Geologica Belgica, 23/3-4, 323–331. https://doi.org/10.20341/gb.2020.017
38Deckers, J. & Everaert, S., 2022. Distinguishing the Miocene Kiel and Antwerpen Members (Berchem Formation) and their characteristic horizons using Cone Penetration Tests in Antwerp (northern Belgium). Geological Journal, 57, 2129–2143. https://doi.org/10.1002/gj.4384
39Deckers, J., Louwye, S. & Goolaerts, S., 2020. The internal division of the Pliocene Lillo Formation: correlation between Cone Penetration Tests and lithostratigraphic type sections. Geologica Belgica, 23/3-4, 333–343. https://doi.org/10.20341/gb.2020.027
40Deckers, J., Verhaegen, J. & Vergauwen, I., 2021. Characterization by Cone Penetration Tests of the decalcified Zandvliet Sand (Lillo Formation, North Belgium). Geologica Belgica, 24, 159–167. https://doi.org/10.20341/gb.2021.006
41De Meuter, F.J. & Laga, P.G., 1976. Lithostratigraphy and biostratigraphy based on benthonic foraminifera of the Neogene deposits of Northern Belgium. Bulletin de la Société belge de Géologie, 85/4, 133–152.
42De Meuter, F., Wouters, K. & Ringelé, D., 1976. Lithostratigraphy of Miocene sediments from temporary outcrops in the Antwerp city area: Pl. Antwerpen 28 W, Pl. Borgerhout 28 E. Service Géologique de Belgique, Professional Paper, 1976/3, 19 p.
43De Nil, K., De Ceukelaire M. & Van Damme M., 2020. A reference dataset for the Neogene lithostratigraphy in Flanders, Belgium. Geologica Belgica, 23/3-4, 413–427. https://doi.org/10.20341/gb.2020.021
44Goolaerts, S., De Ceuster, J., Mollen, F., Gijsen, B., Bosselaers, M., Lambert, O., Uchman, A., Adriaens, R., Van Herck, M., Houthuys, R., Louwye, S., Bruneel, Y., Elsen, J. & Hoedemaekers, K., 2020. The Upper Miocene Deurne Member of the Diest Formation revisited: unexpected results from the study of a large temporary outcrop near Antwerp International Airport, Belgium. Geologica Belgica, 23/3-4, 219–252. https://doi.org/10.20341/gb.2020.011
45Hoedemakers, K. & Dufraing, L., 2015. Elasmobranchii in de ontsluiting aan de luchthaven te Borsbeek (prov. Antwerpen, België). Afzettingen WTKG, 36/1, 12–19.
46Houthuys, R., Adriaens, R., Goolaerts, S., Laga, P., Louwye, S., Matthijs, J., Vandenberghe, N. & Verhaegen, J., 2020. The Diest Formation: a review of insights from the last decades. Geologica Belgica, 23/3-4, 199–218. https://doi.org/10.20341/gb.2020.012
47Lambert, O. & Goolaerts, S., 2022. Late Miocene survival of a hyper-longirostrine dolphin and the Neogene to Recent evolution of rostrum proportions among odontocetes. Journal of Mammalian Evolution, 29, 99–111. https://doi.org/10.1007/s10914-021-09573-6
48Louwye, S., Marquet, R., Bosselaers, M. & Lambert, O. 2010. Stratigraphy of an Early–Middle Miocene Sequence near Antwerp in Northern Belgium (Southern North Sea Basin). Geologica Belgica, 13, 269–284.
49Schiltz, M., 2020. On the use of CPT’s in stratigraphy; recent observations and some illustrative cases. Geologica Belgica, 23/3-4, 399–411. https://doi.org/10.20341/gb.2020.019
50Van Boeckel, J. & Everaert, S., 2022. First fossil record of Mustelus aff. punctulatus Risso, 1826: new evidence for a smooth-hound shark population in the Late Miocene North Sea Basin. Geologica Belgica, 25/1-2, 31–52. https://doi.org/10.20341/gb.2022.001
51Vandenberghe, N. & Louwye, S., 2020. An introduction to the Neogene stratigraphy of northern Belgium: present status. Geologica Belgica, 23/3-4, 97–112. https://doi.org/10.20341/gb.2020.008
52Verhaegen, J., Frederickx, L. & Schiltz, M., 2020. New insights into the lithostratigraphy and paleogeography of the Messinian Kasterlee Formation from the analysis of a temporary outcrop. Geologica Belgica, 23/3-4, 253–263. https://doi.org/10.20341/gb.2020.015
53Wesselingh, F.P., Busschers, F.S. & Goolaerts, S., 2020. Observations on the Pliocene sediments exposed at Antwerp International Airport (northern Belgium) constrain the stratigraphic position of the Broechem fauna. Geologica Belgica, 23/3-4, 315–321. https://doi.org/10.20341/gb.2020.026
54Manuscript received 26.10.2021, accepted in revised form 25.05.2022, available online 09.09.2022.
