


- Accueil
- Volume 26 (2023)
- number 3-4
- Granulometry, carbonate and glauconite content as stratigraphic tools to distinguish the Kiel Member and lower Antwerpen Member (Berchem Formation) in the City of Antwerp area (Belgium)


Visualisation(s): 2427 (38 ULiège)
Téléchargement(s): 1829 (22 ULiège)

Granulometry, carbonate and glauconite content as stratigraphic tools to distinguish the Kiel Member and lower Antwerpen Member (Berchem Formation) in the City of Antwerp area (Belgium)

Abstract
Granulometric, carbonate and glauconite analyses were performed on samples of the Kiel and Antwerpen members (Berchem Formation) in temporary exposures and boreholes in the area of the City of Antwerp. Since the upper part of the Antwerpen Member is only locally preserved from post-depositional erosion, this study focuses on the much more frequently sampled lower part of the Antwerpen Member. The granulometric results show that the Kiel Member and lower part of the Antwerpen Member are both dominated by the fine sand fraction, with an overall finer grain size for the lower Antwerpen Member compared to the Kiel Member. The Kiel Member is relatively enriched in the fine and medium sand fractions, whereas the lower Antwerpen Member is relatively enriched in the very fine sand to silt fraction. Both members show a similar, low clay content. Measurements of clay content are higher in boreholes (on average 3.9–5.2%) than in temporary exposures (less than 1%), which might be explained by the crushing of the glauconite into the clay fraction during drilling. In borehole samples, especially those analysed by sieving, the Antwerpen Member often shows a higher amount of coarse grains than the Kiel Member, which represent shell fragments present in the Antwerpen Member and nearly absent in the Kiel Member. Like the amounts of shells, also the measured carbonate content—measured outside the shell beds—is lower for the Kiel Member than for the lower Antwerpen Member (3% vs 4.2%). The average glauconite content—based on the >63 µm fraction—displays similar, strong fluctuations between 35% and 60% for both members. On top of these fluctuations, a general downward decrease in glauconite content is noticed in the Kiel Member.
Table des matières
1. Introduction
1During the early and middle Miocene respectively, the glauconitic sand of the Kiel and Antwerpen members (Berchem Formation) was deposited at the southern margin of the North Sea Basin (northern Belgium). Both members are lithologically similar, and the main criterion for their distinction has long been the decalcification of the Kiel Member, especially in the southern Antwerp area (De Meuter & Laga, 1976). However, a fossiliferous facies of the Kiel Member can locally be present, as observed in some temporary exposures more to the north and east of the City of Antwerp (Everaert et al., 2020). In the field, the latter authors observed that the Kiel Member also appears coarser-grained, less clayey and slightly paler coloured compared to the basal part of the Antwerpen Member. Unfortunately, these observations were not supported by quantitative analyses at the time. Such analyses were only performed on samples from boreholes east and northeast of the City of Antwerp or in the Antwerp Campine area, measuring grain sizes (Verhaegen, 2020) and glauconite content (Adriaens, 2015). In these boreholes, however, the boundary between the Kiel and Antwerpen members is often ambiguous (Louwye et al., 2020). Hence, a better lithological characterization of both members is highly needed in their type area. Therefore, granulometric, carbonate and glauconite analyses were performed on recently described temporary exposures in Antwerp. These data were compared to similar existing analyses from boreholes in the centre and north of the city, extracted from the DOV-database (‘Databank Ondergrond Vlaanderen’, Flanders Soil and Subsoil Database). The stratigraphic interpretation of these samples was supported by Cone Penetration Test (CPT) interpretations based on the recent study by Deckers & Everaert (2022). This resulted in a large dataset of granulometric, carbonate and glauconite analyses, enabling a better characterization and differentiation of the Kiel and Antwerpen members. The results are compared to previous analyses of the same stratigraphic units in temporary exposures in and near Antwerp and in boreholes in the Campine area, available in the literature.
2. Dataset and methodology
2An overview of the sample locations is given in Figure 1. The boundary between the Kiel and Antwerpen members is best established in temporary exposures and is more difficult to pinpoint in boreholes, unless they are matched with a CPT. Therefore, samples of temporary exposures and boreholes are separately described and discussed. For granulometry, we use the following grain-size classifications: clay (<2 µm), silt (2–63 µm), finest sand (63–125 µm), fine sand (125–250 µm), medium sand (250–500 µm), coarse sand (500–1000 µm).
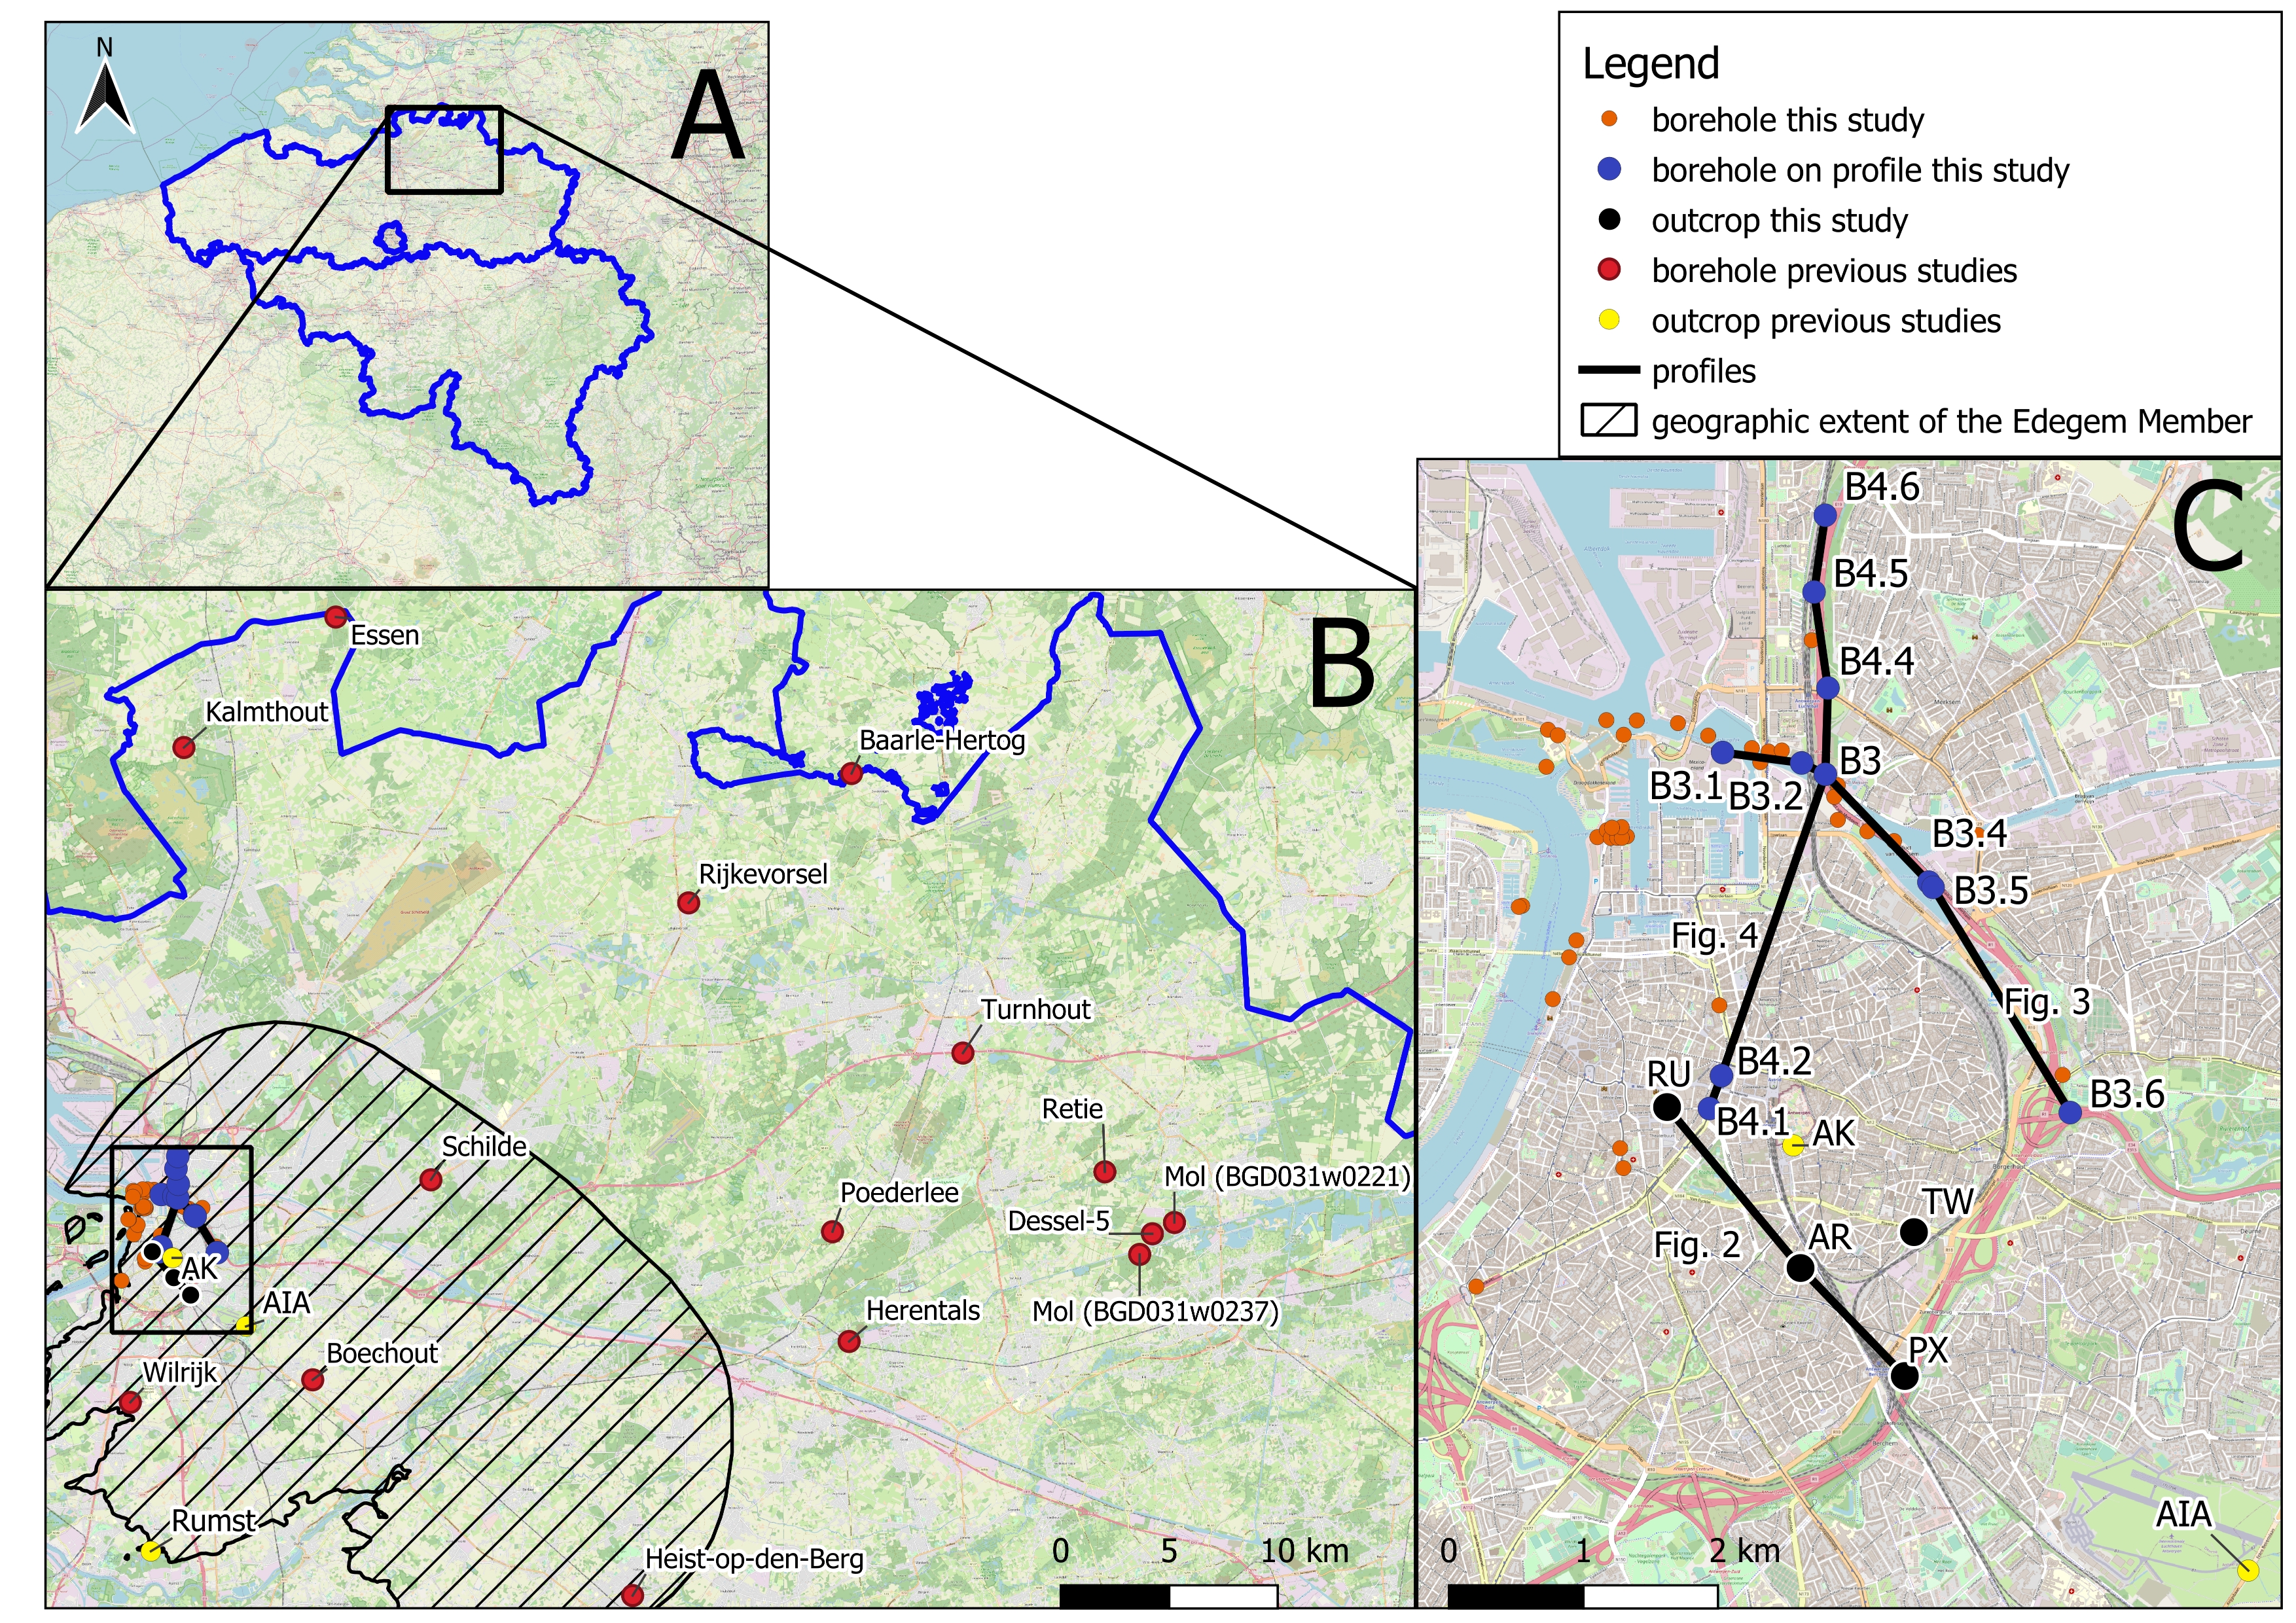
Figure 1. A. Location of the study area in the northern Belgium. B. Overview on the Antwerp Campine area with the location of the study area around the City of Antwerp (see section C of this figure), as well as the different boreholes (orange dots) analysed for granulometry and glauconite content in Verhaegen (2020) and Adriaens (2015), respectively. The geographic extent of the Edegem Member (Berchem Formation) as modelled by Deckers et al. (2019) is also shown. C. The City of Antwerp with the location of the sampled temporary exposures (black dots) and boreholes (orange and blue dots) and the profiles of Figures 2, 3 and 4. Blue dots represent boreholes with analysed samples that are shown on Figures 3 and 4. AIA = Antwerp International Airport; AK= Kievitstraat; AR= Argenta; PX= Post X; Ru= Rubenshuis; TW= Tweelingenstraat.
2.1. Studied interval
3While the entire Kiel Member is covered by this study, only the lower part of the overlying Antwerpen Member is studied here. The entire Antwerpen Member reaches a maximum thickness of up to 8 m in northeastern Antwerp. From there, the top of the Antwerpen Member is truncated in southern direction by Quaternary strata (Deckers & Everaert, 2022), in western direction by the Kattendijk Formation (Deckers & Louwye, 2020) and in eastern direction by the Diest Formation (Deckers & Goolaerts, 2022). So instead of the maximal value of 8 m, the Antwerpen Member is generally less than 4 m thick in the City of Antwerp. Erosion typically cuts into the Antwerpen Member down to a compact shell bed, the so-called S3 - Glycymeris crag in Deckers & Everaert (2022). This massive shell bed is continuously present from north to south in eastern Antwerp. In this study, we will informally refer to the lower and upper Antwerpen Member as those sections located below and above the base of the S3 - Glycymeris crag. The compact nature of this shell bed probably made it more resistant against erosion compared to the overlying, upper part of the Antwerpen Member and thereby protected the underlying, lower part of the Antwerpen Member from erosion (Deckers & Everaert, 2022; Deckers & Goolaerts, 2022). Consequently, analyses of samples of the Antwerpen Member are overwhelmingly from its lower part.
2.2. Temporary exposure samples
2.2.1. Sample selection and interpretation
4Everaert et al. (2020) interpreted the Kiel Member and Antwerpen Member in the Post X (DOV TO-20150701), Argenta (DOV TO-20190417) and Tweelingenstraat (DOV TO-20191211) temporary exposures in the City of Antwerp (Figs 1 & 2). Nine samples were collected from key horizons of these temporary exposures. Given the palaeontological focus of their study, most samples were specifically taken from informal fossiliferous horizons, such as the Glycymeris-Cyrtodaria (TW2 and AR4) and Cordiopsis horizons (AR8 and PX2) of the Kiel Member and the base and basal shell bed of the Antwerpen Member (PX4 and AR10) and the Haustator eryna phosphatic horizon (AR12 and PX5).
5During the summer of 2022, the Kiel and Antwerpen members were interpreted in an additional temporary exposure at the Rubenshuis (DOV TO-20220706-1), in the centre of Antwerp. Six samples were analysed for this study, three across each member. In contrast to the samples from Everaert et al. (2020), most of the analysed samples from the Rubenshuis temporary exposure were taken from the fine sand in between the fossiliferous horizons, to avoid sampling bias.
6In this study, all the temporary exposure samples from the Antwerpen Member are taken from its lower part. The samples from the Kiel Member are also restricted to its uppermost 4 m.
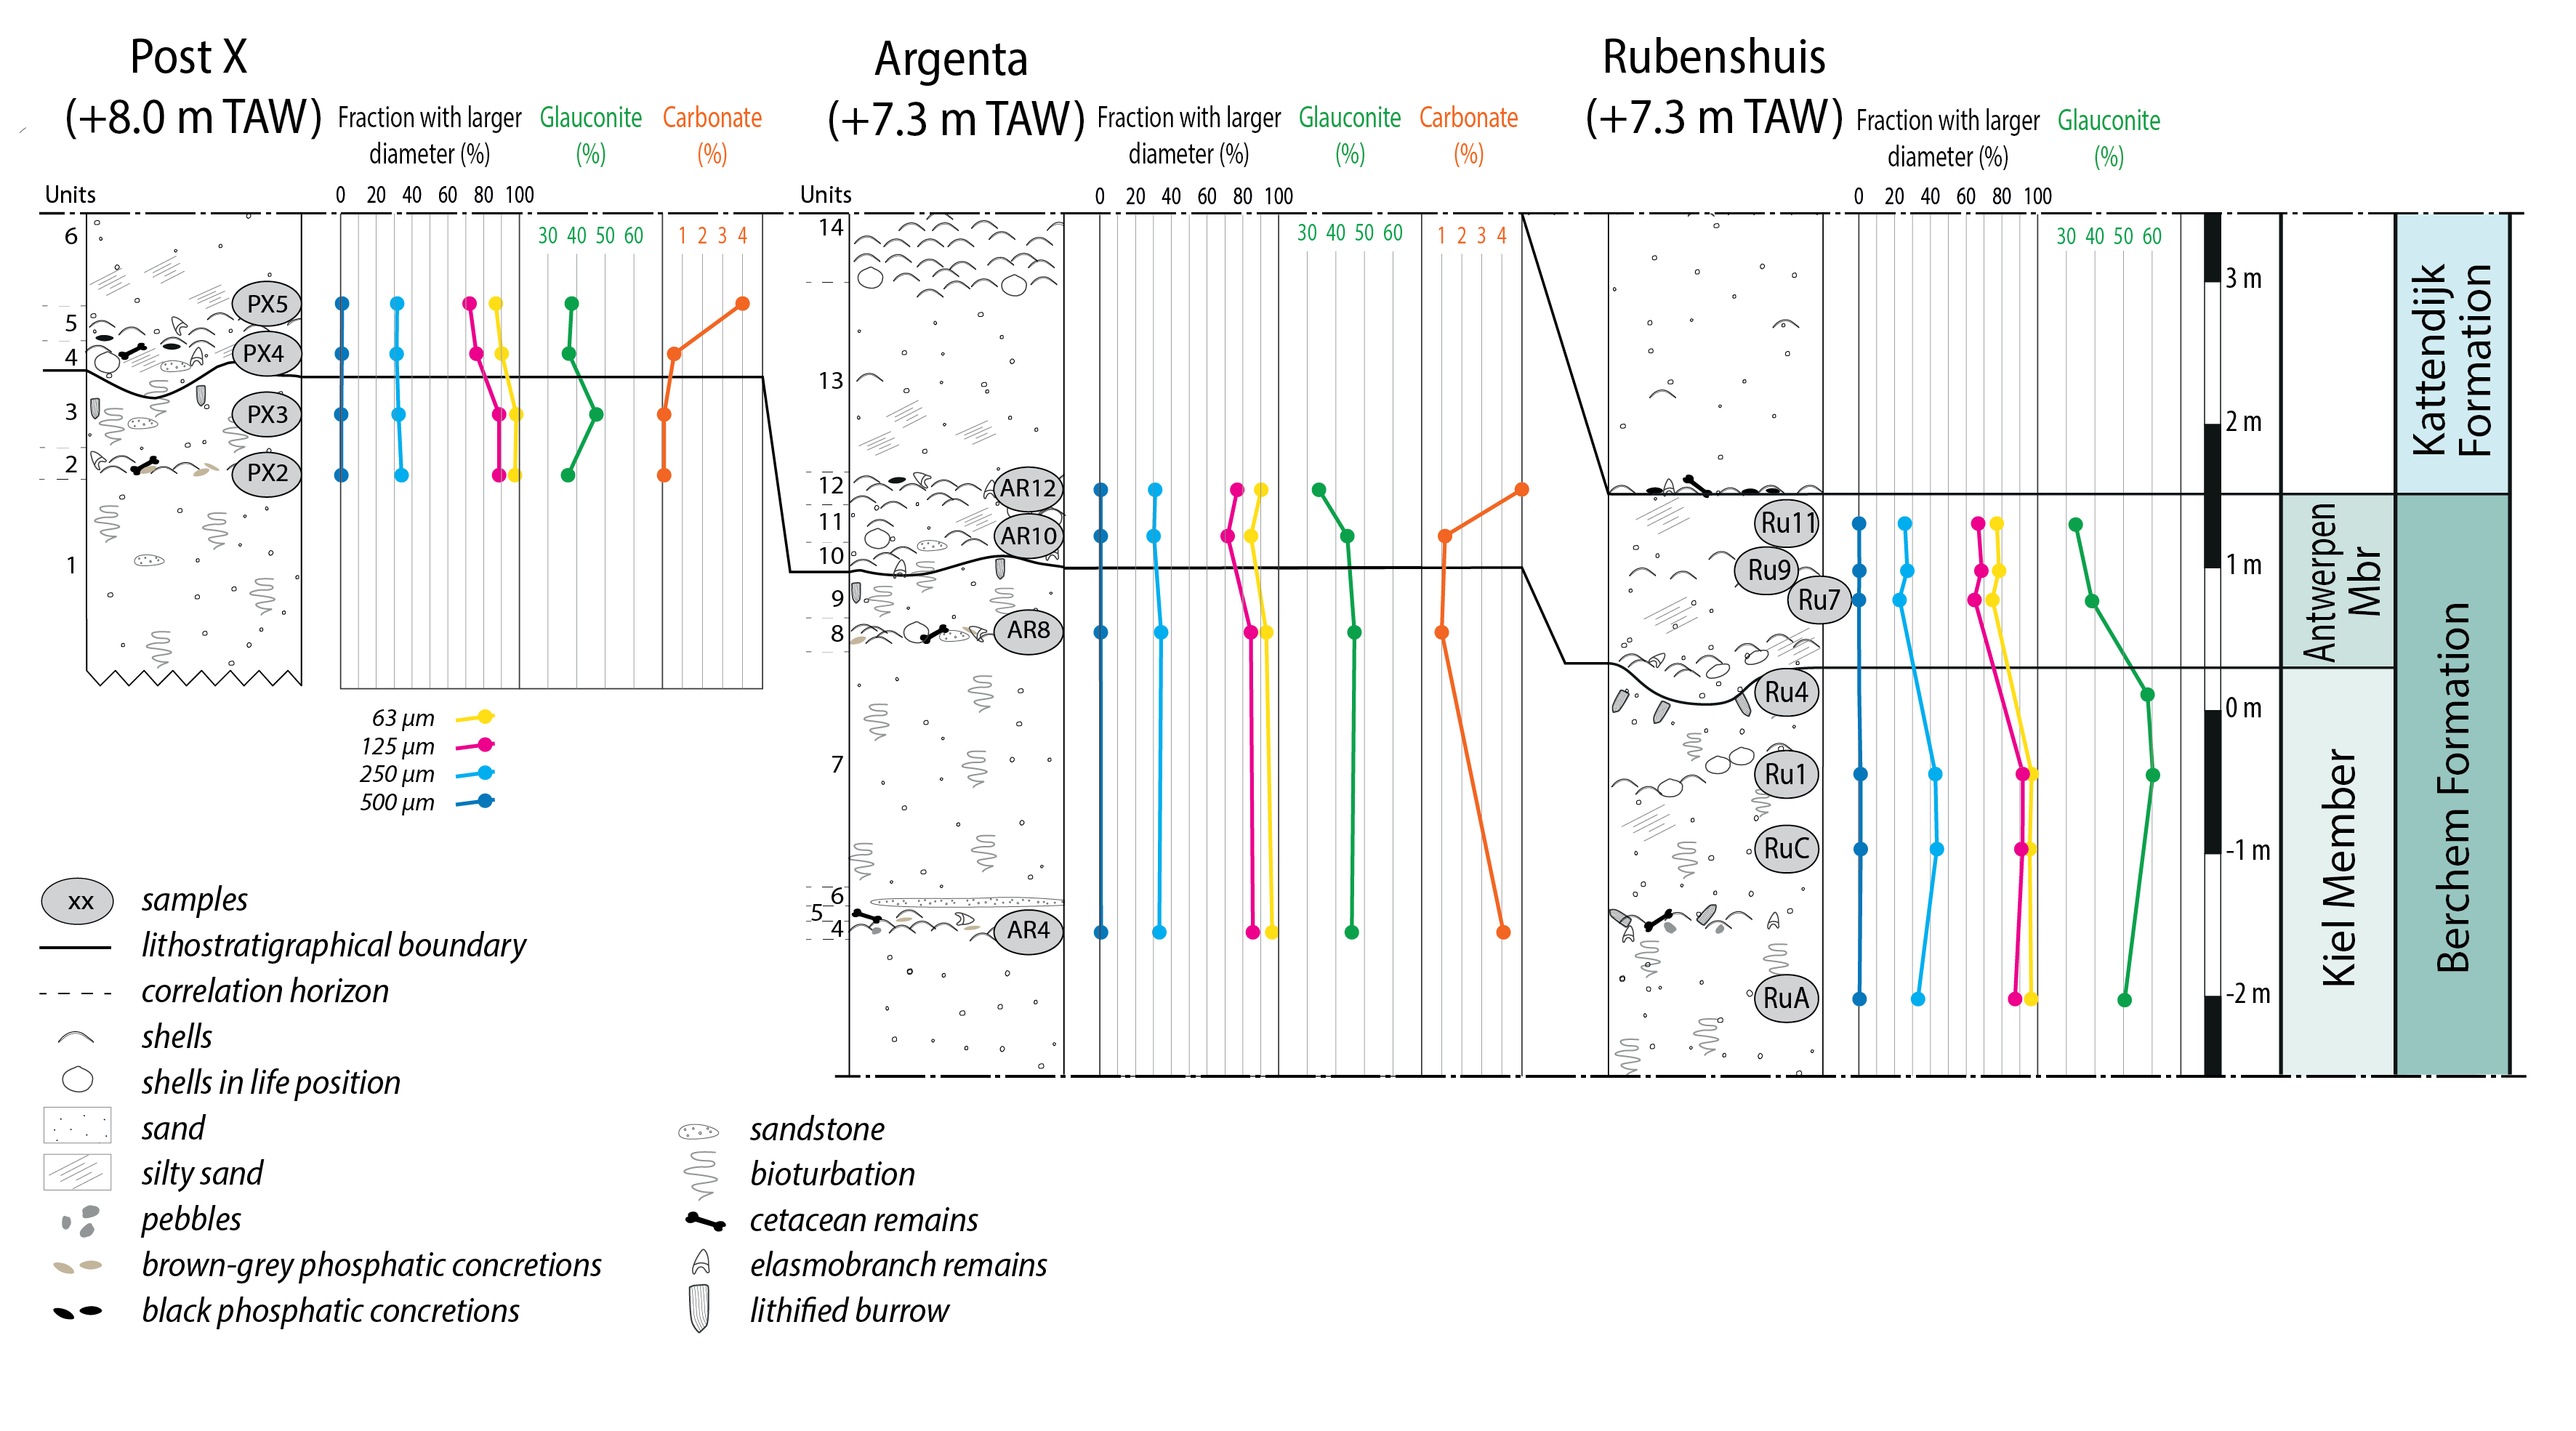
Figure 2. Lithology and lithostratigraphy of the Post X (DOV TO-20150701) and Argenta (DOV TO-20190417) temporary exposures after Everaert et al. (2020) and that of the Rubenshuis (DOV TO-20220706-1) by this study. Granulometric, carbonate and glauconite analyses from samples of this temporary exposure by this study are shown next to the lithological drawings. No carbonate analyses were performed for the Rubenshuis temporary exposure. Notice the slight but systematic increase in fine fraction (<125 µm) across the boundary between the Kiel and Antwerpen members. For location, see Figure 1.
2.2.2. Type of analyses
7Granulometric analysis was performed by laser diffraction (using Fritsch Analysette A-22 NeXt with ultrasone dispersion and modelled using Mie theory) after dispersion in water. Glauconite measurements were separately performed by magnetic separation of the >63 µm fraction (using Frantz Isodynamic Magnetic Separator). Total inorganic carbon (TIC) analysis was performed by chromatography. A first subsample was treated with hydrochloric acid to remove the inorganic carbon content. The subsample was then heated to 1600–1800 °C and the resulting organic carbon content (TOC) was measured by chromatography. Subsequently, a second subsample was analysed but then without prior treatment with hydrochloric acid to retrieve the total amount of carbon (TC). The difference between both measurements results in the amount of inorganic carbon (TIC = TC - TOC). In the sediments of the Berchem Formation, TIC correlates with CaCO3 and can be converted to carbonate content.
8Figure 2 shows the results of the granulometric, carbonate and glauconite analyses next to the lithologs of the temporary Post X, Argenta and Rubenshuis exposures. The drawings from the Post X and Argenta sections were taken from Everaert et al. (2020).
2.3. Borehole samples
2.3.1. Sample selection and interpretation
9First, a selection was made from the DOV-database of all boreholes near the city of Antwerp with samples from the Berchem Formation that were analysed on granulometry, carbonate and/or glauconite content. This selection was completed with new analyses from recent studies for the Flemish Government to characterize the Quaternary and Neogene sediments in the Antwerp region (De Koninck et al., 2022) and to start a reference database of sediment parameters of Flemish stratigraphic units (Verhaegen, 2022). Next, the lower to middle Miocene Edegem, Kiel and Antwerpen members of the Berchem Formation and the unconformably overlying lower Pliocene Kattendijk Formation were interpreted within these boreholes as part of a recent modelling exercise of the area by Van Haren et al. (2021). The most helpful criterion to distinguish the Kiel and Antwerpen members was the presence of abundant shells and/or carbonate in the Antwerpen Member versus the general lack or strong scarcity thereof in the Kiel Member. In addition, the Antwerpen Member was generally described as more clayey compared to the Kiel Member. Sometimes a colour change was also noted from a dark (often near black) Kiel Member towards a less dark (mainly dark green) Antwerpen Member.
10The boundary between the Kiel Member and the subjacent Edegem Member, i.e. the lowermost member of the Berchem Formation, was generally picked at the re-appearance of shells (generally described as “fine shell grit”, the species dominating the shell content in the Edegem Member differ from the dominant species in the overlying members) and/or carbonate combined with an increase in clay content and change of the sediment colour (often from dark grey or black towards grey). To support the often difficult interpretation of the boundary between the Kiel and Antwerpen members in the selected boreholes, nearby electric CPTs (distance generally <100 m) were also interpreted and correlated to the boreholes. Deckers & Everaert (2022) namely showed that the boundary between the Kiel and Antwerpen members was easily picked at a consistent upward drop in qc values on CPTs. Deckers & Louwye (2020) furthermore showed that the boundary with the superjacent Kattendijk Formation coincides with a strong upward decrease in Rf values.
11Figures 3 and 4 provide illustrations of boreholes with analysed samples for the Kiel Member and lower Antwerpen Member. The CPTs nearby the borehole, which were very helpful at interpreting these boreholes, are also shown. Figure 3 shows a roughly E-W profile located in northern Antwerp City area. Figure 4 shows a roughly N-S profile from the city centre up to the north of the city.
12For the Kiel Member, we collected 87, 66 and 16 sample analyses of granulometry, carbonate and glauconite content respectively. For the superjacent and thinner developed lower Antwerpen Member, we collected 43, 28 and 16 sample analyses of granulometry, carbonate and glauconite content respectively.
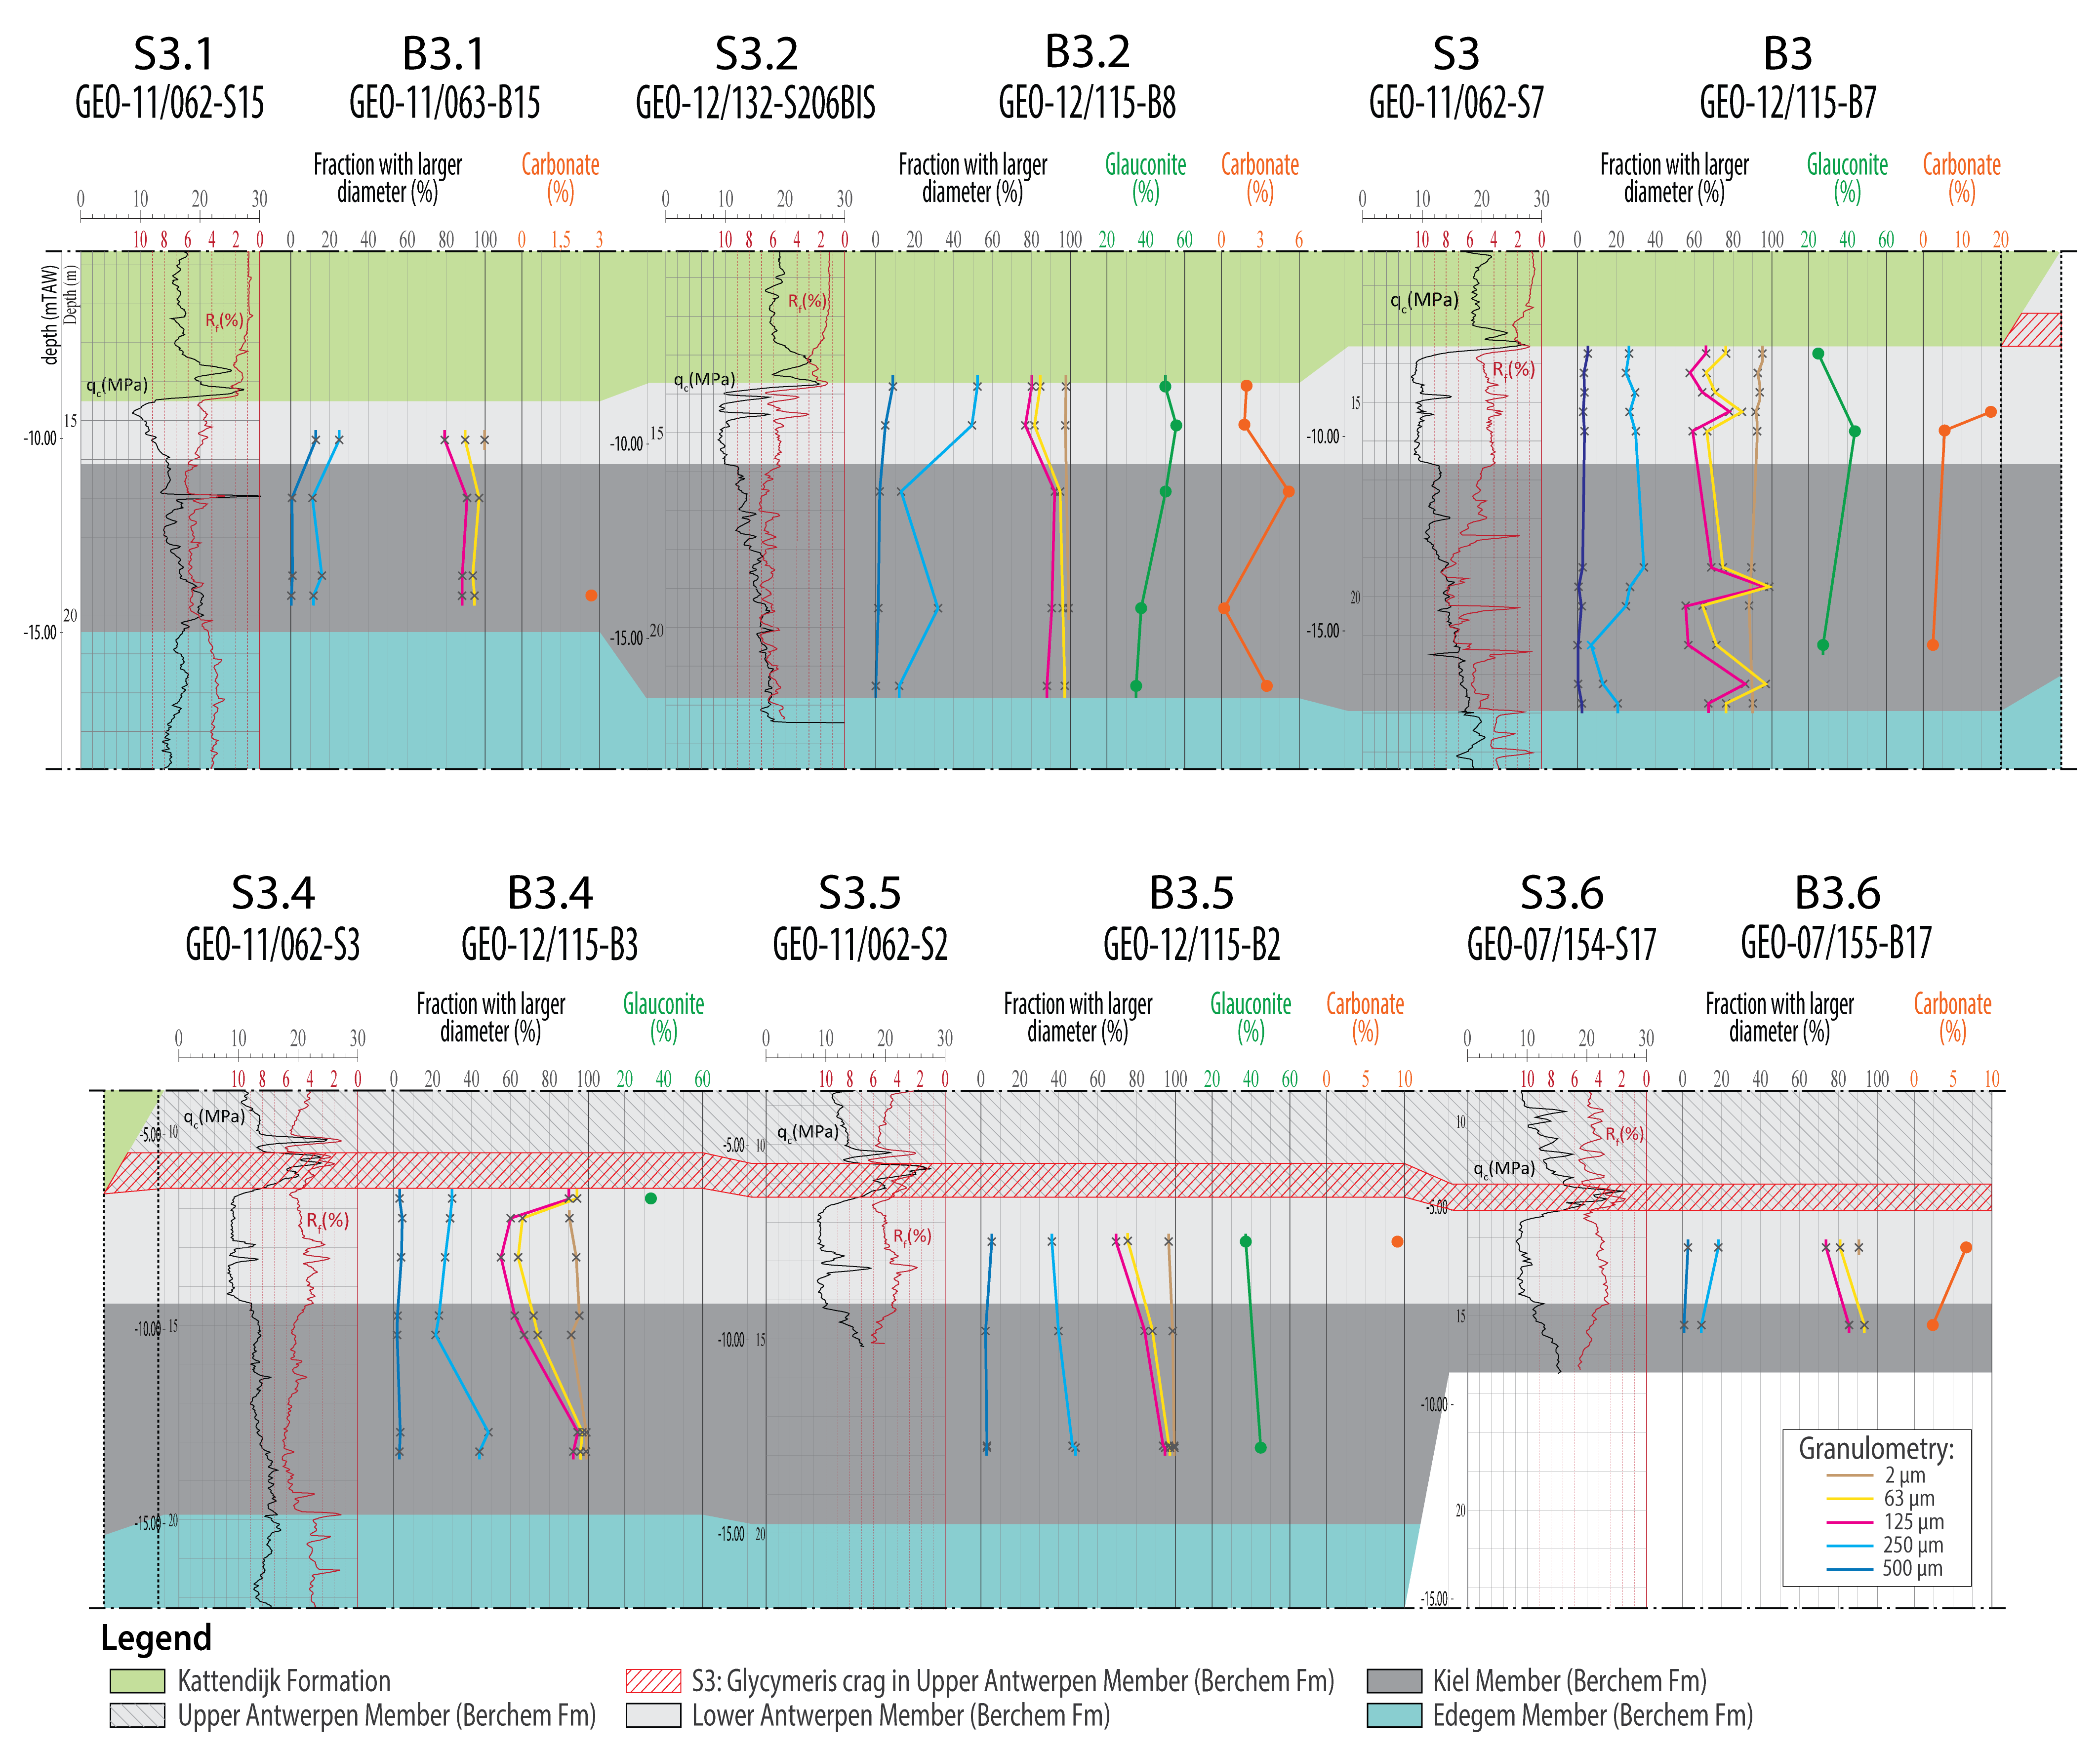
Figure 3. Granulometric and, if available, also carbonate and glauconite analyses from sampled boreholes along an E-W profile in the northern City of Antwerp area. The qc and Rf values of the CPTs located next to the boreholes are also shown. The profile was flattened at the base of the Antwerpen Member. For location, see Figure 1.
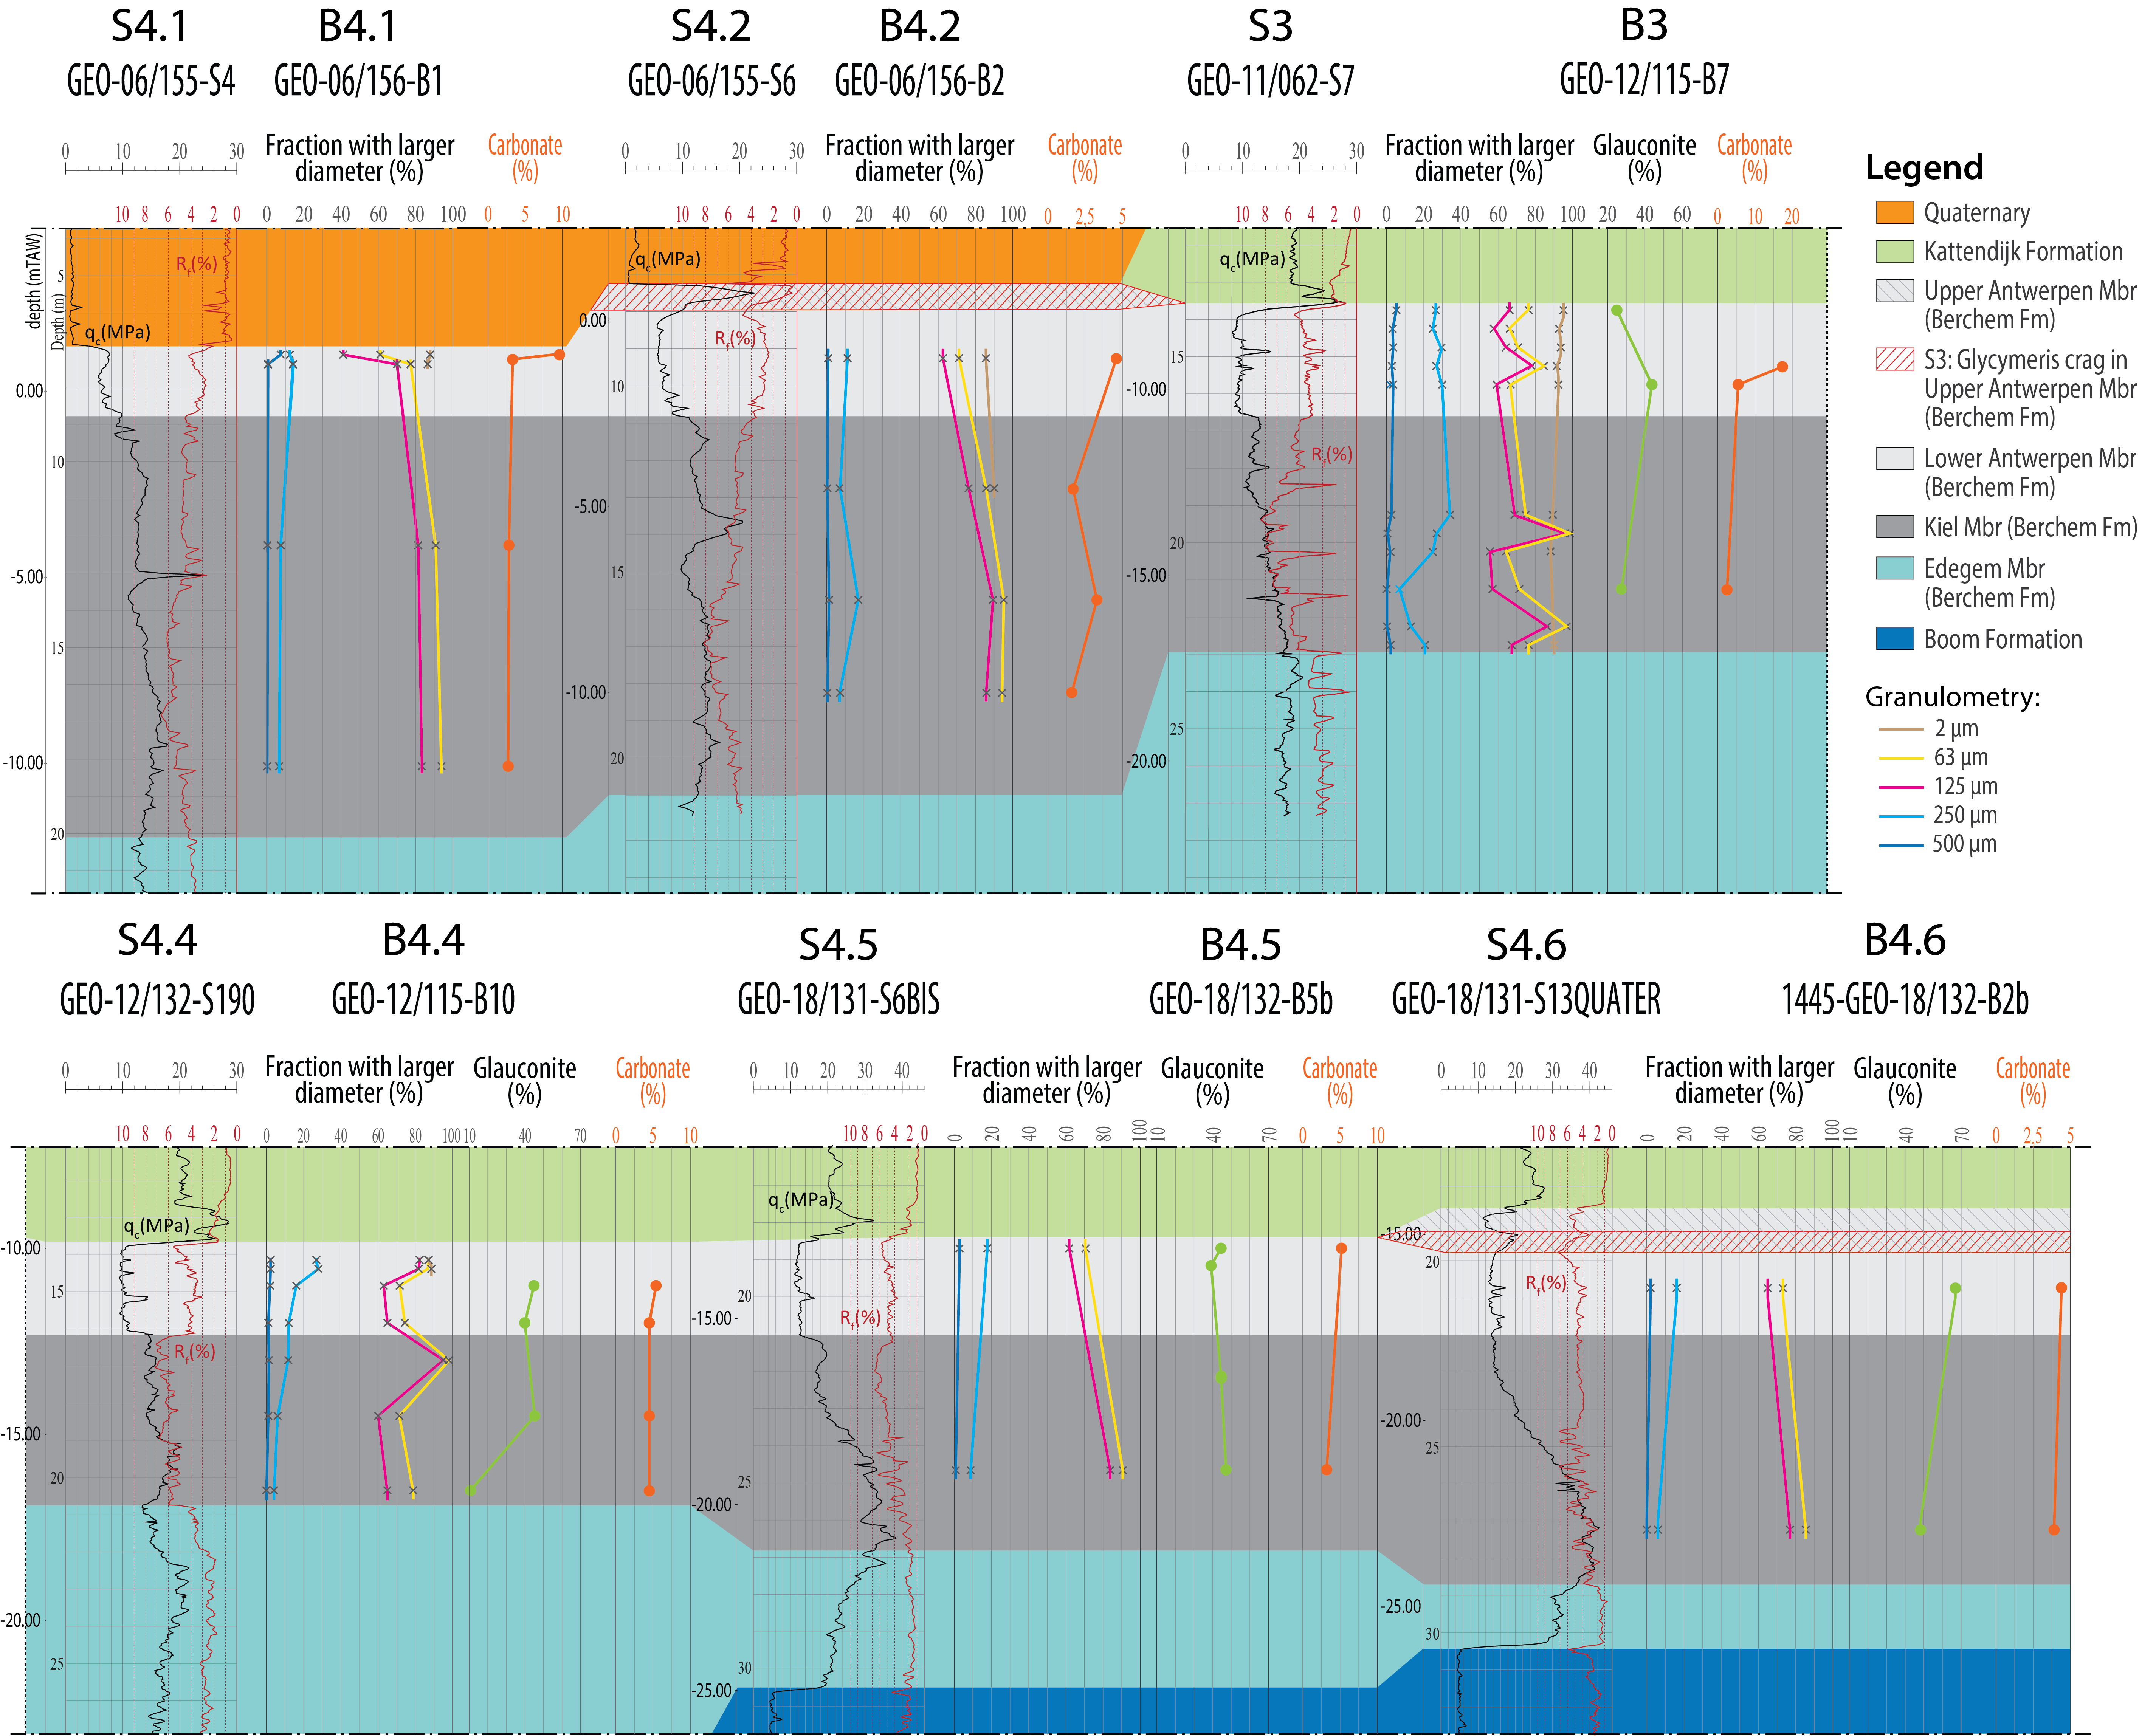
Figure 4. Granulometric and, if available, also carbonate and glauconite analyses from sampled boreholes along a N-S profile across the City of Antwerp. The qc and Rf values of the CPTs located next to the boreholes are also shown. The profile was flattened at the base of the Antwerpen Member. For location, see Figure 1.
2.3.2. Type of analyses
13The existing DOV database contains the results of granulometric analyses. Data are presented as tables including diameters and corresponding sample fractions. Classically, the grain size of sediment samples is determined by the sieve method for the coarse fractions (>63 µm) and by the hydrometer method, based on the ‘Stokes’ sedimentation rates, for the finer fractions. Alternatively, the complete grain-size range can be determined by laser diffraction.
14Depending on which standard (e.g. NBN EN ISO 17892-4 or NEN-EN 12697-2) and related sample preparation technique is used for the sieve/hydrometer method, different diameters are measured. A fairly large amount of sediment is needed for sieving. In the laser diffraction method, the complete grain-size range is measured at once, and only a very small amount (usually 2 g) is needed for the analysis. Results are reported as mass percentages for the sieve/hydrometer method, whereas laser diffraction results are reported as volume percentages. For samples with a low organic matter content (as is the case for the sediments of the Berchem Formation), it is possible to compare these results. However, there is a discrepancy between the amount and distribution for the finer fractions that are reported by the two techniques. Laser diffraction can give slightly coarser mean grain sizes than sieve/hydrometer analysis. This can be attributed to the non-sphericity of sediment particles (Konert & Vandenberghe, 1997). In this study, we have three samples that are analysed using both methods. Mean grain-size differences between both methods are small, but mean grain size is higher for laser diffraction as opposed to sieve/hydrometer analysis. When studied in more detail, the main difference is found in the fine and medium sand ranges: the sieving results systematically return higher percentages of fine sand and lower percentages of medium sand when compared to the laser diffraction results.
15Since changes in grain-size distribution between the different members of the Berchem Formation are subtle, it is therefore recommended to interpret the results of both techniques separately, at least in the grain size ranges where the differences are significant.
16Unfortunately, the sieve diameters that were used are not uniform throughout all samples, which somewhat hinders the comparison between the different samples. Therefore, the diameters were made uniform by using linear interpolation. For many of the sieve/hydrometer method samples, only sieved fractions are available, so for insights in the fraction <0.063 mm, we rely on laser diffraction samples.
17Carbonate content can be determined using different techniques. In most cases, dissolution of the carbonates by reaction with hydrochloric acid or hydrogen peroxide is used. Alternatively, the carbonate content can be determined using TOC/TIC analyses. This type of analysis is mostly used in combination with grain-size distribution analysis by laser diffraction.
18Glauconite content results are comparable with those of the temporary exposure samples, with glauconite measured in the sand fraction (between 1 mm and 63 µm) and recalculated according to the total sample weight. The fraction below 63 µm is known to be glauconite bearing, but few analyses on this fraction are available.
3. Results from the analyses
3.1. Results from the temporary exposure analyses
19Figure 2 provides an overview on the results of all analyses on the temporary exposures. Figure 5 shows the grain-size distributions of all the samples by their cumulative frequency. Table 1 provides an overview on different grain-size parameters per sample.
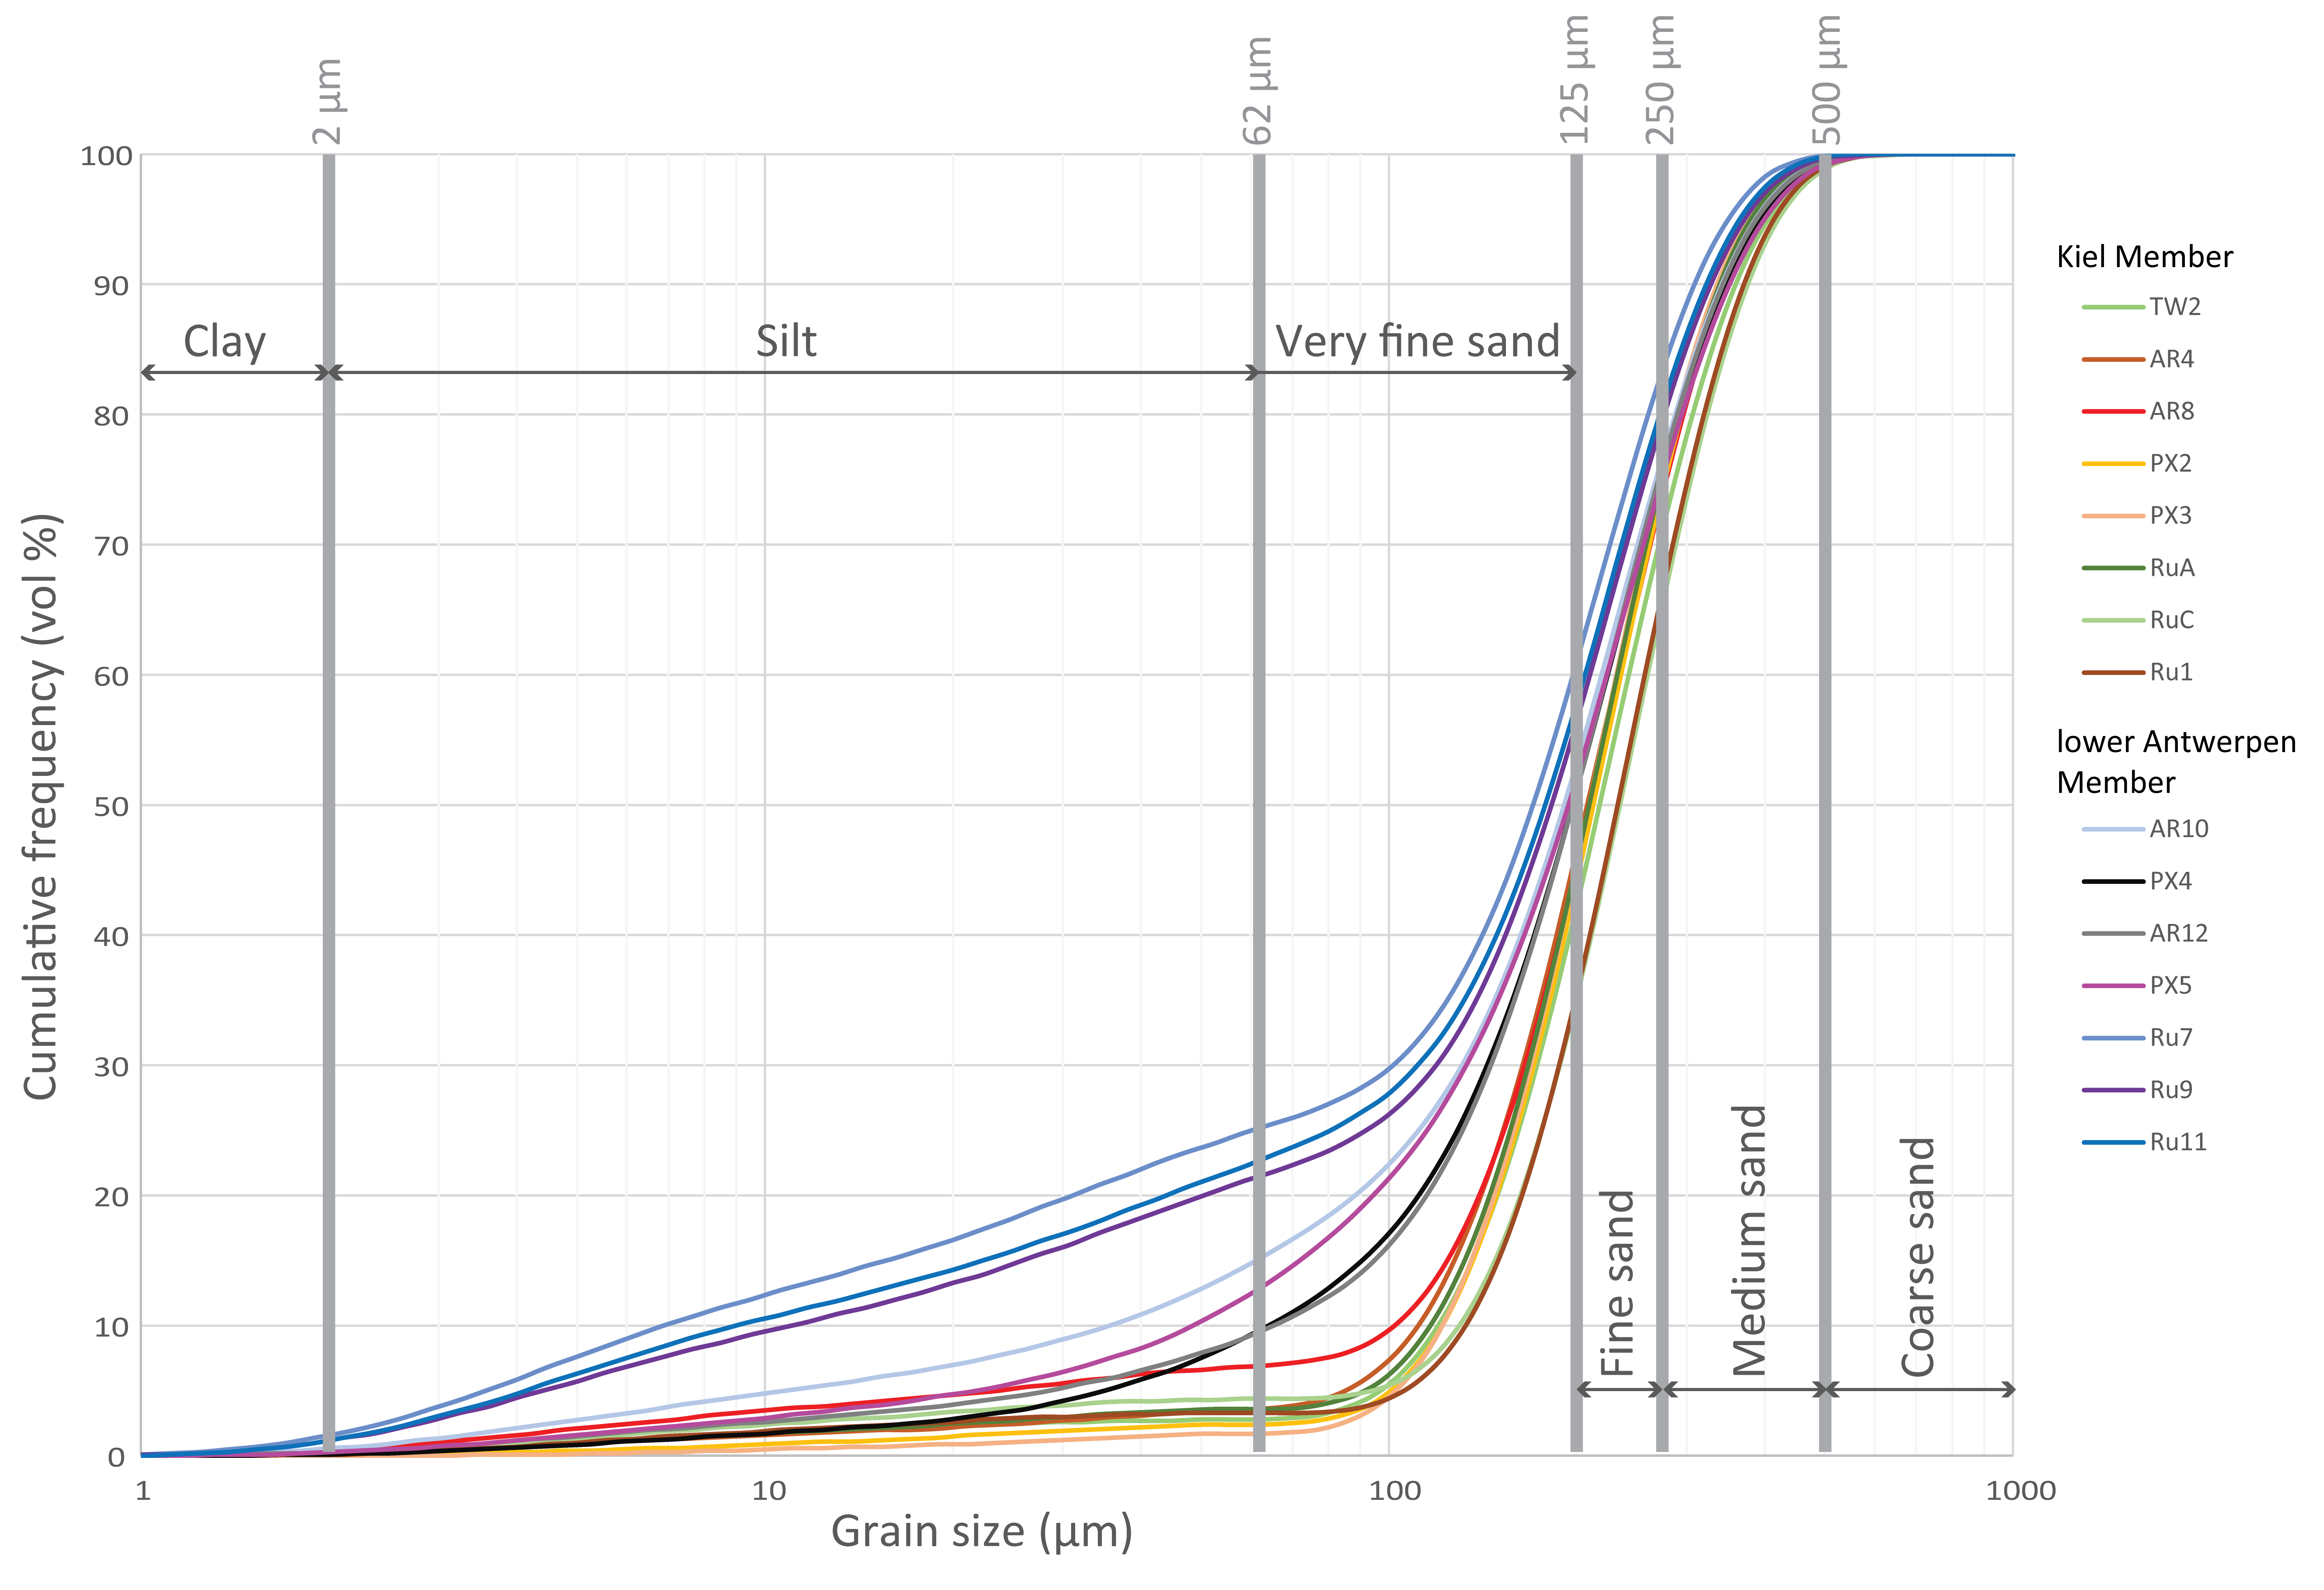
Figure 5. Cumulative frequency curves for grain-size distributions of the samples taken from temporary exposures of the Kiel Member and lower Antwerpen Member based on laser diffraction analyses. To make a clearer visual distinction, the measurements of the lower Antwerpen Member are in blue/black/pink and purple colours. Notice the higher silt and very fine sand fractions for samples taken from the lower Antwerpen Member compared to the Kiel Member. The Kiel Member then again shows a higher fine to medium sand fraction.
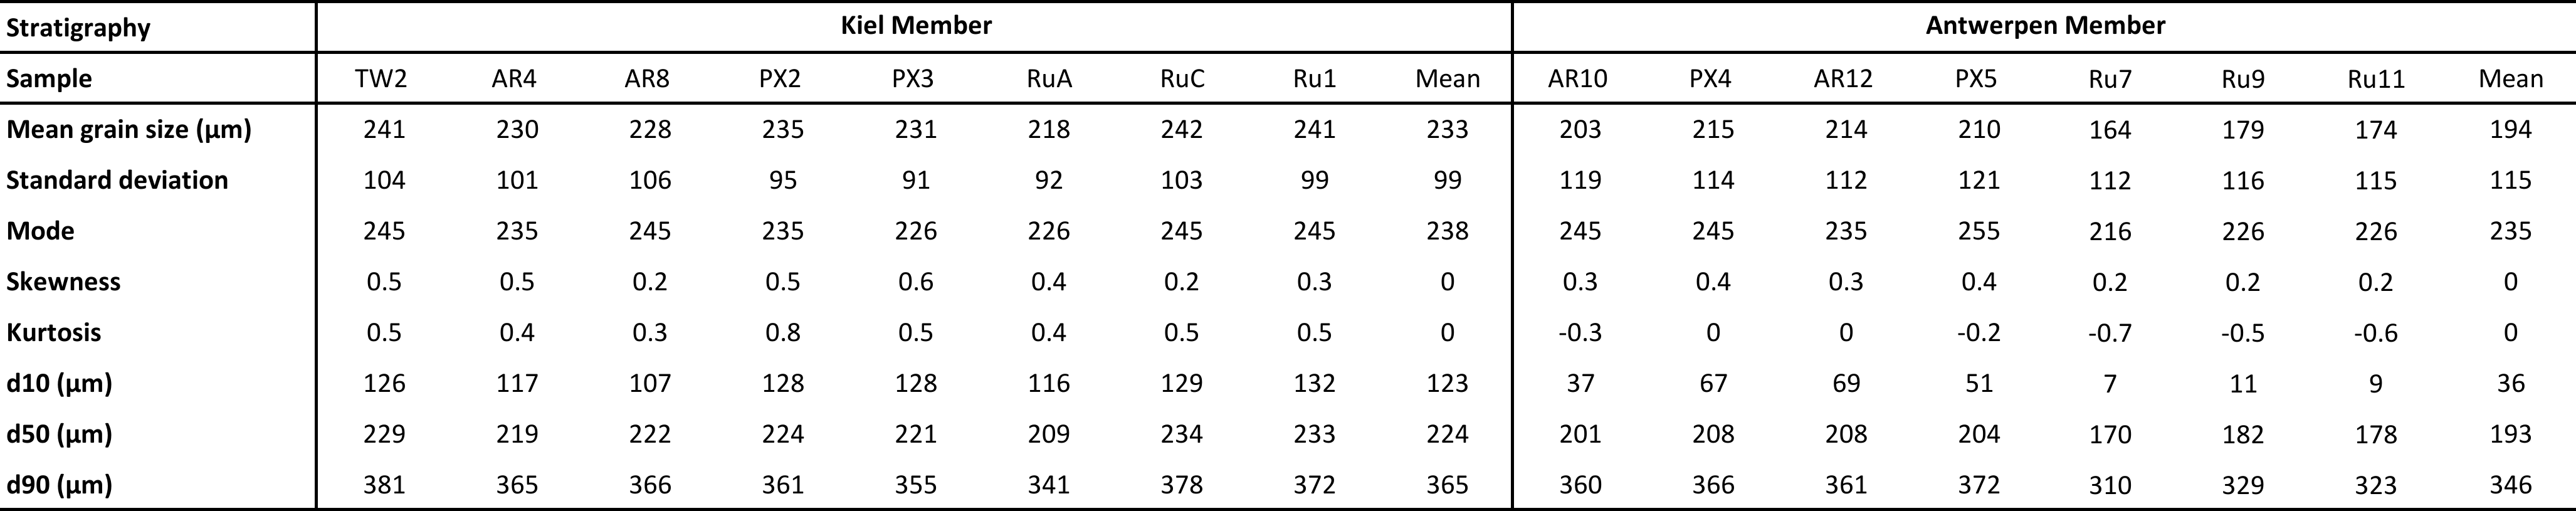
Table 1. Overview on different grain-size parameters for the analysed temporary exposure samples per stratigraphic unit. AR= Argenta; PX= Post X; Ru= Rubenshuis; TW= Tweelingenstraat.
3.1.1. Granulometry by laser diffraction
20The grain sizes were measured on a total of 15 samples taken from all the temporary exposures, eight from the Kiel Member and seven from the lower Antwerpen Member. The analyses were performed on grain sizes below 1000 µm. The coarse sand and coarser fraction as well as the clay fraction each compose less than 1% of the Kiel and lower Antwerpen members. The medium and fine sand fractions are higher for the Kiel Member (36% and 52%, respectively) compared to the lower Antwerpen Member (28% and 42%, respectively). The finest sand and silt fractions are lower in the Kiel Member (8% and 3%, respectively) than in the lower Antwerpen Member (12% and 16%, respectively). Therefore, the <125 µm fraction of the Kiel Member is less than half that of the lower Antwerpen Member (11% vs 28%). This is clearly expressed in the much smaller d10 percentile of the lower Antwerpen Member compared to the Kiel Member (average 36 µm versus 123 µm; Table 1). Figure 5 shows that the turnover point lies near 115 µm, with the Kiel Member and lower Antwerpen Member relatively enriched in the fraction above and below this value, respectively.
3.1.2. Carbonate content
21Carbonate content analyses were performed on the samples of the Argenta, Post X and Tweelingenstraat temporary exposures. A total of nine samples was analysed, five from the Kiel Member and four from the lower Antwerpen Member. All samples from these temporary exposures, besides PX3 and PX5, are taken from shell-bearing horizons, and are therefore definitely not representative for the overall carbonate content of the member they belong to. The samples show different trends for the different exposures. In the Post X exposure, the carbonate content of the two samples taken from the Kiel Member (PX2 and PX3) was below the measuring limit of 0.083%, while the carbonate content of the two samples taken for the lower Antwerpen Member (PX4 and PX5) was higher (0.58% and 4%). The latter two samples show a clear difference between a horizon with and without shells. In the Argenta exposure, then again, the carbonate content showed no major difference between the samples of the Kiel and lower Antwerpen members. The carbonate content of the temporary exposure samples is measured by chromatographic analysis of the TIC content which tends to give lower values than more traditional analysis methods using hydrochloric acid or hydrogen peroxide.
3.1.3. Glauconite content
22Glauconite content was measured on a total of 14 samples taken from all the temporary exposures, eight from the Kiel Member and six from the lower Antwerpen Member. Analyses show overall high glauconite percentages, ranging between 34% and 60% (Fig. 2). Values for the eight samples within the Kiel Member range between 37–60%, and those for six samples in the Antwerpen Member between 34–44%. The average glauconite content for the Kiel Member and lower Antwerpen Member is 49% and 38%, respectively. There is no consistent trend of changing glauconite content within the members. In the Rubenshuis temporary exposure, the glauconite values of the Antwerpen Member are markedly lower compared to those in the Kiel Member, the latter are also clearly higher than for the Kiel Member in the other outcrops. An important observation is that even for correlative horizons sampled in different temporary exposures, such as AR8 and PX2, values can differ by 10%. This shows that there is a larger variation of glauconite content within both members than in between them.
3.2. Results from the borehole analyses
3.2.1. Granulometry
23Granulometric analyses on borehole samples were done by both laser diffraction and sieving. Some of these boreholes are shown in Figures 3 and 4. An overview of all the borehole analyses for this study is given in the Supplementary material. The grain sizes were measured on a total of 130 borehole samples, 87 from the Kiel Member and 43 from the lower Antwerpen Member. The coarse sand and coarser fractions (>500 µm) are generally low with values of around 5% for the lower Antwerpen member and of <2.5% for the Kiel member. In the medium sand range, according to laser diffraction, there is no significant granulometric difference between the Kiel Member and lower Antwerpen Member (32% vs 30%). Results obtained by sieving, then again, show a significant difference in this range with average values of only 7% for the Kiel Member and 14% for the lower Antwerpen Member. Fine sand represents the largest fraction of the grain-size distribution and also shows large internal variation between different measuring techniques. For example, based on either laser diffraction or sieving, the fraction between 125–200 µm is 26% or 55.7%, respectively for the Kiel Member and 17% or 32%, respectively for the lower Antwerpen Member. Although results vary significantly depending on the analytical technique that is used, they all show that the main granulometric difference between the lower Antwerpen Member and the Kiel Member for the fine sand fraction is situated in the grain-size range 125–200 µm, which has a content that is around twice as high in the Kiel Member compared to the lower Antwerpen Member. The very fine sand fraction is on average 7.5% for both members, with the laser diffraction results somewhat lower than those done by sieving. The combined clay and silt fraction is on average 13% for the Kiel Member and 25% for the lower Antwerpen Member. Further differentiation of the silt and clay fractions was performed by laser diffraction analyses only and showed values of 9% and 3.9%, respectively for the Kiel Member and values of 20.5% and 5.2%, respectively for the lower Antwerpen Member.
3.2.2. Carbonate content
24The carbonate content was measured on a total of 94 borehole samples, 66 from the Kiel Member and 28 from the lower Antwerpen Member. In both members, it ranges from very low values (0.2%) to very high values (59.5%). The majority of samples show values ranging between 0.2% and 6.7%. On top of this range, samples with >9% carbonate content are present which consistently correlate with intervals described as containing shell fragments or grit. If we only consider the values up to 6.7%, i.e. excluding the shell beds, the average carbonate content is 3% for the Kiel Member and 4.2% for the lower Antwerpen Member. The lowest value measured in the Kiel Member is 0.2% and in the lower Antwerpen Member 1.8%. Within individual boreholes, the values are consistently lower for the Kiel Member than for the lower Antwerpen Member.
25The methods used for determining carbonate content are not always known in the DOV database. If known, hydrochloric acid or hydrogen peroxide is mostly used. Only a few samples were measured by chromatographic analysis of the TIC content. Carbonate contents measured by chromatography seem to be lower than those measured by hydrochloric acid or hydrogen peroxide. However, there are no samples on which both techniques were applied, which hinders any reliable comparison of the influence of the applied techniques on the measured carbonate content.
3.2.3. Glauconite content
26The glauconite content was measured on a total of 32 borehole samples, 16 from the Kiel Member and 16 from the lower Antwerpen Member. Overall, it shows a very broad range, from as low as 10% to as high as 67%. Within the Kiel Member, it ranges from 10% to 50%, and in the lower Antwerpen Member from 13% to 67%. No consistent change in glauconite content was observed across the boundary of both members. For the Kiel Member, an overall trend of decreasing glauconite contents can be observed from the uppermost 3 m downwards (Fig. 6).
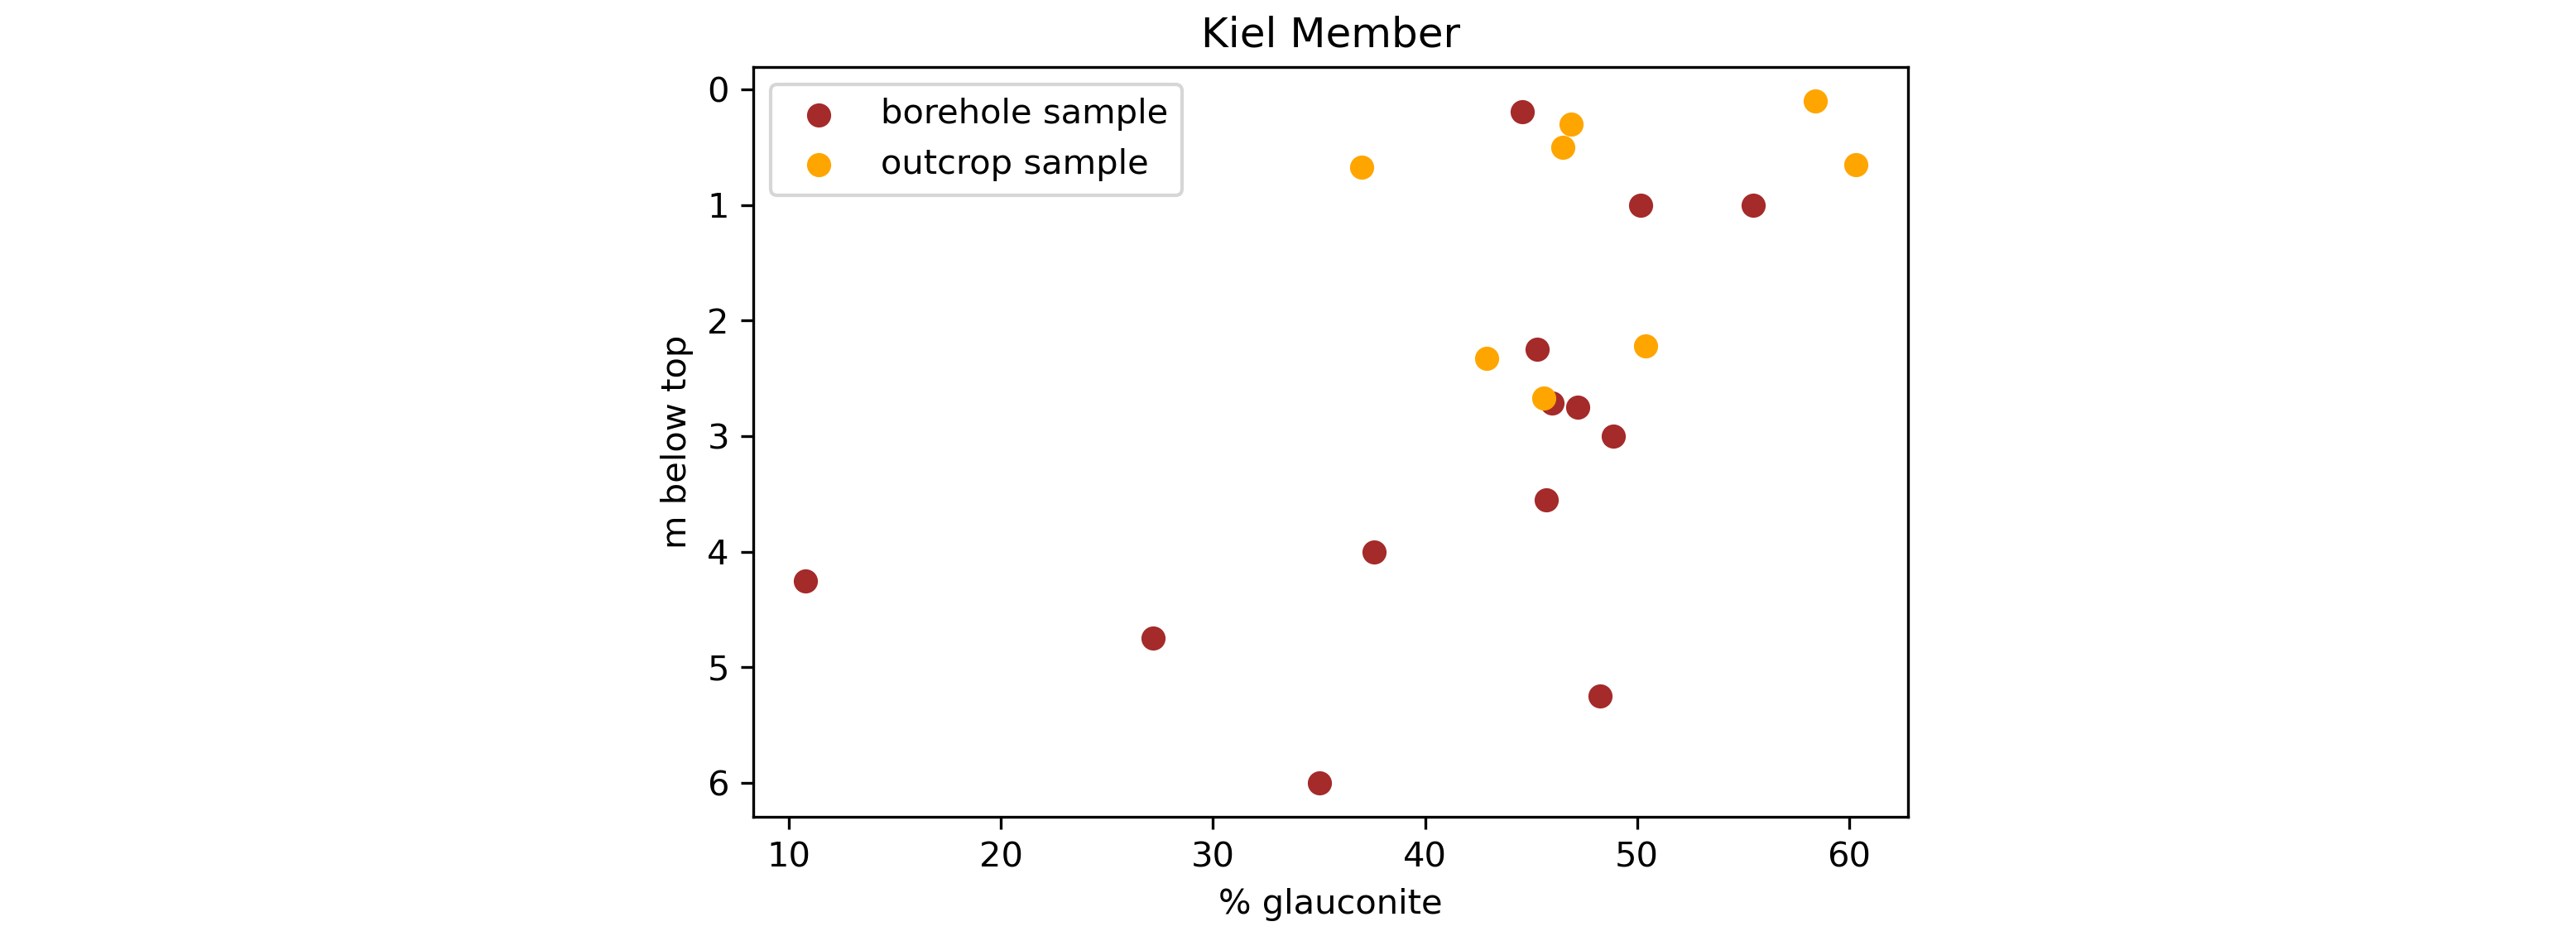
Figure 6. Glauconite content measured for the Kiel Member, compared to the depth of the sample below the top of the Kiel Member. Notice a general trend of decreasing glauconite content with larger distance from the top of the Kiel Member.
4. Discussion
4.1. Distinguishing the Kiel and Antwerpen members on granulometry, carbonate and glauconite content in their type area
27The analyses of temporary exposures and boreholes are consistent and show that the main characteristics to distinguish the Kiel Member and lower Antwerpen Member, based on grain-size data, are two-fold:
28(1) The silt fraction in the lower Antwerpen Member is twice that of the Kiel Member.
29(2) The smaller fraction of grains below 125 µm in the Kiel Member is compensated by a significantly higher fine sand fraction (specifically in the range 125–200 µm) compared to the lower Antwerpen Member.
30As a result of these trends, the mean grain size of the Kiel Member is larger than that of the lower Antwerpen Member. Their mode is, then again, on average very similar for the samples of the temporary exposures (Table 1).
31The results show that the clay fraction is low and fairly similar in both members. In the temporary exposure analyses it is below 1% for both members. In borehole analyses, it is on average 3.9% for the Kiel Member and 5.2% for the lower Antwerpen Member. The clay content is therefore significantly higher in boreholes compared to temporary exposures. This could be the result of the crushing of the abundantly present glauconite into the clay fraction during drilling (in case of disturbed samples) of the boreholes. The glauconite in the Berchem Formation is indeed known as easily crushable under pressure, which can—according to laboratory analyses—result in increases in the clay content by 20% (Van Alboom et al., 2012).
32Another granulometric difference with the temporary exposure analyses is the relatively higher coarse sand fraction in the borehole samples of the lower Antwerpen Member, especially based on analyses with sieving. This is probably due to shell fragments that are not completely dissolved after decalcification process and thereby contribute to the coarse fraction of the Antwerpen Member, whereas these shells are rare or absent in the Kiel Member and therefore do not contribute to its coarse fraction.
33The abovementioned trends should, however, be considered as a generalization and do not take into account local variations, which can be considerable as the borehole data shows. For example, borehole GEO-12/115-B7 (B3 in Figs 3 & 4) shows a relatively high <125 µm fraction in several samples of the Kiel Member, at a similar level as the superjacent lower Antwerpen Member. Another example is borehole GEO-12/115-B3 (B3.4 in Fig. 3) from which the samples in the uppermost meter of the Kiel Member indicate an amount of fine fraction that is more similar to that of the superjacent lower Antwerpen Member than of the underlying samples deeper in the Kiel Member. These examples show that the heterogeneity of the Kiel Member makes it difficult here to attribute one specific sample to either the Kiel Member or Antwerpen Member, based on grain-size parameters alone. This seems particularly the case just to the north of the City of Antwerp, where the abovementioned exemplary boreholes are situated. This could indicate that the Kiel Member become finer or has an increasing number of silty layers in northern direction in the City of Antwerp area. However, a denser grid of granulometric analyses of samples from boreholes from within towards the north of the City of Antwerp is needed to corroborate this hypothesis. For example, it can be noted that a more typical facies of the Kiel Member was observed during the construction of the Deurganckdok, located more than 10 km northwest of the City of Antwerp (Herman & Marquet, 2007).
34The analysed samples of temporary exposures were mainly taken from shell-bearing horizons and are therefore biased when it comes to overall carbonate content for the Kiel and lower Antwerpen members. The analyses of borehole samples outside shell beds show an overall higher carbonate content for the lower Antwerpen Member (4.2%) compared to the Kiel Member (3%). This is expected given the higher shell content in the first compared to the latter (De Meuter et al., 1976; Everaert et al., 2020). The lower shell content of the Kiel Member and the poor preservation of the shells within the Kiel Member in the southern City of Antwerp has been considered the result of decalcification (Vanden Broeck, 1874; Everaert et al., 2020). In samples of the Post X temporary exposures (Fig. 3), the Kiel Member indeed shows very low (below the limits of measurement) carbonate contents. In all the samples further north in the Kiel Member, the carbonate content is higher. This shows that the possible decalcification front was probably mainly limited to the southern part of the City of Antwerp.
35This study shows that the glauconite content cannot be used to determine the boundary between the Kiel Member and lower Antwerpen Member, as the variations within these members are larger than between them. The range of variation found in borehole samples is wider than in the samples from the temporary exposures. This can probably be explained by the fact that the samples of the Kiel Member from the temporary exposures were all situated near the top of this member, whereas the borehole samples were taken throughout the whole Kiel Member. Indeed, in the borehole samples from the Kiel Member the highest values (45–50%) occur in the first 3 m under the top (Fig. 6). From 4 m on downward, values are in the range of 25 to 35%, with some outliers with higher and lower values. This decrease in glauconite in the deeper parts of the Kiel Member is not surprising, given that the underlying Edegem Member has the lowest glauconite contents of the Berchem Formation (Adriaens, 2015; Louwye et al., 2020).
4.2. Comparison of grain-size, carbonate and glauconite analyses to field observations and CPT data
36Everaert et al. (2020) performed detailed field work on the Argenta, Post X and Tweelingenstraat temporary exposures that were analysed by this study. They described the lower Antwerpen Member as more clayey than the underlying Kiel Member. Our granulometric analyses, however, show that the clay fractions are very small and therefore unlikely to be visible in the field, and moreover very similar for the Kiel Member and lower part of the Antwerpen Member. Instead, it is more likely the higher silt fraction of the lower Antwerpen Member compared to the Kiel Member that makes the first seem more “clayey” than the latter in the field. The more cohesive silt-fraction might explain why the Antwerpen Member is more resistant to erosion (by wind and rain) compared to the Kiel Member in temporary exposures (cf. Everaert et al., 2020).
37By correlation with the temporary exposures of both Everaert et al. (2020) and De Meuter et al. (1976) in the eastern City of Antwerp, Deckers & Everaert (2022) geotechnically characterized the Kiel and Antwerpen members on CPTs. They noted a very uniform qc facies for the Antwerpen Member below the S3 - Glycymeris crag. The analyses of this study indeed confirm that the grain size is very uniform in samples from the lower part of the Antwerpen Member. Deckers & Everaert (2022) also noted that the Kiel Member is characterized by higher qc values compared to the lower Antwerpen Member (12–14 MPa vs 8 MPa). These authors related this to the finer grain size of the Antwerpen Member. The results of this study, however, show that in the northern City of Antwerp area, the Kiel Member locally has layers or zones with a similar granulometry as the lower Antwerpen Member and that such zones are not necessarily expressed by qc values that are comparably low as the lower Antwerpen Member (Figs 3 & 4). Only in the northernmost CPT of Figure 4, the qc values are similar for the upper part of the Kiel Member and the lower Antwerpen Member. Granulometry alone therefore seems an insufficient explanation for the geotechnical differences between the two members. The glauconite content of the >63 µm fraction is also not consistently different enough to explain the difference in geotechnical facies. We cannot, however, exclude that the glauconite grains in the <63 µm fraction (not measured by this study) might provide such an explanation. XRD analyses on several samples from the Berchem Formation have shown that the <63 µm fraction can contain very high amounts of glauconite (from 66% up to 91%) and are consistently higher (up to 50% higher) than values of the >63 µm fraction (Afdeling Geotechniek, 2014). More analyses are, however, needed on the overall glauconite content to elaborate on this hypothesis.
38Everaert et al. (2020) noted a fining upward trend within the Kiel Member. This is not confirmed by the analyses of their samples from the Kiel Member of these temporary exposures. The analysed samples were, however, only taken from the topmost 2.5 m of the Kiel Member in the temporary exposures, and are therefore not representative for the entire succession which reached up to 9 m thickness (exposed) in the Argenta temporary exposure. However, the presence of relatively coarse, poorly sorted quartz grains in the Glycymeris-Cyrtodaria horizon (AR4) compared to the more homogeneous, higher Cordiopsis horizon (AR8) also contributed to this superficial impression in the field (see Everaert et al., 2020, fig. 9).
39In the field, when the temporary exposure has dried out a bit, the Kiel Member appears paler than the Antwerpen Member, which was partly explained by Everaert et al. (2020) by a slightly lower estimated glauconite/quartz ratio in the first compared to the latter. This field estimate is, however, contradicted by the analytical results which show no significant difference in glauconite content between both members. Therefore, the colour difference between the Kiel and Antwerpen members has to be related to other factors than glauconite content. The higher quantities of silt in the Antwerpen Member may be a more determining factor for the colour difference. In the field, the silt retains moisture longer during drying, thereby giving the silty Antwerpen Member a darker shading compared to the more greyish Kiel Member, which is almost devoid of silt and may dry out faster.
4.3. Comparison with older analyses reported in the literature
4.3.1. Temporary exposure in the city centre of Antwerp: Lange Kievitstraat section (Bastin, 1966)
40Bastin (1966) performed granulometric, carbonate and glauconite analyses on temporary exposures from the Berchem Formation in Antwerp. At the Kievitstraat temporary exposure (for location see Fig. 1), these analyses were performed on a section that was interpreted as the Antwerpen Member (Fig. 7). Later on, De Meuter et al. (1976) also described the Kievitstraat temporary exposure (DOV kb15d28w-B453), which was again interpreted as the Antwerpen Member (Fig. 7). The same temporary exposure was also described by Van den Bosch (1966), but was referred to as ‘Ploegstraat’, a street located at the other side of the temporary exposure. Van den Bosch (1966) noted that the lower part of this section was lithologically different. Based on correlations with the typical Kiel Member in more recent temporary exposures in the City of Antwerp area, Everaert et al. (2020) reinterpreted the lower part of the Kievitstraat/Ploegstraat section as part of the Kiel Member. Studying dinocyst biostratigraphy, Louwye et al. (2000) already noted that the lower part of this section was coeval to the Kiel Member in other temporary exposures. During a recent visit to Naturalis Biodiversity Center in Leiden, it was found that the morphology and particular taphonomy of the shells from the lowermost shell horizon, collected by Van den Bosch (1966), are identical to those described by Everaert et al. (2020) from the Kiel Member (AR2, AR4) at the Argenta temporary exposure (pers. obs. SE 2023). The reinterpretation by Everaert et al. (2020) also necessitated the reinterpretation of the studied Kievitstraat section of Bastin (1966), who also only interpreted the Antwerpen Member, as the formal Kiel Member was not yet defined and distinguished in 1966. Based on the correlation of the S3 - Glycymeris crag (Deckers & Everaert, 2022), which can be identified in the top of the Antwerpen Member in the drawings of both Bastin (1966) and De Meuter et al. (1976), the base of the Antwerpen Member should be situated around his 4 or 5 m mark. Indeed, at around 4.5 m, Bastin (1966) shows a marked downward decrease in the number of shells, which is characteristic for the boundary between the Antwerpen and Kiel members (Fig. 7). Therefore, besides the S3 - Glycymeris crag, only the lower part of the Antwerpen Member was exposed in the Kievitstraat section. Based on this lithostratigraphic reinterpretation, we can now compare the granulometric, carbonate and glauconite analyses of Bastin (1966) with those in the more recent temporary exposures further south and east in the City of Antwerp area:
-
The grain-size fraction below 124 µm is larger in the Antwerpen Member compared to the Kiel Member. This confirms the results of this study that the lower Antwerpen Member is more enriched in fine fraction (very fine sand, silt and clay) compared to the Kiel Member. At the Kievitstraat, the fraction below 88 µm is >10% in the lower Antwerpen Member and generally <5% in the Kiel Member (Fig. 8). Also in our study, the grain-size fraction below 88 µm shows values between 12% and 18% in the lower Antwerpen Member and mostly <5% in the Kiel Member
-
The carbonate content is rather uniform around 5–6% in the lower Antwerpen Member and varies strongly between 3% and 20% for the Kiel Member. For the Kiel Member, the measurements of high carbonate contents of 10%, 12% and 20% are located at the shell beds, and the lower values of around 3% are in between them. The carbonate contents outside the shell beds are in very good agreement with those established in boreholes by this study for the respective members, i.e. 3% for the Kiel Member and 4.2% for the lower Antwerpen Member.
-
Glauconite values show no important change around the boundary of the Kiel and Antwerpen members, which is similar to our findings in the more recent temporary exposures. The values reported by Bastin (1966) are, however, in the order of 60% and therefore much larger than those measured in the sections of Everaert et al. (2020) by this study, which are between 34 and 47%. These high glauconite percentages are, in contrast, in the same order as those measured in the Kiel Member at the Rubenshuis temporary exposure (50–60%; Fig. 2), which is located about 1 km to the west of the Kievitstraat temporary exposure (for location, see Fig. 1). In the overlying lower Antwerpen Member of the Kievitstraat temporary exposure, the glauconite percentages remain at a similar level as those in the Kiel Member, whereas those in the lower Antwerpen Member at the Rubenshuis decrease towards less than 40%.
41Although the tools used for the analyses are unknown and of considerable age, it can be concluded that the sedimentological trends established by Bastin (1966) for the Lange Kievitstraat section fit very well with those established by this study in the nearby temporary exposure and boreholes.
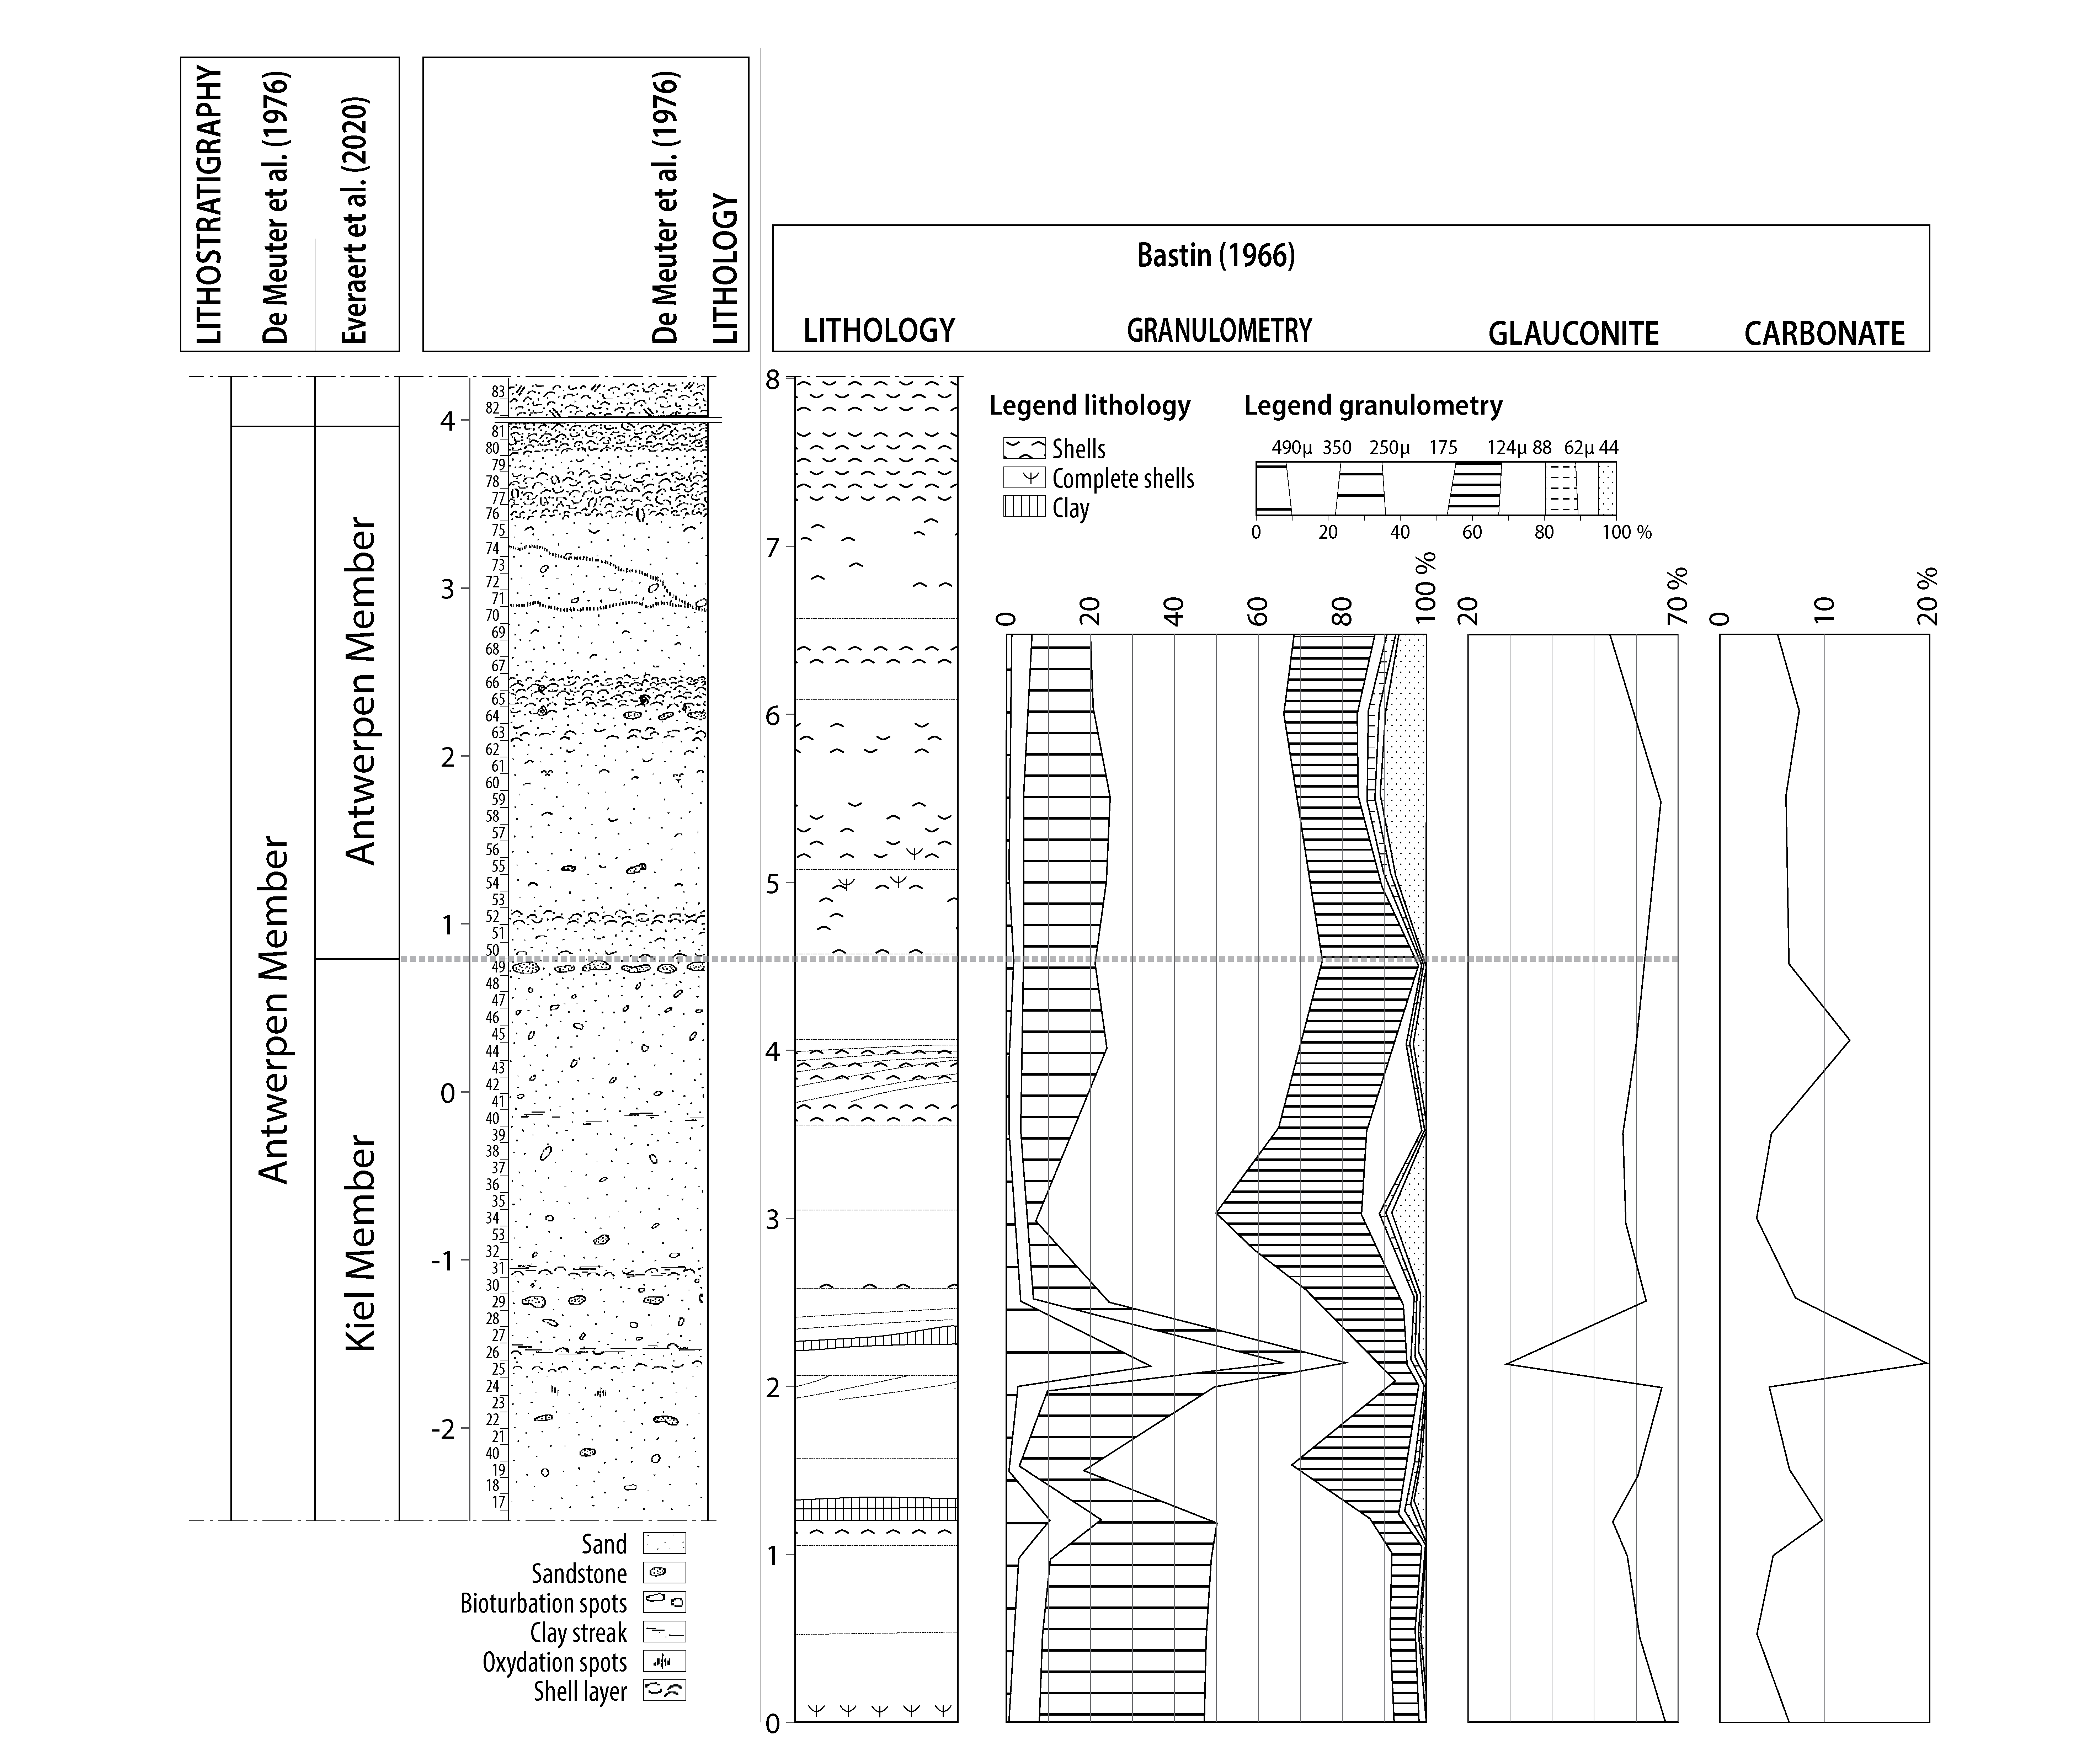
Figure 7. Litholog of the Kievitstraat temporary exposure (kb15d28w-B453) from De Meuter et al. (1976) (left) and Bastin (1966) (right). The grain-size, carbonate and glauconite analyses of Bastin (1966) are also shown. At the time, the authors of both papers interpreted these sections entirely as the Antwerpen Member. The section of De Meuter et al. (1976) was recently lithostratigraphically reinterpreted by Everaert et al. (2020), which identified the Kiel Member in the lower half of the temporary exposure. By correlating Bastin (1966) with the reinterpreted section of De Meuter et al. (1976), we now also identified the boundary between the Kiel Member and Antwerpen Member on the section of Bastin (1966).
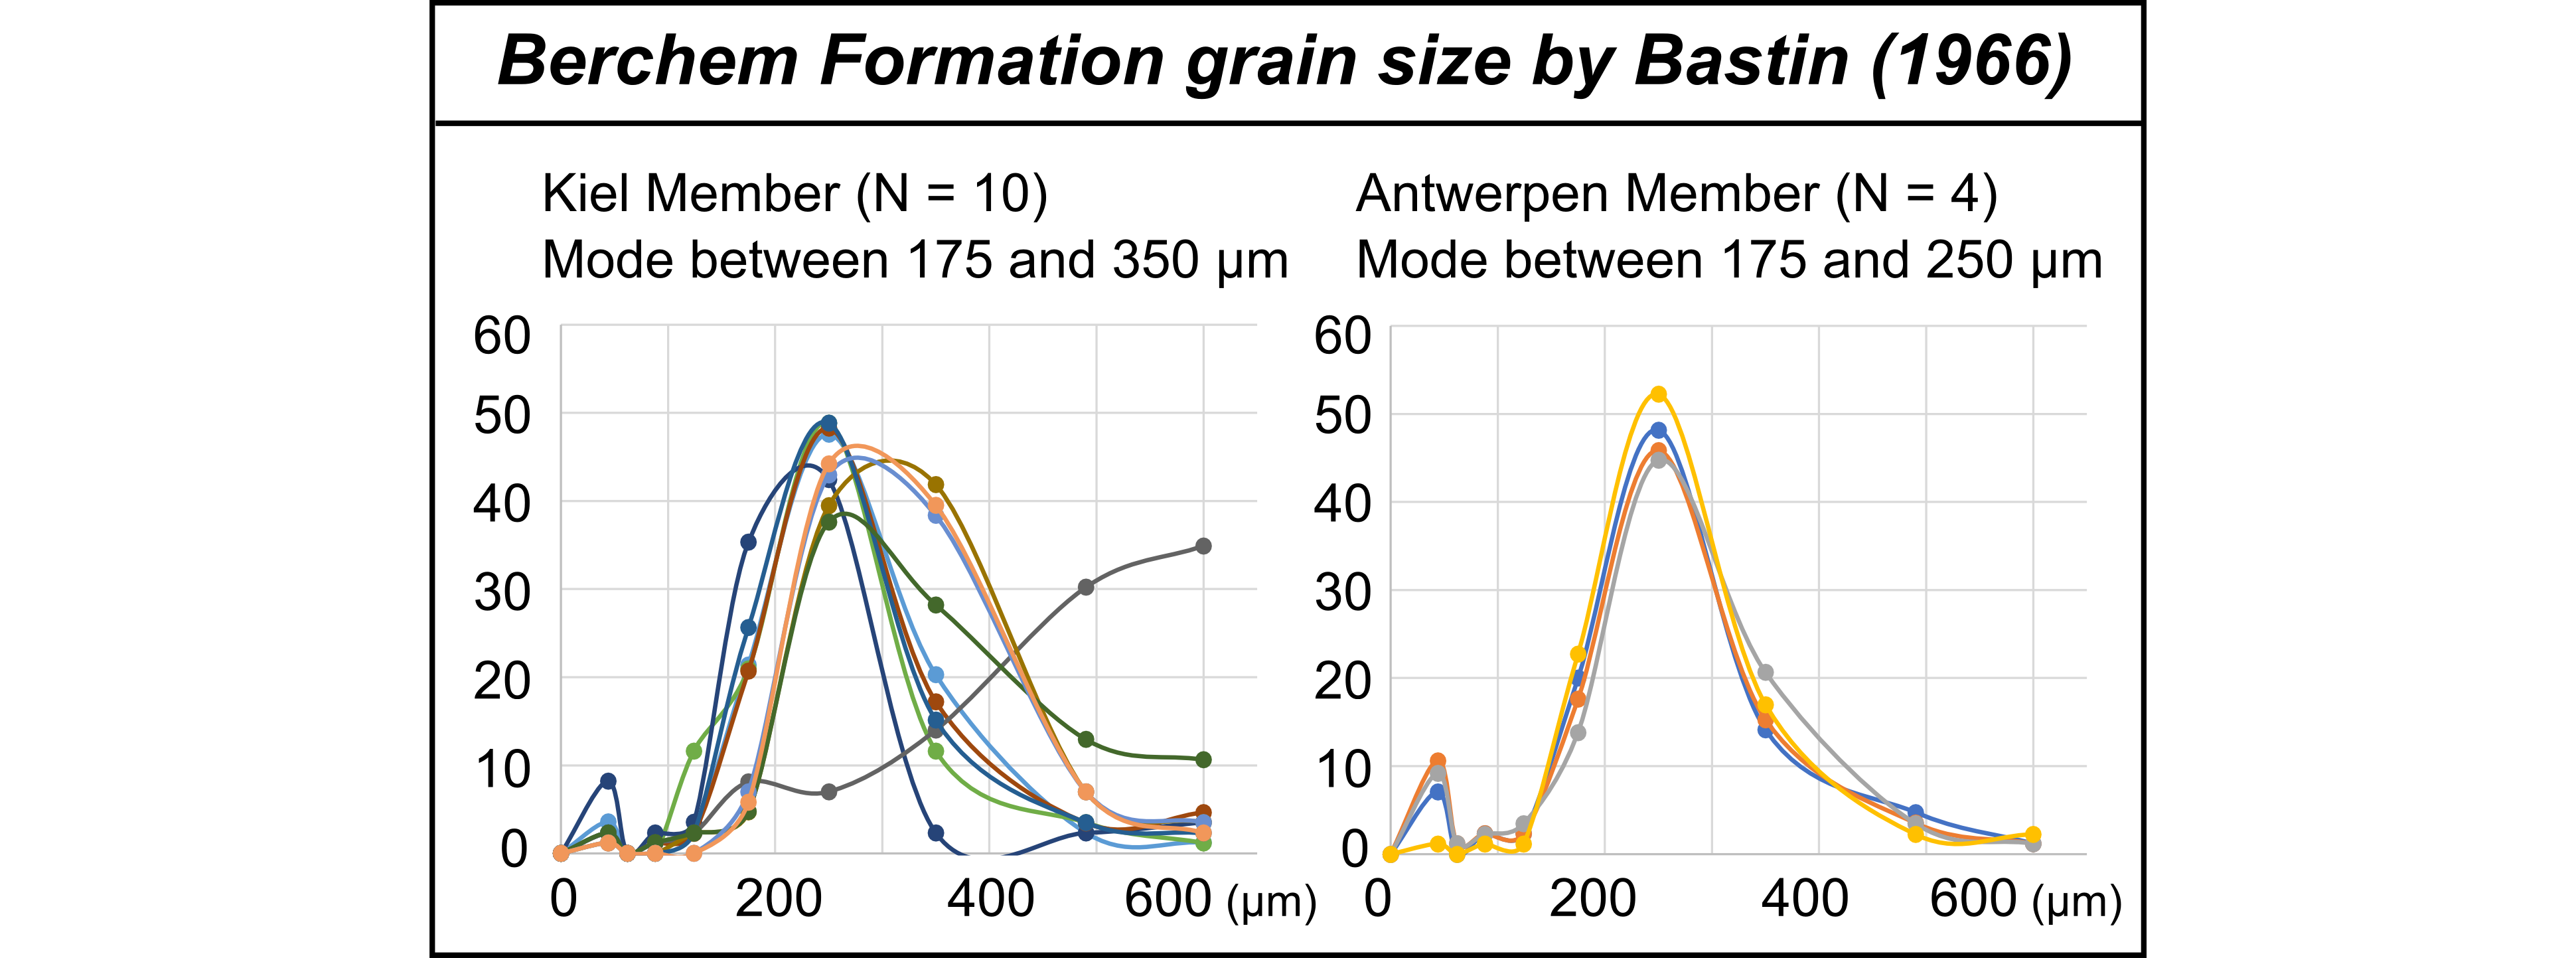
Figure 8. Grain-size distribution curves for the Kiel Member and lower Antwerpen Member at the Kievitstraat temporary exposure based on sieving analyses by Bastin (1966). Notice the heterogeneity of the Kiel Member in this exposure compared to the lower Antwerpen Member. The following intervals were measured: 0 – 44 – 62 – 88 – 124 – 175 – 250 – 350 – 490 – 600 µm. Data points are indicated on the curves. The curves are an update from Louwye et al. (2020) based on the new lithostratigraphic interpretations of this exposure by Everaert et al. (2020).
4.3.2. Temporary exposure east of Antwerp: Antwerp International Airport (Goolaerts et al., 2020)
42Goolaerts et al. (2020) analysed the middle and upper Miocene in a major temporary exposure at the Antwerp International Airport (DOV TO-20140101), east of the City of Antwerp (for location see Fig. 1). They performed granulometric and glauconite analyses in the uppermost 1.5 m of the Antwerpen Member, just below the Borsbeek Member of the Diest Formation (Fig. 9). In this exposure, the top of the Antwerpen Member was formed by the S3 - Glycymeris crag (Deckers & Goolaerts, 2022). Therefore, only the lower Antwerpen Member was observed in this section.
43In samples of the lower Antwerpen Member at this temporary exposure, glauconite contents varied between 30–40%, with one outlier at 60% (Fig. 9). The variation of glauconite content between 30–60% matches the main range as observed by this study.
44The granulometric analysis at the Antwerp International Airport was performed by laser diffraction. It shows a predominance of fine sand (between 128 and 250 µm) with fractions between 40% and 65%, which fits the range of this study (between 40% and 60%; Fig. 9). The sum of the coarse and medium sand fraction (between 250 and 500 µm) varies between 5% and 18% which is again very similar to this study. Silt fraction is about 8–20% and clay fraction is low (< 8%), also fitting the ranges of this study.
45In the 1.5 m section of the Antwerpen Member, the fines (<128 µm; very fine sand, silt and clay) show a clear coarsening upward trend, with fractions from almost 50% at the bottom towards 20% in the S3 - Glycymeris crag.
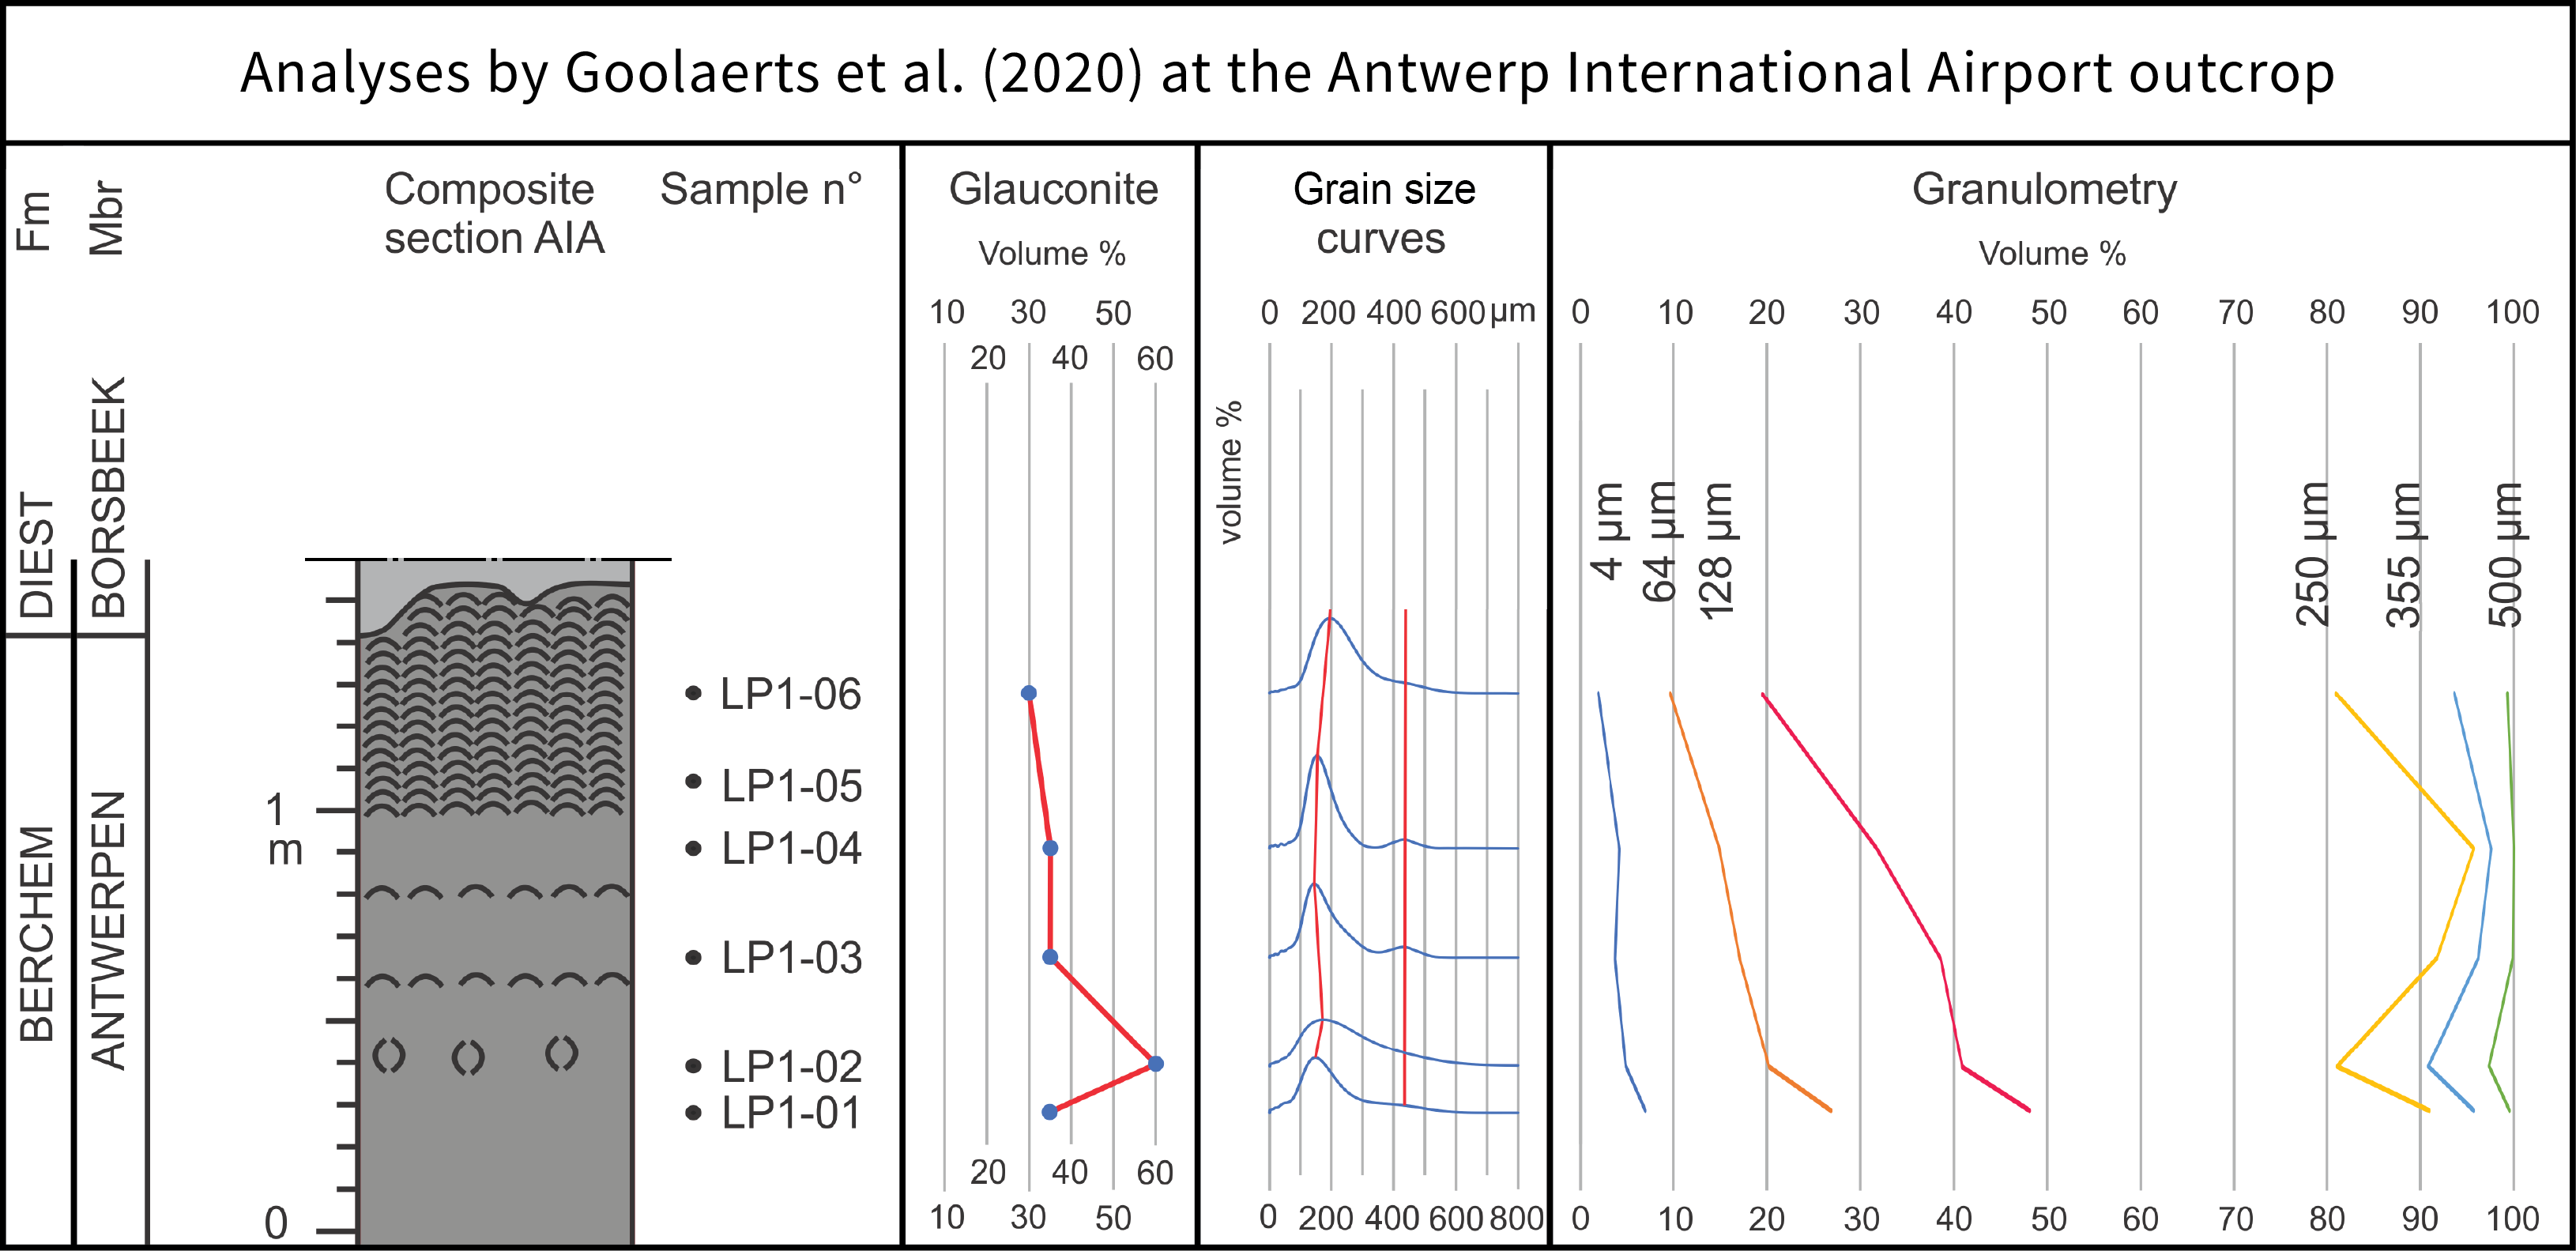
Figure 9. Litholog of the Antwerp International Airport section plotted next to glauconite content, grain-size frequency distribution curves and granulometry. Adapted from Goolaerts et al. (2020).
4.3.3. Boreholes in the Antwerp Campine area by Adriaens (2015) and Verhaegen (2020)
46In the major part of the Antwerp Campine area, the Berchem Formation is not divided into members and the entire unit is mapped as Antwerpen Member (Louwye et al., 2020). Only in the southwest, below a line Brasschaat–Herentals, the basal Edegem Member is mapped. Dinoflagellate cyst biozonation of the Berchem Formation indicates that age-equivalent sediments of the Edegem (dinocyst biozone DN2b) and Kiel (dinocyst biozone DN2c and DN3) members also occur in the Antwerp Campine area (Louwye, 2005), but have been interpreted as Antwerpen Member (Louwye et al., 2020).
47The grain-size data of Verhaegen (2020) do show a significant difference in grain-size distribution between the different units, indicating that the Edegem and Kiel members of the Berchem Formation are also present in the Antwerp Campine area (Table 2, Fig. 10). All these data were collected using laser diffraction analysis, (in)organic carbon was removed prior to analysis. Table 3 lists the used boreholes and outcrops that were subjected to granulometric analyses by Verhaegen (2020). The Edegem to lower Kiel Member (dinocyst biozone DN2) can be distinguished based on its significantly finer mean (104 ± 49 µm), median (132 ± 53 µm) and modal (184 ± 40 µm) grain size, based on 9 samples. The younger part of the Kiel Member (dinocyst biozone DN3) is the coarsest unit with a mean grain size of 181 ± 49 µm, a median of 222 ± 52 µm and a mode of 244 ± 48 µm, based on 12 samples. The Antwerpen Member (dinocyst biozone DN4-6) has a finer average grain size than the Kiel Member, with a mean of 123 ± 38 µm, a median of 162 ± 54 µm and a mode of 224 ± 63 µm, based on 13 samples (Table 2).
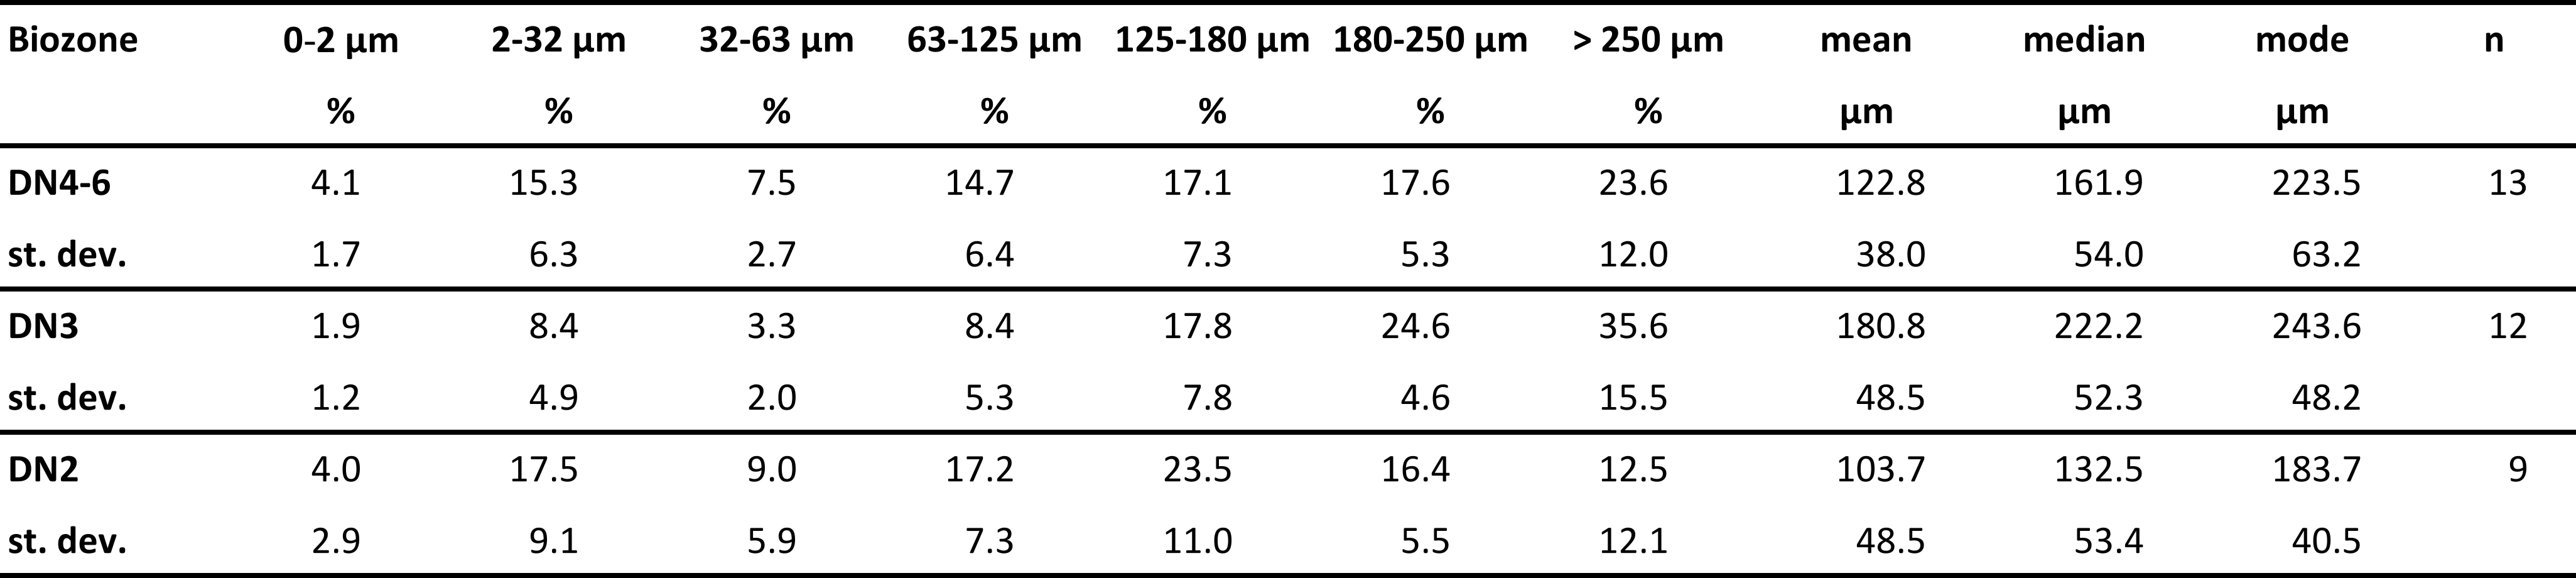
Table 2. Summarizing table for the grain-size data of boreholes in the Antwerp Campine area by Verhaegen (2020). For each dinoflagellate cyst biozone (DN) of the Berchem Formation, the mean values and standard deviations (st. dev.) are given. n = number of samples analysed.
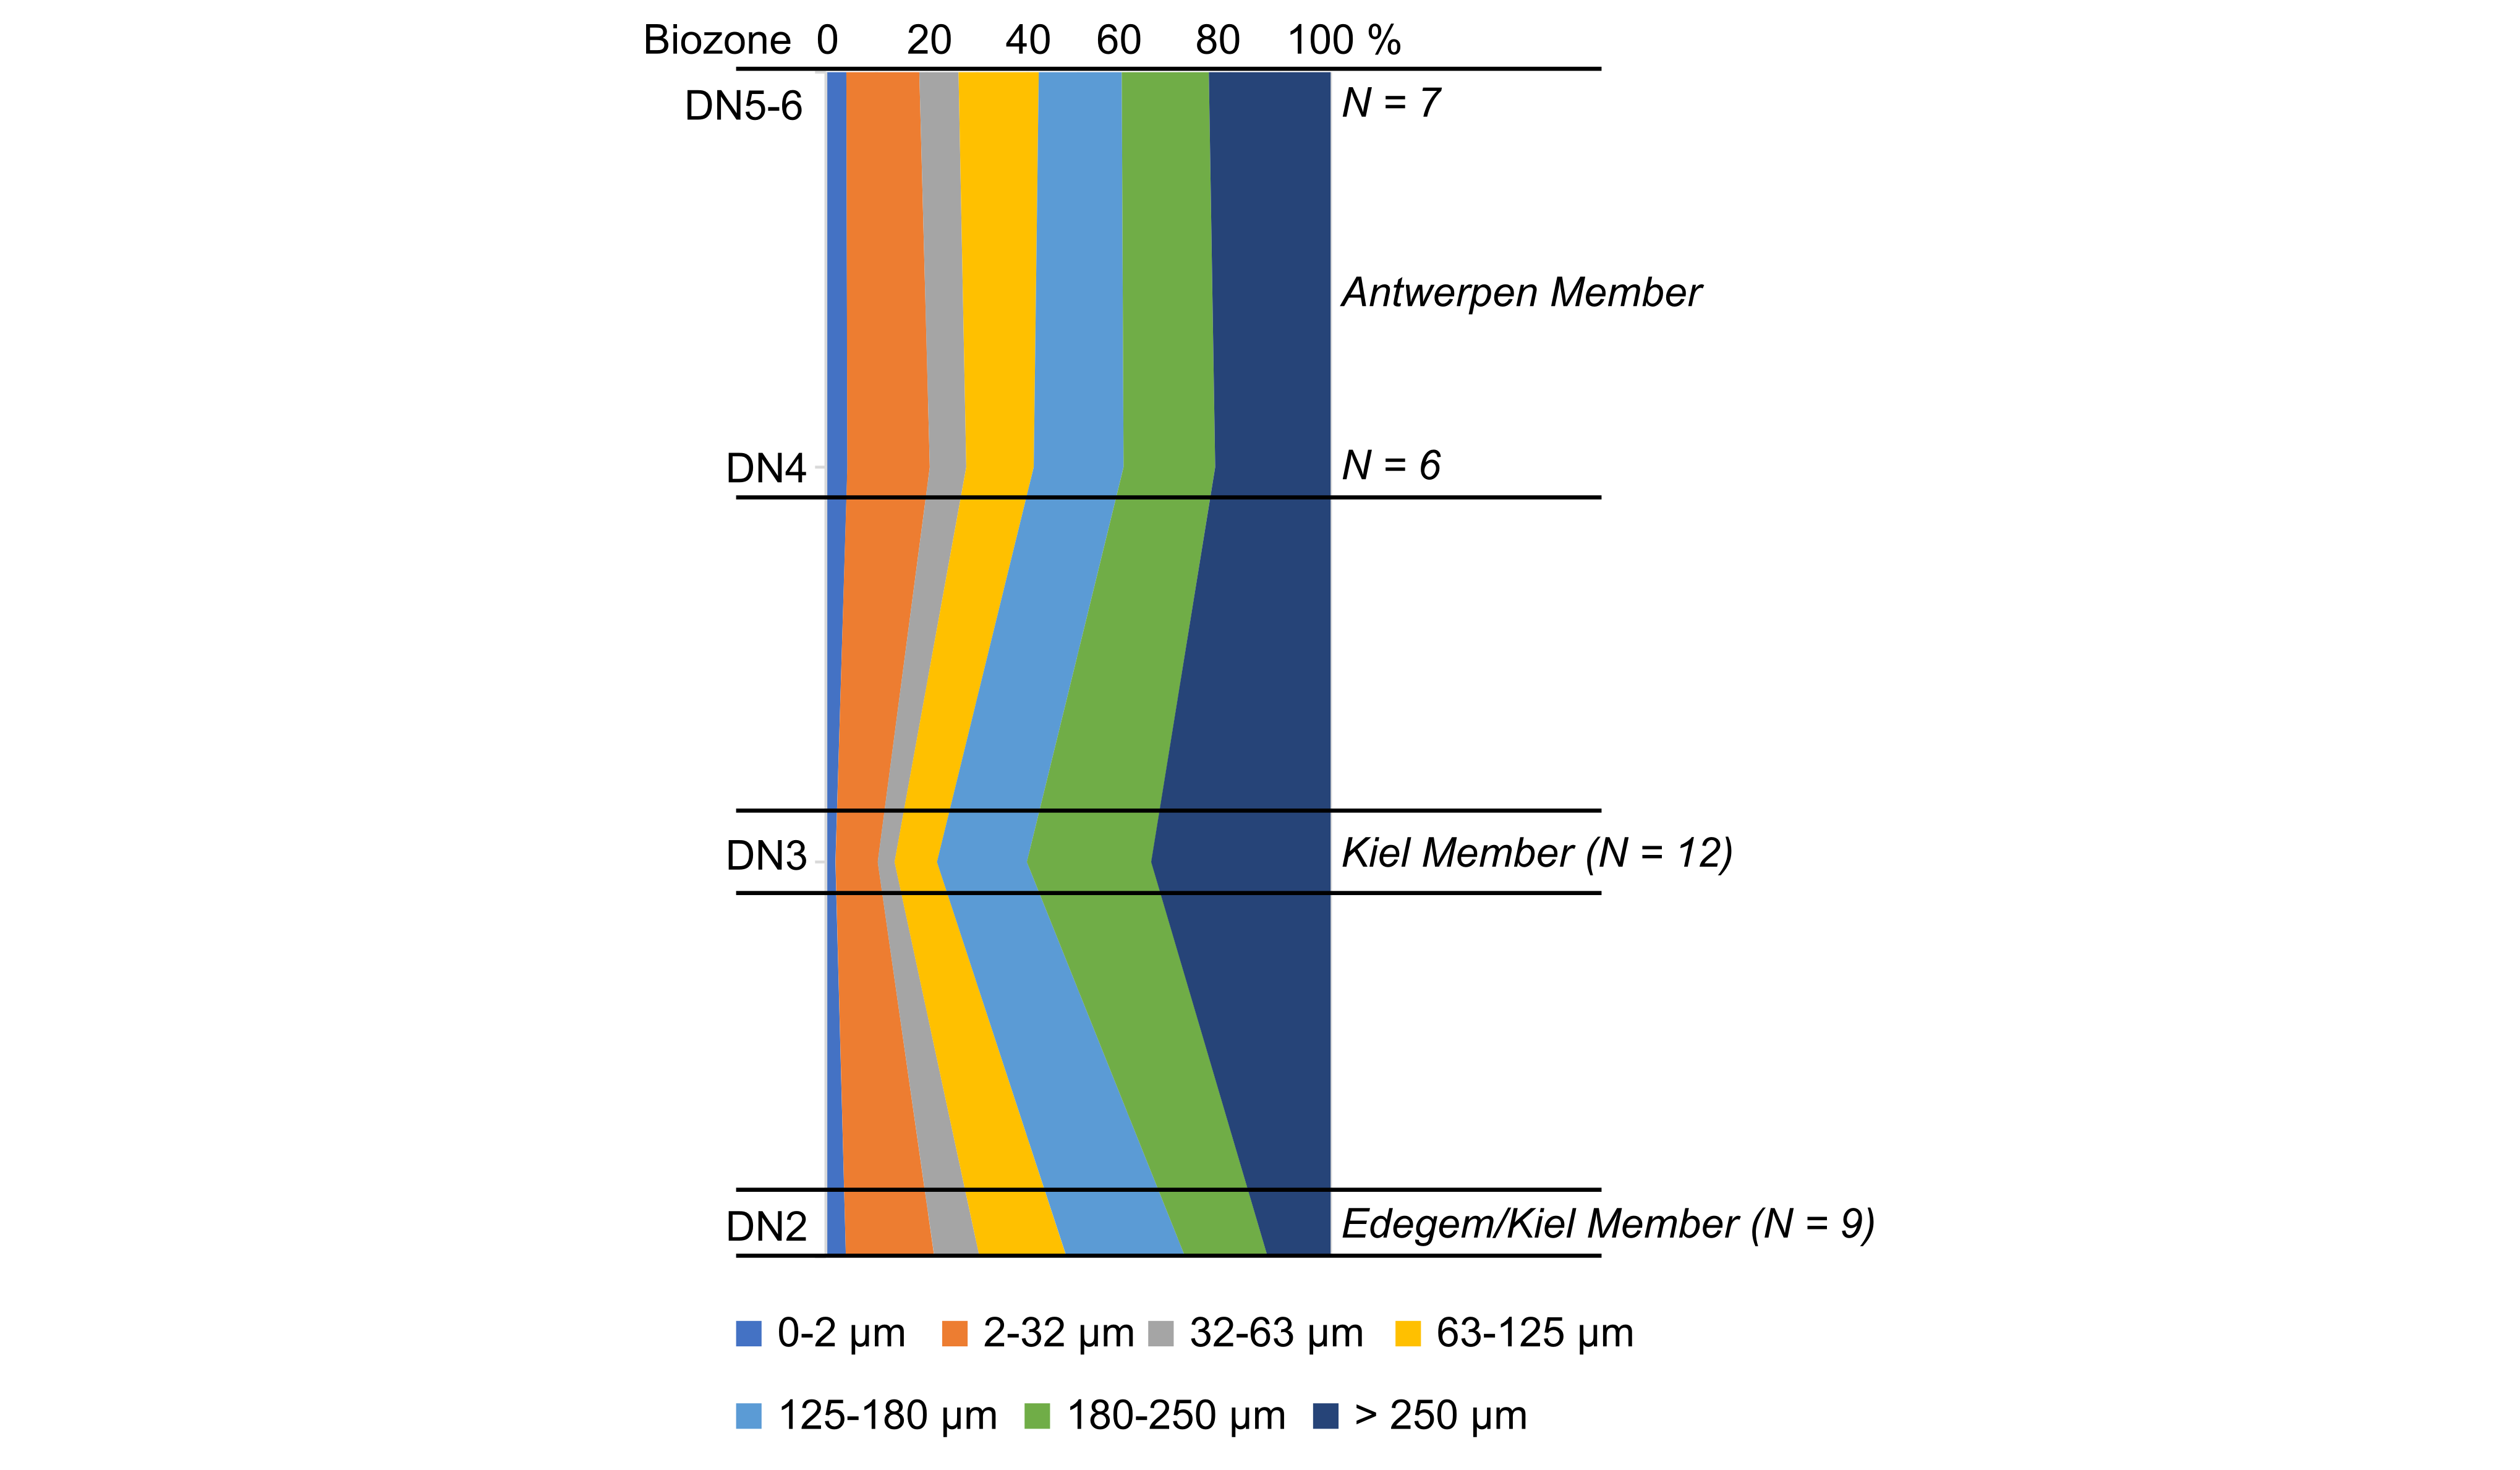
Figure 10. Synthetic section of the granulometry of the Berchem Formation in the Antwerp Campine area based on data from Verhaegen (2019, 2020). This plot illustrates the average values based on data from multiple boreholes (Table 2). Number of samples (N) for each interval are given.
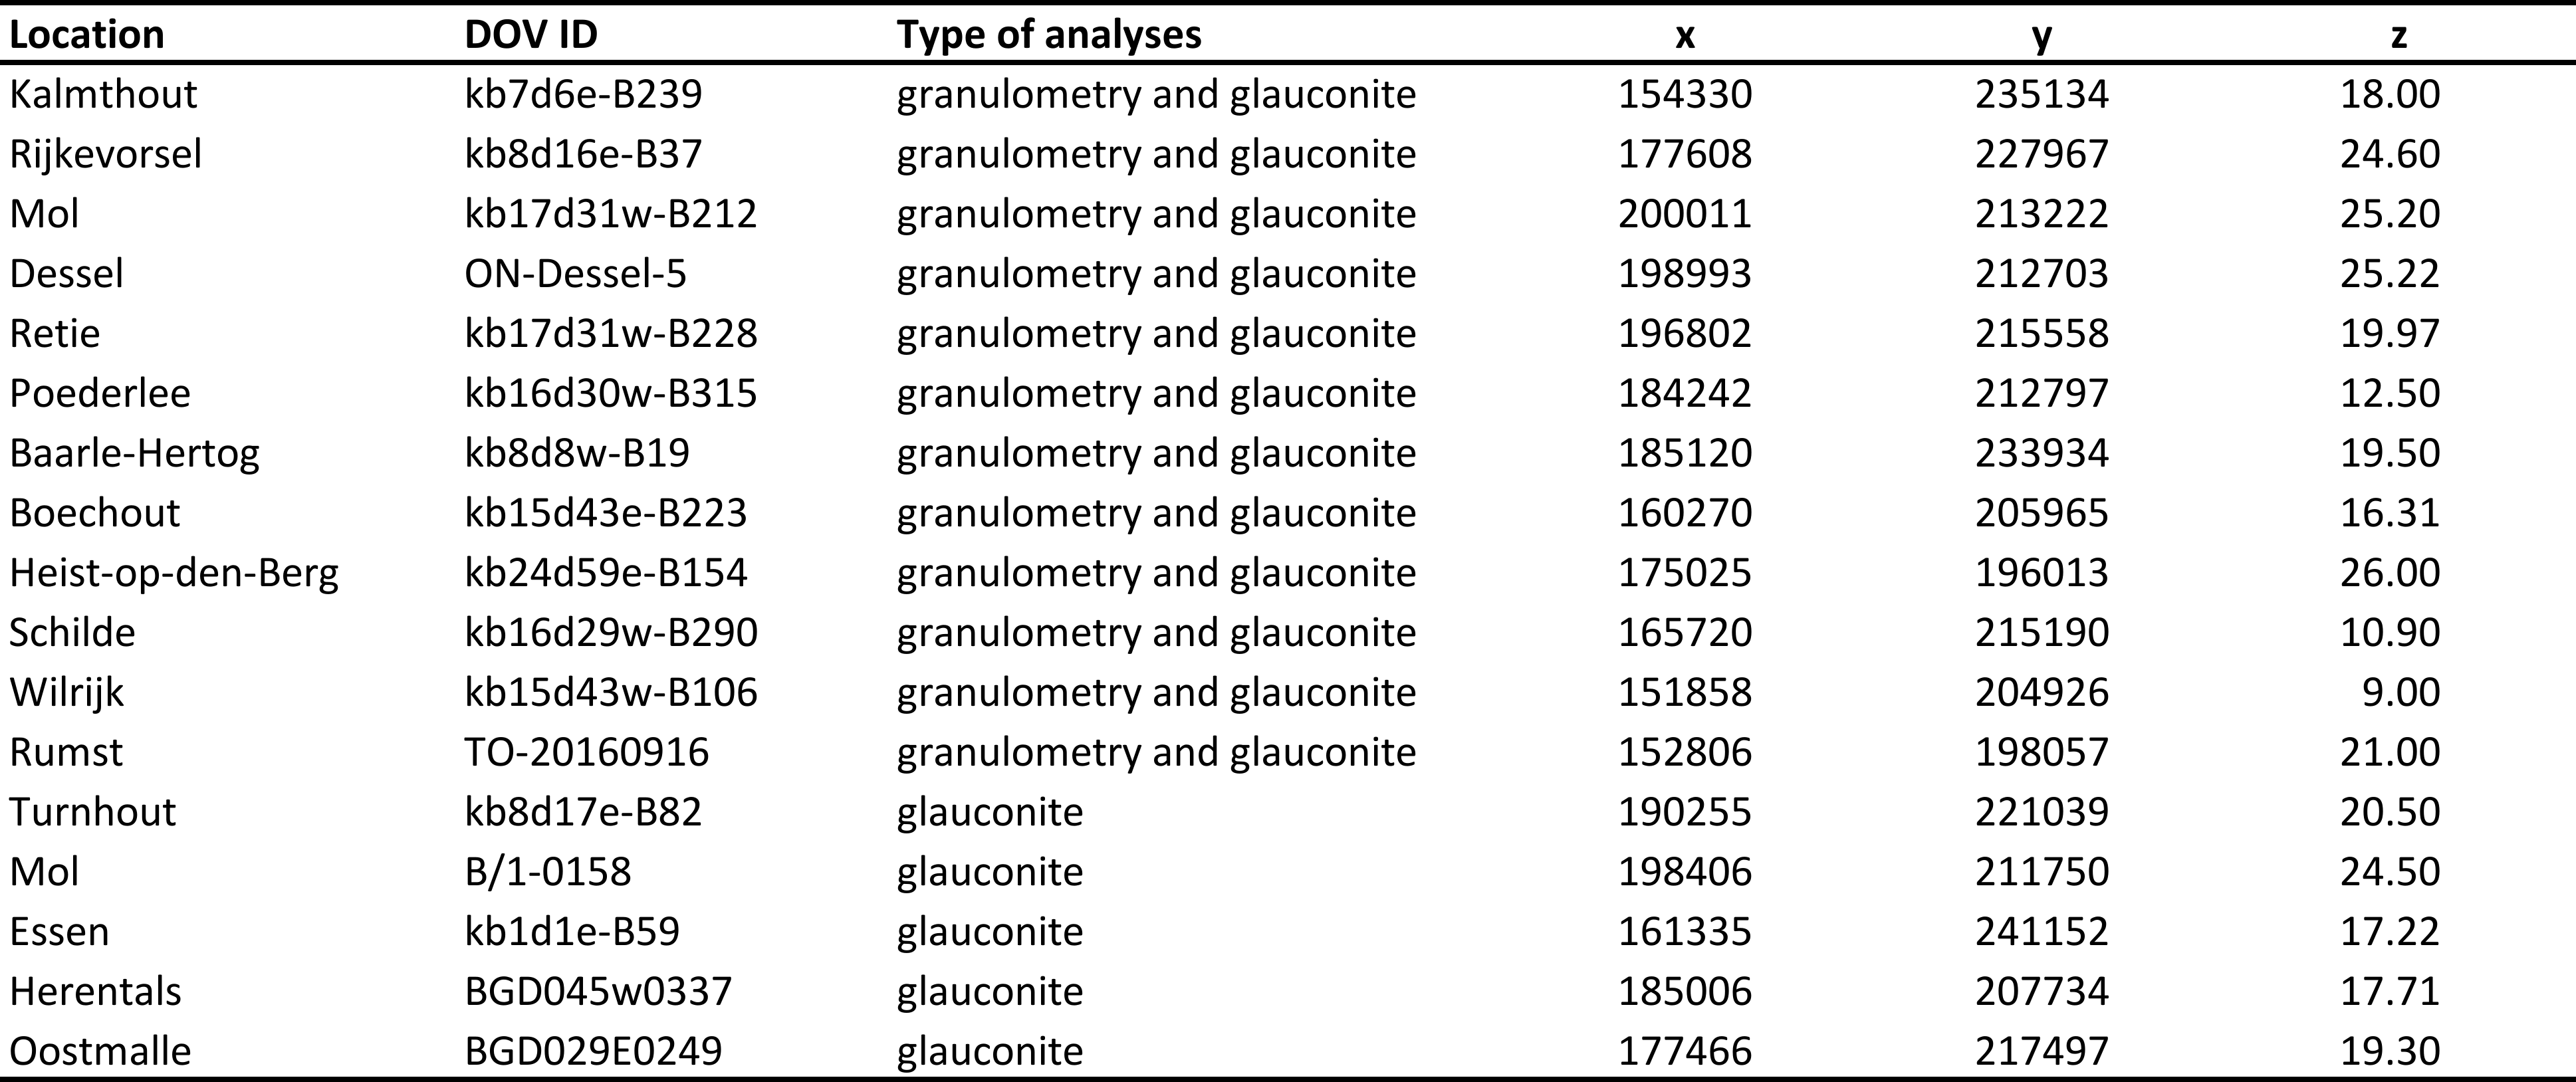
Table 3. List of the different boreholes and outcrops in the Antwerp Campine area used for sample analyses on glauconite content by Adriaens (2015) and granulometry by Verhaegen (2020).
48Similar to the results in the current study for the Antwerp City area, an important granulometric difference between the Antwerpen and Kiel members is observed in the silt and very fine sand fraction (Fig. 10, Table 2). The Antwerpen Member has a larger content of fine silt to very fine sand compared to the Kiel Member. Conversely, the upper fine to coarse sand fraction (>180 µm) is more significant in the Kiel Member than in the Antwerpen Member (Fig. 10, Table 2). These granulometric differences also result in the higher mean and modal grain size in the Kiel Member compared to the Antwerpen Member (Table 2). The lower fine sand fraction (125–180 µm) is very similar between the Antwerpen and Kiel members.
49The magnetic separation data of Adriaens (2015) show differences in glauconite contents between the members of the Berchem Formation in the Antwerp Campine area. Table 3 lists the used boreholes and outcrops that were subjected to glauconite analyses by Adriaens (2015). On average, the lowest glauconite contents are found in the Edegem Member (34%). Samples from the Kiel Member have a slightly higher glauconite content (39%), whereas on average the highest glauconite contents are found in the Antwerpen Member (46%). Although the average values are quite different, individual samples are prone to a large spread that overlaps, as also shown by this study. Furthermore, due to the larger amount of studied Antwerpen Member samples (n = 22) compared to samples of the Kiel and Edegem members (n = 5 and n = 3), it is unclear how significant this difference really is. In any case, the glauconite contents for the Antwerpen and Kiel members in boreholes in the Antwerp Campine area and their variation are in the same order as measured in the City of Antwerp area by this study.
5. Conclusions
50This study provides an overview of granulometric, carbonate and glauconite analyses that were performed on samples of the Kiel and Antwerpen members (Berchem Formation) from recently studied temporary exposures and boreholes in the area of the City of Antwerp. We focus on the lower part of the Antwerpen Member, which is better preserved from erosion and therefore better known and sampled compared to the upper part of the Antwerpen Member. In temporary exposures, only the upper part of the Kiel Member could be sampled for analyses.
51The granulometric results show that the Kiel Member and lower Antwerpen Member are both dominated by the fine sand fraction. The Kiel Member is relatively enriched in the fine and medium sand fractions, whereas the lower part of the Antwerpen Member is relatively enriched in the very fine sand to silt fraction. Because of this higher silt fraction, the Antwerpen Member is often described in the field as more clayey compared to the Kiel Member. However, the actual clay content is very low for both units. Measurements of clay content are higher in boreholes (on average 3.9–5.2%) than in temporary exposures (less than 1%), which might be explained by crushing of the abundant glauconite into the clay fraction during drilling. The higher water retaining capacity of the silt also probably renders the darker colour to the sediments of the Antwerpen Member compared to the Kiel Member, when excavated and drying in the field. The granulometric results are in good agreement with those of previous analyses of older temporary exposures in and near the City of Antwerp and boreholes in the Antwerp Campine area.
52Historically, the main criterion to distinguish the Antwerpen and Kiel members has been the abundant presence of shells (beds) in the first and the near absence in the latter. Shell fragments can be present in the coarse fraction which explains why the Antwerpen Member is sometimes, and especially as the result of sieving of borehole samples, relatively enriched in the coarser sand fraction. Also outside the shell beds, the carbonate content of the Kiel Member is lower than that of the lower Antwerpen Member (3% vs 4.2%, respectively). Minimal carbonate contents are measured in a temporary exposure in the south of the City of Antwerp, where it was related by other authors to local decalcification. The results of this study show that this possible decalcification front was mainly limited in geographic extent to southern Antwerp.
53The average glauconite content, based on the >63 µm fraction, displays similar, strong fluctuations between 35% and 60% for the Kiel and Antwerpen members. This range is in agreement with previous glauconite analyses on boreholes in the Antwerp Campine area. On top of these fluctuations, we notice a general trend of downward decrease in glauconite content in the Kiel Member towards the subjacent Edegem Member.
Acknowledgements
54This article was constructed within the framework of the project “Geological questions for the Neogene” of the VLAKO-reference task, ordered by the Bureau for Environment and Spatial Development – Flanders, VPO. We are grateful to the colleagues of VPO for the fruitful collaboration that made the work on this project possible. The same persons are also thanked, together with Ilse Vergauwen and Chandra Algoe (MOW), for the constructive discussions that shaped this article. Katrijn Dirix (VITO) is thanked for database support and Katleen van Baelen (VITO) is thanked for her excellent work on the figures. SE and JD thank Dimitri De Clerck and Kris Huyghe (both BAM Interbuild) for giving access to the construction pit near the Rubenshuis, allowing the sampling of this unique temporary exposure. We are very grateful to reviewers Gauthier van Alboom, Noël Vandenberghe and Michiel Dusar for their constructive input that led to very significant improvements in our manuscript.
Author contribution
55Jef Deckers conceptualised the research strategy. Stijn Everaert collected the samples from outcrops in the City of Antwerp for analyses. Roel De Koninck collected the existing and new sample analyses and processed them into a database. Jasper Verhaegen and Rieko Adriaens provided the data from their previously performed granulometric and glauconite analyses on borehole and outcrop samples in the Antwerp Campine area. Jef Deckers and Roel De Koninck wrote the manuscript. The five authors discussed the results and reviewed the manuscript.
Data availability
56The outcrop, borehole and CPT data that support the findings of this study are openly available via https://www.dov.vlaanderen.be/data/opdracht/2023-040135.
References
57Adriaens, R., 2015. Neogene and Quaternary clay minerals in the southern North Sea. Unpublished Ph.D. Thesis, KU Leuven, Leuven, 272 p.
58Afdeling Geotechniek, 2014. Resultaten van het bijkomend mineralogisch onderzoek uitgevoerd op monsters uit boringen in het kader van de Oosterweelverbinding te Antwerpen. Departement Mobiliteit en Openbare Werken, Zwijnaarde, Rapport ST-12/035, 45 p. https://www.dov.vlaanderen.be/data/opdracht/2014-024109, accessed 01/06/2023.
59Bastin, A., 1966. Sedimentpetrologie van de Zanden van Edegem en de Zanden van Antwerpen. Het Ingenieursblad, 35, 547–550.
60Deckers, J. & Everaert, S., 2022. Distinguishing the Miocene Kiel and Antwerpen Members (Berchem Formation) and their characteristic horizons using Cone Penetration Tests in Antwerp (northern Belgium). Geological Journal, 57, 2129–2143. https://doi.org/10.1002/gj.4384
61Deckers, J. & Goolaerts, S., 2022. Cone Penetration Test characterization of middle and upper Miocene lithostratigraphic units near Antwerp International Airport. Geologica Belgica, 25/3-4, 89–98. https://doi.org/10.20341/gb.2022.002
62Deckers, J. & Louwye, S., 2020. The architecture of the Kattendijk Formation and the implications on the early Pliocene depositional evolution of the southern margin of the North Sea Basin. Geologica Belgica, 23/3-4, 323–331. https://doi.org/10.20341/gb.2020.017
63Deckers, J., De Koninck, R., Bos, S., Broothaers, M., Dirix, K., Hambsch, L., Lagrou, D., Lanckacker, T., Matthijs, J., Rombaut, B., Van Baelen, K. & Van Haren, T., 2019. Geologisch (G3Dv3) en hydrogeologisch (H3D) 3D-lagenmodel van Vlaanderen. Studie uitgevoerd in opdracht van het Vlaams Planbureau voor Omgeving, departement Omgeving en de Vlaamse Milieumaatschappij. VITO, Mol, VITO-rapport 2018/RMA/R/1569. https://omgeving.vlaanderen.be/nl/geologisch-g3dv3-en-hydrogeologisch-h3d-3d-lagenmodel-van-vlaanderen, accessed 01/05/2023.
64De Koninck, R., Bergmans, J. & Dirix, K., 2022. Karakterisatie van de ondergrond in de Antwerpse regio met het oog op mogelijke toepassingen. Departement Omgeving, Brussel, 2022/RMA/R/2713 - Rapport in opdracht van de Vlaamse Overheid, 74 p.
65De Meuter, F.J. & Laga, P.G., 1976. Lithostratigraphy and biostratigraphy based on benthonic foraminifera of the Neogene deposits in Northern Belgium. Bulletin van de Belgische Vereniging voor Geologie/Bulletin de la Société belge de Géologie, 85, 133–152.
66De Meuter, F., Wouters, K. & Ringele, A., 1976. Lithostratigraphy of Miocene sediments from temporary outcrops in the Antwerp City area. Service géologique de Belgique, Bruxelles, Professional Paper, 1976/3, 1–19.
67Everaert, S., Munsterman, D., De Schutter, P., Bosselaers, M., Van Boeckel, J., Cleemput, G. & Bor, T., 2020. Stratigraphy and palaeontology of the lower Miocene Kiel Sand Member (Berchem Formation) in temporary exposures in Antwerp (northern Belgium). Geologica Belgica, 23/3-4, 167–198. https://doi.org/10.20341/gb.2020.025
68Goolaerts, S., De Ceuster, J., Mollen, F., Gijsen, B., Bosselaers, M., Lambert, O., Uchman, A., Adriaens, R., Van Herck, M., Houthuys, R., Louwye, S., Bruneel, Y., Elsen, J. & Hoedemaekers, K., 2020. The upper Miocene Deurne Member of the Diest Formation revisited: unexpected results from the study of a large temporary outcrop near Antwerp International Airport, Belgium. Geologica Belgica, 23/3-4, 219–252. https://doi.org/10.20341/gb.2020.011
69Herman, J. & Marquet, R., 2007. Le Miocène du Deurganckdok à Doel. Memoirs of the Geological Survey of Belgium, 54, 1–149.
70Konert, M. & Vandenberghe, J., 1997. Comparison of laser grain size analysis with pipette and sieve analysis: a solution for the underestimation of the clay fraction. Sedimentology, 44, 523–535. https://doi.org/10.1046/j.1365-3091.1997.d01-38.x
71Louwye, S., 2005. The Early and Middle Miocene transgression at the southern border of the North Sea Basin (northern Belgium). Geological Journal, 40, 441–456. https://doi.org/10.1002/gj.1021
72Louwye, S., De Coninck, J. & Verniers, J., 2000. Shallow marine Lower and Middle Miocene deposits at the southern margin of the North Sea Basin (northern Belgium): dinoflagellate cyst biostratigraphy and depositional history. Geological Magazine, 137, 381–394. https://doi.org/10.1017/S0016756800004258
73Louwye, S., Deckers, J., Verhaegen, J., Adriaens, R. & Vandenberghe, N., 2020. A review of the lower and middle Miocene of northern Belgium. Geologica Belgica, 23/3-4,137–156. https://doi.org/10.20341/gb.2020.010
74Van Alboom, G., Dupont, H., Maertens, J. & Haelterman, K., 2012. Glauconiethoudende zanden. Geotechniek, 16/2, 32–37.
75Van den Bosch, M., 1966. De ontsluiting te Antwerpen - Ploegstraat. Mededelingen van de Werkgroep voor Tertiaire en Kwartaire Geologie, 1, 17–18.
76Vanden Broeck, E., 1874. Esquisse géologique et paléontologique des dépôts pliocènes des environs d’Anvers. Annales de la Société malacologique de Belgique, 9, 87–371.
77Van Haren, T., Deckers, J., De Koninck, R., Dirix, K., Hambsch, L. & Van Baelen, K., 2021. Ondiep geologische 3D lagen- en voxelmodel van de regio Antwerpen. VITO, Mol, VITO-rapport 2019/RMA/R/1985.
78Verhaegen, J., 2019. Quantitative sediment provenance and volumetric reconstruction: application to the Miocene of the southern North Sea Basin. Unpublished Ph.D. Thesis, KU Leuven, Leuven, 239 p.
79Verhaegen, J., 2020. Stratigraphic discriminatory potential of heavy mineral analysis for the Neogene sediments of Belgium. Geologica Belgica, 23/3-4, 379–398. https://doi.org/10.20341/gb.2020.003
80Verhaegen, J., 2022. Opstart van een databank van de Vlaamse ondergrond door analyse van Geotheek monsters. Departement Omgeving, Brussel, Rapport in opdracht van de Vlaamse Overheid, 81 p. https://archief.algemeen.omgeving.vlaanderen.be/xmlui/bitstream/handle/acd/812286/Geotheek_analyses_eindrapport.pdf, accessed 01/06/2023.
81Manuscript received 17.02.2023, accepted in revised form 18.08.2023, available online 30.10.2023.
82Supplementary material for this paper is available online at https://doi.org/10.20341/gb.2023.008.
