


- Portada
- Volume 37 (2019)
- Numéro 1
- Groundnut (Arachis hypogaea L.) Response to Phosphorus and Weed Management in the Guinea Savannah Zone of Ghana


Vista(s): 3759 (30 ULiège)
Descargar(s): 0 (0 ULiège)


Groundnut (Arachis hypogaea L.) Response to Phosphorus and Weed Management in the Guinea Savannah Zone of Ghana

Notes de la rédaction
Received on 10.08.17 and accepted for publication on 28.03.18.
Résumé
Réponse de l'arachide (Arachis hypogaea L.) à l'engrais phosphaté et à la gestion des mauvaises herbes dans la zone de savane guinéenne au Ghana
Des essais ont été menés pendant les saisons culturales de 2013 et 2014 à la station expérimentale de l'Institut de recherche agricole de la savane CSIR-, Nyankpala, pour évaluer la réponse de l'arachide à l'engrais phosphaté et au désherbage manuel. Un dispositif en bloc complètement randomisé, avec trois répétitions par traitement, a été utilisé. Douze traitements dont quatre doses de phosphore (0, 15, 30 et 45 kg.ha-1) et trois méthodes de désherbage [présence de mauvaises herbes, absence de mauvaises herbes, et désherbage à 3 et 6 semaines après le semis (SES)]. Les résultats ont montré une interaction entre le régime de désherbage et les doses de phosphore. Des différences significatives ont été observées pendant les deux saisons pour différents paramètres: la largeur de la canopée, la nodulation effective, les poids frais et sec des gousses, la biomasse des mauvaises herbes, le poids de 100 graines, le poids des fanes et la densité et les dommages causés par les arthropodes ravageurs du sol. Le désherbage à 3 et 6 SES plus 30 ou 45 kg.ha-1 de phosphore ont réduit l'activité des arthropodes dans le sol, au même niveau que celui des parcelles exemptes de mauvaises herbes. Ces traitements ont amélioré tous les paramètres de rendement. La largeur de la canopée, la nodulation effective et le rendement des gousses sont positivement corrélés (r = 0,72 à 0,95) au poids des fanes pendant les deux saisons. Malgré qu'une croissance et un développement similaire ont été observés dans les parcelles sans mauvaises herbes et ceux avec désherbage à 3 et 6 SES, pour des raisons de main-d'œuvre et de coûts dans la pratique de l'agriculture sans mauvaises herbes, le désherbage à 3 et 6 SES et l'application de 45 kg P.ha-1 sont recommandés pour maximiser la production de l'arachide dans le nord du Ghana.
Abstract
Field studies were conducted during the 2013 and 2014 cropping seasons at the experimental field of the CSIR-Savanna Agricultural Research Institute, Nyankpala, to evaluate the response of groundnut to phosphorus fertilizer and manual weed control. A total of twelve treatments comprising four levels of phosphorus (0, 15, 30 and 45 kg.ha-1) and three weeding regimes (weedy check, weed free, and weeding at 3 and 6 WAP) were laid out in a randomized complete block design with three replications. Results indicated significant differences in canopy spread, effective nodulation, fresh and dry pod weights, weed biomass, 100 seed weight, haulm weight and soil arthropod pest densities and damage due to weeding regime and phosphorus interaction in both seasons. Weeding at 3 and 6 WAP plus 30 or 45 kg.ha1phosphorus reduced soil arthropod activity similar to weed free plots and improved all the yield parameters measured. Canopy spread, effective nodulation and pod yield correlated positively (r = 0.72 0.95) with haulm weights in both seasons. Although, similar growth and development were observed in the weed free and weeding at 3 and 6 WAP plots, for reasons of labour and cost envisaged in the practice of weed free farming, weeding at 3 and 6 WAP and application of 45 kg P.ha-1 is recommended for maximizing groundnut production in northern Ghana.
Tabla de contenidos
Materials and methods
Site description
1The experiments were conducted at the experimental field of CSIR-Savanna Agricultural Research Institute near Nyankpala (09° 23ʹ 33.8ʹʹ N, 001° 00ʹ 24.2ʹʹ W, 169 m asl) during the 2013 and 2014 cropping seasons. The study area fall within the Guinea Savannah agro-ecological zone of Ghana, characterized by grassland vegetation interspersed with short trees. The soil of the study area has been classified as Ferric luvisol (5) characterized as sandy loam (sand 57%, silt 41% and Clay 2%) with pH(water) 6.2, organic carbon 0.3%, N 0.03 %, P 5.2 mg/kg, and K 58 mg/kg. In addition, the exchangeable Ca and Mg recorded were 1.0 and 0.4 cmol (+)/kg, respectively. Figure 1 shows the decadal patterns of rainfall and cardinal temperatures for the two years that the experiment was conducted. The area is characterized by a unimodal rainfall distribution. Rainfall distributions in 2013 were better relative to that of 2014 cropping season. The mean annual temperature was 27±2 °C.
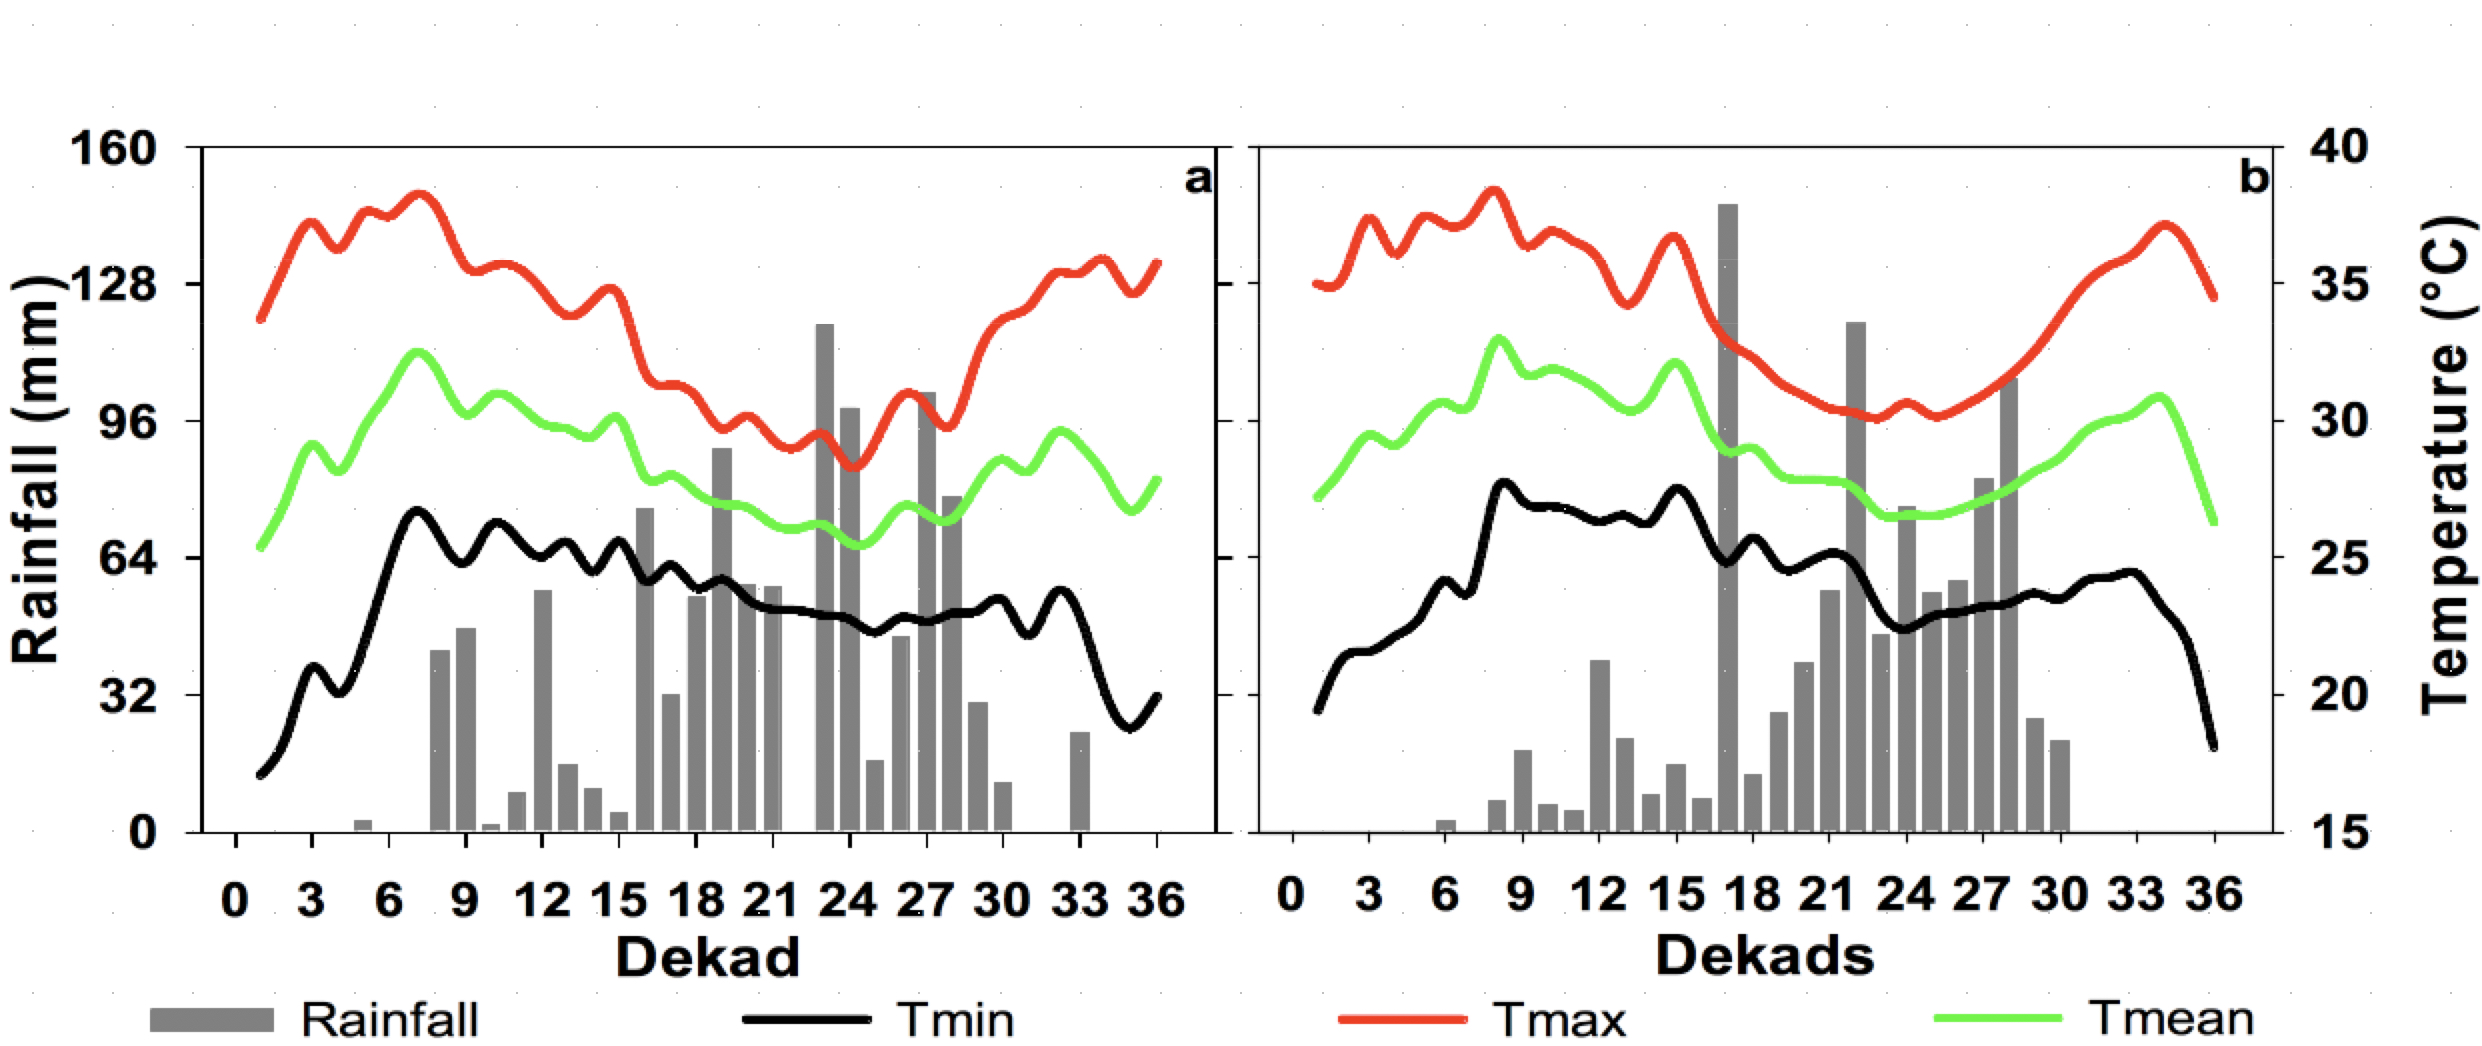
2Figure 1: Dekadal patterns of rainfall and cardinal temperatures at Nyankpala in 2013 (a) and 2014 (b). A review on weed management in groundnut (Arachis hypogea L.) tmin, tmax, and tmean are averages for minimum, maximum, and mean temperatures respectively
Experimental design
3A total of 12 treatments (Table 1), comprising a factorial combination of four application rates of Triple Super Phosphate (0, 15, 30 and 45 kg/ha) and three weeding regimes (weedy check, weeding at 3 and 6 WAP and weed free) was laid out in a randomized complete block design with four replications.
4Table 1. Experimental treatments.
|
Triple Super Phosphate (kg/ha) |
Weeding regime |
|
0 |
Weed free |
|
Weeding at 3 & 6 WAP |
|
|
Weedy check |
|
|
15 |
Weed free |
|
Weeding at 3 & 6 WAP |
|
|
Weedy check |
|
|
30 |
Weed free |
|
Weeding at 3 & 6 WAP |
|
|
Weedy check |
|
|
45 |
Weed free |
|
Weeding at 3 & 6 WAP |
|
|
Weedy check |
Land preparation and planting
5The field was ploughed and harrowed and then demarcated into plots measuring 5 m x 5 m, with 1 m and 2 m alleys between plots and replications, respectively. The groundnut cultivar ‘Chinese’ was used for the experiments, and sown at a spacing of 50 cm x 20 cm. Weed control on designated plots were done manually
Data collection and analysis
6Data was collected on canopy spread, weed density and biomass, fresh and dry pod weight, 100 seeds weight, haulm biomass and soil arthropods and their damage and number of effective nodules. Effective nodules constituted a subset of nodules with pinkish colour when dissected and are able to fix atmospheric N whereas non-effective nodules (data not collected) have no such colour and do not fix N. Data obtained were subjected to analysis of variance (ANOVA) using GenStat (release 12) statistical package. Treatment means were separated using the Fischer protected least significance difference (LSD) at 5 % probability level. Correlation analysis was also conducted for the parameters measured.
Results
Weed density and biomass
7The flora distribution on the field in both cropping seasons indicated a total of 25 annual weed species of which 14 species were broad leaves, 8 were grasses and 3 were sedges. The broad leaves were the most dominant species in the field (Table 2). Weeding regime and phosphorus application significantly affected weed biomass. Except for the weed free plots, weeding at 3 and 6 WAP plus 0 and 15 kg P/ha recorded the least weed biomass (Table 2). It was followed closely by weeding at 3 and 6 WAP plus 30 and 45 kg P/ha, whilst the weedy check plots recorded the highest weed biomass with increasing rate of phosphorus application (Table 2).
8Table 2. Mean percent summed dominance ratio (SDR) of weeds in the experimental field in 2013 and 2014 cropping season.
|
Weed species |
% SDR at 9 WAP |
% SDR at 13 WAP |
|
Broad leaves |
||
|
Ageratum conyzoidesL |
5.84 |
8.96 |
|
Celosia isertii C.C. Townsend |
2.56 |
3.62 |
|
Commelina diffusa Burm.f. |
4.52 |
4.59 |
|
Commelina beghalensis L. |
6.63 |
4.85 |
|
Corchorus olitorius L. |
2.52 |
2.09 |
|
Croton lobatus L. |
2.40 |
3.33 |
|
Euphorbia heterophylla L. |
2.70 |
2.96 |
|
Hyptis specigera Lam. |
6.26 |
10.01 |
|
Ipomoea eriocarpa R.Br. |
1.65 |
2.11 |
|
Leucas martinicensis (Jacq.) R.Br. |
1.66 |
2.02 |
|
Ludwigia hyssopifolia(G. Don) Exell |
7.44 |
7.61 |
|
Mitracarpus villosus (Sw.) DC. (or Mitracarpus hirtus (L.) DC.) |
6.73 |
9.20 |
|
Mollugo nudicausis Lam. (or Paramollugo nudicaulis (Lam.) Thulin) |
4.93 |
0 |
|
Physalis angulata L. |
1.93 |
0 |
|
Grasses |
||
|
Brachiaria falcifera (Trin.) Stapf |
3.06 |
3.82 |
|
Brachiari alata (Schumach) C.E.Hubb. |
4.47 |
2.81 |
|
Dactyloctenium aegyptium (L.)Willd. |
2.25 |
2.01 |
|
Digitaria horizontalis Willd. |
3.17 |
5.87 |
|
Paspalum scrobiculatum L. |
3.98 |
6.51 |
|
Pennisetum pedicelatum Trin. |
2.26 |
2.41 |
|
Rottboelliaco chinchinensis (Lour.) Clayton |
2.24 |
3.32 |
|
Setaria pumula (Poir.) Roem. & Schult. |
3.22 |
0 |
|
Sedges |
||
|
Cyperus esculentus L. |
6.11 |
2.96 |
|
Cyperrus rotundus L. |
8.14 |
4.26 |
|
Kyllinga erecta Schumach. |
4.42 |
2.52 |
Canopy spread
9Weeding regime and phosphorus application significantly (P< 0.05) affected canopy spread. The canopy spread in 2013 was more dense under weed free with P applied at 30 and 45 kg/ha and under weeding at 3 and 6 WAP with P applied at 45 kg/ha (Table 3). Similarly, in 2014 weed-free with P applied at 30 and 45% and weeding at 3 and 6 WAP with application of 30 and 45 kg P/ha resulted in significantly denser canopy (Table 3).
Number of effective nodules
10The number of effective nodules was significantly affected by weeding regime and phosphorus application. The highest number of effective nodules in 2013 was obtained when plots were weeded at 3 and 6 WAP and fertilized with 45 kg P/ha, and this was statistically similar to that obtained for weed free plots that were fertilized with 45 kg P/ha (Table 3). In 2014 however, the number of effective nodules obtained in the phosphorus treated (45 kg P/ha) weed-free plots was significantly higher when compared with the other treatments (Table 3). Generally, the least number of effective nodules in both seasons was recorded in the weedy check, with decreasing rate of phosphorus application (Table 3).
Pod yield
11Weeding regime and phosphorus application significantly affected fresh and dry pod weights. Weeding at 3 and 6 WAP plus 45 kg P/ha recorded fresh pod weight higher than weed-free plus 15 and 30 kg P/ha in both seasons (Table 3). Dry pod weight was higher and similar in weeding at 3 and 6 WAP and weed-free plus 30 or 45 kg P/hain both years. However, pod yields were higher in 2013 than in 2014 (Table 3). Generally, the least fresh and dry pod weights in both cropping seasons were obtained in weedy plots, in respective order of decreasing rate of phosphorus application (Table 3).
Hundred seed weight
12Hundred seed weight was significantly affected by weeding regime and phosphorus application. Weeding at 3 and 6 WAP plus 45 kg P/ha increased 100 seed weight similar to weed free plus 45 and 30 kg P/ha in 2013 (Table 3). In 2014 however, seed weight recorded by weeding at 3 and 6 WAP plus 45, 30 and 15 kg P/ha was not different from weed free plus 45, 30 and 15 kg P/ha (Table 3). The least values for 100 seed weights were recorded in the weedy check in decreasing order of phosphorus application (Table 3).
13Table 3. Phosphorus x weeding regime effects on weed biomass and growth parameters of groundnut during 2013 and 2014 cropping seasons at Nyankpala.
|
Phosphorus kg/ha |
Weeding regime |
Canopy spread |
Effective Nodule number |
Weed biomass (kg/ha) |
Fresh pod weight (kg/ha) |
Dry pod weight (kg/ha) |
100 seed weight (g) |
|
|
2013 |
||||||||
|
0 |
Weed free |
97.25 |
153.5 |
1067 |
714.0 |
639.7 |
22.6 |
|
|
Weeding at 3 & 6 WAP |
94.50 |
150.8 |
3133 |
640.7 |
557.0 |
18.7 |
||
|
Weedy check |
66.75 |
179.0 |
5133 |
486.5 |
392.3 |
15.2 |
||
|
15 |
Weed free |
117.8 |
163.3 |
617 |
1187.3 |
1076.0 |
33.3 |
|
|
Weeding at 3 & 6 WAP |
111.4 |
161.3 |
3567 |
1086.3 |
1021.3 |
26.3 |
||
|
Weedy check |
68.83 |
144.0 |
6333 |
486.1 |
391.6 |
15.3 |
||
|
30 |
Weed free |
122.8 |
172.1 |
133 |
1289.3 |
1183.0 |
43.3 |
|
|
Weeding at 3 & 6 WAP |
116.0 |
166.8 |
3967 |
1240.0 |
1136.0 |
33.0 |
||
|
Weedy check |
97.00 |
143.3 |
7367 |
489.4 |
387.5 |
14.9 |
||
|
45 |
Weed free |
126.0 |
177.0 |
1367 |
1392.7 |
1289.3 |
55.7 |
|
|
Weeding at 3 & 6 WAP |
123.3 |
179.0 |
4200 |
1343.3 |
1245.3 |
45.0 |
||
|
Weedy check |
92.00 |
144.3 |
8500 |
496.4 |
399.8 |
16.0 |
||
|
LSD |
5.73 |
3.48 |
794.7 |
44.73 |
220.3 |
10.75 |
||
|
2014 |
||||||||
|
0 |
Weed free |
50.33 |
24.27 |
533 |
355.6 |
744.4 |
16.6 |
|
|
Weeding at 3 & 6 WAP |
44.10 |
22.80 |
2167 |
333.3 |
742.2 |
17.4 |
||
|
Weedy check |
33.10 |
21.80 |
4133 |
177.8 |
622.2 |
16.0 |
||
|
15 |
Weed free |
50.43 |
24.67 |
1200 |
377.8 |
744.4 |
17.3 |
|
|
Weeding at 3 & 6 WAP |
47.37 |
21.67 |
2417 |
377.8 |
748.9 |
18.0 |
||
|
Weedy check |
33.40 |
21.77 |
4367 |
177.8 |
655.6 |
16.7 |
||
|
30 |
Weed free |
54.87 |
28.40 |
1333 |
466.7 |
773.3 |
19.0 |
|
|
Weeding at 3 & 6 WAP |
52.30 |
27.27 |
2950 |
466.7 |
780.0 |
19.1 |
||
|
Weedy check |
38.10 |
23.00 |
6500 |
277.8 |
664.4 |
18.1 |
||
|
45 |
Weed free |
57.27 |
31.93 |
1467 |
566.7 |
842.2 |
20.1 |
|
|
Weeding at 3 & 6 WAP |
54.73 |
29.27 |
3150 |
522.2 |
845.6 |
20.0 |
||
|
Weedy check |
39.37 |
24.00 |
7000 |
333.3 |
704.4 |
18.1 |
||
|
LSD |
5.37 |
1.83 |
548.3 |
43.97 |
44.05 |
3.05 |
||
14Significant difference determined using Fischer protected LSD, P< 0.05
Haulm biomass
15Haulm biomass was significantly affected by weeding regime and phosphorus application. Weeding 3 and 6 WAP plus 45 kg P/ha produced higher haulm biomass than weed free plot plus 30 and 15 kg P/ha in 2013 (Figure 2). In 2014, weeding at 3 and 6 WAP plus 45 and 30 kg P/ha produced haulm biomass similar to weed free plots treated with 45 kg P/ha (Figure 2). The least haulm biomass in both seasons was recorded in the weedy check plots (Figure 2).
Correlation analysis
16 As shown in table 4, haulm biomass of groundnut highly positively correlated with canopy spread (r= 0.83), effective nodule counts (r= 0.94), fresh pod weight (r= 0.95), dry pod weight (r = 0.94) and 100 seed weight (r= 0.96) in 2013, and correlated positively with canopy spread (r= 0.73), fresh pod weight (r = 0.66) and dry pod weight (r= 0.72) in 2014.
17Figure 2: Effect of weeding regimes and phosphorus on haulm biomass. Bars represent SEM.
18Table 4. Spearman’s correlation among groundnut growth parameters measured 1.
|
2013 |
CS |
ENC |
FPW |
DPW |
WB |
HSW |
HB |
|
|
CS |
- |
|||||||
|
ENC |
0.8538 |
- |
||||||
|
FPW |
0.8754 |
0.9512 |
- |
|||||
|
DPW |
0.8755 |
0.9490 |
0.9978 |
- |
||||
|
WB |
-0.5411 |
-0.6207 |
-0.6583 |
-0.6651 |
- |
|||
|
HSW |
0.7924 |
0.8862 |
0.9059 |
0.9038 |
-0.6014 |
- |
||
|
HB |
0.8328* |
0.9447* |
0.9491* |
0.9429* |
-0.6279 |
0.9598* |
- |
|
|
2014 |
||||||||
|
CS |
- |
|||||||
|
ENC |
0.7713 |
- |
||||||
|
FPW |
0.8951 |
0.8009 |
- |
|||||
|
DPW |
0.8143 |
0.6714 |
0.9258 |
- |
||||
|
WB |
-0.6805 |
-0.3426 |
-0.4552 |
-0.4845 |
- |
|||
|
HSW |
0.6704 |
0.7758 |
0.8170 |
0.7206 |
-0.0106 |
- |
||
|
HB |
0.7251* |
0.4671 |
0.6627* |
0.7228* |
-0.6302 |
0.4215 |
- |
191CS= Canopy spread, ENC= Effective nodule count, FPW= Fresh pod weight, DPW= Dry pod weight, WB= Weed biomass, HSW= 100 seed weight, HB= Haulm biomass. Correlation matrix with asterisk (*) signify significance at P< 0.05.
Soil arthropod pests and damage
20The soil arthropods millipedes, white grub, termites and wireworms were recorded at harvest in this study (Table 5). Densities of these arthropods were significantly affected by weeding regime and phosphorus application. Interaction of weeding regime and phosphorus application was also significant. Across all arthropod pests, weedy-check with 0 kg P/ha treatments significantly produced a higher number of arthropod pests compared with weeding at 3 & 6 WAP and weed-free plots treated with 30 kg P/ha and 45 kg P/ha that supported a lower and similar densities. Irrespective of weeding regime, zero arthropod pests were generally recorded when plots were treated with the higher doses of 30 kg P/ha and 45 kg P/ha.
21Percentage of pods with arthropod penetration holes (percent bored pods) at harvest was also significantly affected by weeding regime and phosphorus treatments. In addition, the interaction of weeding regime and phosphorus application was significant (Table 6). Weedy-check plots with 0 kg P/ha had significantly (P< 0.05) the highest percentage bored pods while the lowest percentage bored pods was recorded for weed-free plots with or without phosphorus amendment and when plots were weeded 3 & 6 WAP and treated with 45 kg P/ha. At all weeding regime treatments, percentage bored pods decreased with increasing levels of phosphorus application.
22Percentage of pods damaged by pod scarification or removal of the fibrous tissue on pods (percent scarified pods) by soil arthropod at harvest was significantly affected by weeding regime and phosphorus application. The interaction of weeding regime and phosphorus application was also significant (Table 7). Irrespective of weeding regime, percentage scarified pods decreased with increasing levels of phosphorus application. On all phosphorus treatment plots, percentage scarified pods was higher on weedy-check pods compared with the other weed management treatments. Also, weedy-check plots with 0 kg P/ha and 15 kg P/ha had significantly (P <0.05) the highest percentage scarified pods. The lowest percentage scarified pods was recorded on weed-free plots treated with 30 and 45 kg P/ha.
23Table 5. Effect of weeding regime and phosphorus fertilizer application on soil arthropods pest densities1 at harvest.
|
Millipedes |
|||||
|
Treatments |
0 kg P/ha |
15 kg P/ha |
30 kg P/ha |
45 kg P/ha |
Means |
|
Weedy check |
2.0 |
1.5 |
0.5 |
0.0 |
1.0 a |
|
Weeding at 3 & 6WAP |
0.0 |
0.0 |
0.0 |
0.0 |
0.0 b |
|
Weed free |
0.0 |
0.0 |
0.0 |
0.0 |
0.0 b |
|
Means |
0.66 a |
0.50 b |
0.16 c |
0.00 c |
|
|
White grub |
|||||
|
Weedy check |
1.5 |
1.3 |
0.0 |
0.0 |
0.7 a |
|
Weeding at 3 & 6WAP |
0.0 |
0.0 |
0.0 |
0.0 |
0.0 b |
|
Weed free |
0.0 |
0.0 |
0.0 |
0.0 |
0.0 b |
|
Means |
0.50 a |
0.43 a |
0.00 b |
0.00 b |
|
|
Termites |
|||||
|
Weedy check |
112.5 |
55.0 |
0.0 |
0.0 |
41.9 a |
|
Weeding at 3 & 6WAP |
0.0 |
0.0 |
0.0 |
0.0 |
0.0 b |
|
Weed free |
0.0 |
0.0 |
0.0 |
0.0 |
0.0 b |
|
Means |
37.5 a |
18.3 b |
0.0 c |
0.0 c |
|
|
Wire worms |
|||||
|
Weedy check |
1.8 |
0.30 |
0.0 |
0.0 |
0.53 a |
|
Weeding at 3 & 6WAP |
0.5 |
0.0 |
0.0 |
0.0 |
0.13 b |
|
Weed free |
0.0 |
0.0 |
0.0 |
0.0 |
0.0 c |
|
Means |
0.76 a |
0.10 b |
0.0 b |
0.0 b |
|
|
LSD Weeding x phosphorus (Millipedes) = 0.3233 LSD Weeding x phosphorus (White grub) = 0.3253 LSD Weeding x phosphorus(Termites) = 29.31 LSD Weeding x phosphorus(Wire worms) = 0.5263 |
|||||
241 Data are means of two years data (2013 and 2014) pooled for analysis.
25Table 6. Interaction effect of weeding regime and phosphorus fertilizer application percentage bored pods1 by soil arthropods pests at harvest.
|
Bored pods (%) |
|||||
|
Treatments |
0 kg/ha |
15 kg/ha |
30 kg/ha |
45 kg/ha |
Means |
|
Weedy check |
10.00 |
7.50 |
1.25 |
0.50 |
4.81 a |
|
Weeding at 3 & 6WAP |
2.50 |
1.25 |
0.50 |
0.00 |
1.06 b |
|
Weed free |
0.25 |
0.00 |
0.00 |
0.00 |
0.06 b |
|
Means |
4.25 a |
2.92 a |
0.58 b |
0.17 b |
|
|
LSD (Weeding x Fertilizer) = 2.705 |
|||||
261Data in table are means of two years data (2013 and 2014) pooled for analysis.
27Table 7
28Interaction effect of weeding regime and phosphorus fertilizer application percentage scarified pods1 by soil arthropods pests at harvest.
|
Scarified pods (%) |
|||||
|
Treatments |
0 kg P/ha |
15 kg P/ha |
30 kg P/ha |
45 kg P/ha |
Means |
|
Weedy check |
25.00 |
20.00 |
6.50 |
3.75 |
13.81 a |
|
Weeding at 3 & 6WAP |
1.25 |
1.25 |
1.25 |
0.00 |
0.94 b |
|
Weed free |
0.50 |
0.25 |
0.00 |
0.00 |
0.19 b |
|
Means |
8.92 a |
7.17 a |
2.58 b |
1.25 b |
|
|
LSD (Weeding x Fertilizer) = 6.655 |
|||||
291Data in table are means of two years data (2013 and 2014) pooled for analysis.
Discussion
Weed control and phosphorus effects on weed density
30The high weed density observed under weeding at 3 and 6 WAP (Table 3) relative to weed-free was unexpected. The phosphorus application might have resulted in assimilation of nitrogen by weed for vegetative growth that resulted in the high weed biomass. This result corroborates the findings of Kiran (12).
Weed control and phosphorus effects on soil arthropod pest density and damage
31The lower arthropod densities and reduced damage recorded in weed-free and weeding at 3 & 6 WAP and phosphorus treatments agree with those reported by other workers (12, 14). They reported that phosphorus treatment significantly lowered insect pest densities, disease severity and damage resulting in increased yield in cowpea (2) and groundnut (14). The high pod yield and 100 seed weight also recorded with these treatments was likely the result of the reduced damage by the soil arthropods. Phosphorus improves plant nutrition especially in phosphorus deficient soils, which enhances growth and yield (2, 12). The good farm sanitation provided in the weed-free and weeding at 3 & 6 WAP plots probably eliminated alternate host plants of the arthropods and their activity as well as minimized weed competition which further enhanced growth and yield.
Weed control and phosphorus effects on yield components of groundnut
32Canopy spread was generally higher under weeding at 3 and 6 WAP, with increasing rate of phosphorus application in both seasons (Table 3). Weeding at 3 and 6 WAP might have reduced the build-up of weeds to competitive level and enhanced plant growth. This agrees with the findings of Labrada et al. (13). In addition, phosphorus enhances uptake of nitrogen and growth which probably accounted for the wider canopies observed with increasing rate of P application (13). The improved production of nodules observed under plots weeded at 3 and 6 WAP could be attributed to reduced competitive ability of weeds for nutrients and nitrogen assimilation enhanced by phosphorus application (7). Moreover, phosphorus plays a vital role in the proliferation of roots and might have enhanced the plants’ ability to absorb more water and nutrients, which enhanced the production of assimilate for improved yield (7, 9). Previous study by Saeideh et al. (16) on yield components revealed a positive correlation between the components and total yield. The increased yield with weeding at 3 and 6 WAP and phosphorus application probably also accounted for the corresponding increase in haulm biomass.
Conclusions
33This study showed that phosphorus application and weeding regime, as well as, their interaction significantly affected growth, soil arthropod pest densities and damage, yield components and yield of groundnut. Weeding at 3 and 6 WAP plus 45 kg P/ha and 30 kg P/ha reduced soil arthropod activity and damage similar to weed free plots and improved yield parameters. However, weed free farming appeared labour and/ or cost-intensive and would be unattractive to the resource-poor farmers in the study area. Hence, weeding at 3 and 6 WAP and application of 45 kg P/ha is recommended for maximizing groundnut production in Northern Ghana.
Acknowledgement
34The authors acknowledge the technical supports of Messrs. A. Seidu, F. Anamang and J. Yaw Kwabena of the CSIR-Savanna Agricultural Research Institute.
Literature
351. Abudulai M., Dzomeku I.K., Salifu A.B., Nutsugah S.K., Brandenburg R.L. & Jordan D.L., 2007, Influence of cultural practices on soil arthropods, leaf spot, pod damage, and yield of peanut in northern Ghana. Peanut Sci., 34, 72-78.
362. Asiwe J., 2009, The impact of phosphate fertilizer as a pest management tactic in four cowpea varieties. Afr. J. Biotechnology, 8, 24, 7182-7186.
373. Carson A.G., 1976, Weed competition and control in groundnuts (Arachis hypogaea L). Ghana J. Agricult. Sci., 9, 3, 169-173.
384. FAO, 2002, Food and Agriculture Organization crop protection statistics. Rome, Italy.
395. FAO, 1991, World soil resources: an explanatory note on the FAO world soil resources map at 1:25 000 000 scale. Rome, Italy.
406. Gascho G.D., & Davis J.G., 1997, Soil fertility and plant nutrition, pp. 383-418. In. H.E. Patte & H.T. Stalker (Eds.), Advances in peanut science. American Peanut Research and Educational Society (pp. 383-418). Inc., Stillwater. Ok, USA.
417. Havlin L.J., James D.B., Samuel L.T. & Werner L.N., 2005, Soil fertility and fertilizers: an introduction to nutrient management. (7th Ed.). Pearson Education, Inc., Upper Saddle River, New York USA.
428. Johnson D.E., 1997, Weeds of rice weed in West Africa. United Kingdom.
439. Kamara E.G., Olympio N.S. & Asibuo J.Y., 2011, Effect of calcium and phosphorus fertilizer on the growth and yield of groundnut (Arachis hypogaea L.). Int. Res. J. Agric. Sci. Soil Sci., 1, 8, 326-331.
4410. Kawari J.D., 2005, Soil fertility status in some communities of southern Borno. Final Report to PROSAB. Nigeria.
4511. Kimiti J.M., Odee D.W., & Vanlauwe B., 2009, Area under grain legumes cultivation and problems faced by smallholder farmers in legume production in the semi-arid eastern Kenya. J. Sustainable Dev. Afr., 11, 4, 305-315.
4612. Kiran R.J., 2000, Effects of time of weeding and levels of N and P on grain yield of maize. Regional Agricult. Res. Station, NARC, Lumle Kaski.
4713. Labrada R., Caseley J.C., & Parker C., 1994, Weed management in developing countries. Food and Agriculture Organization of United Organization. Italy.
4814. Naab J.B., Boote P.J., & Jones J.W., 2009, Response of peanut to fungicide and phosphorus in on-station and on-farm test in Ghana. Peanut Science, 36, 157-164.
4915. Priya R.S., Chinnusamy C., Manickasundaram P. & Badu C., 2013, A Review on weed management in groundnut (Arachis hypogea L). Int. Res. J. Agric. Sci. Res., 3,163-172.
5016. Saeideh D., Hassan P., Ahmed K., Massumeh A., Neda S., Raziyeh G., & Masoud E., 2015, Study of the relationship between grain yield and yield components using multivariate analysis in barley cultivars (Hordeum vulgare L.). Int. J. Agronomy Agric. Res., 6, 4, 240-250.
5117. Savage G.P., & Keenana J.I., 1994, The composition and nutritive value of groundnut kernels. In. J. Smart (Ed.), The groundnut crop: Scientific basis for improvement (pp. 173-213). London: Chapman and Hall.
5218. Tan Z., Tieszen, L.L., Tachie-Obeng E., Liu S., & Dieye A.M., 2009, Historical and simulated ecosystem carbon dynamics in Ghana: land use, management, and climate. Biogeosciences, 6, 1, 45-58.
5319. Vilas M.B., Jayashiri V.K., Yuvra J.R.P. & Panjabrao D.K., 2010, Integrated weed management in groundnuts (Arachis hypogaea L).
Para citar este artículo
Acerca de: I.K. Dzomeku
Ghanaian, PhD, Lecturer, University for Development Studies, Department of Agronomy, Tamale, Ghana. E-mail: ikdzomeku2009@yahoo.com
Acerca de: S. Baba
Ghanaian, PhD, Researcher, University for Development Studies, Department of Agronomy, Tamale, Ghana.
Acerca de: M. Abudulai
Ghanaian, PhD, Researcher, CSIR-Savanna Agricultural Research Institute, Tamale, Ghana.
Acerca de: A.M. Mohammed
Ghanaian, PhD, Researcher, CSIR-Savanna Agricultural Research Institute, Tamale, Ghana.
Acerca de: A.L. Abdulai
Ghanaian, PhD, Researcher, CSIR-Savanna Agricultural Research Institute, Tamale, Ghana.
