


- Startpagina tijdschrift
- Volume 37 (2019)
- Numéro 2
- Drivers of Technical Efficiency in Cassava Processing in Nigeria: Implications for a Commercializing Food Sector


Weergave(s): 2654 (14 ULiège)
Download(s): 0 (0 ULiège)


Drivers of Technical Efficiency in Cassava Processing in Nigeria: Implications for a Commercializing Food Sector

Nota's van de redactie
Received on 16.11.17 and accepted for publication on 27.07.18
Résumé
Les moteurs de l'efficacité technique dans la transformation du manioc au Nigeria : implications pour une commercialisation du secteur alimentaire
La plupart des politiques agricoles au Nigeria ont pour objectif d’intégrer les petits agriculteurs dans l'économie de marché. Au cours de la dernière décennie, le Nigéria a connu un important apport de capitaux privés et publics dans la promotion des unités de transformation du manioc de petite échelle. Cette étude utilise la fonction de frontière stochastique et des données d’entrées/sorties pour mesurer et expliquer les efficacités techniques (ET) de 274 entreprises de petite et moyenne taille. L'étude a montré que les entreprises de transformation du manioc ont une efficacité technique moyenne de 43% t, indiquant qu'une très grande proportion de la valeur de la production (57%) est perdue en raison des inefficacités propres aux entreprises. Les entreprises de transformation de la zone du Centre-Nord ont enregistré l’efficacité technique moyenne la plus élevée (61%), suivies par celle de la zone du Sud-Est / Sud-Ouest (42%) et enfin celle du Sud-Sud (26%). Les valeurs de l’ ET étaient inférieures à 80% pour environ 85% des entreprises échantillonnées. Les efficacités techniques sont influencées par la classification de l'entreprise (petite ou moyenne taille, propriété individuelle ou propriété familiale), les facteurs sociaux (interactions avec d'autres acteurs), économiques (nombre de produits, de clients ou de commandes reçues) et la participation à un atelier de formation. Les gouvernements et les institutions ayant un rôle statutaire dans la promotion des chaînes de valeurs agricoles devraient envisager de façon adéquate l’encouragement et la promotion des unités de transformateurs de manioc de petite et moyenne taille et ceci, avec beaucoup plus de vigueur. L’organisation régulière d’ateliers pour renforcer les capacités et l'efficacité des transformateurs est également recommandée.
Abstract
Most agriculture policies in Nigeria are aimed at integrating the rural poor into market economy. In the last decade, Nigeria witnessed significant private and public injection of capital into the promotion of small-medium scale cassava processing. This study uses a stochastic frontier function and inputs/outputs data to measure technical efficiencies (TE) of 274 small-medium cassava processing firms in Nigeria. Results showed that the cassava processing enterprises had a mean TE of 43 percent, indicating that, a large proportion of output value (57%) is lost due to firm-specific inefficiencies. Cassava processing enterprises in the north-central area of Nigeria recorded a mean TE of 61% (highest), followed by South-east/South-west (42%) and South-south (26%). TE values were below 80% for about 85% percent of the sampled enterprises. Technical efficiencies were influenced by enterprise classification (small-medium, sole proprietorship or family ownership), social factors (interaction with other actors), economic (number of products, clients or orders received) and attendance of training workshop. It is recommended that government and institutions with statutory role to promote agricultural value chains should consider encouraging and promoting small-medium scale cassava processing the more with adequate impetus. Constant training workshops to improve the skills and efficiency of the cassava processors are also recommended.
Inhoudstafel
Introduction
1Cassava is important not only as a food crop but even more so as a major source of income for rural households. Worldwide cassava production increased by 12.5% between 1900 and 1988 (14). FAO (12) submitted that about 42% of harvested cassava roots in West and East Africa are processed into dried chips and flour. As a cash crop, cassava generates cash income for the largest number of households in companion with other staples (13, 21). In Southeast Asia and Latin America, cassava has taken on an economic role. Cassava starch is used as a binding agent, in the production of paper and textiles, and as monosodium glutamate, an important flavouring agent in Asian cooking. Cassava has been found to be a crop that can be relied upon as a low cost staple food in urban centres and as a source of steady income for rural households. This however will depend on how it can be processed into a safe form (6). Overtime, consistent processing of cassava into intermediate and or final products has been a major challenge in the cassava industrialization and transformation process. Surplus production of cassava products enters international trade in different forms such as chips, broken dried roots, meal, flour and tapioca starch. Dried cassava roots and meals are used as raw materials for compounding animal feeds, while cassava starch is used for industrial purposes. Also grocery tapioca is used solely for human consumption.
2Cassava is called Africa’s food insurance because it gives stable yields even in the face of drought (10). In Africa, cassava provides a basic daily source of dietary energy. Roots are processed into a wide variety of granules, pastes, flours, etc., or consumed freshly boiled or raw. In most of the cassava-growing countries in Africa, the leaves are also consumed as a green vegetable, which provides protein and vitamins A and B. Cassava is beginning to be used in Africa in partial substitution for wheat flour.
3Nigeria is the world’s largest exporting country of dried cassava with a total of 77% of world export in 2005. The second largest exporting country is Vietnam, with 13.6% followed by Indonesia 5.8% and Costa Rica 2.1%. Cassava has been a major staple food crop in Nigeria. A staple as defined by IITA (16) is one that is eaten regularly and which provides a large proportion of the population’s energy and/or nutrients. Cassava serves this function as it is eaten raw or in processed form. As a result of growing urbanization, cassava has become an essential part of the diet of more than 70 million Nigerians (12). The estimated per capita consumption of cassava in Nigeria had been found to be more than 238 calories per person per day (8). Nigeria is the world’s largest producer of cassava with an average annual estimate of 45 million metric tonnes and this had long been translated into a global market share of 19 percent (15) (23). Azogu (5) asserted that at the end of the last decade, the quantity of cassava produced in Nigeria would have increased by 10 million tonnes by the middle of the present decade. Also, demand for cassava and its products have increased in both the national and international markets. This is as a result of the increased use of the crop for food by human and livestock and as an industrial raw material. The increase in demand has also been occasioned by on-going government policies that are aimed at encouraging production, utilization and export of value-added cassava products coupled with rapid population growth which has brought about the need for more convenience food. Therefore, cassava has the potential to fuel its commercialization in Nigeria. Thus, many Nigerians derive much of their food and employment from cassava production, processing, marketing and cassava based agro-industrial schemes.
4Lawal and Jaiyeola (19) opined that value addition improves the shelf life of agricultural products and generates income for participants. Since most government interventions and policies are aimed at integrating the rural poor into the mainstream of the economy, one of the ways of achieving this is by adding value to their produce, which involves various actors at the different value addition nodes. Among others, these actors include input suppliers, extension, producers/farmers, processors, transporters, marketers, end-users, etc. These actors play important roles in maintaining the value chain. However, the most prominent and indispensable actor is the processing actor which ensures that the cassava root, which is highly perishable with a very short shelf life is processed into intermediate or finished products. For processing actor to stay in business and consistently fulfil their portion of value addition, efficient use of inputs/resources is vital. To the best of our knowledge, research on cassava processing efficiency, particularly at country or regional level is scanty. It is therefore pertinent to carry out a study of this nature to analyse the technical efficiency of cassava processors and to also investigate which factors determine technical efficiency in cassava processing in Nigeria. The evaluation of the present efficiency of small scale cassava processing in Nigeria is therefore imperative. The main objective of this study is to analyse the technical efficiency of cassava processing firms and their determinants in Nigeria. This enabled us to identify the main driving factors of cassava processing efficiency in Nigeria.
Theoretical and empirical review
5Efficiency is a very important factor of productivity growth, especially in developing agricultural economies where resources are meagre and opportunities for developing and adopting better technologies are dwindling (4). In such economies, inefficiency studies help to indicate the potential possibility to raise productivity by improving efficiency without necessarily developing new technologies or increasing the resource base. The concept of efficiency is concerned with the relative performance of the processes used in transforming given inputs into outputs. Economic theory identifies at least three types of efficiency. These are technical, allocative and economic efficiencies. Our main concern in this study is technical efficiency, which according to (3) is defined as a production system that achieves a maximum attainable quantity of output from a given inputs. The approaches widely used in estimating technical efficiency are parametric and non-parametric methods. In this study, the parametric approach was used. In the parametric approach, econometric methods of either deterministic or stochastic methods are applied (17). According to Kumbhakar and Lovell (17) and, Meeusen and Broeck (20), the deterministic model regards all deviations in output as technical inefficiency effects regardless of the fact that deviations in output could be beyond the control of the producer. The Stochastic Frontier Production (SFP) Kumbhakar and Lovell (17) and, Meeusen and Broeck (20) allows for estimation of the household efficiency score by accounting for factors beyond the control of each producer. This also enhances the understanding of the factors that determine technical inefficiency of farm households (22).
6Generally, technical efficiency can be modelled as either output-oriented or input-oriented (18). Following Coelli et al. (9) and, Kumbhakar et al. (18), a stochastic production frontier model with output-oriented can be specified as (Equations I and II):
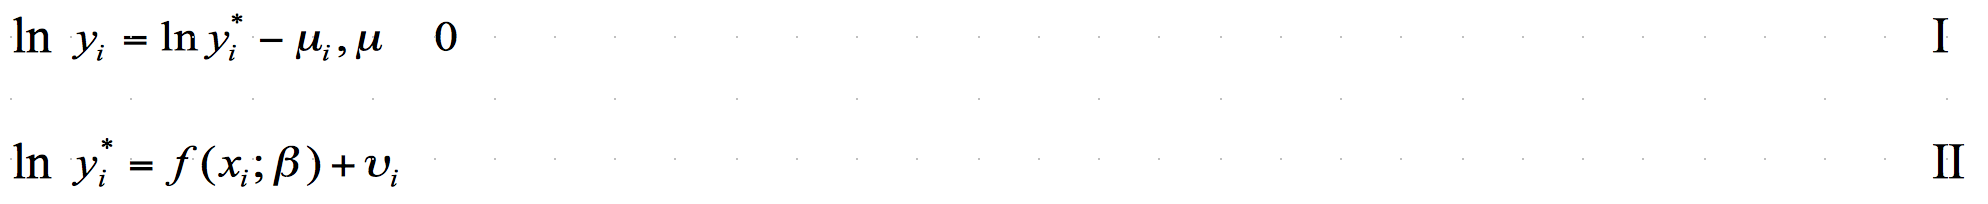
7where the subscript, i denotes observations (firms, individuals, etc.); yi is a scalar of observed output, xi is a j x 1 vector of input variables, β is a j x 1 vector of the corresponding coefficient vector vi is a zero-mean random error, and μi 0 is a production inefficiency term (3, 12), equation 2 defines the stochastic production frontier function.
8Given x, the frontier gives the maximum possible level of output, and it is stochastic because of vi. Given that μi 0 observed output (yi) is bounded below the output level (yi*)
9It is sometimes convenient to write the model in the equations III and IV (18):
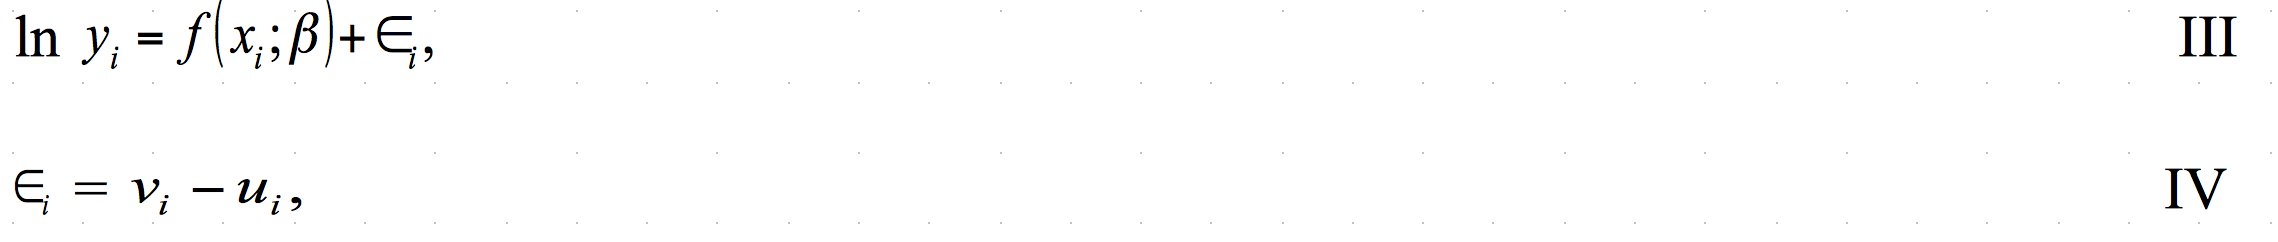
10Where
11εi is the error term which is often referred to as the “composed error term”.
12The term μi in equation 1, is the log difference between the maximum and actual output, i.e. (Equation V).

13Therefore μi *100% is the percentage by which actual output can be increased using the same input if production is fully efficient. In other words, μi *100% gives the percentage of output that is lost due to technical inefficiency. The estimated value of μi is referred to as the output-oriented “(technical) inefficiency”, with a value close to 0, implying close to fully efficient.
By re-arrangement equation 1 becomes equation VI.

Therefore, exp (-μi) gives the ratio of actual output to the maximum possible output. The ratio is referred to as the “technical efficiency” of firm i. Because μi ≥ 0, the ratio is bounded between 0 and 1, with a value equal to 1 implying that the firm is fully efficient technically. The value of exp (-μi) x 100% is the percentage of the maximum output that is produced by producer i. The efficiency measure exp (-μi) and the technical inefficiency measure μi are central to the study of efficiency (18).
Two approaches are commonly used in assessing the efficiency of a firm. These include the parametric and non-parametric procedures. The present study adopted the parametric procedure where a functional form for the production frontier f (x) was assumed. The estimation of the model involved:
(i) estimating the parameters of the frontier function f (x) and (ii) estimating the inefficiency.
Materials and methods
14Data: Cross-sectional primary data collected in 2014 over 274 cassava “processing actors” in the survey on “Enhancing the Competiveness of High Quality Cassava Flour in Nigeria” was used. The survey was conducted in four geo-political zones of Nigeria (North-central, South-East, South-south and South-west) through snow-balling sampling procedure. The data was collected with the use of structured questionnaire containing both open and close-ended items. Secondary data were also extracted from IITA database and other documented reports such as bulletins as well as other books on related issues. The data consist of variables on: Gross processing output value (in Naira) which measured the aggregate total processing output variable (Q) in the study. Inputs comprised three categories of cassava roots (CR), variable inputs (VI) (diesel, petrol, bags, plastic bag-lining, firewood, engine oil, palm oil, water, etc.), labour (LAB) (for peeling, washing, pressing, sieving, drying, frying, grating, milling, fetching water, etc.) and depreciated capital (DC). The variables used in the technical inefficiency equation include: whether processing firm is small-medium scale or otherwise (1, 0) (Z1), gender of processor (1= male; 0=female) (Z2), educational status of processor (1=formal education; 0=no formal education) (Z3), whether processing firm is sole proprietor (processing is done only by the respondent) or otherwise (1, 0) (Z4), whether processing firm is family-owned (processing is done with the family members) or otherwise (1, 0) (Z5), frequency of interaction (Z6), i.e. interaction with other owners of processing outfit to discuss matters on “ ways to improve on the processing business”, number of processed products (Z7), number of clients (Z8), proportion of orders (for processed cassava products) received (Z9), months of rain in year (number) (Z10) (Rainfall affects cassava production which in turn affects the availability of cassava roots for processing), whether processor attended training/workshop on processing techniques or not (1, 0) (Z11). The study adopts the stochastic frontier approach and utilizes the two-stage analytical procedure. In the first stage, we estimate the stochastic frontier processing function and region-specific technical efficiency (TE) values for processing firms. We considered various distributions of the efficiency terms including the normal/half-normal, exponential and the truncated normal distributions. We found that the normal/half-normal provides the best fit. The stochastic frontier function (I) and (II) is given by equation VII:

15where βi’s are parameters to be estimated and (the log forms of) Qi, CR, VI, LAB, DC are as earlier defined. The maximum estimate (MLE) technique was used to estimate equation 7.
16Table 1 provides the mean statistics of the variables used in (equation 7) for the various regions of study.
17The North-central region had the highest mean value of processing output while the South-south had the lowest value of processing output and highest value of labour. The highest mean value of depreciated capital was recorded in the South-south and the lowest in the South-east. The mean value of variable input was relatively high in the South-south as compared to other regions. In effect, there exists a high degree of variation across the regions with respect to these indicators.
18The factors that affected the processors’ level of efficiency were accounted for by estimating an inefficiency model as follows given in equation VIII (1, 2, 7, 24):

19where the Zs are as defined earlier.
20In equation 8, two sets of variables representing individual characteristics and processor’s technical knowledge were considered to examine the variations in individual technical efficiencies. The first set includes the processor’s enterprise information and classification (small-medium scale, large scale, gender of processor, educational status of processor, sole proprietorship, family-owned, incorporated company, interaction with other value chain actors, number of months of rain in year). The second set consisted of interaction with other actors, frequency of interaction, number of processed products, number of clients, orders received for processed products and attendance of training/workshop. These variables have been discussed and represented by Z1-Z11 in the data section and were used in equation VIII.
21Tables 2a and 2b report the statistics (frequencies and means) of the variables used in equation 8 for the various regions of study. It is again observed that the regions vary greatly with respect to all the classification of the processors’ enterprises and other characteristics that affect technical inefficiency.
Table 1 : Mean values of variables in the MLE equation
|
Region |
Variable |
Mean |
Std. dev. |
|
North- central (n=49) |
Output Value (Q) |
1864,274 |
827218.5 |
|
Cassava Roots (CR) |
45100.59 |
47877 |
|
|
Variable input (VI) |
14928.94 |
18345.5 |
|
|
Labour (LAB) |
21736.13 |
18833.15 |
|
|
Depreciated Capital (DC) |
41747.92 |
139297.3 |
|
|
South-east (n=73) |
Output Value (Q) |
1,219514 |
626070.8 |
|
Cassava Roots (CR) |
48418.22 |
65503.5 |
|
|
Variable input (VI) |
13472.77 |
17180.1 |
|
|
Labour (LAB) |
24685.92 |
29684.58 |
|
|
Depreciated Capital (DC) |
5965.95 |
10522.07 |
|
|
South-south (n=50) |
Output Value (Q) |
869229.6 |
944137.7 |
|
Cassava Roots (CR) |
70492.86 |
59878.25 |
|
|
Variable input (VI) |
31374.41 |
24482.03 |
|
|
Labour (LAB) |
55109.74 |
51635.22 |
|
|
Depreciated Capital (DC) |
23650.21 |
33431.13 |
|
|
South-west (n=103) |
Output Value (Q) |
1392969 |
1059155 |
|
Cassava Roots (CR) |
40872.26 |
19214.5 |
|
|
Variable input (VI) |
7719.92 |
15801.72 |
|
|
Labour (LAB) |
30433.56 |
18143.74 |
|
|
Depreciated Capital (DC) |
18500.64 |
11404.2 |
Table 2a: Frequency of variables (Dummy) used in the TE equation
|
North -central (n=49) |
South-east (n=73) |
South -south (n=50) |
South West (n=103) |
|||||
|
Variable |
Freq. |
Percent |
Freq. |
Percent |
Freq. |
Percent |
Freq. |
Percent |
|
Small medium scale |
||||||||
|
Yes |
39 |
79.59 |
58 |
79.45 |
47 |
94.00 |
8 |
7.77 |
|
No |
10 |
20.41 |
15 |
20.55 |
3 |
6.00 |
95 |
92.23 |
|
Gender |
||||||||
|
Male |
14 |
28.57 |
17 |
23.29 |
26 |
52 |
53 |
51.46 |
|
Female |
35 |
71.43 |
56 |
76.71 |
24 |
48 |
50 |
48.54 |
|
Attended Formal Education |
||||||||
|
Yes |
38 |
77.55 |
65 |
89.04 |
38 |
76.00 |
91 |
88.35 |
|
No |
11 |
22.45 |
8 |
10.96 |
12 |
24.00 |
12 |
11.65 |
|
Sole proprietorship |
||||||||
|
Yes |
37 |
75.51 |
45 |
61.64 |
37 |
74 |
76 |
73.76 |
|
No |
12 |
24.49 |
28 |
38.36 |
13 |
26 |
27 |
26.21 |
|
Family owned |
||||||||
|
Yes |
6 |
12.24 |
17 |
23.29 |
8 |
16.00 |
19 |
18.45 |
|
No |
43 |
87.76 |
56 |
76.71 |
42 |
84.00 |
84 |
81.55 |
|
Attended Training/Workshop |
||||||||
|
Yes |
49 |
100 |
73 |
100 |
19 |
38 |
52 |
50.49 |
|
No |
- |
- |
- |
- |
31 |
62 |
51 |
49.51 |
22
Table 2b : Mean values of variables used in the TE equation
|
Region |
Variable |
Mean |
Std. Dev. |
|
North- central (n=49) |
Number of processed products |
1.510204 |
0.739438 |
|
Number of Clients |
1.693878 |
0.713094 |
|
|
Orders received (proportion) |
0.004371 |
0.004729 |
|
|
Frequency of interaction |
7.877551 |
4.018876 |
|
|
Months of rain (no)/year |
5.469388 |
1.915964 |
|
|
South-east (n=73) |
Number of processed products |
1.753425 |
1.310013 |
|
Number of Clients |
1.616438 |
0.568383 |
|
|
Orders received (proportion) |
0.006012 |
0.007315 |
|
|
Frequency of interaction |
6.589041 |
3.542738 |
|
|
Months of rain (no)/year |
7.164384 |
0.957626 |
|
|
South-south (n=50) |
Number of processed products |
1.96 |
0.72731 |
|
Number of Clients |
1.78 |
0.50669 |
|
|
Orders received (proportion) |
0.002199 |
0.001541 |
|
|
Frequency of interaction |
7.44 |
4.974055 |
|
|
Months of rain (no)/year |
6.58 |
1.12649 |
|
|
South-west (n=103) |
Number of processed products |
3.524272 |
2.182123 |
|
Number of Clients |
1.825243 |
0.513106 |
|
|
Orders received (proportion) |
0.002334 |
0.001532 |
|
|
Frequency of interaction |
11.72816 |
7.336712 |
|
|
Months of rain (no)/year |
6.92233 |
1.160538 |
Results and discussion
Summary Statistics of the Variables used in the Stochastic Frontier model
23The summary statistics of the variables used in the stochastic frontier production (processing) function are presented in Tables 1. Results showed that the South-south and the South-West recorded the highest (N 31,374.41) and lowest (N 7,719.92) values of used variable inputs respectively. On labour use, the South-south recorded the highest (N 55,109.74) while the North-central recorded the lowest value of labour (N 21,736.13). Further results indicated that the highest mean cassava output value of N 1, 392,969 and the lowest mean output value of N 869,229.60 were recorded for South-west and South-south respectively. The lowest mean cassava output recorded for processing firms in this study was however observed to be far more than the mean value recorded in the study of Chukwuji et al. (7) for Gari output in Delta State, Nigeria. Our study used a combination of different products processed from cassava roots by an average processor in the study area in the computation of the output values. That could have accounted for the huge differences in the values recorded. We also compared the depreciated capital values in our study with those of Ehinmowo and Ojo (11). It was discovered that all the estimated values for the four regions in our data were more than the values computed in their study for the local and modern methods of processing. This could be due to the differences in the number and types of fixed assets used by the cassava processors in their different environment.
Estimates of the Stochastic Frontier model
The empirical results of the stochastic frontier production (processing) function are presented in Table 3. The model was estimated using the Maximum Likelihood (ML) technique since the technical efficiency term is not symmetrically distributed, but truncated at zero (πi 0, Ai). As reported on Table 3, two of the variables (labour and depreciated capital) included in the empirical model are significant at 5% and 10%. All the included variables (cassava roots, variable inputs and depreciated capital), with the exception of labour have positive regression parameter estimates, suggesting that an increase in these variables would result in higher processing output values. However, labour variable is negative, implying the law of diminishing returns in cassava processing with respect to this particular variable. This may be explained by the fact that a very high number of labour use (holding other variables constant) on the processing of the same kind of products will result in less than commensurate output.
The estimation results also indicate the relative importance of factor inputs in cassava products’ production (processing). Capital appears to be the most important factor in cassava products’ production with elasticity of 0.05. This implies that a one percent increase in depreciated capital value will result in 5 percent increase in processing output value (Note: Depreciated capital was weakly significant, so it may not have a serious implication on policy ). The contrary is the case for labour in which a percentage increase in this variable input will result in 10 percent decrease in processing output value.
Table 3 : Estimates of the Stochastic Frontier (normal/half-normal) Model
|
Variables |
Coefficient |
Std. error |
Z |
|
ln cassava roots |
0.0991157 |
.1315366 |
0.75 |
|
ln variable input |
0.0142871 |
.0256349 |
0.56 |
|
ln labour |
-0.102795 |
.043765 |
-2.35** |
|
ln depreciated capital |
0.0539897 |
.0311594 |
1.73*** |
|
Constant |
14.3326 |
1.380716 |
10.38 |
|
Lnsig2v |
-3.863786 |
.7326041 |
-5.27 |
|
Number of observation |
274 |
||
|
Wald chi2(4) |
8.01 |
||
|
Prob. > chi2 |
0.0913 |
||
|
Log likelihood |
323.67778 |
**Significant at 5%; *** Significant at 10%
Estimates of Technical Efficiencies
24The results also estimated the mean technical efficiency (pooled sample) at 0.43 as shown in Table 4, implying that cassava products’ production (processing) on average is about 57 percent below the frontier (or maximum feasible processing output). This also implies that a significant proportion of processing output is lost due to processing firm-specific technical inefficiency. On regional basis, though none of the regions appear to be efficient, the North-central region had the highest efficiency level (0.61) and South-south, the lowest (0.26). At the same time, the distribution of individual technical efficiency indices presented in Table 4 indicate large variations in the level of efficiency in the pooled and regional samples with individual index estimates ranging from a minimum of 0.0396 to a maximum of 0.9442 for the pooled sample. The regional technical efficiency ranges are as follows: North-central (between 0.0465 and 0.8457); South-east (between 0.03966 and 0.8160); South-south (between 0.0405 and 0.944) and South-west (between 0.0399 and 0.9337). The wide variation in the level of technical efficiency suggests the importance of processing firm specific characteristics such as the nature of technology and the processor’s management skills in attaining higher levels of processing efficiency. In about 85 percent (234 out of 274) of the overall sample, TE values lie below 80 percent. Of this set, 31 (out of 49), 72 (out of 73), 45 (out of 49) and 86 (out of 103) lie below a TE of 80 percent for North-central, South-east, South-south and South-west respectively.
Table 4: Distribution of Firm-specific Technical Efficiency
|
North Central (Mean TE=0.61 ) |
South East (Mean TE=0.42 ) |
South-South (Mean TE= 0.26) |
South-West (Mean TE=0.42 ) |
Nigeria (Pooled sample) (Mean TE= 0.43) |
||||||
|
No. of Firms |
% |
No. of Firms |
% |
No. of Firms |
% |
No. of Firms |
% |
No. of Firms |
% |
|
|
0-0.1 |
6 |
12.24 |
9 |
12.33 |
21 |
42.86 |
13 |
12.62 |
49 |
17.88 |
|
>0.1-0.2 |
- |
- |
5 |
6.85 |
9 |
18.37 |
19 |
18.45 |
36 |
13.14 |
|
>0.2-0.3 |
4 |
8.16 |
1 |
1.37 |
7 |
14.29 |
11 |
10.68 |
20 |
7.30 |
|
>0.3-0.4 |
1 |
2.04 |
18 |
24.66 |
1 |
2.04 |
14 |
13.59 |
- |
- |
|
>0.4-0.5 |
1 |
2.04 |
14 |
19.18 |
1 |
2.04 |
13 |
12.62 |
63 |
22.90 |
|
>0.5-0.6 |
3 |
6.12 |
14 |
19.18 |
2 |
4.08 |
- |
- |
19 |
6.93 |
|
>0.6-0.7 |
4 |
8.16 |
4 |
5.48 |
3 |
6.12 |
3 |
2.91 |
14 |
5.11 |
|
>0.7-0.8 |
12 |
24.49 |
7 |
9.59 |
1 |
2.04 |
13 |
12.62 |
33 |
12.04 |
|
>0.8-0.9 |
18 |
36.73 |
1 |
1.37 |
1 |
2.04 |
11 |
10.68 |
31 |
11.31 |
|
>0.9-1.0 |
- |
- |
- |
- |
3 |
6.12 |
6 |
5.83 |
9 |
3.28 |
|
Total |
49 |
100.00 |
73 |
100.00 |
49 |
100.00 |
103 |
100.00 |
274 |
100.00 |
Drivers of Technical efficiency (Determinants of Technical inefficiency)
25The estimation of technical efficiency for individual observations allows identification of factors influencing the level of this index. Therefore, such analysis helps producers, processors, industry experts and policy makers in terms of improving efficiency and achieving higher productivity levels. Consequently, variation in technical efficiency is due to firm-specific characteristics and firm operator’s (in our case, processor’s) technical knowledge. The estimated results (in Table 5) showed that small-medium scale processing, sole proprietorship, family-owned processing, family-owned processing outfit, number of processed products, number of orders received and attendance of training/workshop improved technical efficiency (reduce technical inefficiency) of processors. All the significant variables are with expected negative signs. 1Except for small-medium scale processing and number of processed products which were significant at 5%, all other significant variables were 2weak at 10% (See footnote 1). It is clear why the number of processed products increases efficiency. Certainly, more than one product can be processed from the same amount of resources, which is usually the case with the small and medium scale processors in the study regions. In effect, using the same amount of resources to process a couple of products triggers efficiency. The number of orders received for processed products naturally stimulates increased processing activities which in turn increases efficiency. Obviously, training and workshop on cassava products’ processing has enabled the processors to acquire more skills and knowledge about modern processing techniques.
Table 5 : Determinants of Technical inefficiency (Drivers of Technical efficiency): The inefficiency model
|
Variables |
Coefficient |
Std. error |
Z |
|
Dependent Variable: Technical Inefficiency Independent variables Small medium scale |
-1.253901 |
0.5669043 |
-2.21** |
|
Gender |
0.3103654 |
0.1974177 |
1.57 |
|
Attended Formal Education |
0.0332495 |
0.2559237 |
0.13 |
|
Sole proprietorship |
-0.6287999 |
0.3327465 |
-1.89*** |
|
Family owned |
-0.6712258 |
0.3939029 |
-1.70*** |
|
Frequency of interaction with other actors |
-1.968814 |
1.126188 |
-1.75*** |
|
Number of processed products |
-0.1210603 |
0.0531035 |
-2.28** |
|
Number of Clients |
-0.6021422 |
0.5397031 |
-1.12 |
|
Orders received (proportion) |
-0.3867779 |
0.2338008 |
-1.65*** |
|
Months of rain (no)/year |
0.0610757 |
0.0739759 |
0.83 |
|
Attended Training/Workshop |
-0.3841068 |
0.2185147 |
-1.76*** |
|
_cons |
2.572306 |
1.207689 |
2.13 |
|
Sigma v |
0.1448737 |
0.0530675 |
**Significant at 5%; *** Significant at 10%
Differences in Regional Technical Efficiencies
26Though the calculated regional mean technical efficiencies vary, in order to ascertain whether the differences are important, a hypothesis of no significant differences in the means was tested. This was carried out to ascertain the influence or combined effects of the determinants of technical efficiency. First, we had earlier reported (Table 4) that processing firms in the North-central have the largest mean TE (0.61), followed by South-east and South-west (0.42 and 0.42). The South-south had the smallest TE of 0.26. Our hypothesis of no difference was rejected (Table 6) and we conclude that the mean differences are significant.
27Although we necessarily concluded that there were differences in the regional technical efficiencies, sufficient multiple-comparison tests were also carried out to obtain information on the pairs of regional technical efficiencies where the differences were actually important. Multiple comparison tests were performed using the Bonferroni, Scheffé and Šidák normalizations. The results of the tests, which are presented as matrices are in Tables 7-9. We found that the differences between South-east and North central and between South-south and North-central are significant. Similarly, the differences between South-south and South-east and between South-west and South-south are also significant. All the differences are significant at 5%.
Table 6: Analysis of Variance
|
Source |
SS |
Df |
MS |
F-Ratio |
Prob>f |
|
Between groups |
31383.44 |
3 |
10461.14 |
15.10 |
0.0000 |
|
Within groups |
187021.33 |
270 |
692.671605 |
||
|
Total |
218404.782 |
273 |
800.01 |
Bartlett's test for equal variances: chi2 (3) = 9.9136; Prob>chi2 = 0.019
Table 7: Comparison of TEs by Region (Bonferroni)
|
North-central |
South-seat |
South-south |
|
|
South -East |
-19.26 (0.001) |
||
|
South -south |
-35.717 (0.00) |
-16.4573 (0.005) |
|
|
South-West |
-19.3028 (0.00) |
-0.042855 (1.00) |
16.4145 (0.002) |
Table 8: Multiple Comparison Test (Scheffé)
|
North-central |
South-seat |
South-south |
|
|
South -East |
-19.26 (0.002) |
||
|
South -south |
-35.717 (0.000) |
-16.4573 (0.010) |
|
|
South-West |
-19.3028 (0.000) |
-0.042855 (1.000) |
16.4145 (0.002) |
Table 9: Multiple Comparison Test (Šidák)
|
North-central |
South-seat |
South-south |
|
|
South -East |
-19.26 (0.001) |
||
|
South -south |
-35.717 (0.00) |
-16.4573 (0.005) |
|
|
South-West |
-19.3028 (0.001) |
-0.042855 (1.00) |
16.4145 (0.002) |
Conclusions
28This study analysed regional level technical efficiencies and their drivers for small-medium scale cassava processing firms in Nigeria. The regions for which technical efficiencies were analysed are: North-central, South-east, South-south and South-west. Using the Stochastic frontier approach, we have found out that the combined/pooled sample have a mean technical efficiency of 43%, indicating that, on the average, cassava processing output value can be improved by up to 57% with the existing inputs/resources. In all the regions surveyed, only the North-central region recorded a technical efficiency which is above fifty percent (61%) while the South-south recorded the least technical efficiency of 26%. In about 85% (234 out of 274) of the overall sample, TE values lie below 80 percent. Of this set, 31 (out of 49), 72 (out of 73), 45 (out of 49) and 86 (out of 103) lie below a TE of 80 percent for North-central, South-east, South-south and South-west respectively.
29The significant drivers of TE for cassava processing in Nigeria were found to be a mix of factors such as the processor’s enterprise classification (small-medium enterprise, sole proprietorship and family ownership), social factors (interaction with other actors), economic (number of processed products, number of clients, orders received) and capacity building (attendance of training/workshop).
30The study found that being a small-medium scale processor, a sole proprietor and having a family processing firm improves efficiency. In the context of this study, processing firms which are solely or family owned are as a matter of fact small-medium or in the least small enterprises. Policies aimed at encouraging these types of processors are necessary. There is need for stakeholders, particularly in the research and policy sectors to step up efforts at educating these processor categories to optimize the window of opportunity that the Government and other agencies is affording them in this regard. Interaction (frequency of interaction) with other actors possesses ample social dimension. This affords cassava value chain actors a lot of benefits which are believed to have a lot of implication on their businesses. A lot of reasons for interacting with other actors were adduced by the cassava processors. The reasons among others include for information exchange, business transaction, materials exchange and money exchange. Interaction can lead to information gathering concerning all the other benefits/reasons. Of utmost importance is also the fact that technology, knowledge or ideas can be transferred to the processing actors or they could be adopted through interaction. Since interaction is an important driver of cassava processing efficiency, organising the processors into social and business groups and clusters will go a long way in encouraging them to take processing business as a serious one that can transform their livelihood. When orders received for processing products are high and encouraging, increase in the number of processed products to meet the demand and orders will be stimulated. Processors are encouraged to add value to their products which will attract more patronage. Attendance at training and workshop is perhaps one of the most important drivers of processing efficiency in Nigeria. In the study areas, it was discovered that participating in training and workshop afforded the cassava processors specific knowledge about sourcing of fresh cassava roots, appropriate methods of peeling, washing, pressing, sieving drying, frying, grating, milling and marketing. Innovative ways of achieving the aforementioned processes are highlight of most of the training and workshops normally organised for the cassava processors. This is also an avenue where processors are thought value addition techniques. When all the factors (the determinants of technical efficiency), which were found to be driving cassava processing efficiency are combined and considered by the appropriate stakeholders in cassava sector of Nigeria, cassava processing will improve, value addition and chain will also improve. In effect, the issues under which these drivers can be made effective have important implications for consistent products' value Chain in Nigeria.
Bibliography
311. Abdul-Rahman A. & Abdul-Hana A., 2016. Empirical Investigation of Technical Efficiency of Smallholder Women Farmers in Northern Ghana. Br. J. Econ. Man. Trade, 13, 1, 1-16.
322. Adeyemo R., Oke J. T. O. & Akinola A.A., 2010, Economic Efficiency of Small Scale Farmers in Ogun State, Nigeria. Tropicultura, 28, 2, 84-88.
333. Agner D.J., Lovel C.A.K. & Schmdt P., 1977, Formulation and estimation of stochastic frontier production function models. J. Econometrics, 6, 1, 21-28.
344. Ali M. & Chaudhry M.A., 1990, Inter-regional Farm Efficiency in Pakistan’s Punjab: A frontier Production Function Study. J. Agri. Econ., 41, 2, 371-377.
355. Azogu I., 2010, Development of the Nigerian Cassava subsector: Initiatives, future potentials and the roles of the national centre for Agricultural Mechanization. A paper presented at the 2010 green Mediterranean forum, Rome. May, 2010.
366. Bokanga M., 1995, Cassava fermentation and industrialization of cassava food production. Proceedings of the 4th technical symposium of the International Society of Tropical Root Crops-Africa branch, TFC-AB, IITA Ibadan, 102 p.
377. Chukwuji C.O., Inoni O.E. & Ike P.C., 2007, Determinants of Technical Efficiency in Gari Processing in Delta State, Nigeria. J. Central Eur. Agric., 8, 3, 327-336.
388. Cock I.H., 1985, New Potential for a Neglected Crop. Boulder Colorado: West view Press.
399. Coelli T.J., Rao D.S.P. & Battesse G.E., 1998, An Introduction to Efficiency and Productivity Analysis. Kluwer Academic Publisher, Boston.
4010. Dixon A., Bandyopadhyay R., Coyne D., Ferguson M., Shaun R., Ferris B., Hanna R, Hughes J., Ingelbrecht I., Legg J., Mahungu N., Manyong V., Mowbray D., Neuenschwander P., Whyte J., Hartmann P. & Rodomiro O., 2003, Cassava:from poor farmer’s crop to pacesetter of African rural development. Chron. Hortic., 8-15.
4111. Ehinmowo, O. O. and S. O. Ojo. 2014. Analysis of Technical Efficiency of Cassava Procesing Methods among Small-scale Processors in South-west, Nigeria. Am. J. Rural Dev., 2, 2, 20-23.
4212. FAO, 2003, Food and Agriculture Organization (FAO) website. www.fao.org.
4313. FAO, 2014, Food and Agriculture Organization (FAO) website. www.fao.org.
4414. FAO & IFAD, 2005, A Review of Cassava in Africa with Countries Cases Studies on Nigeria, Ghana, United Republic of Tanzania, Uganda and Benin. Proceedings of the validation forum on the global cassava development strategy Volume 2. International Fund for Agricultural Development and Food and Agricultural Organisation of the United Nations, Rome.
4515. Hillocks R., 2002, “Cassava in Africa”. CABI Publishing.
4616. IITA 2007, A strategy for industrialization of cassava in Africa: Proceedings of a small Group meeting, 14-18 November 2005, Ibadan, Nigeria.
4717. Kumbhakar, S. C and C. A. K. Lovell. 2000. Stochastic Frontier Analysis. Cambridge University Press.
4818. Kumbhakar, S. C., Hung-Jen Wang and A. P. Horncastle. 2015. A Practitioner’s guide to Stochastic Frontier Analysis using STATA. Cambridge University Press.
4919. Lawal J.O. & Jaiyeola C.O., 2007, Economic Analysis of Cocoa Wine Produced from Cocoa Powder. J. Agric. Food Environ., 5, 2, 71-76.
5020. Meeusen W. & den Broeck V., 1977, Efficiency Estimates from Cobb-Douglas Production Function with Composed Error. Int. Econ. Rev., 18, 435-444.
5121. Nweke F. I., 1997, Cassava is a cash crop in Africa: A viewpoint. IITA Research, 1997, 14/15, 26-27.
5222. Onumah, E. E., Brümmer. B., Hörstgen-Schwark, G. H., 2010. Elements which delimitate Technical Efficiency of Fish Farms in Ghana. J. W. Aquac. Soc., 4, 4, 506-518.
5323. Phillips T. P., Taylor D. S., Sanni L. & Akoroda, M.O., 2004, A cassava industrial revolution in Nigeria: The Potential for a new industrial crop”. International Institute of Tropical Agriculture, Ibadan, Nigeria”. International Fund for Agricultural Development, Food and Agriculture Organization of the United Nations, Rome, Italy.
5424. Shanmugam K.R. & Venkataramani A., 2006. Technical Efficiency in Agricultural Production and its Determinants: An Exploratory Study at the District Level. Indian J. Agric. Econ., 61, 2, 169-181.
Voetnoten
1 The target respondents (processing firms) were the small-medium scale categories. This study did not therefore cover the large or commercial processing firms with which any comparison can be made.
2 Variables in italics are weakly significant. They may not imply any serious policy recommendation.
Om dit artikel te citeren:
Over : A. Abass
Nigerian, Ph.D., Post-harvest Technology, International Institute of Tropical Agriculture, Regional Hub for Eastern Africa, Dar es Salaam, Tanzania
Over : L.Olarinde
Nigerian, Ph.D., Agricultural Economics, Department of Agricultural Economics, Ladoke Akintola University of Technology, PMB 4000 Ogbomoso, Nigeria.
Email: loolarinde@lautech.edu.ng
Over : V. Okoruwa
Nigerian, Ph.D., Agricultural Economics, Department of Agricultural Economics, University of Ibadan, Ibadan, Nigeria
Over : P. Amaza
Nigerian, Ph.D., Agricultural Economics, Department of Agricultural Economics and Extension, University of Jos, Jos, Nigeria
Over : W. Awoyale
Nigerian, Ph.D., Food Technology, Department of Food, Agriculture and Bioengineering, Kwara State University, Malete, Ilorin, Kwara State, Nigeria
Over : T. Alabi
Nigerian, Ph.D., Geographic Information Systems, International Institute of Tropical Agriculture, Oyo Road, Ibadan, Nigeria
Over : M. Ndavi
Kenyan, Ph.D., Agricultural Economics, Programme Management Department, International Fund for Agricultural Development, Rome, Italy
