- Startpagina tijdschrift
- Volume 90 - Année 2021
- Articles
- Correlation analysis between biophysical indices and Land Surface Temperature using remote sensing and GIS in Guelma city (Algeria)
Weergave(s): 5984 (16 ULiège)
Download(s): 200 (0 ULiège)
Correlation analysis between biophysical indices and Land Surface Temperature using remote sensing and GIS in Guelma city (Algeria)

Documenten bij dit artikel
Version PDF originaleAbstract
Urbanization is a phenomenon that is driven by humans. It has significantly influenced biodiversity, ecosystem processes and regional climate. This work explores the relationship between seven biophysical variables (NDVI, SAVI, Greenness, Albedo, DBI, NDBI, and NDBaI indices), and LST over a period of 30 years (1990–2020), based on remote sensing & GIS. A time-series of Landsat images TM, ETM+ and OLI/TIRS data as well as various geospatial approaches were used to facilitate the analysis. The findings have revealed that urban/built-up areas of Guelma city has increased by (20.76 km2), in contrast to the agricultural and forest areas, which have been reduced by (138.26 km2 and 2.7 km2). The average temperature of urban setting was (31,43 C°) in 1990, whereas, it reached (41,90 C°) in 2020. The lowest temperature values were observed in forest bodies with (26,55 C°) in 1990 and (37,78 C°) in 2020. There is a possible rise in LST over time scale owing to the substitution of green cover by urban soil areas. Generally, there was a noticeable increase in mean LST of 10,47 C° for urban areas. The coefficient of correlation between the biophysical indices and LST shows that a strong negative correlation exists between vegetation biophysical indices (NDVI, SAVI and Greenness) and LST. In addition to this, the urban biophysical indices (Albedo, DBI, NDBI, and NDBaI) can effectively retrieve the LST. They were positively correlated in all years. DBI and LST have the highest consistently rising positive relationship (R = 0,62).This investigation provides us with clear understanding of the impacts that the urbanization and biophysical indices have on LST.
Inhoudstafel
1. Introduction
1Urbanization is one of the most important factors triggering a transition in Land Use and Land Cover (LULC) (Pal et al., 2017). Change in LULC has been shown to have a major impact on climate through various pathways. Those pathways are found to modulate the surface energy balance which in turn affects the land surface temperature (LST) leading to changes in the region’s micro-climate (Wang et al., 2018; Gogoi et al., 2019; Jain et al., 2017). The Land surface temperature (LST) is one of the major biophysical parameters for urban health analysis. (Xiao and Weng 2007). The temperature in urban environments and the increasing areas of built-up surfaces is higher than in areas covered by vegetation and water (Carleton et al., 2016; Tan et al., 2020). In addition, the surface climate can be affected by changes in urban space and removal of vegetation due to urbanization (Oke., 1987; Das et al., 2020). al., 2016; Tan et al., 2020). This local temperature variation has a negative effect on both people and environment as it hinders air quality, increases energy consumption, affects biological control and human health (Kikegawa et al., 2003; Grimmond, 2007; Meineke et al, 2014; Plocoste et al, 2014).
2Compared to conventional observation methods which are used at meteorological stations, remote sensing tracking of LST provides wide range measurements and good spatial consistency. This technique has therefore grown rapidly in thermal environment research (Liu et al., 2016; Wang et al., 2018). The use of remote sensing data in conjunction with Geographic Information Systems (GIS) is effective in mapping urban areas, modeling urban growth, monitoring LULC's dynamic changes; estimating LST (Bhagyanagar et al., 2012; Kimuku et al., 2017) and extracting biophysical components (Subrata et al., 2018; Firozjaei et al., 2019). In many studies estimating land surface temperature (LST) and urban heat island (UHI) phenomena over urban ecosystems, remote sensing methods have been shown to be fruitful (Asgarian et al., 2015; Guo et al., 2015; Mohan and Kandya, 2015; Carleton et al., 2016; Das et al., 2020).
3Several research have been published to study the relationship between LST / LULC in which an increase in land surface temperatures (LST) is considered one of the main effects of LULC changes) especially in urban centers (Aboelnour and Engel, 2018; Pal and Ziaul, 2017; Weng et al., 2004). The relationships between LST, Normalized Difference built-up Index (NDBI), and Normalized Difference Vegetation Index (NDVI) were established using Linear Regression (Guha et al., 2018; Ferrelli et al., 2018). Other studies examined the impact of urban biophysical composition on LST based on the determination of such biophysical indices as the normalized difference vegetation index (NDVI), normalized difference built-up index (NDBI), Normalized Difference Water Index (NDWI), Normalized Difference Bareness Index (NDBal), Modified Normalized and Difference Water Index (MNDWI), etc. (Sharma et al. 2013; Li and Liu 2009). The present study will provide a deep analysis on the relationship between the biophysical indices such as (NDVI, SAVI, Greenness, NDBI, NDBal, DBI and Albedo) and LST by the integration of Remote sensing data and statistical analysis. For the last 30 years (1990-2020), the LULC and LST transformation pattern of Guelma has been analyzed using the temporal Landsat TM, ETM+ and OLI 8 data to determine the trend and degree of anthropogenic impact on climate due to urbanization.
4Guelma is affected by rapid and massive urban growth which has strongly disrupted the space, thus generating profound spatial and environmental transformations (Guechi et al., 2017). The local authorities of Guelma have revised the Master Plan for Development and Urban Planning (PDAU) in 2013 so as to provide solutions for land availability for the future urbanization of Guelma municipality. They have recourse to the inter-communal group of Guelma as part of the postponement of urban growth from the municipality of Guelma to neighboring municipalities. It included the chief city of Guelma, and the three neighboring communes including El Fdjouj; Belkhair and Ben Djarah. The position of Guelma in the center, places these communes in its field of attraction. It suffers from the weight of the communes of the wilaya in general and the neighboring communes in particular. Due to their proximity to the large urban center and containing land with high agricultural potential, the towns of Belkheir; El Fedjoudj and Bendjerrah have not experienced the desired growth. This raises the potential to exploit agricultural land and forest for urban purposes. Reducing vegetation and replacing it with impermeable surfaces, such as asphalt and concrete, are directly related to urbanization factors that have environmental and social consequences (Mitchell., 2011).
5This research objective is to determine and analyze the relationship between urban and green biophysical parameters and land surface temperature (LST) variation in the context of urbanization from 1990 to 2020 in Guelma, using remote sensing & GIS.
2. Study Area and Dataset used
6Our case study (Guelma inter-municipal grouping) is situated in the center of Guelma province, northeast Algeria, approximately 60 km south of the Mediterranean Sea (36°27′43″N - 7°25′33″E) and 305 m above sea level (Figure 1). This region occupies a total area of 282,11 km2 and has a semi-arid climate with cool winters, an average annual temperature of 21.5 ° C and an average annual rainfall of 150.3 mm (Aouissi, 2010.). It is possible to distinguish two periods in the year, eight months of cold and wet weather from October to May and four months of hot and dry weather from June to September. It is a group of four municipalities (the chief town of the Wilaya; the municipality of Bendjarah; the municipality of Belkhair and the municipality of el Fdjouj). They have a context with an agricultural vocation par excellence. The position of Guelma in the center, places these municipalities in its field of attraction. It is subjected to the pressure of the municipalities of the province in general and the bordering municipalities in particular.

Figure 1: Location map of Guelma and inter-communal grouping
7The main data sets in this analysis were time series of Landsat images captured by Landsat TM, Landsat ETM+ and Landsat Operational Land Imager (OLI)/Thermal Infrared Sensor (TIRS) sensors. The data are presented in Table 1. The selected satellite data was cloud-free. All datasets have been downloaded as a georeferenced data set from the website of the United States Geological Survey (USGS) (https:/earthexplorer.usgs.gov). Satellite images were acquired at an interval of 10 years and during the same season (the dry season) to prevent phenological variability. The Image processing software ArcGIS Spatial Analyst (version 10.5), Environment for Visualizing Images (ENVI) version 5.0, and SPSS 22 were used for conducting the statistical analysis.
8In this research, after using a radiometric calibration, the fast line-of-sight atmospheric analysis of hypercube (FLAASH) was utilized for atmospheric correction in ENVI5.1 software. Some parameters are considered for running FLAASH including satellite overpass time, sensor altitude, geographical location, region-related specific atmospheric model, and solar zenith angle at satellite pass (Landsat 5, 7 and 8).
Table 1: Landsat data specification used in the study
|
LANDSAT_SCENE_ID |
SPACECRAFT_ID |
Acquisition Date |
UTM_ZONE |
Spatial Resolution |
|
LT51930351990159FUI00 |
L5_TM |
08/06/1990 |
32 |
30 |
|
LE71930352000179FUI00 |
L7_ETM |
27/06/2000 |
32 |
30 |
|
LE71930352010174EDC00 |
L7_ETM |
23/06/2010 |
32 |
30 |
|
LC81930352020159LGN00 |
LANDSAT_8 |
19/06/2020 |
32 |
30 |
3. Research methods

Figure 2: Flowchart of the research methodology incorporated in the study
3.1. Land Cover Classification and land use change
9Remotely sensed data are commonly used for mapping land use / cover maps. Supervised technique for classification of Maximum Likelihood (MLC) is employed in this study. MLC is the most generally used supervised classification and it is used in a variety of applications (Pushpendra, et al., 2014). MLC doesn’t only perform better than the other defined parametric classifications but it also considers the variance-covariance within the class distributions (Erdas, 1999). Images of the years 1990, 2000, 2010 and 2020 were classified with the software ENVI 5.1 so as to obtain land cover distribution. Composite imagery with false color band combination of bands (RGB = 543 for Landsat 8, RGB = 432 for Landsat 5TM and Landsat 7 ETM+) was utilized to obtain better visualization of the urban environments. Four signature classes were selected for classification like urban area, forest, agricultural land and bare land. Residential buildings, highways, industries, commercial buildings, etc… illustrate the urban area. The bare land represents the soil and unused land. The agricultural land represents both the areas with and without vegetation. Training areas have been developed by selecting one or more polygons for each class. Pixels were taken to be the training pixels for a specific class within the training area. Then, Confusion Matrix Using Ground Truth ROIs in ENVI5.0 was utilized in this analysis to test the accuracy of the classification of maximum likelihood. The Kappa coefficient was also obtained for each year.
3.2. LST Estimation
10The thermal infrared bands of different Landsat image types (band 6 of Landsat 5 TM, Landsat 7 ETM+ and band 10 of Landsat 8) (Landsat (7), 2011; Landsat (8), 2015) were utilized to estimate LST of the inter-municipal grouping of Guelma. Landsat OLI-TIRS had two thermal bands, which are band 10 and band 11. However, band 11 displays striping so only band 10 was used here. A single window algorithm based on NDVI (Xiaolei et al., 2014) was utilized to extract land surface emissivity (LSE). The steps below are employed to retrieve LST from thermal images and NDVI images.
3.2.1. Radiance image calculation
11The raw digital number (DN) values of TM and ETM+ have been converted to luminance radiation or top-of-atmospheric (TOA) radiance by means of equation (1) (Chander & Markham, 2003).

12Where, DN: is the pixel digital number for band 6, Lmax = 17.04 (mW/(cm2sr·m)) is spectral at-sensor radiance that is scaled to QCALmax, Lmin = 0 (mW/(cm2sr·m)) is spectral at-sensor radiance that is scaled to QCALmin, QCALmax = 255 is Maximum quantized calibrated pixel value corresponding to Lmax, QCALmin = 0 is Minimum quantized calibrated pixel value corresponding to Lmin.
13For Landsat OLI-TIRS the equation (2) is used (USGS, 2014).

14Where, ML, is band specific multiplicative rescaling factor; DN is the pixel digital number for band 10; AL is the band specific additive rescaling factor from the metadata.
3.2.2. Radiant temperature calculation
15The following equation (3) was used to calculate radiant temperature using radiance images which are obtained from thermal bands (Chander et al., 2009).

16Where, TK, is the temperature in Kelvin (K), K1 is the prelaunch calibration of constant 1 in unit of W/ (m2sr·m), K2: is the prelaunch calibration constant 2 in Kelvin.
3.2.3. NDVI image creation
17The NDVI index is a measure of the surface vegetation quantity and vigor. Given that vegetation is well reflected in the near infrared part of the spectrum, NDVI has become a simple graphical indicator for assessing target vegetation coverage. Several researches focused on understanding the LST-NDVI relationship (Lo et al., 1997). The NDVI images were calculated with the equation (4).

18Where, NIR and Red are the spectral reflectance of vegetation in the near infrared and Red bands.
3.2.4. Emissivity calculation
19The emissivity is calculated with the following equation:

20Where, pv: is the vegetation proportion which can be derived from the NDVI image based on the equation (6) (Xiaolei et al., 2014).

3.2.5. LST Calculation
21Outputs derived from (3) and (5) were then used as inputs to estimate the LST using the equation below. (Jeevalakshmi et al., 2017)

22Where: λ the is central wavelength (in μm) of the Landsat thermal band and p = 1.438 x 10⁻² mK.
3.3 Biophysical indices extraction
23In order to derive surface biophysical parameters based on Landsat 5, 7, and 8 imagery, separate spectral indices were calculated. The biophysical indices were represented in this analysis by the normalized difference vegetation index (NDVI), the soil-adjusted vegetation index (SAVI), the greenness, the normalized difference built‑up index (NDBI), the normalized difference bareness index (NDBal), the dry built-up index (DBI) and albedo (Table 2, Fairouz 2019).
Table 2: Description of the biophysical indices
|
Biophysical indices |
Formula |
Source |
|
NDVI |
NIR- Red / NIR+ Red |
Liu et al. (2018), |
|
SAVI |
(1+L) (NIR- Red) / NIR+ Red + L |
Huete, A.R., 1988 |
|
Greenness |
-0.2941Blue -0.243Green -0.5424Red + 0.7276NIR +(For Landsat 8) 0.0713SWIR1 - 0.1608SWIR2 |
Liu, Q., 2014 |
|
NDBI |
SWIR – NIR / SWIR+ NIR |
Zha et al., 2003 |
|
NDBal |
SWIR – TIRS1 / SWIR+ TIRS1 |
Sarma et al.,2015 |
|
DBI |
(Blue – TIRS1/ Blue + TIRS1)- NDVI |
Rasul et al.,2018 |
|
Albedo |
((0.356*B1) + (0.130*B2) + (0.373*B3) + (0.085*B4) + (0.072*B5) -0.018) / 1.016 |
Liang, S. 2000 |
4. Results
4.1 Urban LC Classification
24The urban land cover classification results in inter-municipal grouping of Guelma from 1990 to 2020 are shown in Figure 3. The confusion matrices of the classification (Maximum Likelihood) were obtained to evaluate the classification accuracy. The details of the accuracy assessment are summarized in Table 3. From 1990 to 2020, overall accuracy was higher than 90%. As stated by (Lea and Curtis., 2010), accuracy-assessment reporting requires the overall accuracy to be above 0.9. In this study, it was successfully achieved. The Kappa coefficient was also higher than 0.77. Since the accuracy of the classifications was adequate, this was used to further analytic studies.
Table 3: The details of the classification accuracy assessment
|
Year |
Overall Accuracy |
Kappa Coefficients |
|
08/06/1990 |
90.88% |
0.82 |
|
27/06/2000 |
95.99% |
0.91 |
|
23/06/2010 |
90.23% |
0,78 |
|
19/06/2020 |
95.12% |
0.91 |
25The spatial LU/LC maps of inter-municipal grouping of Guelma are shown in Figure n°3. It is clear that there has been an urban expansion in the inter-municipal grouping of Guelma in the last 30 years. This growth is concentrated in the Guelma municipality which is very significant compared to the other municipalities. Guelma is regarded as one of the Algerian cities which fulfills very important urban functions. Those functions exert an influence on both the adjacent communes and even on the rest of the communes of the province. As indicated in the (PDAU 2013).

Figure 3: Spatial LU/LC maps (urban, forest, agricultural lands, and bare lands class) of inter-municipal grouping of Guelma between 1990 and 2020
26To further explain urbanization during the study period in Guelma's inter-municipal classification, the areas of different land cover and their changes were calculated and are presented in Table n° 4 and Figure n°4.
Table 3: Land cover change in inter-municipal grouping of Guelma from 1990 to 2020.
(Units: km2)

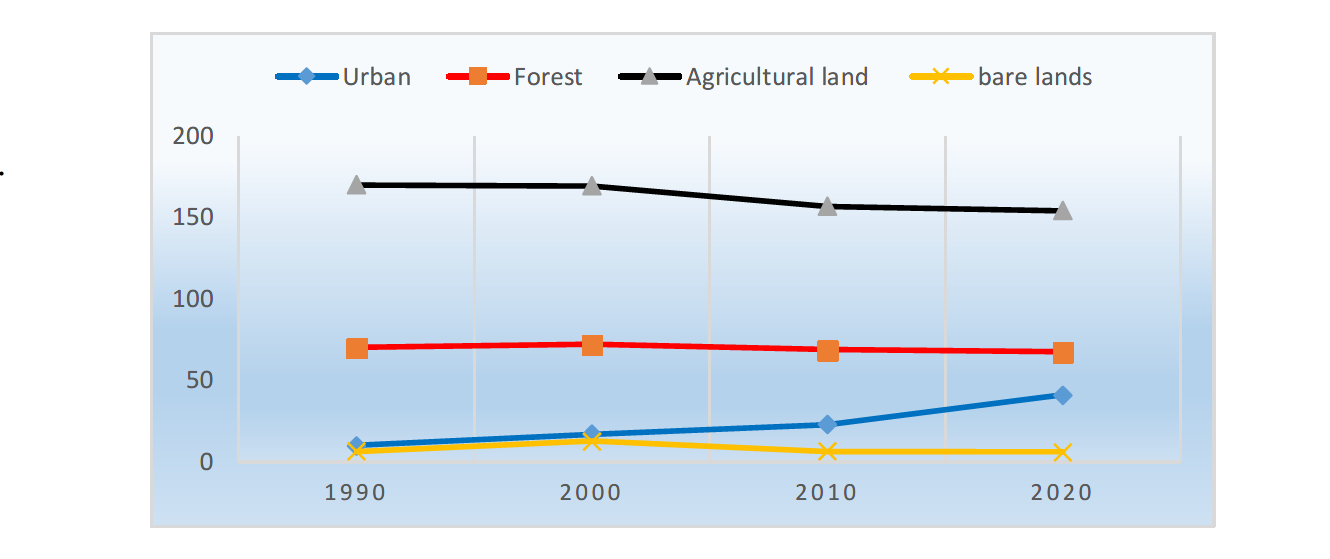
Figure 4: Urban land cover change in inter-municipal grouping of Guelma from 1990 to 2020
27According to it can be concluded that from 1990 to 2020 there is a rising trend in the urban area from 10.06 km2 to 40.88 km2 respectively. However, the area of bare land, agriculture land and the forest has decreased. For the bare lands, the area decreases from 12.06 km2 in 2000 to 5.98 km2 in 2020. For the agricultural land, the surface has decreased from 170.02 km2 in 1990 to 154.14 km2 in 2020. For the forest, it has decreased from 70.04 km2 in 2000 to 67.34 km2 in 2020. Based on these findings, we conclude that the urban land cover increase is directly proportional to the reduction in green cover especially in the last period. The result of analysis is consistent with (Guechi et al., 2017).
4.2 Relationship between LC class and LST
28The LSTs estimated from Landsat images are shown in figure 5, which shows a clear gradient between urban areas; bare land; agriculture land and forests from 1990to 2020. It illustrates the temperature increase in urban setting in the 1990.This is principally owing to higher radiant temperatures in urban surface materials. The results of this analysis are consistent with other studies related to rise in LST due to the changing of LULC (Carleton et al., 2016; Tan et al., 2020; Das et al., 2020). In contrast, for the years: 2000 and 2010, agricultural land has the highest temperature owing to the absence of vegetation.
29The mean temperature values of LST for each class are presented in table 4.

Figure 5: Mean land surface temperature in inter-municipal grouping of Guelma for corresponding years to land cover classification
Table 4: Mean LST (C°) for corresponding urban land cover

30In 1990, the average temperature of urban settings was 31.43 °C, whereas, in 2020 it has reached 41.90 °C. Calculating the average of the temperature values for every class has revealed that the lowest temperature values were observed in forest bodies with 26.55 °C° in 1990 and 37.78 °C in 2020. It is found to be the same result of (Aboelnour and Engel, 2018; Pal and Ziaul,2017; Weng et al., 2004).
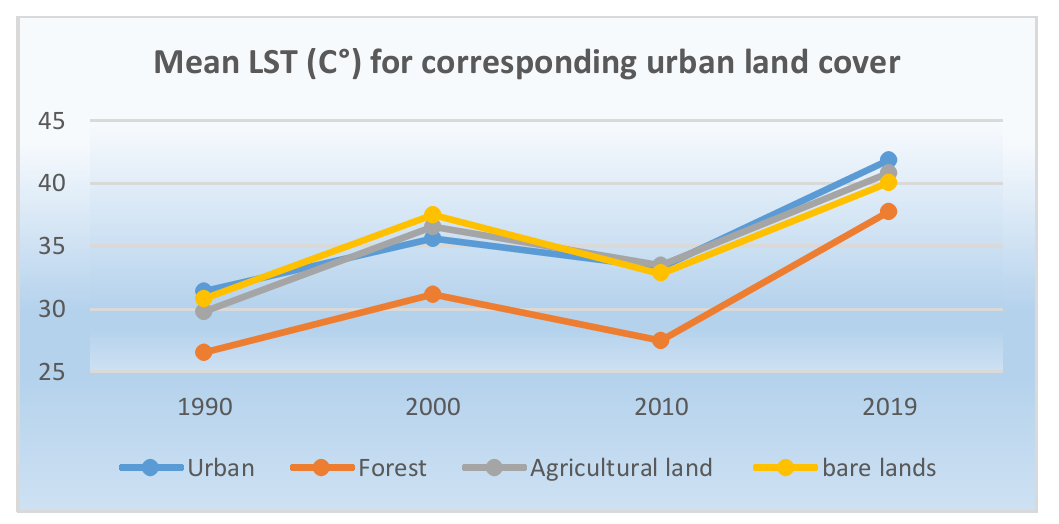
Figure 6: Mean LST (°C) for corresponding urban land cover
4.3 Biophysical indices Dynamics
4.3.1 Urban biophysical indices
31The spatiotemporal variation of some biophysical indices has been analyzed from1990 to 2020.The biophysical indices are more dynamic and the changes are visible over the built-up area.
32According to figure 7, maximum values of NDBI varied between 509 in 1990 and 125684 in 2020, while the minimum values varied between 40 in 1990 and 24493.9 in 2020. Also, maximum values of NDBal varied between 0.25 in 1990 and 0.35 in 2020, while the minimum values varied between -0.68 in 1990 and -0.62 in 2020. For the DBI index, the maximum values varied between -0.14 in 1990 and 0.3 in 2020. Finally, the maximum values of Albedo of our study area varied between 240 in 1990 and 47905.8 in 2020.
33The analysis of those results indicates that we have recorded an increase in the urban biophysical indices; the increase of the urban area generates an increase of the biophysical indices values.

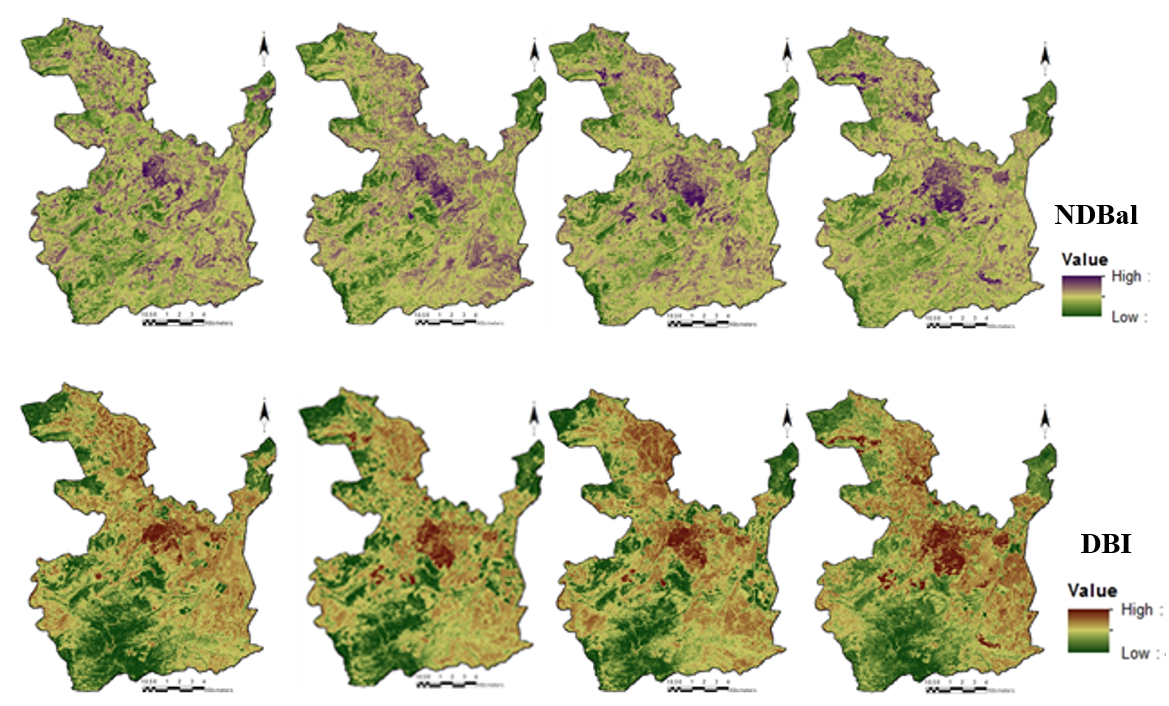

Figure 7: Composition of urban biophysical indices and their spatio-temporal dynamics
4.3.2 Vegetation biophysical indices

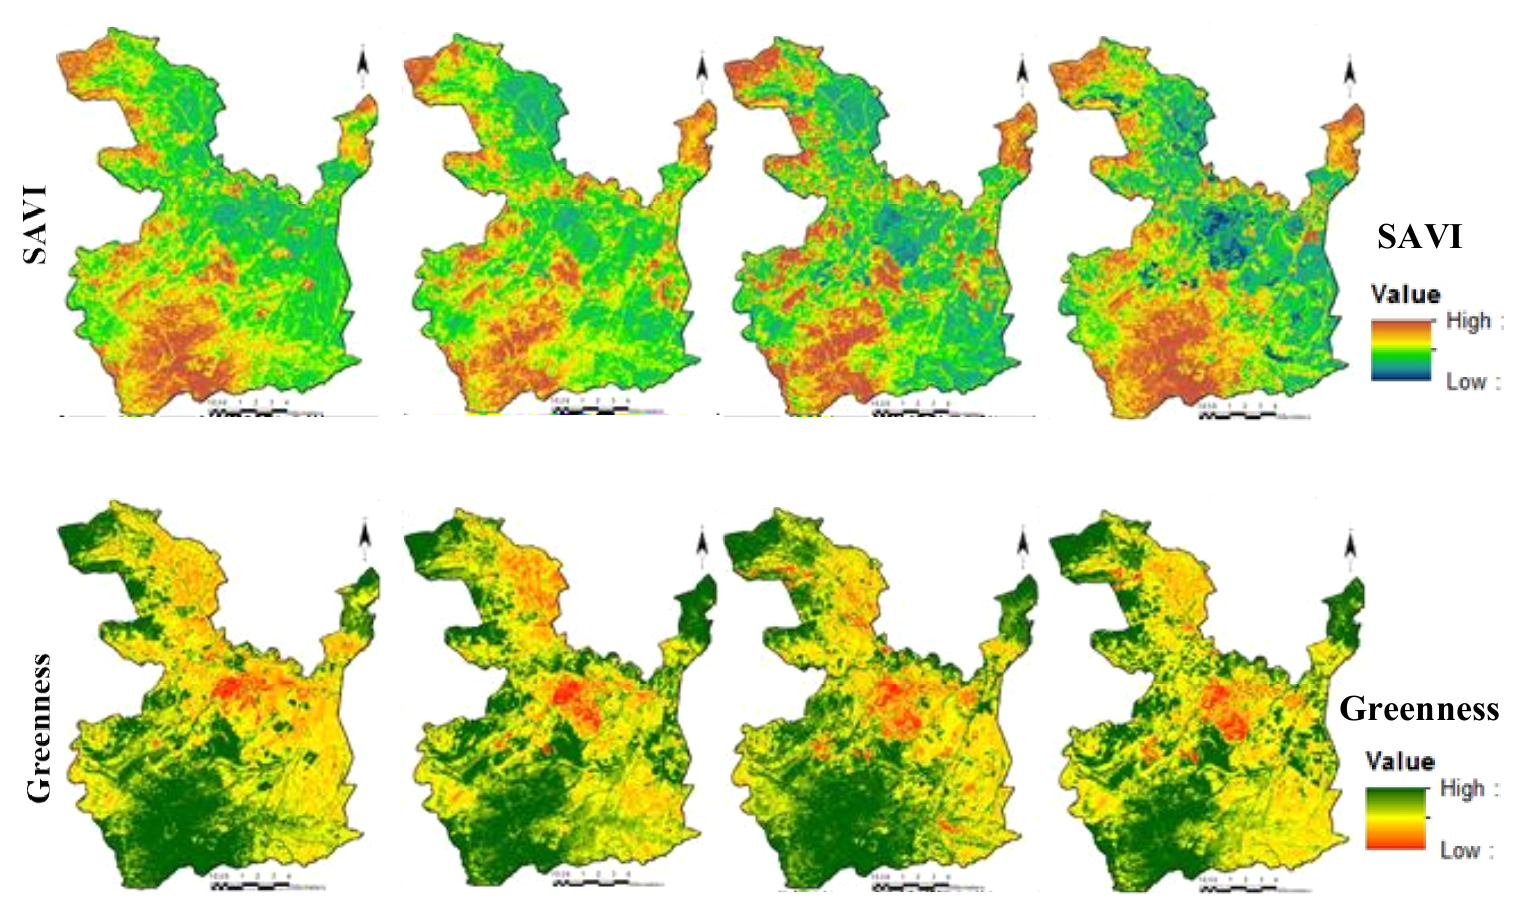
Figure 8: Composition of vegetation biophysical indices and their spatio-temporal dynamics
34According to figure 8, the maximum values of NDVI varied between 0.75 in 1990 and 0.59 in 2020, also the highest values of greenness index varied between 83.17 in 1990 and 72.28 in 2020. Furthermore, the maximum values of SAVI index varied between 1.12 in 1990 and 0.89 in 2020.The recorded results indicate that there is a decrease in all the values of the vegetation biophysical indices; the decrease of the green cover of our study area from 1990 to 2020 generates a decrease in the values of those indices.
35It is seen that the urban biophysical indices such as (NDBI, NDBal, DBI and Albedo) which designates the built-up area is gradually increasing with different time periods. Consequently, the vegetation biophysical indices such as (NDVI, SAVI and Greenness) are gradually decreasing in response to built-up expansion. The increasing and decreasing pattern of biophysical indices are evidently identified by the maps in Figures 7 and 8, in the period between 1990 and 2020. (Subrata et al., 2018) found similar results.
4.4 Relationship between Biophysical indices and LST
36In order to determine the relationship between Biophysical indices and LST; 168 sample points which were randomly collected from LST, NDBI, NDBal, DBI, Albedo, NDVI, SAVI and Greenness images were utilized to perform the appropriate regression and represented in a graphic form with a 2D scatterplot in figures 9 and 10. The coefficients of Pearson correlation and P values were calculated and presented in Tables 5 and 6.
Table 5: LST- Urban Biophysical indices relationships from 1990 to 2020
|
1990 |
2000 |
2010 |
2020 |
|||||
|
R |
P |
R |
P |
R |
P |
R |
P |
|
|
Albedo |
0,352** |
0,000003 |
0,192* |
0,013 |
0,308** |
0,000049 |
0,212** |
0,007 |
|
DBI |
0,651** |
1.2786E-21 |
0,376** |
4.9718E-7 |
0,629** |
2,2686E-19 |
0,629** |
2,266E-19 |
|
NDBal |
0,504** |
3.3512E-12 |
0,270** |
0,000414 |
0,356** |
0,000002 |
0,587** |
1,902E-16 |
|
NDBI |
0,651** |
2.3477E-22 |
0,338** |
0,000007 |
0,217** |
0,005 |
0,372** |
0,000001 |
37** The correlation is significant at the 0.01 level (bilateral). N= 168
Table 6: LST- Vegetation Biophysical indices relationships from 1990 to 2020
|
1990 |
2000 |
2010 |
2020 |
|||||
|
R |
P |
R |
P |
R |
P |
R |
P |
|
|
Greenness |
-0,728** |
5.322E-29 |
-0,348** |
0,000004 |
-,682** |
1,2234E-23 |
-0, 517** |
7,148E-13 |
|
NDVI |
-0,722** |
2.1063E-28 |
-0,600** |
0,024E-18 |
-0,562** |
2,2958E-15 |
-0,363** |
0,000002 |
|
SAVI |
-0,723** |
2.0763E-28 |
-0,352** |
0,000003 |
-0,562** |
2,3197E-15 |
-0,703** |
1,218E-25 |
38** The correlation is significant at the 0.01 level (bilateral). N= 168
39The impacts of biophysical indices on LST was statistically significant at the P < 0.01 significance level. Tables 5 and 6.
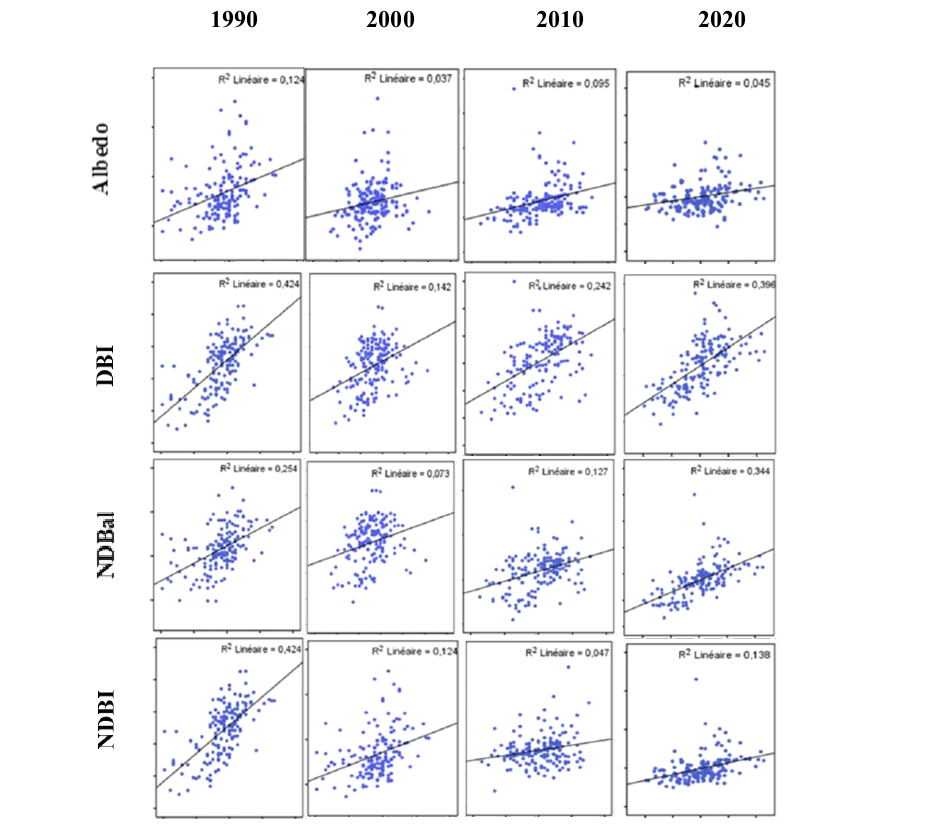
Figure 9: LST- Urban biophysical indices correlation from 1990 to 2020
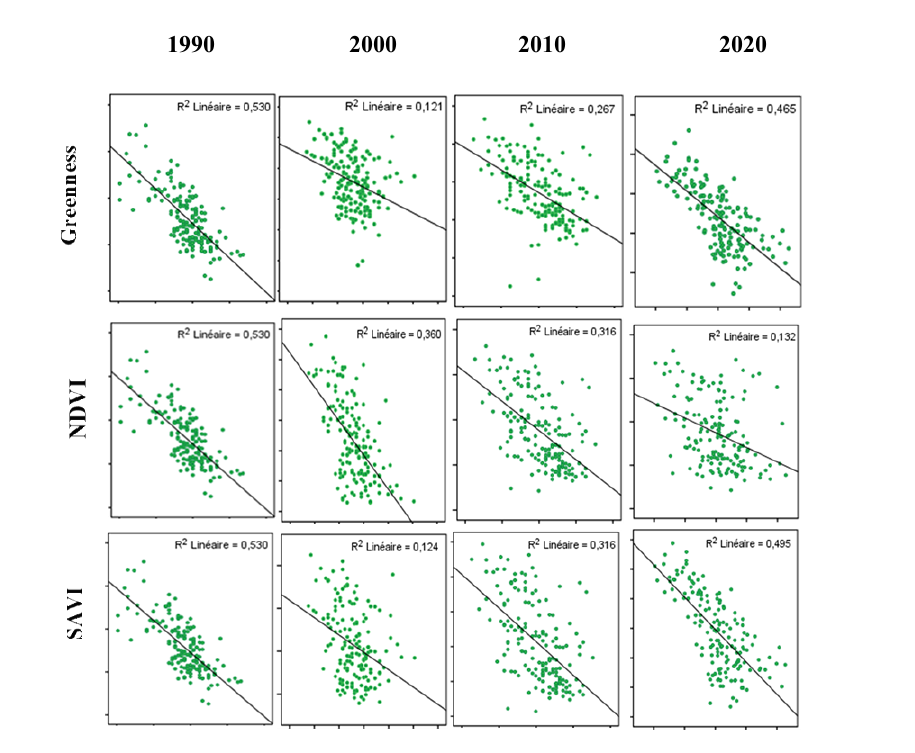
Figure 10: LST- Vegetation biophysical indices correlation from 1990 to 2020
40The data utilized in the regression model is represented in a graphic form with a 2D scatter plot in figures 9 and 10. According to figure 10, it can be concluded that from 1990 to 2020, the vegetation biophysical indices is negatively correlated with LST. Thus, the areas with least vegetation are experiencing higher LST. On the other hand, figure 9, the urban biophysical indices and the LST are positively correlated.
41The medium and low correlation between LST and vegetal biophysical indices in 2000, 2010 and 2020 could be related to vegetation density especially in 1990 where vegetation density is increasing, LST and plant biophysical indices are strongly correlated.
42This analysis concluded that the LST increases with the increasing urban biophysical indices and the reduction of vegetal biophysical indices on the surface, and vice versa
5. Discussions
5.1 Urban expansion: A mutation of LU / LC and its impact on LST
43Like all medium-sized cities in Algeria, Guelma is affected by rapid and massive urban growth, which has strongly disrupted the space, (Figure 03; Figure 05) thus generating profound spatial and environmental transformations. The position of Guelma in the center, places these communes in its field of attraction (Guechi et al., 2017; PDAU., 2013). Because of its environmental attraction, the city has undergone explosive growth in the form of residential, commercial, retail, transit networks, parking lots. This growth was at the expense of transforming LU/LC classes such as urban land, agriculture land, forests and bare land. This modification pattern in LU/LC dynamics has significantly altered the scenario of the LST distribution (Wang et al., 2018; Gogoi et al., 2019; Zhao et al.,2013; Li et al., 2018; Pal and Ziaul, 2017; Weng et al., 2004).
44Vegetation also displays lower temperatures compared to urban areas along the time scale. This can be best explained by the fact that through the transpiration process, forest or vegetation can refresh land surface. Compared to vegetation areas, higher temperature values are shown in both urban and bare land, in line with the actual studies (Fonseka et al., 2019; Gong et al., 2006). Urban areas experience higher temperatures principally owing to the construction materials used. One reason for having high temperature values for bare land is that the majority of bare fields are in areas where there is a reduction in vegetation cover. This leads to an increase in the quantity of thermal energy emitted by the land bare ground and therefore an increase in temperature. (Fonseka et al., 2019). Green spaces in urban areas have a positive effect on the urban climate and microclimate. They help regulate the urban climate and mitigate the urban heat island (UHI) by creating a cooling effect through shade and evapotranspiration. (Gherraz et al., 2020).
45In this analysis, Figure 5 and Table 4 which represent the years: 2000 and 2010, agricultural land has the highest temperature owing to the absence of vegetation. The period of last June in Guelma is known as the time of barley and wheat harvest. However, in 2020, LST of the urban space presents the most important value compared to LST of the agricultural land, the forest and the bare land although the agricultural land presents land without vegetations. The results confirm that the strong urbanization which marked the last years accompanied by the increase in the air temperature (28°C in June 1990 to 39°C in June 2020) and the decrease in precipitation values (16.2mm in June 1990 to 14.3mm in 2020) which influence the abundance of green cover led to an increase in LST values (Das et al., 2020; Zhao et al.,2013; Li et al., 2018).There is a possible rise in LST over time scale due to the substitution of green cover by urban soil areas. Generally, there was a noticeable increase in the mean LST of 10,47 °C° see table 4 for urban areas. In this research, the majority the urban expansion is resulted from the conversion of green cover.
5.2 Biophysical indices effect on LST
46The findings of this study indicate that both LULC and biophysical indices are equally important in resolving the variability of urban landscape estimation of UHI and LST. In addition, they have the potential to better understand the nonlinear impact of anthropogenic activities on the urban environment. More recent studies have shown similar findings (Subrata et al., 2018; Sannigrahi et al., 2017). Therefore, NDVI and NDBI are not sufficient indices for the analysis of LST in towns dominated by barren land, which absorbs a significant volume of solar radiation. (Mathew et al.,2018) also demonstrated the ineffectiveness of NDBI in Surface LST Intensity studies because bare soils and dry vegetation covers show high spectral reflection in the SWIR band resulting in positive NDBI values for drier plants and low NDBI values for barren soil compared to built-up areas. It is the same for GUELMA, especially in the summer. A negative relationship was found between vegetation indices and LST (Table 6), which was most likely owing to the impact of surface thermal inertia and evapotranspiration. Moreover, the relationship between the LST variations and NDVI variations is supposed to be direct.
6. Conclusion
47The study highlights the change in LULC over the last three decades in the inter-municipal Grouping of Guelma. An integrated approach of remote sensing and GIS has been successfully employed for determining LULC and LST relations using satellite images. The results indicate that urban/built-up areas of Guelma city have dramatically expanded, while green cover has declined. Changes to LULC have been followed by changes in LST. Knowing that the region of Guelma is characterized by a semi-arid climate and taking into consideration the climate changes in the period of study (the changes in air temperature values from 28°C in June 1990 to 39°C in June 2020, and the changes in precipitation values from 16.2mm in June 1990 to 14.3mm in 2020). We have recorded the highest values of vegetation biophysical indices (NDVI, SAVI, Greenness index), the lowest values of urban biophysical indices (Albedo, NDBI, NDBal, DBI) and the lowest values of LST (31.43°C in urban area and 26.5°C in forest) in 1990 due to the important area of the green cover, whereas we have recorded the highest values of the urban biophysical indices, the highest values of LST (41.90°C in urban area and 37.7 °C in forest) and the lowest values of vegetation biophysical indices in 2020 due to the expansion of the urban area on one side, and on the other side the increase of precipitation values which influence the green cover. Consequently, the increase in vegetation biophysical indices generates a decrease in LST values and vice versa, while the increase in urban biophysical indices generates an increase in LST values and vice versa. This confirms the role of vegetation in decreasing LST. Moreover, the variation in temperature between the urban setting and forest areas significantly widened. Therefore, the excessive presence of vegetation was a crucial factor that influences LST.
48This investigation has revealed a strong negative correlation that exists between vegetation biophysical indices and LST. As long as the values of vegetation biophysical indices are high, the LST values are low. In addition to this, the urban biophysical indices can effectively describe the LST. They were positively correlated in all years.
49We can conclude that by specifically explaining the quantitative relationships of LST with the surface characteristics that the biophysical indices significantly influence the magnitude of LST. This research broadens our scientific understanding of the impact of the land cover pattern on the LST. The findings are crucial for future theoretical and management use. Indeed, urban planners and natural resource managers try to reduce the effect of urban development on UHI. They can realize that it is vital to balance the relative quantity of various kinds of LC features as well as enhancing their spatial distributions. This result can also be used to determine the sustainability of urban environments by evaluating the reduction of environments productivity and the rise in a city's greenhouse gas emissions due to the loss of green cover and urban growth.
7. References
50Aboelnour M, Engel BA (2018) Application of remote sensing techniques and geographic information systems to analyze land surface temperature in response to land use/land cover change in Greater Cairo Region, Egypt. Journal of Geographic Information System 10(01): 57.
51Aouissi, A. (2009). Microbiologie et physico-chimie de l’eau des puits et des sources de la région de Guelma (Nord-est de l’Algérie) (Doctoral dissertation). https://dspace.univ-guelma.dz/jspui/bitstream/123456789/475/1/mem_amina.pdf
52Asgarian, A., Amiri, B. J., & Sakieh, Y. (2015). Assessing the effect of green cover spatial patterns on urban land surface temperature using landscape metrics approach. Urban Ecosystems, 18(1), 209-222.
53Bhagyanagar, R., Kawal, B.M., Dwarakish, G.S. and Surathkal, S. (2012) Land Use/Land Cover Change and Urban Expansion during 1983-2008 in the Coastal Area of Dakshina Kannada District, South India. Journal of Applied Remote Sensing, 6,63576-1, https://doi.org/10.1117/1.JRS.6.063576
54Carleton, T., & Hsiang, S. (2016). Social and economic impacts of climate. Science, 353 (6304), 1122.
55Chander, G., Markham, B., & Helder, D. ( 2009). Summary of current radiometric calibration coefficients for Landsat MSS, TM, ETM+, and EO-1 ALI sensors. Remote Sensing of Environment, 113(5), 893-903.
56Das, N., Mondal, P., Sutradhar, S., & Ghosh, R. (2020). Assessment of variation of land use/land cover and its impact on land surface temperature of Asansol subdivision. The Egyptian Journal of Remote Sensing and Space Science, 24 (1), 131-149.
57Ferrelli, F., Huamantinco Cisneros, M. A., Delgado, A. L., & Piccolo, M. C. (2018). Spatial and temporal analysis of the LST-NDVI relationship for the study of land cover changes and their contribution to urban planning in Monte Hermoso, Argentina.Documents d’Anàlisa Geogràphica, 64(1), 25-47.
58Firozjaei, M. K., Alavipanah, S. K., Liu, H., Sedighi, A., Mijani, N., Kiavarz, M., & Weng, Q. (2019). A PCA–OLS Model for Assessing the Impact of Surface Biophysical Parameters on Land Surface Temperature Variations. Remote Sensing, 11(18), 2094.
59Fonseka, H., Zhang, H., Sun, Y., Su, H., & Lin., H. L. (2019.). Urbanization and Its Impacts on Land Surface Temperature in Colombo Metropolitan Area, Sri Lanka, from 1988 to 2016. Remote sensing, 11(8), 957-975.
60Gherraz, H., Guechi, I., & Alkama, D. (2020). Quantifying the effects of spatial patterns of green spaces on urban climate and urban heat island in a semi-arid climate. Bulletin de la Société Royale des Sciences de Liège, 89, 164-185.
61Ghosh, S., Chatterjee, N. D., & Dinda, S. (2019). Relation between urban biophysical composition and dynamics of land surface temperature in the Kolkata metropolitan area: a GIS and statistical based analysis for sustainable planning. Modeling Earth Systems and Environment, 5(1), 307-329.
62Gogoi, P. P., Vinoj, V., Swain, D., Roberts, G., Dash, J., & Tripathy, S. (2019). Land use and land cover change effect on surface temperature over Eastern India. Scientific reports, 9(1), 1-10.
63Gong, A., Chen, Y., Li, J., Gong, H., & Li, X. (2006.). Spatial distribution patterns of the urban heat island based on remote sensing images: A case study in Beijing, China. J.Indian Soc.Remote Sens, 38(4), 654-663
64Grimmond, S. (2007). Urbanization and global environmental change: local effects of urban warming. Geographical, journal, 173 (4), 83–88.
65Guechi I., Alkama Dj . (2017). Apport de la télédétection pour la cartographie diachronique de l’étalement urbain et l’analyse morphologique de l’agglomération de Guelma. Courrier du Savoir – N°24, pp.73-80
66Guechi, I. (2018), «L’influence des contraintes physiques sur l’urbanisation des établissements humains, cas de l’agglomération de Guelma», Mémoire de doctorat, Université de Biskra. http://thesis.univ-biskra.dz/4012/1/Th%C3%A8se%20GUECHI%20Imen.pdf
67Guha, S., Govil, H., Dey, A., & Gill, N. (2018). Analytical study of land surface temperature with NDVI and NDBI using Landsat 8 OLI and TIRS data in Florence and Naples city, Italy. European Journal of Remote Sensing, 51(1), 667-678.
68Guo, G., Wu, Z., Xiao, R., Chen, Y., Liu, X., & Zhang, X. (2015). Impacts of urban biophysical composition on land surface temperature in urban heat island clusters. Landscape and Urban Planning, 135, 1-10.
69Huete AR (1988) A soil-adjusted vegetation index (SAVI). Remote Sens Env 25(3):295–309.
70Jain, M., Dimri, A. P., & Niyogi, D. (2017). Land-Air Interactions over Urban-Rural Transects Using Satellite Observations: Analysis over Delhi, India from 1991–2016. Remote Sensing, 9(12), 1283.
71Jeevalakshmi, D., Narayana Reddy, S., Manikiam, B. (2017). Land Surface Temperature Retrieval from LANDSAT data using Emissivity Estimation. International Journal of Applied Engineering Research ISSN 0973-4562 Volume 12, Number 20 (2017) pp. 9679-9687.
72Kikegawa, Y., Genchi, Y., Yoshikado, H., & Kondo, H. (2003). Development of a numerical simulation system toward comprehensive assessments of urban warming countermeasures including their impacts upon the urban buildings’ . Appl. Energy 76 (. energy-demands, 76 (4), 449-466.
73Kikegawa, Y., Genchi, Y., Yoshikado, H., & Kondo, H. (2003). Development of a numerical simulation system toward comprehensive assessments of urban warming countermeasures including their impacts upon the urban buildings’ . Appl. Energy 76 (. energy-demands, 76 (4), 449-466.
74Kimuku, C.W. and Ngigi, M. (2017) Study of Urban Heat Island Trends to Aid in Urban Planning in Nakuru County-Kenya. Journal of Geographic Information System, 9, 309-325.
75Landsat, N. (. (s.d.). Science Data Users Handbook. 2011-03-11. Consulté le October 23, 2019, sur http://landsathandbook.gsfc.nasa.gov/inst_cal/prog_sect8_2.html
76Landsat, N. (. (s.d.). Science Data Users Handbook. 2015-june. http://landsat.usgs.gov/l8handbook.php . Accessed 30 September 2019.
77Li, H., Liu, Q. H., & Zou, J. (2009). Relationships of LST to NDBI and NDVI in Changsha-Zhuzhou-Xiangtan area based on MODIS data. Scientia Geographica Sinica, 2, 018.
78Liang, S. (2001). Narrowband to broadband conversions of land surface albedo I: Algorithms. Remote sensing of environment, 76(2), 213-238.
79Liu Y, Song W, Deng X (2018) Understanding the spatiotemporal variation of urban land expansion in oasis cities by integrating remote sensing and multi-dimensional DPSIR-based indicators. Ecological Indicators, 96,23-37.
80Liu, Q., Liu, G., Huang, C., Liu, S., & Zhao, J. (2014, July). A tasseled cap transformation for Landsat 8 OLI TOA reflectance images. In 2014 IEEE Geoscience and Remote Sensing Symposium (pp. 541-544). IEEE.
81Lo, C., Quattrochi, D., & Luvall, J. ( 1997). Application of high-resolution thermal infrared remote sensing and GIS to assess the urban heat island effect. Int. J. Remote Sens, 18, 287–304.
82Meineke, E., Dunn, R., & Frank, S. (2014). Early pest development and loss of biological control are associated with urban warming. Biol. Lett.10, 20140586.
83Mitchell, B. C. (2011). Urbanization and Land Surface Temperature in Pinellas County, Florida, Graduate Theses and Dissertations. Récupéré sur http://scholarcommons.usf.edu/etd/3250
84Mohan, M., & Kandya, A. (2015). Impact of urbanization and land-use/land-cover change on diurnal temperature range: A case study of tropical urban airshed of India using remote sensing data. Science of the Total Environment, 506, 453-465.
85Oke, T. (1987). Boundary Layer Climates (éd. 2nd Edition). (T. &. Group, Éd.) London, UK.
86Pal, S., & Ziaul, S. (2017). Detection of land use and land cover change and land surface temperature in English Bazar urban centre. Egyptian Journal of Remote Sensing and Space Science, 20(1), 125–145.
87Pal, S., & Ziaul, S. K. (2017). Detection of land use and land cover change and land surface temperature in English Bazar urban centre. The Egyptian Journal of Remote Sensing and Space Science, 20(1), 125-145.
88Plocoste, T., Jacoby-Koaly, S., Molinié, J., & Petit, R. (2014). Evidence of the effect of an urban heat island on air quality near a landfill. Urban Clim, 10, 745–757.
89Pushpendra, S., Singh., Vivekanand.T, & Anil.K. (2014). Analysis of Supervised Maximum Likelihood Classification for Remote Sensing Image, IEEE International Conference on Recent Advances and Innovations in Engineering (ICRAIE-2014). Jaipur, India. DOI: 10.1109/ICRAIE.2014.6909319
90Rasul, A., Balzter, H., Ibrahim, G. R. F., Hameed, H. M., Wheeler, J., Adamu, B., & Najmaddin, P. M. (2018). Applying built-up and bare-soil indices from landsat 8 to cities in dry climates. Land, 7(3), 81.
91Sannigrahi, S., Bhatt, S., Rahmat, S., Uniyal, B., Banerjee, S., Chakraborti, S., & Bhatt, A. (2018). Analyzing the role of biophysical compositions in minimizing urban land surface temperature and urban heating. Urban climate, 24, 803-819.
92Sharma R, Chakraborty A, Joshi PK (2015) Geospatial quantification and analysis of environmental changes in urbanizing city of Kolkata (India). Environ Monit Assess 187(1):4206.
93Sharma, R., Ghosh, A., & Joshi, P. K. (2013). Analysing spatio-temporal footprints of urbanization on environment of Surat city using satellite-derived bio-physical parameters. Geocarto International, 28(5), 420-438.
94Tan, J., Yu, D., Li, Q., Tan, X., & Zhou, W. (2020). Spatial relationship between land-use/land-cover change and land surface temperature in the Dongting Lake area, China. Scientific Reports, 10(1), 1-9.
95UNFPA. (Retrieved February 12, 2017, from http://www.unfpa.org/urbanization ). Urbanization.
96USGS. ( 2014). Using the USGS Landsat 8 product. Retrieved December 11, 2014 from https://landsat.usgs.gov/using-usgs-landsat-8-product
97Wang, Y. C., Hu, B. K., Myint, S. W., Feng, C. C., Chow, W. T., & Passy, P. F. (2018). Patterns of land change and their potential impacts on land surface temperature change in Yangon, Myanmar. Science of the Total Environment, 643, 738-750.
98Weng, Q., Lu, D., & Schubring, J. (2004). Estimation of land surface temperature–vegetation abundance relationship for urban heat island studies. Remote sensing of Environment, 89(4), 467-483.
99Xie, M., Wang, Y., Chang, Q., Fu, M., & Ye, M. (2013). Assessment of landscape patterns affecting land surface temperature in different biophysical gradients in Shenzhen, China. Urban Ecosystems, 16(4), 871-886.
100Zha, Y., Gao, J., & Ni, S. (2003). Use of normalized difference built-up index in automatically mapping urban areas from TM imagery. International journal of remote sensing, 24(3), 583-594.

