

- Accueil
- Volume 86 - Année 2017
- Articles
- Sorption thermodynamic and kinetic studies of Lead removal from aqueous solutions by nano Tricalcium phosphate


Visualisation(s): 2065 (8 ULiège)
Téléchargement(s): 221 (0 ULiège)

Sorption thermodynamic and kinetic studies of Lead removal from aqueous solutions by nano Tricalcium phosphate

Document(s) associé(s)
Version PDF originaleAbstract
Nano tricalcium phosphate particles were prepared by a wet method from aqueous solutions and characterized using TEM, XRD, and BET-N2 adsorption measurements. The potential of the synthesized nano tricalcium phosphate particles to remove Pb2+ cations from aqueous solutions was investigated in batch reactor under different experimental condition. The effects of initial concentration, adsorbent dosage, contact time and temperature were studied in batch experiments. The sorption of Pb2+ by nano-TCP increased as the initial concentration of lead ion increased in the medium. Various thermodynamic parameters, such as G°, H° and S° were calculated. Thermodynamics of Pb2+ cation sorption onto nano-TCP system pointed at spontaneous and endothermic nature of the process. The pseudo-first order, pseudo-second order and intraparticle diffusion kinetic models were applied to study the kinetics of the sorption processes. The pseudo-second order kinetic model provided the best correlation (R2 > 0.999) of the used experimental data compared to the pseudo-first order and intraparticle diffusion kinetic models. The maximum Pb2+ adsorbed was found to be 4761.90 mg/g. It was found that the sorption of Pb2+ on nano-TCP was correlated well (R2 = 0.982) with the Langmuir equation as compared to Freundlich and Dubinin–Kaganer–Radushkevich (D-K-R) isotherm equation under the concentration range studied. This study indicated that nano-TCP could be used as an efficient adsorbent for removal of Pb2+ from aqueous solution.
Table des matières
1. Introduction
1The adsorption procedures are introduced as a favorable way for the remediation of aquatic waste because of its efficacy, practicality and economical feasibility, as depending on the used adsorbents [1].
2Lead is one of the most ubiquitous contaminants in the soil and aqueous environments. A severe environmental Pb contamination can often be found at shooting ranges where the soil Pb concentration sometimes exceeds 10000 mg kg-1 because of spent lead bullets. In Iran, many shooting ranges are generally located in mountainous regions and suffer from the degradation of natural vegetation due to Pb toxicity, which may have the potential to augment the Pb contamination via soil erosion. Therefore, development of cost-effective technologies is necessary to reduce the mobility and bioavailability of Pb in soil and water environments [2, 3].
3The low cost adsorbents are the naturally occurring materials with high abundance such as aluminosilicates, clay and zeolite [4]. Calcium phosphate minerals have also been considered amongst ideal low cost adsorbents because of their high sorption capacity for metal ions, the least solubility and the highest stability in a wide range of pH, and high stability under reducing/oxidizing conditions [5].
4Tricalcium phosphate (TCP) is a principal component of calcium phosphate compound and has been of interest in industry and medical fields. Its synthetic particles find many applications in bioceramic, catalysts, and powders for artificial teeth and bones paste germicides. These properties relate to various surface characteristics of TCP, e.g., surface functional groups, acidity and basicity, surface charge, hydrophilicity and porosity [6].
5Nano-materials represent a promising application in a variety of areas due to their high surface area and reactivity and their ability to become dispersed in aqueous solution. Nano-material usually displays higher reactivity and sorption ability than the same material of normal size [7-10].
6The objective of this preliminary study was to investigate the feasibility of Pb2+ removal from aqueous solution by nano TCP prepared by precipitation method. The dynamic behavior of adsorption was investigated on the effect of initial metal ion concentration, contact time, adsorbent mass and temperature of solution. The thermodynamic and kinetics parameters were also evaluated from the adsorption measurements. The Langmuir, Freundlich and D-K-R models were used to fit the equilibrium isotherm.
2. Material and methods
2.1. Preparation of nano Tricalcium phosphate sorbents
7All chemicals used in this work were of analytical grade and the aqueous solutions were prepared using double distilled water. Nano Tricalcium phosphate compounds were prepared via solution-precipitation method [6] using Ca(NO3)2.4H2O (AnalarNo.10305) and (NH4)2HPO4 (Merck No. 1205) as starting materials and ammonia solution as agents for pH adjustment.
8A 250 ml of 0.06 M (NH4)2HPO4 solution was slowly added drop wise to the 250 ml of 0.09 M Ca(NO3)2.4H2O solution while being vigorously stirred at about 25 °C. In all experiments the pH of Ca(NO3)2.4H2O stock solutions was adjusted by ammonia at pH=11. Under this condition, a stoichiometry composition can be easily achieved through the following reaction [6]:
93 Ca(NO3)2.4H2O + 2 (NH4)2HPO4 + 2 NH4OH → Ca3(PO4)2 + 6 NH4NO3 + 4 H2O
10Once the precipitation reaction was complete, the suspensions were centrifuged at 3000 rpm for 60 seconds to remove the precipitates. The resulting powders were next dried in an oven at 80 °C for 1 hour. The particles synthesized were characterized by the following methods. Transmission electron microscopy (TEM) was used to characterize TCP particles. For this purpose, particles were deposited onto Cu grids, which support a “holey” carbon film. The particles were deposited onto the support grids from a dilute suspension in acetone or ethanol. The particle shapes and sizes were characterized by diffraction (amplitude) contrast and, for crystalline materials, by high resolution (phase contrast) imaging. The specific surface area was determined from N2 adsorption isotherm by the BET method using a Micromeritics surface area analyzer model ASAP 2010. The crystal phase was identified by powder X-ray diffraction (XRD) using Siemens (30 kVand 25 mA) X-ray diffractometer with Cu Kα radiation (λ=1.5404Å) and XPERT software. Fourier-Transform Infra-Red (FTIR) analysis was conducted using Bruker Vector 33 FT-IR spectrometer. KBr was used for preparing of pellet shaped samples and tests were performed according to ASTM 1252.
2.2. Sorption study
11Aqueous solutions containing Pb2+ ions of concentration 100, 200, 300 and 400 mg/l were prepared from Lead nitrate (Pb(NO3)2, Merck No.7397). 0.01 g of nano TCP was introduced in a stirred tank reactor containing 500 ml of the prepared solution. The stirring speed of the agitator was 300 rpm. The temperature of the suspension was maintained at 25 ± 1 °C. The initial pH of the solution was adjusted to the value 6.5 by adding NH3 and HCl. Using batch equilibration technique, the sorption capacity of nano-TCP for Pb2+ cation as well as the influence of the initial concentration of Pb2+ cation, adsorbent mass, contact time and temperature, sorption experiments was determined.
12Samples were taken after mixing the adsorbent and Pb2+ ion bearing solution at pre determined time intervals (5, 10, 20, 30, 60, and 120 min) for the measurement of residual metal ion concentration in the solution and to ensure equilibrium was reached. The samples volume taken is 2 ml. After each specified time, the sorbents were separated from the solution by centrifuge and filtration through the filter paper (Whatman grade 6). The exact concentration of metal ions was determined by AAS (GBC 932 Plus atomic absorption spectrophotometer). Two replicates were used for each Pb2+ sorption experiments and the results given were the average values.
13The mass balance of lead is given by:
|
|
(1) |

14Where m, q, V, C0, and C are the mass of nano-TCP (g), amount of lead removed by unit of weight of TCP (Uptake capacity: mg Pb/g TCP), volume of lead solution (L), initial lead concentration of solution (mg Pb/l), and the concentration of lead at the time t of adsorption (mg Pb/l). After 120 min, C and q will reach equilibrium value Ce and qe.
15The percent removal (%) and distribution ratio (Kd) were calculated using the following equations.
|
|
(2) |
16Where C0 and Cf are the concentrations of the metal ion in initial and final solutions (after 120 min) respectively, and
|
|
(3) |
17Where V is the volume of the solution (ml) and m is the weight of the adsorbent (g).
3. Results and Discussion
3.1. Characteristics of adsorbent
18TEM micrograph of the nano TCP powders after drying at 80 °C is shown in Fig. 1. The microstructure of TCP crystalline after drying was almost needle shape, with a size in the range of 20–30 nm. The crystalline structure analysis of TCP particles was performed, using X ray diffraction, and the obtained diffractometers are represented in Fig. 2. The reflection patterns matched the ICDD standards (JCPDS) for TCP phase. The patterns only showed the peaks characteristic of TCP with no obvious evidences on the presence of other additional phases. The broad peaks around (-414) and (-314) planes indicated that the crystallites were very tiny in nature with much atomic oscillations. The analysis of the nano TCP sample has confirmed a low-crystalline product, with the specific surface area 70 m2/g.
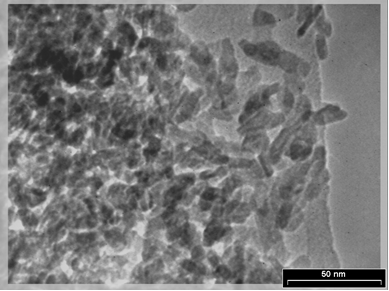
Fig. 1: TEM micrograph of nano Tricalcium phosphate after drying at 80°C.
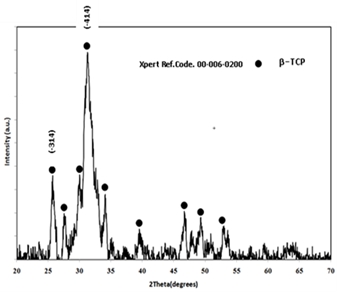
Fig. 2: XRD pattern of nano Tricalcium phosphate powders after drying at 80°C.
3.2. Effect of initial Pb2+ concentration and adsorbent dosage
19The sorption of Pb2+ cations was carried out at different initial lead concentrations ranging from 100 to 400 mg/l, at pH = 6, at 300 rpm with 120 min of contact time using nano TCP. The uptake of the Pb2+ ion is increased by increasing the initial metal concentration tending to saturation at higher metal concentrations. As shown in Fig. 3.
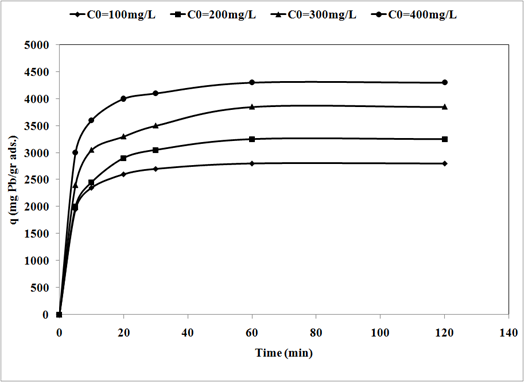
Fig. 3: Effect of initial concentration on removal of Pb2+ by nano Tricalcium phosphate sorbents (pH = 6, adsorbent dosage = 0.01gr/l, 300 rpm agitating rate).
20When the initial Pb2+ cations concentration increased from 100 to 400 mg/l, the uptake capacity of nano TCP increased from 2800 to 4300 mg/g. A higher initial concentration provided an important driving force to overcome all mass transfer resistances of the pollutant between the aqueous and solid phases thus increased the uptake [11].
21The effect of nano TCP dosage is depicted in Fig. 4. Evidently, percentage removal increased with the increase of the sorbent mass (Fig. 4 (a)) and the uptake capacity of Pb2+ decreased from 4300 mg/g (21.5% removal) to 2500 mg/g (37.5% removal) with increasing nano TCP concentration from 0.01 to 0.03 g/l (Fig. 4 (b)). This was attributed to a higher dosage of sorbent due to the increased surface area providing more adsorption sites available which gave rise to a higher removal of Pb2+ cations [12].
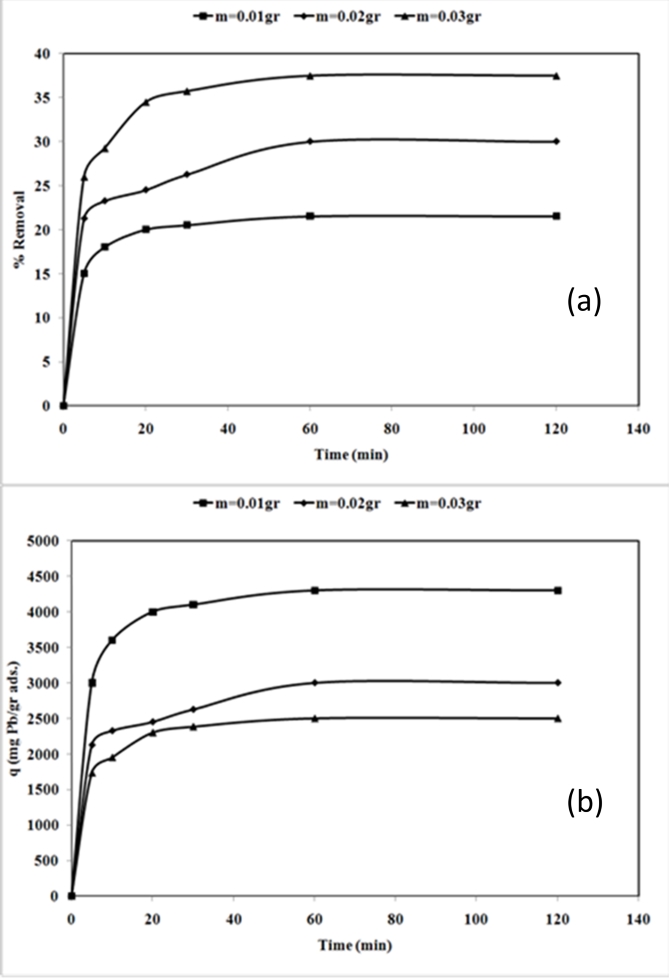
Fig. 4: Effect of adsorbent dosage on percentage removal (a) and uptake capacity (b) of Pb2+ by nano Tricalcium phosphate (pH = 6, initial metal concentration = 400mg/L, 300 rpm agitating rate).
3.3. Effect of temperature and Determination of thermodynamic parameters
22To study the effect of temperature parameter on the uptake of Pb2+ cation by nano-TCP in aqueous solution, temperatures of 25, 45 and 65 C were selected. Fig.5 (a) illustrates the relationship between temperature and the amount of Pb2+ cation adsorbed onto nano-TCP at equilibrium time (120 min). As seen, the adsorption of Pb2+ cation on nano-TCP increased from 4300 mg/g (21.5 % removal) to 5000 mg/g (25 % removal) when the temperature was increased from 25 to 65 °C at an initial concentration of 400 mg/l.
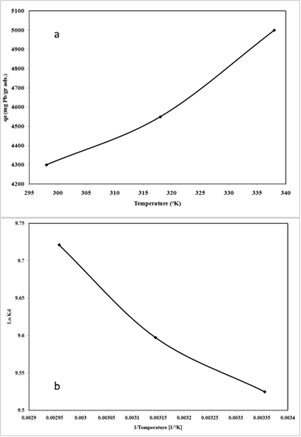
Fig.5: The uptake capacity of Pb2+ ions at different temperature (a) and plot of ln Kd versus 1/T, (b) (pH = 6, initial metal concentration = 400 mg L-1, adsorbent dosage = 0.01 g L-1, 300 rpm agitating rate)
23The increase in the equilibrium sorption of Pb2+ cation with temperature indicated that Pb2+ cation removal by adsorption on nano-TCP favored a high temperature condition. This could be the result of an increase in the mobility of the Pb2+ cation with temperature. An increasing number of molecules could also acquire sufficient energy to undergo an interaction with active sites at the surface. Furthermore, increasing temperature may produce a swelling effect within the internal structure of the nano-TCP enabling large metal ions to penetrate further .
24Thermodynamic parameters such as free energy (G), enthalpy (H), and entropy (S) changes can be estimated using equilibrium constants changing as a function of temperature. The free energy changes of the sorption reaction are given by the following equation:
|
G = - RT Ln Kd |
(4) |
25where G is free energy changes (J); R is the universal gas constant, 8.314 J/mol.K and T is the absolute temperature (K).
|
G = H - TS |
(5) |
26The distribution ratio (Kd) values increased with raising temperature (Fig5 (b)), indicating the endothermic nature of adsorption. A plot of Gibbs free energy changes, G, versus temperature, T(K); was found to be linear. The values of H and S were determined from the slope and intercept of the plots. The thermodynamic parameters Gibbs free energy change, G, are shown in Table 1. The enthalpy, H, and the entropy changes, S, for the sorption processes were calculated to be 4140 J/mol and 92.98 J/mol.K, respectively.
Table.1: Thermodynamic parameters for the adsorption of Pb2+ onto nano-TCP in aqueous solutions.
|
T/K |
Kd |
∆G° (J/mol) |
∆H° (J/mol) |
∆S° (J/mol.K) |
|
298 |
||||
|
318 |
13694.27 |
-23598.2 |
4140 |
92.98 |
|
338 |
14724.92 |
-25373.8 |
||
|
16666.67 |
-27317.8 |
27The negative values of G at various temperatures indicated the spontaneous nature of the adsorption process. The positive value of S indicated that there is an increment in the randomness in the system solid/solution interface during the adsorption process. In addition, the positive value of H indicated that the adsorption was endothermic. The positive value of S reflected the affinity of the nano-TCP for Pb2+ cation and suggested some structural changes in lead and nano-TCP .
3.4 Effect of contact time and sorption kinetic
28Effect of contact time was studied using solution containing 400 mgl−1 concentration of Pb2+ ion using nano-TCP at pH = 6 up to a contact time of 120 min. It seemed that the adsorption consisted of two phases: a primary rapid phase and a second slow phase. The first rapid phase lasted approximately 10 min and accounted for the major part in the total Pb2+ adsorption. Adsorption reached a plateau value in approximately 60 min, which showed saturation of the active points (Fig. 3).
29The sorption kinetics may be controlled by various diffusion mechanisms: (a) bulk diffusion, (b) film diffusion, and (c) intraparticle diffusion. Three models were used for the description of kinetic profiles based on the pseudo-first order equation (the so-called Lagergren equation), on the pseudo-second-order equation described by Ho (2006), and on the intraparticle diffusion model.
30The pseudo-first order equation of Lagergren can be expressed as Eq. (6):
|
Log (qe – q) = log qe cal – (k1/2.303) t |
(6) |
31where q is the amount of metal ions adsorbed (mg.g−1) at any given time t (min), qe is the amount of metal ion adsorbed (mg.g−1) at equilibrium and k1 is the pseudo-first order reaction rate constant for adsorption (min−1). The pseudo-second order reaction rate equation has the form:
|
|
(7) |
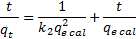
32where qt is the amount of metal ions adsorbed (mg.g−1) at any given time t (min), qe is the amount of metal ion adsorbed (mg.g−1) at equilibrium and k2 is the second order reaction rate constant for adsorption (g(mg.min)−1).
33The intraparticle diffusion model was considered in order to determine the participation of this process in the sorption of lead ion by nano-TCP. According to this model, the plot of uptake (qt), versus the square root of time (t0.5) should be linear if intraparticle diffusion is involved in the overall adsorption mechanism. Furthermore, if this line passes through the origin then the intraparticle diffusion is the rate-controlling step of the process . The initial rate of intraparticle diffusion, KD, can be calculated in the following way:
|
|
(8) |

34where qt is the amount of sorbate on the surface of the sorbent at time t (mg.g−1), KD is the intraparticle rate constant (mg(g.min0.5)−1) and t is the time (min).
35Fig. 6A and B shows linear plots of the pseudo-first order model in Eq. (6) and the pseudo-second order model in Eq. (7) for the adsorption of Pb2+ onto nano-TCP. k1, k2 and qe calculated from the slopes and intercepts of the lines obtained by plotting
log (qe - qt) against t and t/qt against t are listed in Table 2. As shown in Table 2, the pseudo-second order model fits better the adsorption kinetics of lead ion on nano-TCP than the pseudo-first order model. This suggests that the rate limiting step of this sorption system may be chemical sorption or chemisorptions involving valency forces through sharing or exchange of electrons between sorbent and sorbate . The qe calculated from the pseudo-second order rate model of Pb2+ is 5000 mgg−1. Fig. 6C shows a plot of the Weber and Morris intraparticle diffusion model for the sorption of Pb2+ onto nano-TCP. As shown in Fig. 6C, the plot of uptake (qt), versus the square root of time (t0.5) was not linear, which indicated that the intraparticle diffusion was not the rate-controlling step in these adsorption systems.
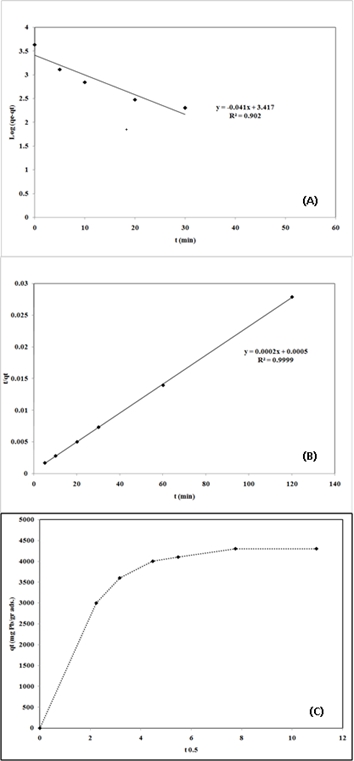
Fig.6: Linear fit of experimental data obtained using:
(A) pseudo-first-order model
(B) pseudo-second order model
(C) the amount of single metal ion sorbed versus square root of time
Table 2: Parameter values calculated using the pseudo-first order and the pseudo-second order models for the adsorption of Pb2+ on nano TCP in aqueous solutions.
|
Pseudo-first-order kinetic model |
|||
|
T [°C] |
k1 [min-1] |
qe cal [mg/g] |
R2 |
|
25 |
0.09442 |
2612.16 |
0.902 |
|
Pseudo-secong-order kinetic model |
|||
|
T [°C] |
k2 [min-1] |
qe cal [mg/g] |
R2 |
|
25 |
0.00008 |
5000 |
0.999 |
3.5. Adsorption isotherms
36Analysis of the equilibrium data is important to develop an equation which accurately represents the results and can be used for the design purposes . Several isotherm equations have been used for the equilibrium modeling of adsorption systems.
37The sorption data have been subjected to different sorption isotherms, namely, Langmuir, Freundlich, and Dubinin–Kaganer–Radushkevich (DKR).
Table 3: Langmuir, Freundlish and Dubinin–Kaganer–Radushkevich (DKR) constants for sorption of Pb2+ onto nano-TCP in aqueous solution
|
Langmuir adsorption isotherms constants |
||
|
Q0 (mg/g) |
K (L/mg) |
R2 |
|
4761.90 |
0.02 |
0.982 |
|
Freundlich adsorption isotherms constants |
||
|
kf (mg/g) |
n |
R2 |
|
1214.39 |
4.69 |
0.943 |
|
DKR adsorption isotherms constants |
||
|
Xm (mg/g) |
(mol2/J2) |
R2 |
|
7446.31 |
- 2 x 10⁻⁹ |
0.926 |
38The equilibrium data for metal ions over the concentration range from 100 to 400 mg/l at 25 C were correlated with the Langmuir isotherm :
|
|
(9) |

39Where Ce is the equilibrium concentration of metal in solution (mg/l), qe is the amount absorbed at equilibrium onto nano-TCP (mg/g), Q0 (mg/g) and K (l/mg) are Langmuir constants related to sorption capacity and sorption energy, respectively. Maximum sorption capacity (Q0) represents monolayer coverage of sorbent with sorbate and K represents enthalpy of sorption and should vary with temperature. A linear plot was obtained when Ce/qe was plotted against Ce over the entire concentration range of metal ions investigated.
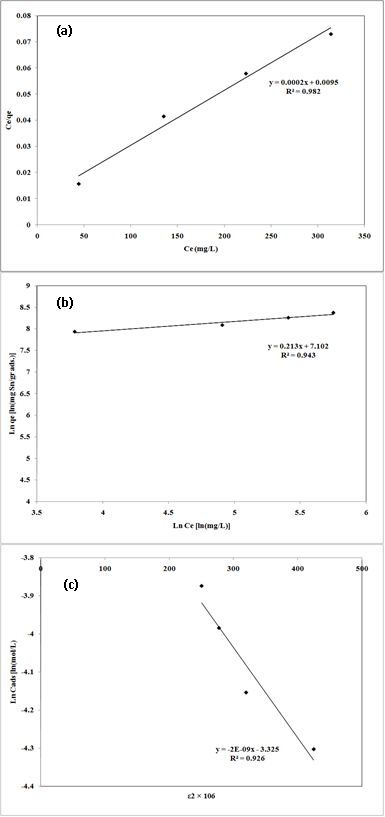
Fig. 7: Linear fits of experimental data obtained using Langmuir (a), Freundlich (b) and Dubinin–Kaganer–Radushkevich (c) sorption isotherms for the adsorption of Pb2+ onto nano-TCP in aqueous solution
40The Plotted Langmuir adsorption isotherms of Pb2+ cation are given in Fig.7 (a). An adsorption isotherm is characterized by certain constants which values express the surface properties and affinity of the sorbent and can also be used to find the sorption capacity of sorbent.
41The Freundlich sorption isotherm, one of the most widely used mathematical descriptions, usually fits the experimental data over a wide range of concentrations. This isotherm gave an expression encompassing the surface heterogeneity and the exponential distribution of active sites and their energies. The Freundlich adsorption isotherms were also applied to the removal of Pb2+ cation on nano-TCP in aqueous solution (Fig.7 (b)).
|
|
(10) |
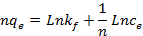
42Where qe is the amount of metal ion adsorbed at equilibrium per gram of adsorbent (mg/g), Ce is the equilibrium concentration of metal ion in the solution (mg/l), kf and n are the Freundlich model constants . Freundlich parameters, kf and n, were determined by plotting lnqe versus LnCe. The numerical value of 1/n < 1 indicates that adsorption capacity is only slightly suppressed at lower equilibrium concentrations. This isotherm does not predict any saturation of the sorbent by the sorbate; thus infinite surface coverage is predicted mathematically, indicating multilayer adsorption on the surface .
43The Dubinin–Kaganer–Radushkevich (DKR) has been used to describe the sorption of metal ions on clays. The DKR equation has the form:
|
|
(11) |
44Where Cads is the number of metal ions adsorbed per unit weight of adsorbent (mol/g), Xm (mol/g) is the maximum sorption capacity, β (mol2/J2) is the activity coefficient related to mean sorption energy, and ε is the Polanyi potential, which is equal to:
|
|
(12) |
45Where R is the gas constant (8.314 kJ/mol.K) and T is the temperature (K). The saturation limit Xm may represent the total specific micro pore volume of the sorbent. The sorption potential is independent of the temperature but varies according to the nature of sorbent and sorbate . The slope of the plot of ln Cads versus ε2 gives β (mol2/J2) and the intercept yields the sorption capacity, Xm (mol/g). The sorption space in the vicinity of a solid surface is characterized by a series of equipotential surfaces having the same sorption potential. The sorption energy can also be worked out using the following relationship:
|
|
(13) |

46It is known that magnitude of apparent adsorption energy E is useful for estimating the type of adsorption and if this value is below 8 kJ/mol the adsorption type can be explained by physical adsorption, between 8 and 16 kJ/mol the adsorption type can be explained by ion exchange, and over 16 kJ/mol the adsorption type can be explained by a stronger chemical adsorption than ion exchange .
47The plot of Ln Cads against ε2 for metal ion sorption on nano-TCP is shown in Fig.7 (c). The Langmuir, Freundlich and DKR adsorption constants from the isotherms and their correlation coefficients are also presented in Table 3.
48The correlation coefficients R2 (0.982, 0.943 and 0.926 for Langmuir, Freundlich and DKR model, respectively) confirmed good agreement between both theoretical models and experimental results in the present study. The maximum sorption capacity, Q0, calculated from Langmuir equation was 4761.90 mg/g, while Langmuir constant K was 0.02 L/mg. The values obtained for Pb2+ cation from the Freundlich model showed a maximum adsorption capacity (Kf) of 1214.39 mg/g with an affinity value (n) equal to 4.69. The values of sorption constants, derived from DKR model were 7446.31 mg/g (35.97 mmol/g) for Xm, -2 10-9 mol2/J2 for and 15.81 kJ/mol for E.
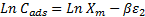
Fig. 8 : TEM micrograph (a) and EDS spectrum (b) of the solid residue with maximum amount of uptake capacity of Pb2+, respectively.
49The values indicated that the adsorption pattern for Pb2+ cation on nano-TCP followed third, the DKR isotherm (R2 > 0.926), the Freundlich isotherm (R2 > 0.943) and the Langmuir isotherm (R2 > 0.982) at all experimental. It is clear that the Langmuir isotherm has best fitted for the sorption of Pb2+ cations on nano-TCP in aqueous solution. When the system is in a state of equilibrium, the distribution of Pb2+ cation between the nano-TCP and the Pb2+ solution is of fundamental importance in determining the maximum sorption capacity of nano-TCP for the lead ion from the isotherm. The E values are 15.81 kJ for Pb2+ cation on the nano-TCP. It is the orders of an ion-exchange mechanism, in which the sorption energy lies within 8–16 kJ/mol.
50The TEM of Pb2+-loaded sample particles is shown in Fig. 8 (a) indicating that most crystalline are rounded with dimensions in the range of 20–30 nm. No morphology of nano-TCP loaded Pb2+ was detected by the TEM crystalline analysis of the solid residue with maximum amount of uptake capacity of Pb2+.
51Fig. 8 (b) shows the EDS spectrum and powder diffraction pattern of the Pb2+-loaded sample particles. Clear peaks corresponding to Ca, P, O and Pb were observed in the EDS spectrum. The EDS spectrum confirms its chemical composition and powder diffraction pattern further validate the crystallinity of the synthesized powder. In addition, Cu peaks were also observed in the EDS spectrum. The peaks for Cu arise from stray scattering of X-rays from the copper grid.
4. Conclusions
52The present investigation showed that the nano TCP was an effective adsorbent for the removal of Pb2+ cations from aqueous solutions. The adsorption process was a function of the adsorbent dosage, initial Pb2+ cations concentration and temperature. The efficiency of Pb2+ cations adsorption increased with an increase in the adsorbent dosage.
53Thermodynamic calculations showed that the lead sorption process of nano-TCP had endothermic and spontaneous nature. The pseudo-first order, pseudo-second order kinetic and intraparticle diffusion kinetic models were used to describe the kinetic data for initial Pb2+ concentrations and the rate constants were evaluated. The used experimental data were fitted by the second-order kinetic model, which indicated that chemical sorption was the rate-limiting step, inside of mass transfer. The contact time of approximately 60 min was required to reach the equilibrium. Isotherm studies indicated that the Langmuir model fitted the experimental data better than Freundlich and DKR models. The adsorption equilibrium was described well by the Langmuir isotherm model with maximum adsorption capacity of 4761.90 mg/g of Pb2+ on nano-TCP in aqueous solution.
Acknowledgment
54This research was completely supported by Maybod Branch, Islamic Azad University and will be grateful.
References
55[1] U. Ulusoy, and R. Akkaya, “Adsorptive features of polyacrylamide–apatite composite for Pb2+, UO22+ and Th4+”, Journal of Hazardous Materials, 163 (2009) 98-108.
56[2] I. Mobasherpour, E. Salahi and M. Pazouki, “Potential of nano crystalline hydroxyapatite for lead (II) removal from aqueous solutions: Thermodynamic and Adsorption isotherm study” African Journal of Pure and Applied Chemistry, 5 (11) (2011) 383-392.
57[3] J. Vangronsveld, J. Colpaert, K.V. Tichelen, “Reclamation of a bare industrial area polluted by nonferrous metals: Physico-chemical and biological evaluation of the durability of soil treatment and revegetation” Environmental Pollution, 94, (1996) 131-140.
58[4] S.J.T. Pollard, G.D. Fowlerr, C.J. Sollars, R. Perry, “Low-cost adsorbents for waste and waste water treatment: a review” Science of the Total Environment, 116 (1992) 31-52.
59[5] A. Krestou, A. Xenidis, D. Panias, “Mechanism of aqueous uranium (VI) uptake by hydroxyapatite” Minerals Engineering, 17 (2004) 373-381.
60[6] I. Mobasherpour, E. Salahi, S.A. Manafi, R. Darvishi Kamachali, “Effect of heat-treatment on grain growth of nanocrystalline tricalcium phosphate powder synthesized via the precipitation method” Materials Science-Poland, 29 (3) (2011) 203-208.
61[7] Z. Zhang, M. Li, W. Chen , S. Zhu, N. Liu, L. Zhu, “Immobilization of lead and cadmium from aqueous solution and contaminated sediment using nano-hydroxyapatite” Environmental Pollution, 158 (2010) 514-519.
62[8] S.M. Mousa, N.S. Ammar, H.A. Ibrahim, “Removal of lead ions using hydroxyapatite nano-material prepared from phosphogypsum waste” Journal of Saudi Chemical Society, 20 (2016) 357-365.
63[9] R. Khani, S. Sobhani, M. Hossein Beyki, “Highly selective and efficient removal of lead with magnetic nano-adsorbent: Multivariate optimization, isotherm and thermodynamic studies” Journal of Colloid and Interface Science, 466 (2016) 198-205.
64[10] M. E. Mahmoud, G. M. Nabil, S. M. E. Mahmoud, “High performance nano-zirconium silicate adsorbent for efficient removal of copper (II), cadmium (II) and lead (II)” Journal of Environmental Chemical Engineering, 3 (2015) 1320-1328.
65[11] Z. Aksu, S. Tezer, “Biosorption of reactive dyes on the green alga Chlorella vulgaris” Process Biochemistry, 40 (2005) 1347-1361.
66[12] I. Mobasherpour, E. Salahi and M. Pazouki, “Removal of divalent cadmium cations by means of synthetic nano crystallite hydroxyapatite” Desalination, 266 (2011) 142-148.
67[13] M. Doğan, and M. Alkan, “Adsorption kinetics of methyl violet onto perlite” Chemosphere, 50 (2003) 517-528.
68[14] Y.-S. Ho, “Removal of copper ions from aqueous solution by tree fern” Water Research, 37 (2003) 2323-2330.
69[15] W.J. Weber Jr and J.C. Morris, “Kinetics of Adsorption on Carbon from Solution” AMERICAN SOCIETY OF CIVIL ENGINEERS, 89 (1963) 31-60.
70[16] I. Smičiklas, S. Dimović, I. Plećaš and M. Mitrić, “Removal of Co2+ from aqueous solutions by hydroxyapatite” Water Research, 40 (2006) 2267-2274.
71[17] S. Lu and S.W. Gibb, “Copper removal from wastewater using spent-grain as biosorbent” Bioresource Technology, 99, (2008) 1509-1517.
72[18] Y.S. Ho and G. McKay, “Pseudo-second order model for sorption processes” Process Biochemistry, 34 (1999) 451-465.
73[19] Z. Aksu, “Determination of the equilibrium, kinetic and thermodynamic parameters of the batch biosorption of nickel (II) ions onto Chlorella vulgaris” Process Biochemistry, 38, (2002) 89-99.
74[20] I. Langmuir, “The adsorption of gases on plane surfaces of glass, mica and platinum” Journal of the American Chemical Society, 40 (1918) 1361-1403.
75[21] E. Malkoç and Y. Nuhoglu, “The removal of chromium (VI) from synthetic wastewater by Ulothrix zonata” Fresenius Environmental Bulletin, 12 (2003) 376-381.
76[22] K. Kadirvelu, K. Thamaraiselvi and C. Namasivayam, “Adsorption of nickel (II) from aqueous solution onto activated carbon prepared from coirpith” Separation and Purification Technology, 24 (2001) 497-505.
77[23] S. Hasany, M. Saeed and M. Ahmed, “Sorption and thermodynamic behavior of zinc(II)-thiocyanate complexes onto polyurethane foam from acidic solutions” Journal of Radioanalytical and Nuclear Chemistry, 252 (2002) 477-484.
78[24] S. Khan and M. Williams, Post-Tensioned Concrete Floors, Butterworth-Heinemann, Oxford, (1995), p. 271.
79[25] S.-H. Lin and R.-S. Juang, “Heavy metal removal from water by sorption using surfactant-modified montmorillonite” Journal of Hazardous Materials, 92 (2002) 315-326.
80[26] C.-C. Wang, L.-C. Juang, C.-K. Lee, T.-C. Hsu, J.-F. Lee and H.-P. Chao, “Effects of exchanged surfactant cations on the pore structure and adsorption characteristics of montmorillonite” Journal of Colloid and Interface Science, 280, (2004) 27-35.
81[27] B.S. Krishna, D.S.R. Murty and B.S. Jai Prakash, “Thermodynamics of chromium (VI) anionic species sorption onto surfactant-modified montmorillonite clay” Journal of Colloid and Interface Science, 229 (2000) 230-236.
