


- Accueil
- Volume 21 (2018)
- number 3-4
- Reconstructing Early Atlantic to Early Subatlantic peat-forming conditions of the ombrotrophic Misten Bog (eastern Belgium) on the basis of high-resolution analyses of pollen, testate amoebae and geochemistry


Visualisation(s): 3581 (87 ULiège)
Téléchargement(s): 607 (22 ULiège)

Reconstructing Early Atlantic to Early Subatlantic peat-forming conditions of the ombrotrophic Misten Bog (eastern Belgium) on the basis of high-resolution analyses of pollen, testate amoebae and geochemistry

Résumé
Reconstruire les conditions de formation de la tourbe entre l'Atlantique ancien et le Subatlantique ancien dans la tourbière du Misten (Est de la Belgique) sur la base d'analyses à haute résolution du pollen, des thécamoebiens et de la géochimie. La tourbière du Misten (Hautes-Fagnes, Belgique), épaisse de 7 mètres, a été étudiée avec pour objectifs la reconstitution de l’évolution de la tourbière et des conditions de la formation de la tourbe, à partir de l’analyse des grains de pollen et spores, des thécamoebiens, ainsi que de la géochimie. La partie étudiée de la tourbière représente une grande partie de la période Atlantique, l’entièreté de la période Subboréal et le début de la période Subatlantique, soit environ l’intervalle de temps compris entre 7300 cal BP et 2000 cal BP. La reconnaissance d’assemblages polliniques repères définis par un travail plus ancien (Persch, 1950), réalisé dans la périphérie de la même tourbière, permet de corréler étroitement entre eux les deux sites étudiés, 460 cm d’épaisseur dans la partie centrale de la tourbière correspondant à 230 cm d’épaisseur dans la périphérie. La datation précise des repères polliniques dans la séquence qui fait l’objet de ce travail permet d’obtenir une chronologie plus precise des événements reconnus dans le diagramme pollinique de Persch en 1950. La comparaison des données polliniques indique que, comme attendu, la pluie pollinique de Corylus est proportionnellement plus importante et celle du Quercetum mixtum, moins importante dans la partie centrale de la tourbière qu’à la périphérie de celle-ci. L’analyse des thécamoebiens dans la partie centrale de la tourbière constitue l’apport majeur du présent travail. Cinq biozones ont été identifiées par une analyse contrainte stratigraphiquement. La zonation obtenue est essentiellement basée sur les fluctuations d’Archerella (Amphitrema) flavum et Difflugia pulex. Trois fonctions de transfert ont été appliquées et comparées. Couplée à la mesure du taux d’humification des niveaux concernés, elles permettent une analyse détaillée du taux d’humidité de la tourbe, et donc des conditions climatiques locales au moment de la formation de cette dernière. L’intégration des résultats polliniques dans la zonation basée sur les thécamoebiens permet de définir, de dater et d’interpréter 18 intervalles de temps relativement courts, de l’ordre de 200 à 300 ans chacun. Nos résultats valident et complètent une première interprétation climatique combinant analyse géochimique et données préliminaires acquises sur les thécamoebiens.
Abstract
A seven metres thick peat bog (Misten, Hautes-Fagnes, Belgium) has been studied at high resolution in order to reconstruct the conditions of peat formation and evolution on the basis of pollen, testate amoebae analysis, and geochemistry. The sampled section of the peat bog corresponds to the most part of the Atlantic period, all the Subboreal period and the earliest Subatlantic period, i.e. a time interval between 7300 cal BP and 2000 cal BP. The identification of tie-points in the pollen assemblages recognized in a previous work (Persch, 1950) performed in the periphery of the same peat-bog, allows accurate correlation of the two sites, 460 cm thickness of peat in the central part corresponding to 230 cm thickness of peat in the periphery. The well constrained dates of the tie-points in the present work provide a more precise chronology of the events identified in Persch’s pollen diagram. A comparison of pollen data in both sites demonstrates that, as expected, the Corylus pollen rain is proportionally more important and the Quercetum mixtum pollen rain proportionally less important in the central area of the peat bog than in the periphery. The study of the testate amoebae in the central part of the peat bog is the major contribution of the present work. A stratigraphically constrained analysis resulted in the identification of five biozones, the zonation being mainly built on the fluctuations observed between Archerella (Amphitrema) flavum and Difflugia pulex. Three transfer functions have been applied and compared. Coupled with the humification values of each level, it allows a very accurate approach of the water-table level, and hence of local climatic conditions, at the time of the peat formation. Combination of pollen results and testate amoebae zonal subdivisions allows the definition, dating and interpretation of 18 rather short time intervals with an approximate duration of 200 to 300 years each. Our results validate and expand a previously published climate interpretation that combined geochemical data and a preliminary testate amoebae analysis.
Table des matières
1. Introduction
1Peatlands offer unique opportunities for high-resolution climate reconstruction. In the Hautes-Fagnes Plateau (Eastern Belgium), culminating at 694 m a.s.l., peatlands cover 3750 ha, including about 1000 ha of raised bogs protected since 1957 in a state nature reserve. The topographic conditions for areas where peat accumulates are given by Wastiaux et al. (2000). A general description of the Belgian peatland vegetation, in particular those of the Hautes-Fagnes, is provided by Frankard et al. (1998).
2The Hautes-Fagnes are situated in a key position among European peat deposits, under both oceanic and continental influences (Streel, 1959). Previous studies of the Hautes-Fagnes peat archives using palynology have already demonstrated their potential for reconstructing regional vegetation changes (e.g. Persch, 1950; Dricot, 1960; Damblon, 1978, 1994).
3The saddle-raised Misten Bog (50°33´50´´N, 06°09´50´´E, 620 m a.s.l.), located in the Hautes-Fagnes Plateau, contains some of the deepest peat deposits of this area, with more than 7 m of peat in its centre (Fig. 1). The bog has been cut along its outer rim, mainly in the north-eastern and south-easternedges. MistenBogsitsonanisolatedplateauthatprevents the bog from receiving lateral mineral inputs, e.g. through small streams. The vegetation on the site is mainly composed of Sphagnum ssp and Polytrichum strictum, built up into low hummocks, structured by Eriophorum vaginatum. Rare hollows are dominated by Eriophorum angustifolium, Narthecium ossifragum and a few Rhynchospora alba. Hummocks are currently hidden by Erica tetralix, Calluna vulgaris and a few Vaccinium spp. shrubs, reflecting a recent drying trend (Streel et al., 2014). The site is also surrounded by Molinia coerulea.
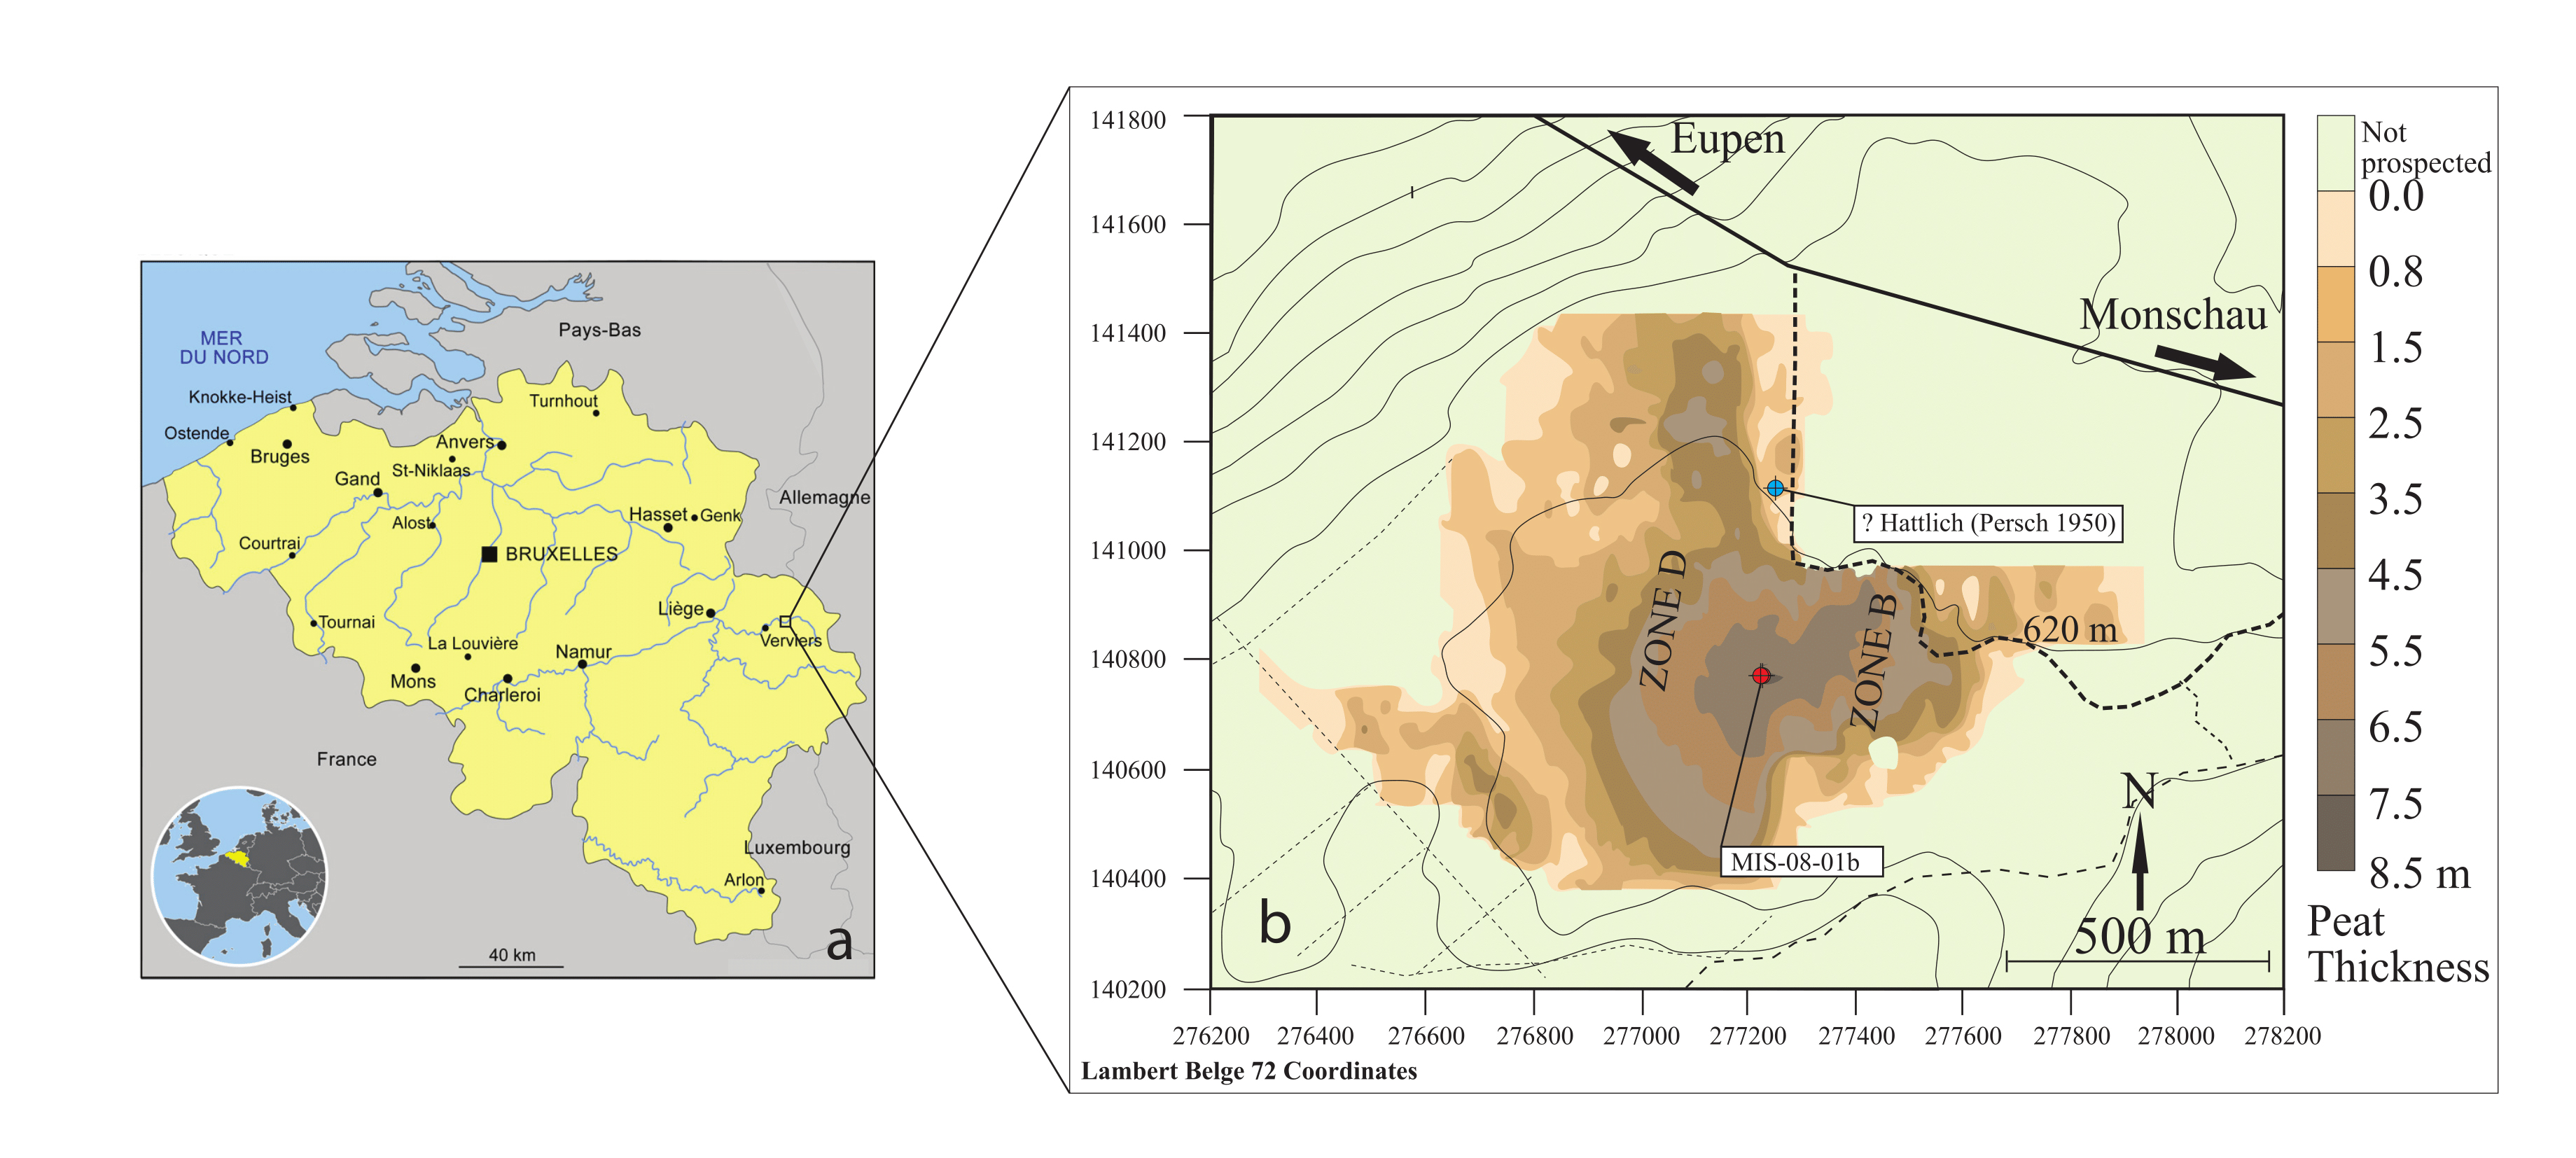
4Figure 1. (a)Location of the Misten peat bog in eastern Belgium, and (b)map of the Misten peat bog, modified from Allan et al. (2013). The colourings indicate the peat thickness as deduced from surface radar prospection (Wastiaux, 2002). The red dot shows the location of the MIS-08-01b core (this study), and the blue dot the probable location of the Hattlich pollen diagram of Persch (1950).
5Schwickerath (1937) and Persch (1950) carried out pollen analyses (at 12 cm and at 5 cm intervals respectively) from marginal sections of the Misten bog. Persch (1950) used Overbeck & Schneider’s (1938) classification of Holocene vegetation landscapes to subdivide the pollen sequence (from their Boreal Subzone VII to Subatlantic Subzone XI). Additionally, he introduced a quantitative approach based on Corylus abundance (from their Boreal Subzone VII to Subboreal Subzone IX) defining 4 maxima CI, CII, CIII and CIV as well as on Fagus abundance (within their Subzone XI) defining 4 further maxima FI, FII, FIII and FIV. He suggested that these fluctuations in Corylus and Fagus abundance could be used to date and correlate between different regional pollen diagrams. This approach was subsequently used in the Hautes-Fagnes area by several authors (e.g. Dricot, 1960; Damblon,1978; Streel et al., 2014).
2. Objectives of the study
6The main objectives of the present work are:
7(i) to provide a palynological study at high resolution of the deepest area of the Misten peat bog (Hautes-Fagnes, Belgium);
8(ii) to compare our results with those obtained by Persch (1950) at the periphery of the Misten peat bog;
9(iii) to analyse and characterize the testate amoebae assemblages of the Misten peat bog;
10(iv) to test the application of three transfer functions, to interpret the variations of the testate amoebae in terms of wetness characteristics at the surface of the peat bog central area;
11(v) to integrate results based on pollen and testate amoebae in order to propose a detailed biostratigraphy of the site.
3. Materials and methods
3.1. Sampling, radiocarbon dating and chronology
12In February 2008, a peat core (MIS-08-01, 755 cm long) was collected from the central part of the Misten site (Fig. 1). The top 100 cm were sampled by using a titanium Wardenaar corer (Wardenaar, 1987) from the University of Heidelberg. Results on palynology and testate amoebae were published by Streel et al. (2014). The lower part (MIS-08-01b), sometimes named below the “long core”, was cored with a Belorussian corer (Belokopytov & Veresnevich, 1955) and reached a depth of 7.5 m (Allan et al., 2013).
13Radiocarbon ages were obtained on macrofossil samples (stems, branches or leaves of plant material) extracted under a binocular microscope. Nine samples were prepared at the GADAM Centre (Silesian University of Technology, Gliwice, Poland) according to the protocol described by Piotrowska et al. (2011) and Piotrowska (2013). Radiocarbon dates (n = 15) obtained by acceleration mass spectrometry (AMS) were processed using the “Bacon” software (Blaauw & Christen, 2011) to establish an age–depth model as well as an age range for each slice of peat. The curve IntCal09 was used for calibration (Reimer et al., 2009; see also Reimer et al., 2013). The age–depth model was calculated for 600 cm of the studied peat core. The accumulation rate was set as a gamma distribution with a mean of 10 yr cm-1. The accumulation variability was set with a beta distribution with strength of 4 and a mean of 0.7 (Allan et al., 2013).
14The ranges of calibrated radiocarbon ages of dated peat layers involved in the present work (MIS-08-01b) are presented in Table 1. The age–depth model covering the period from ca. 7300 cal BP to 2000 cal BP was published by Allan et al. (2013). The age model reveals a relatively constant peat accumulation rate, with an average value of ca. 0.11 mm yr-1. Consequently, the analysis of 1 cm thick sample represents ca. 9 years.

15Table 1. Results of 14C dating for the MIS-08-01b peat core. Independently calibrated age ranges were obtained with the OxCal4 program (Bronk Ramsey, 2009), and the modelled ages were obtained after “Bacon” calculations (Blaauw & Christen, 2011). In both cases, the IntCal09 calibration curve was used (Reimer et al., 2009). See Allan et al. (2013, table 2). We have included data from Reimer et al. (2013, IntCal13) for comparison purpose although all these data are practically similar.
3.2. Pollen analysis
16352 samples with known volume and weight were treated with HCl (10%) and submitted to KOH (10%). The residues were dissolved in 96% acetic acid and acetolysed (Faegri & Iversen, 1989). After centrifugation, the solutions were filtered through 200 µm and 12 µm mesh shieves. The isolated spores and pollen grains were then mounted in glycerin and counted up to a minimum of 300 (mean: 353) arboreal pollen grains excluding herbaceous pollen, bryophyte and fern spores. Pollen identification was aided by Moore et al. (1991), Reille (1992, 1995, 1998) and Beug (2004). Counting was performed for 352 samples at 1.5 centimetre intervals. TILIA and TILIA GRAPH were used for diagrams conception based on percentages (Grimm, 1990). A TILIA diagram and a stratigraphically constrained cluster analysis by incremental sum of squares method were generated (Grimm, 1987; CONISS in Fig. 2).
3.3. Testate amoebae analysis
3.3.1. Data treatment
17352 samples for testateamoebae analysis were prepared following the recommendations of Booth et al. (2010). Testate amoebae were identified and quantified to the lowest possible taxonomic level according to the dichotomous key proposed by Charman et al. (2000). At least 100 individual tests were counted , but this total was not reached for some samples. The relative frequency of each taxon was calculated and converted into a percentage of the total amount of the population. Samples with total count below the statistical threshold of 100 were not excluded from the dataset. Although this introduces statistical bias, it was chosen in order to avoid gaps in the diagrams
18The diagram of the long core was drawn with the software Tilia (v.1.7.16, Copyright © 1991-2011 Eric C. Grimm). The taxa were clustered in three groups (1st = black, 2nd = medium grey and 3rd = light grey) based on their overall weight (%), calculated for all the profile, and also sorted, from the left to the right, by alphabetical order. A biozonation scheme was applied to the diagrams to facilitate the qualitative description and interpretation. Data were transferred in a spreadsheet with minimum value criteria of 7. Consequently, assemblage biozones were based on taxa that have the highest relative frequency. A stratigraphically constrained cluster analysis by the method of incremental sum of squares (CONISS, Grimm, 1987), (Tilia v1.7.16), with square-root transformation (Edwards & Cavalli-Sforza’s chord distance) was applied.
3.3.2. Calculation of the Shannon-Weaver Diversity index
19The Shannon-Weaver Diversity index (Shannon & Weaver, 1963), was calculated for the long section and defined as (Beisel et al., 2003):
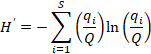
where H’ = code of the usual name (Shannon-Weaver Diversity index) in accordance with Smith & Wilson (1996), S = number of taxa in the community or species richness, and  = relative frequency of the ith taxon in the whole community, with Q = the total number of tests (all individuals for one level).
3.3.3. Transfer functions
20Three transfer functions (Charman et al.; 2007 as described by Sillasoo et al., 2007; Lamentowicz et al., 2008; Amesbury et al., 2016) have been used to assign hydroclimatic conditions to the biozones identified with the CONISS analysis.
4. Results and discussion
4.1. Pollen analyses
4.1.1. High resolution palynological analysis of the MIS-08-01b core
21Figure 2 (Kamran et al., 2016) shows the evolution of the arboreal (or tree) pollen rain on the Misten peat bog between the Atlantic and the base of the Subatlantic. The studied section begins at the depth of 753.5 cm in the Atlantic period and continues to the depth of 270 cm in the early Subatlantic period. In this time span, the tree pollen percentages were high (94-100%), suggesting highly closed forest conditions in the surroundings, mainly consisting of trees such as Alnus glutinosa, Corylus avellana, Quercus ssp. and Fagus sylvatica. Four zones could be distinguished in the studied section including Atlantic a, Atlantic b, Subboreal and Subatlantic. In the Atlantic a/Atlantic b zone-boundary, located at the depth of 600 cm, the percentage of Tilia pollen exceeds that of Ulmus. The Ulmus decline in the Atlantic b/Subboreal boundary, at the depth of 450 cm, is possibly interpreted as resulting from human impact on the landscape (Troels-Smith, 1960; Turner, 1962; Iversen, 1973; Peglar, 1993; Peglar & Birks, 1993; Hannon et al., 2000). Fagus sylvatica appears in considerable proportion just from the beginning of the Subboreal and shows a sharp increase at the start of the Subatlantic period. Non arboreal pollen diagram (Fig. 3; Kamran et al., 2016) shows less than one percent of diverse taxa where one can notice the first occurrence of Plantago lanceolata type starting in the upper part of the Atlantic b period and the more accentuated presence (around one percent) of Poaceae in the upper part of the Subboreal period. These probable anthropogenic markers are present in low quantities. This is probably the result of long transport by the wind and does not presumably indicate any evidence of anthropic activity in the proximal surrounding of the peat bog.
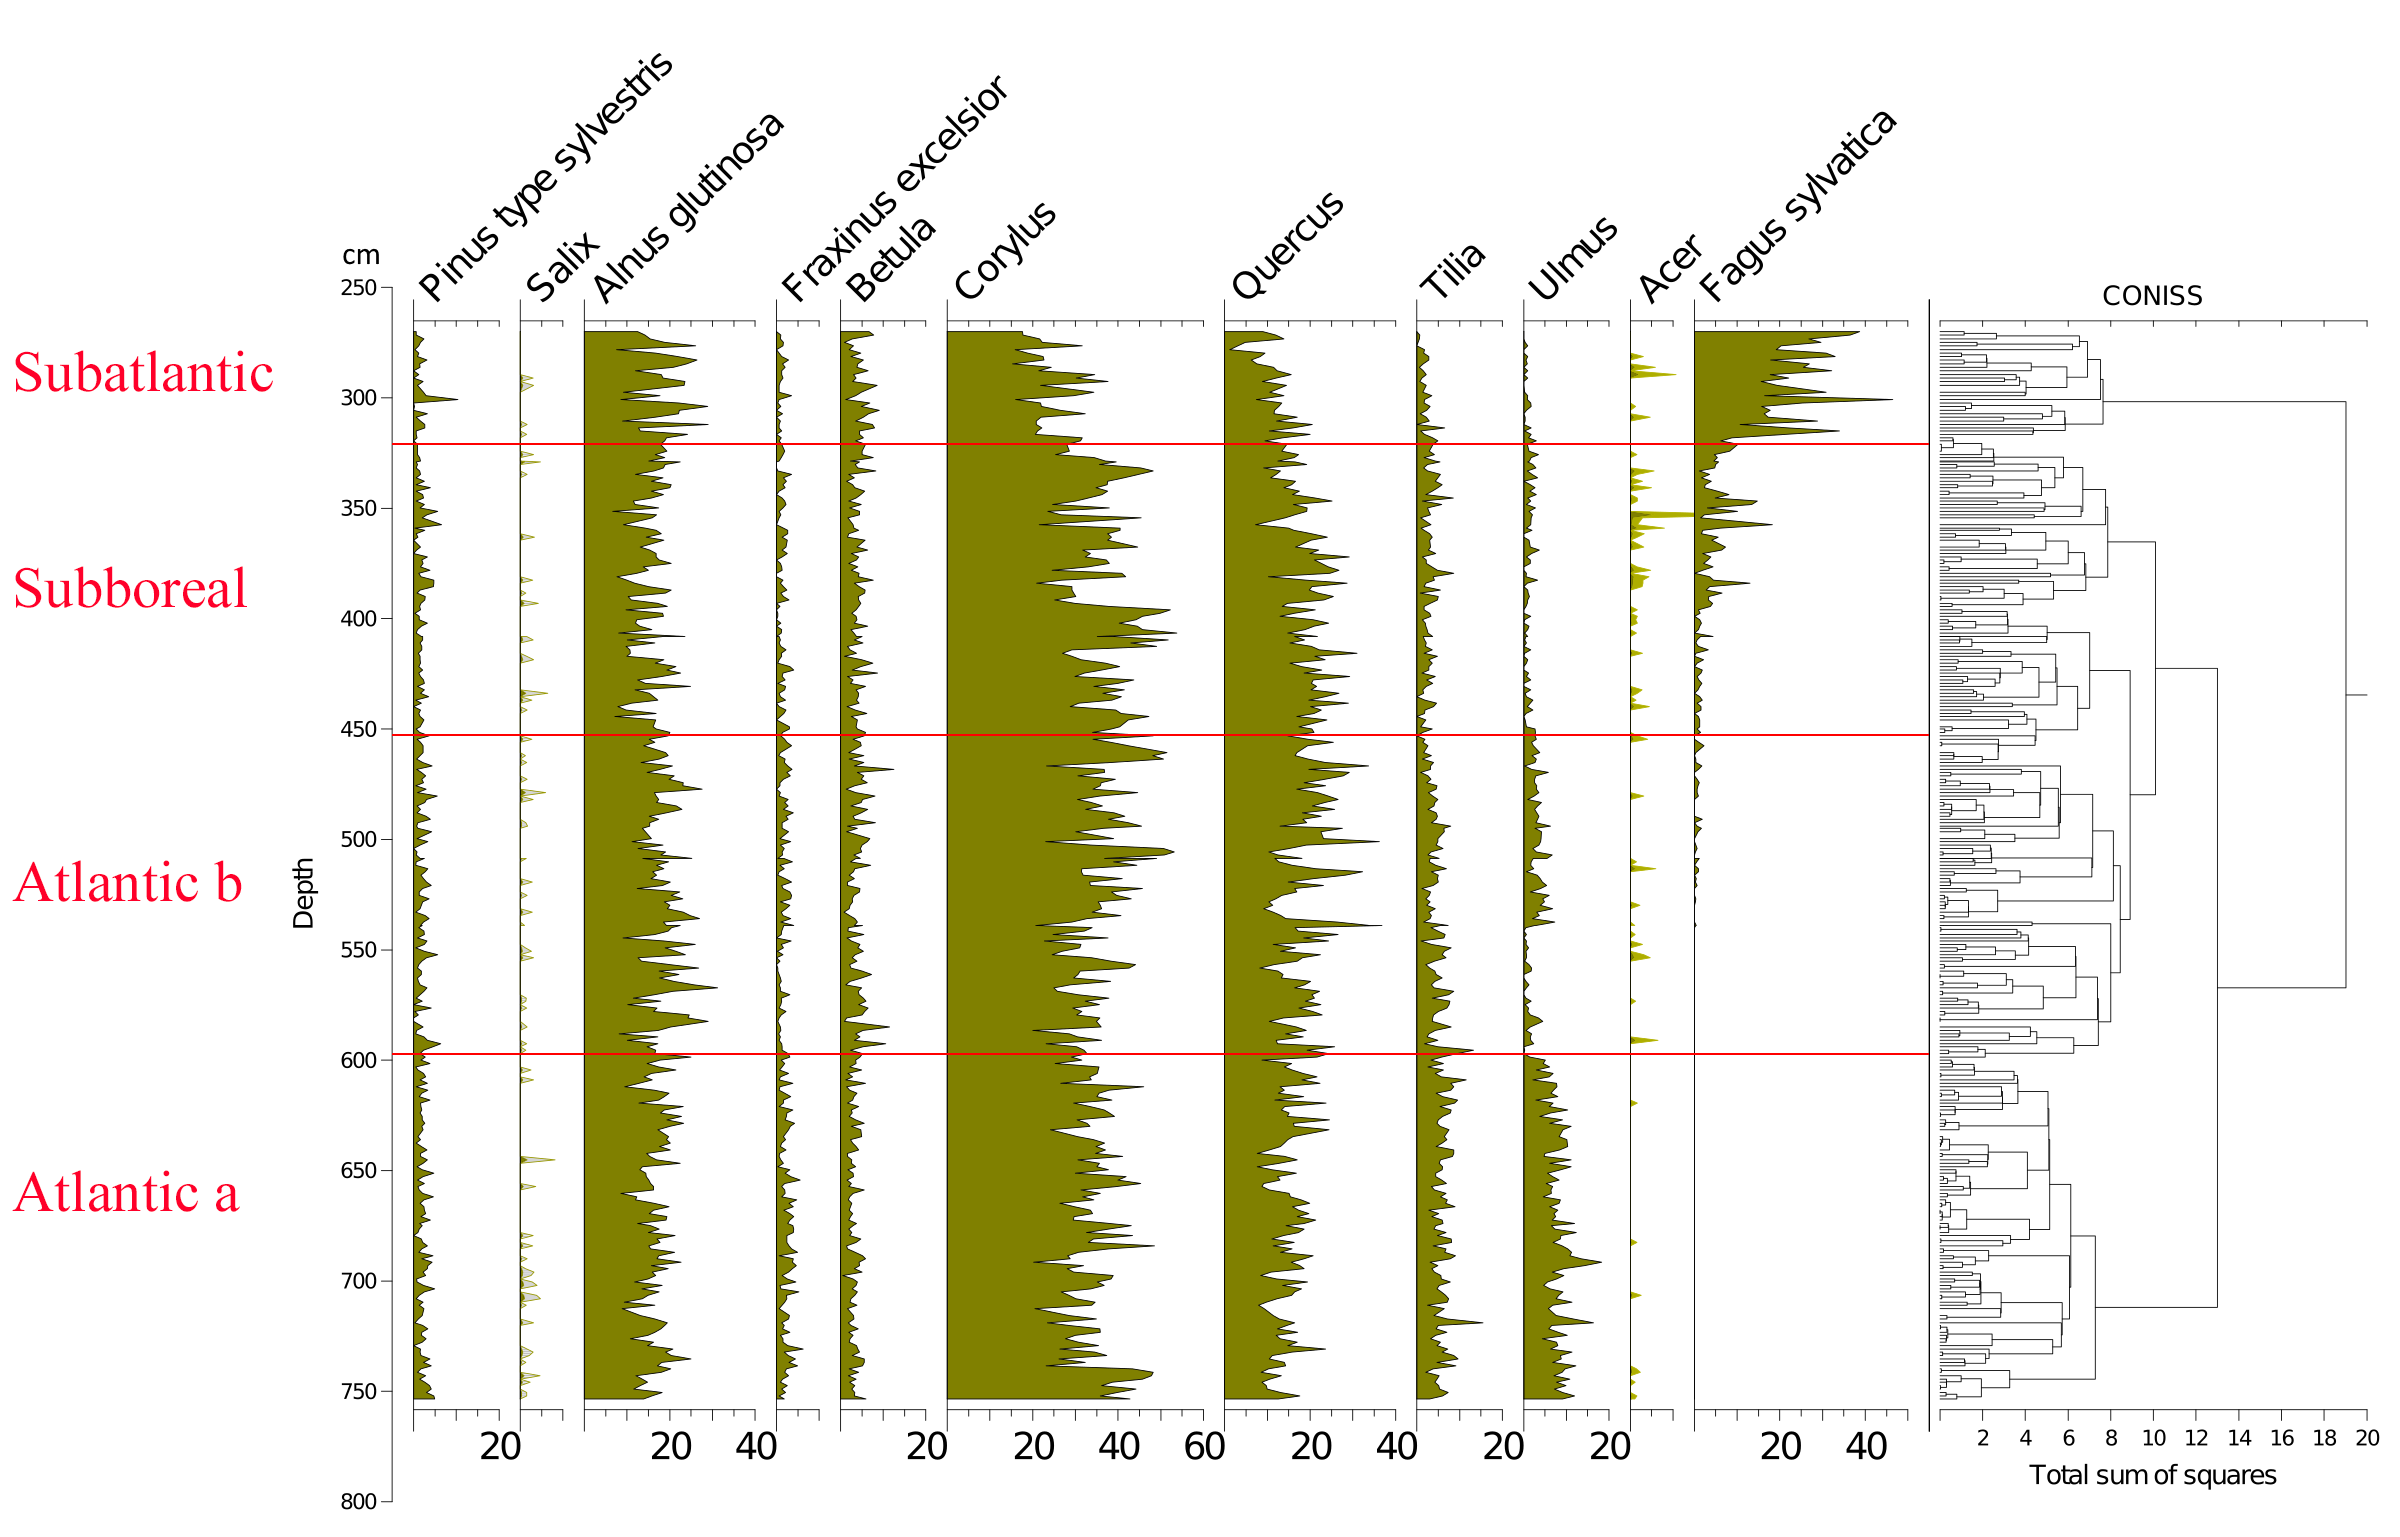
22Figure 2. Evolution of the tree pollen rain on the Misten peat bog from the Atlantic up to the base of the Subatlantic. Silhouettes of Acer and Salix show 5x exaggeration of their percentage values.
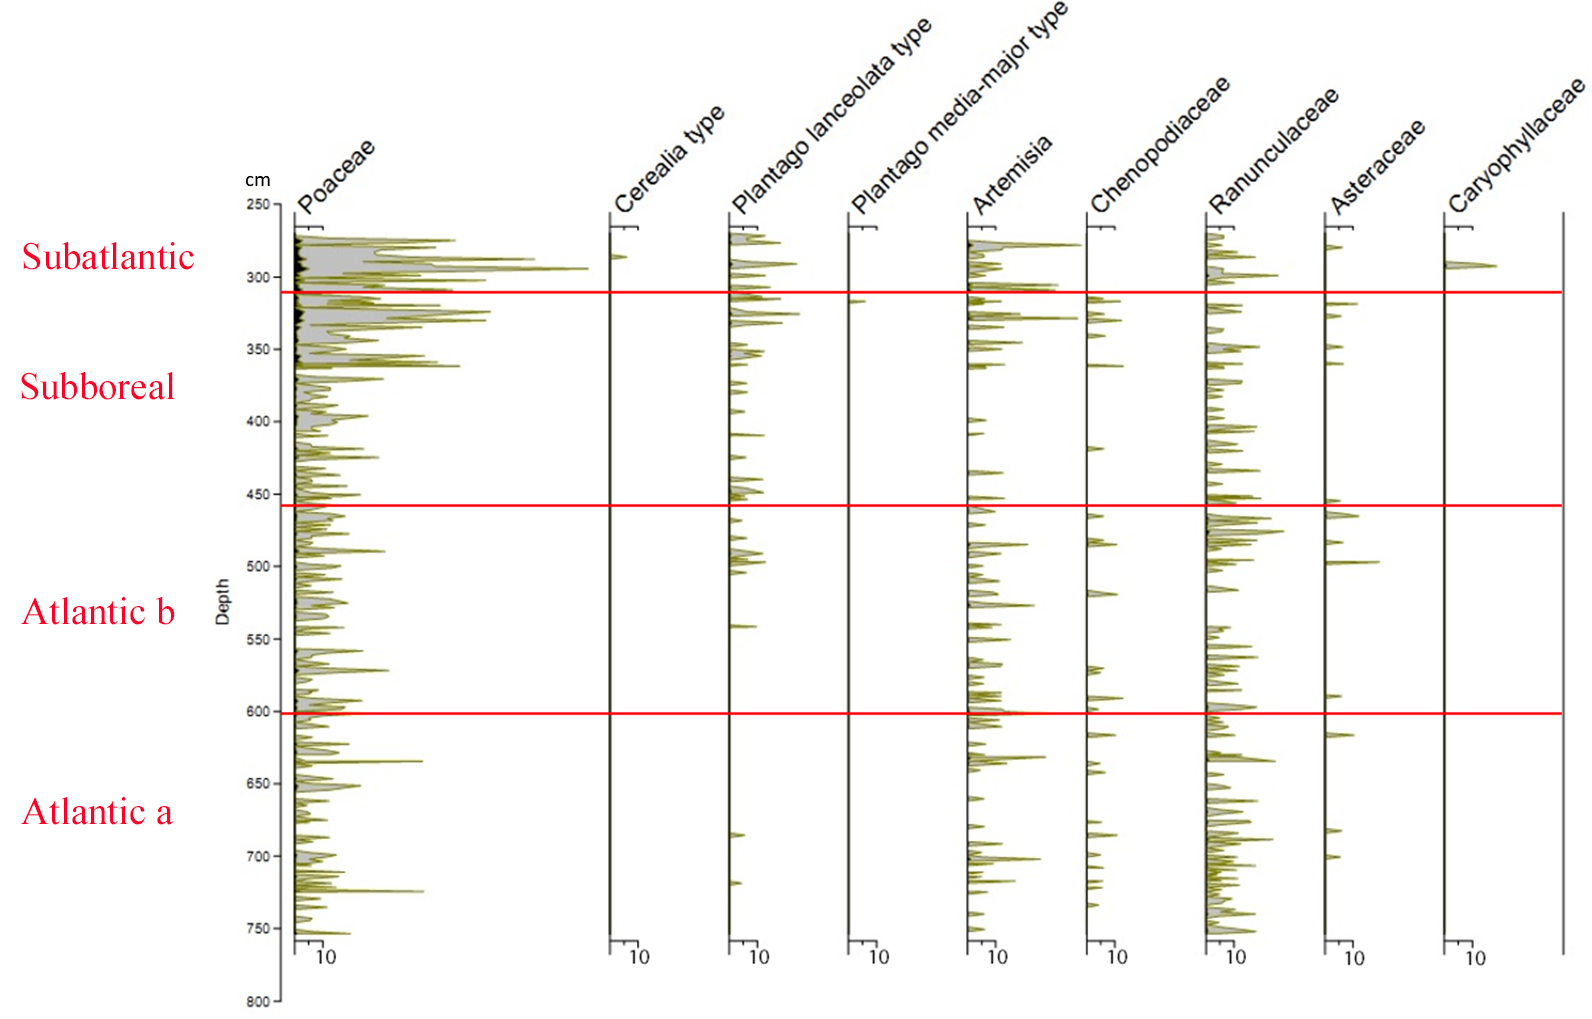
23Figure 3. Non arboreal pollen diagram showing the taxa represented by less than one percent (from Kamran et al., 2016). Silhouettes show 20x exaggeration of their percentage values.
4.1.2. Comparison between MIS-08-01b and Hattlich diagrams
24a) General considerations
25We do not know exactly where Persch (1950) collected his samples, but he writes they come from about 500 m south of the Eupen-Monschau road, at 620 m a.s.l., which means more or less at the intersection of the track giving access to the Misten, the old trace of the cutting front and the related level curve (Fig. 1). We think that the Hattlich material came probably from a cutting trench and not from a core. Indeed, Persch’s (1950) diagram stops more or less at 1800 AD suggesting, by comparison with the Misten area (Streel et al., 2014), that about 20 cm of superficial peat was inappropriate for pollen analysis, as often noted at the top of peat cutting. Moreover, Hattlich is 4 m deep, which corresponds to the depth of the peat bog at its periphery (see Fig. 1). Peat where MIS-08-01b was taken is more than 7 m thick, although covering a smaller time span as will be demonstrated later. That gives us a chance to compare peat growth under slightly different ecological conditions, the two studied areas being separated by a few hundred metres.
26Percentages of taxa in the Hattlich diagram were calculated, as was often done during the last century, on the sum of Arboreal Pollen (AP) without Corylus. This last taxon can therefore reach very high percentages as shown in the Boreal period (VII) (a maximum of 287%, Fig. 4). To compare MIS-08-01b with the published Hattlich diagram, the sum of AP without Corylus was recalculated. The taxa taken into consideration by Persch (1950) for correlation purpose are those used in the Overbeck & Schneider’s (1938) zonation (Table 2), i.e. Betula, Corylus, Fagus, the Quercetum mixtum (sum of Quercus, Fraxinus, Tilia and Ulmus) and Pinus. Persch obviously added Alnus to emphasize the start of the “Betula peat” (his “Birkenbruchtorf”; Fig. 4) in a rather wet environment of the Boreal Corylus/Ulmus forest. The base of the MIS-08-01b profile did not reach such environment, perhaps because the drilling system could not penetrate the woody (?) substrate. The base of the profile reached the minerotrophic part of the peat bog (Salpeteur, 2011). Pollen rain of Alnus, Betula and Pinus was not used for correlation in the present paper. On Figure 4c, Pinus, always less than 5%, is even omitted. We emphasize the ratio Tilia versus Ulmus (Fig. 4a), a useful character in the lower half of both diagrams, and the percentages of Corylus (Fig. 4b), more useful in the upper half. The Fagus/Quercetum mixtum (= QM) competition (Fig. 4c) is essential to show the change of the climate near the top of the diagrams.
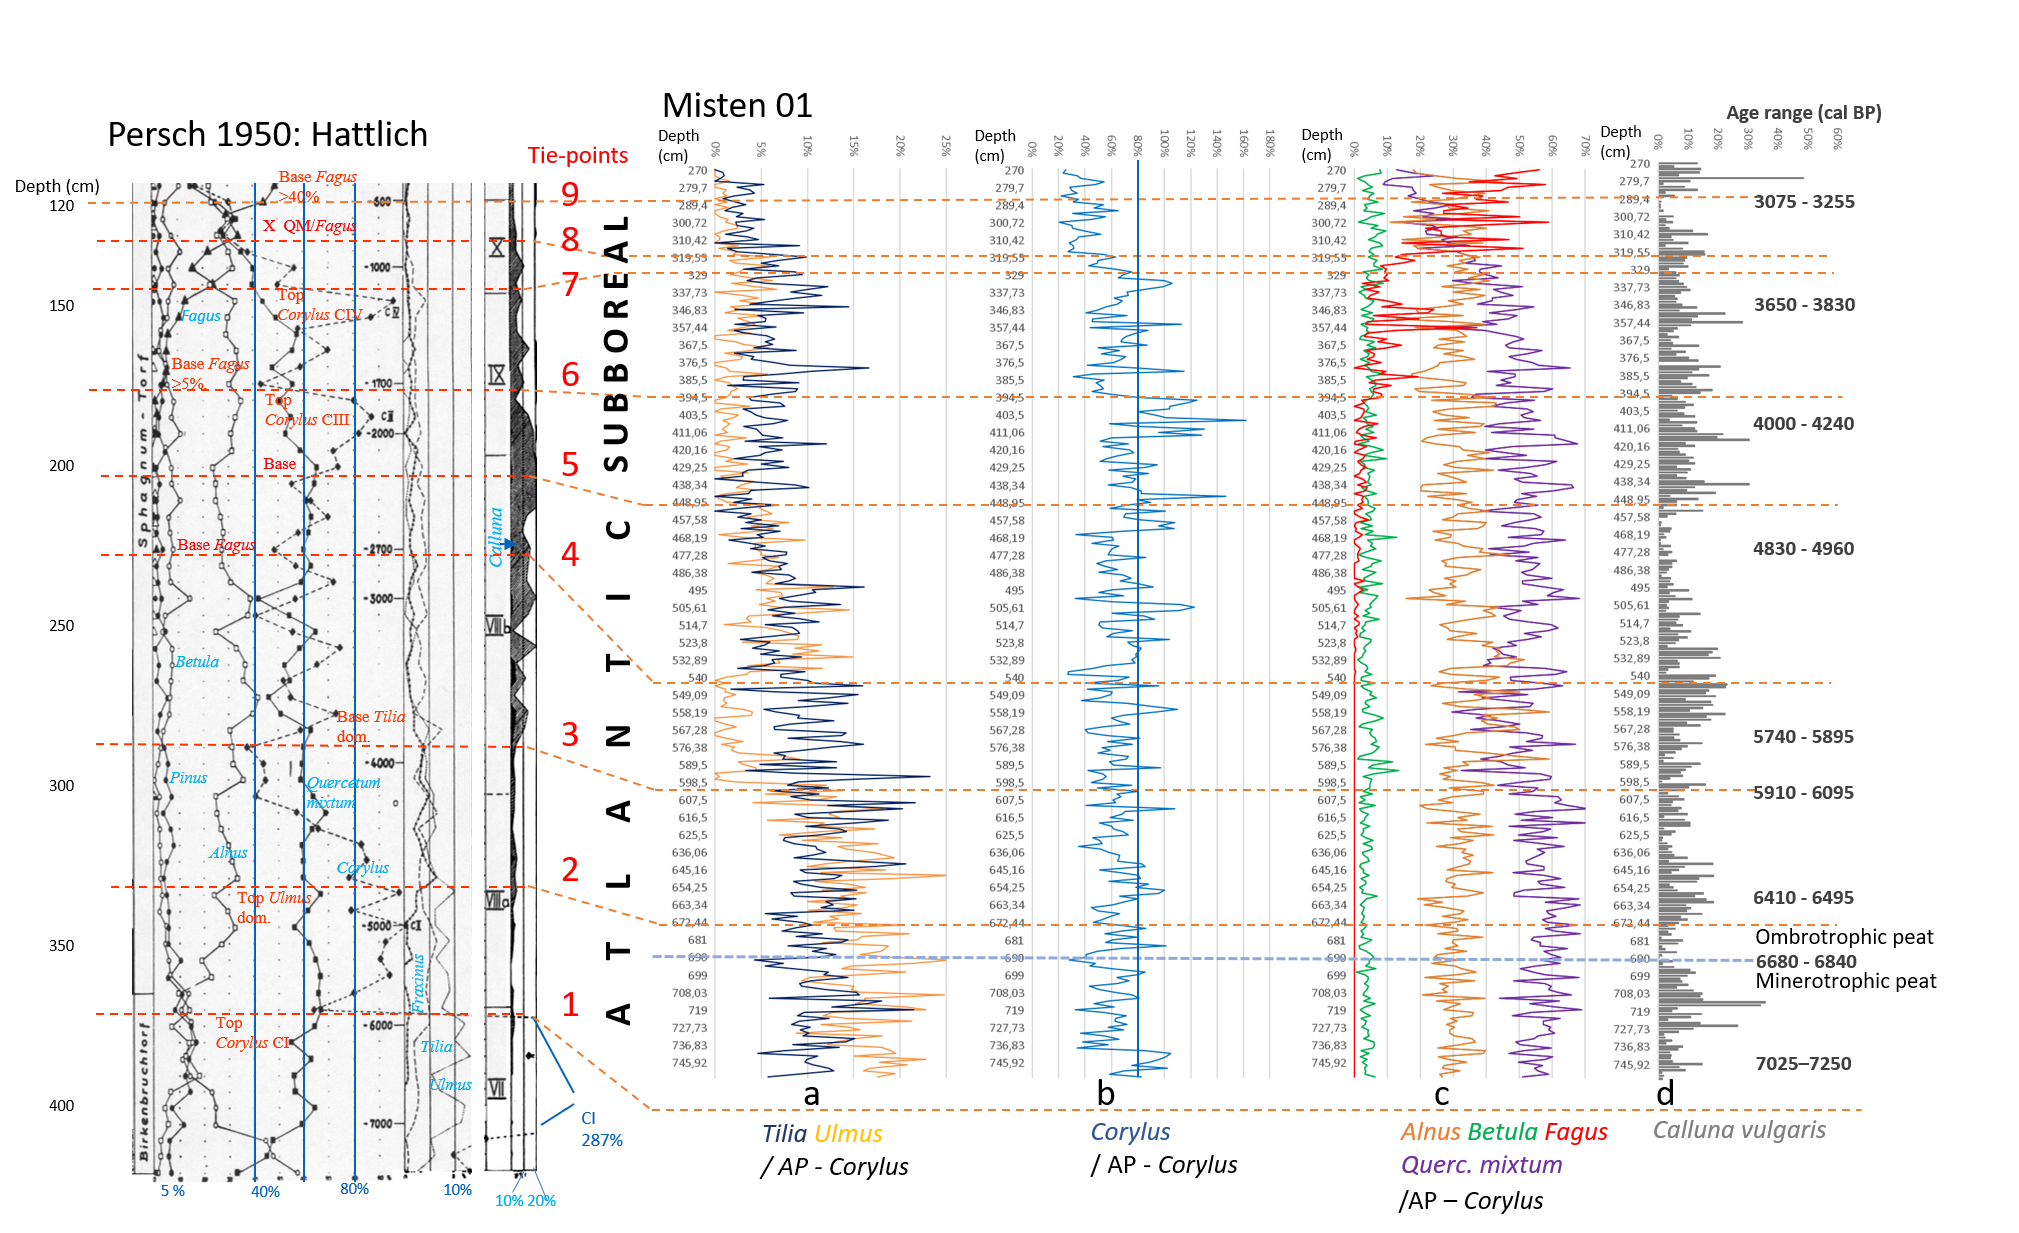
27Figure 4. Comparison of Hattlich (Persch, 1950) and MIS-08-01b (this study) pollen data. All data based on AP without Corylus. Position of the 9 tie-points is recognized in both diagrams. Ages are given in calBP (see Table 1) with modelled age range (94.5% probability). Atlantic/Subboreal limit is suggested at tie-point 5. The Misten diagram obviously does not reach the Boreal/Atlantic limit observed in the Hattlich diagram.

28Table 2. Floristic and climatic characteristics in the Hautes-Fagnes deduced by Persch (1950) from Overbeck & Schneider’s (1938) zonation.
29b) Comparison of available ages of selected tie-points in four localities
30We selected nine tie-points recognizable in both diagrams (Table 3). They are retained from the Persch’s Hattlich diagram and from the characteristics used by Overbeck & Schneider’s (1938) zonation.
31Age data given by Persch (1950) on the Hattlich diagram (Fig. 4) result from extrapolation (about 50 cm of peat/1000 years or about 1 cm/20 years) below the then accepted age of 600 BC for the base of the Subatlantic. These data are here transformed (Table 4) in BP ages (by arbitrarily adding 1950 years) to facilitate the comparison with the Misten 01 data where we use 14C modelled age ranges with 94.5% probability and where the analysis of 1 cm thick sample represents ca. 9 years.
32Tie-points were also used to correlate the Hattlich diagram with a diagram made in the Rurhof peat bog, about 10 km south (Paillet, 2016). Consequently, tie-points 6 and 8 were dated thanks to Paillet’s (2016) work (Table 4), corresponding respectively to the top Corylus CIII and to the intersection between QM and Fagus curves.
33Tie-points (TP) were also used by Litt et al. (2009) in the Westeifel Volcanic Field (50 km south-east of the Hautes-Fagnes plateau), to correlate between Holz Maar and Meerfelder Maar varved sequences. We identified there three tie-points corresponding respectively to tie-points 2 (TP6 or after Ulmus decline), 4 (TP7 or base of Fagus continuous curve), and 7 (TP8 or last Corylus peak before increase of Fagus). Tie-point 4 (base of Fagus curve) shows the larger difference of age between Hautes-Fagnes Plateau and Westeifel. The base of Fagus continuous curve is indeed very difficult to identify as shown in the MIS-08-01b diagram (Fig. 4), but one must also take into consideration the possible difference of migration speed of the taxon across Middle Europe during the Atlantic period (Schmidt, 1995; Giesecke et al., 2007). Tie-points 2 (top of Ulmus dominance) and 7 (top of Corylus peak) seem to be more reliable than tie-point 4.

34Table 3. Tie-points retained from the Persch’s (1950) Hattlich diagram and from the characteristics deduced from Overbeck & Schneider’s (1938) zonation.
35Table 4. Comparison of tie-point ages. BP ages for Hattlich or Westeifel are BC ages + 1950 yr.
36c) Analysis of intervals between tie-points in MIS-08-01b and Hattlich diagrams
37Between tie-points 1 and 3, the most abundant group of taxa (the Quercetum mixtum) fluctuates around 60%, Alnus around 30%, Betula around 5% (Fig. 4). The Quercetum mixtum is however not homogeneous: Ulmus prevalence on Tilia is less and less obvious from 1 to 3. Corylus fluctuates between 60% and 80%, except near the base of the MIS-08-01b where it may reach 100% (maybe representing the CII of Persch, 1950) and in the upper part of interval 2-3 in the Hattlich diagram where that taxon fluctuates between 40% and 60%. The interval between tie-points 1 and 3 corresponds to the lower part (VIIIa) of the Atlantic period.
38Between tie-points 3 and 4, the Quercetum mixtum fluctuates between 40% and 60% in the MIS-08-01b diagram, this probably being the result of a marked regression of Ulmus. The slight increase of Betula and Alnus is only the counterpart of the decreasing value of the Quercetum mixtum. Nothing comparable is observed in the Hattlich diagram.
39Between tie-points 4 and 5, the Quercetum mixtum fluctuates around 50% in the MIS-08-01b diagram, around 60% in the Hattlich diagram. Tilia and Ulmus values decrease from 4 to 5 (from less than 10% to less than 5%) in the MIS-08-01b diagram, but again nothing comparable is observed in the Hattlich diagram.
40A continuous curve of Fagus is situated in the mid-Atlantic VIIIb in the MIS-08-01b and begins to be clearly visible around 540 cm, corresponding to tie-point 4. The interval between tie-points 3 and 5 corresponds to the upper part (VIIIb) of the Atlantic period.
41Between tie-points 5 and 6, the Quercetum mixtum fluctuates around 50% in both diagrams. Corylus values reach more than 80% in the Hattlich diagram, from 100% to 160% in the MIS-08-01b diagram (the CIII of Persch, 1950).
42Between tie-points 6 and 7, the characteristics are more or less similar to interval 5 and 6, including a possible CIV (Persch, 1950), except a major feature arising at tie-point 6 with the increasing, but irregular, development of Fagus (between 5% and 30% in the MIS-08-01b diagram) starting the competition with the Quercetum mixtum.
43The interval between tie-points 5 and 7 corresponds to the lower part (IX) of the Subboreal period.
44Between tie-points 7 and 8, Fagus fluctuates between 10% and 20% in both diagrams.
45Between tie-points 8 and 9, the competition between Fagus and the Quercetum mixtum reach a maximum, both oscillating between 20% and 40%. Corylus decreases below 60% (between 40% and 60% in the MIS-08-01b diagram, between 30% and 40% in the Hattlich diagram).
46The interval between tie-points 7 and 9 corresponds to the upper part (X) of the Subboreal period.
47Tie-point 9 indicates the base of fluctuations of Fagus between 30% and 60% and a strong decrease of the Quercetum mixtum below 20%. It corresponds to the base of the (XI) Subatlantic period.
48d) Major discrepancies between Hattlich and Misten diagrams
49Based on the comparison of Hattlich and Misten sites (Table 5), we conclude that the central part of the peat bog (Misten site) received more Corylus pollen grains and less QM pollen grains than the periphery (Hattlich site). Such observation may reflect a more open vegetation (heath) in the centre allowing to “capture” there more pollen grains transported by wind than the presumably more forested periphery where local pollen rain was dominant. The distribution of Calluna vulgaris (Fig. 4) offers some possibility to evaluate the density of the shrub cover in the centre of the peat bog and on its periphery. Between tie-points 1 and 3 (VIIIa Atlantic period), Calluna never reaches 10% in the periphery but often more than 10%, reaching sometimes almost 20%, in the centre of the peat bog. Between tie-points 3 and 4 (VIIIb Atlantic period, during the strong reduction of Ulmus), Calluna density is almost similar in both environments. However, between tie-points 4 and 5, a strong reduction (5-10%) of Calluna occurs only in the centre of the peat bog. From tie-points 5 to 9 (Subboreal period) abundance of Calluna is again very similar in both environments, being more and more reduced from tie-points 6 to 9. These data probably reflect local changes in the centre of the peat bog.

50Table 5. Comparison of pollen diagrams discrepancies between Hattlich (Persch, 1950) and Misten (this study).
4.2. Testate amoebae analyses
4.2.1. Testate amoebae zonation and Shannon-Weaver Diversity Index
51The stratigraphically constrained cluster analysis resulted in the identification of five biozones (biozones A to E). The Shannon-Weaver Diversity Index was calculated for all samples. The variation of the Shannon-Weaver Diversity Index along the core is presented at Figure 5.

52Figure 5. Shannon-Weaver Diversity index (based on testate amoebae). The Shannon-Weaver Diversity index is smoothed by a fifth-degree polynomial curve. Header shows biozones (A to E) defined by using CONISS (Grimm, 1987) in Fig. 6.
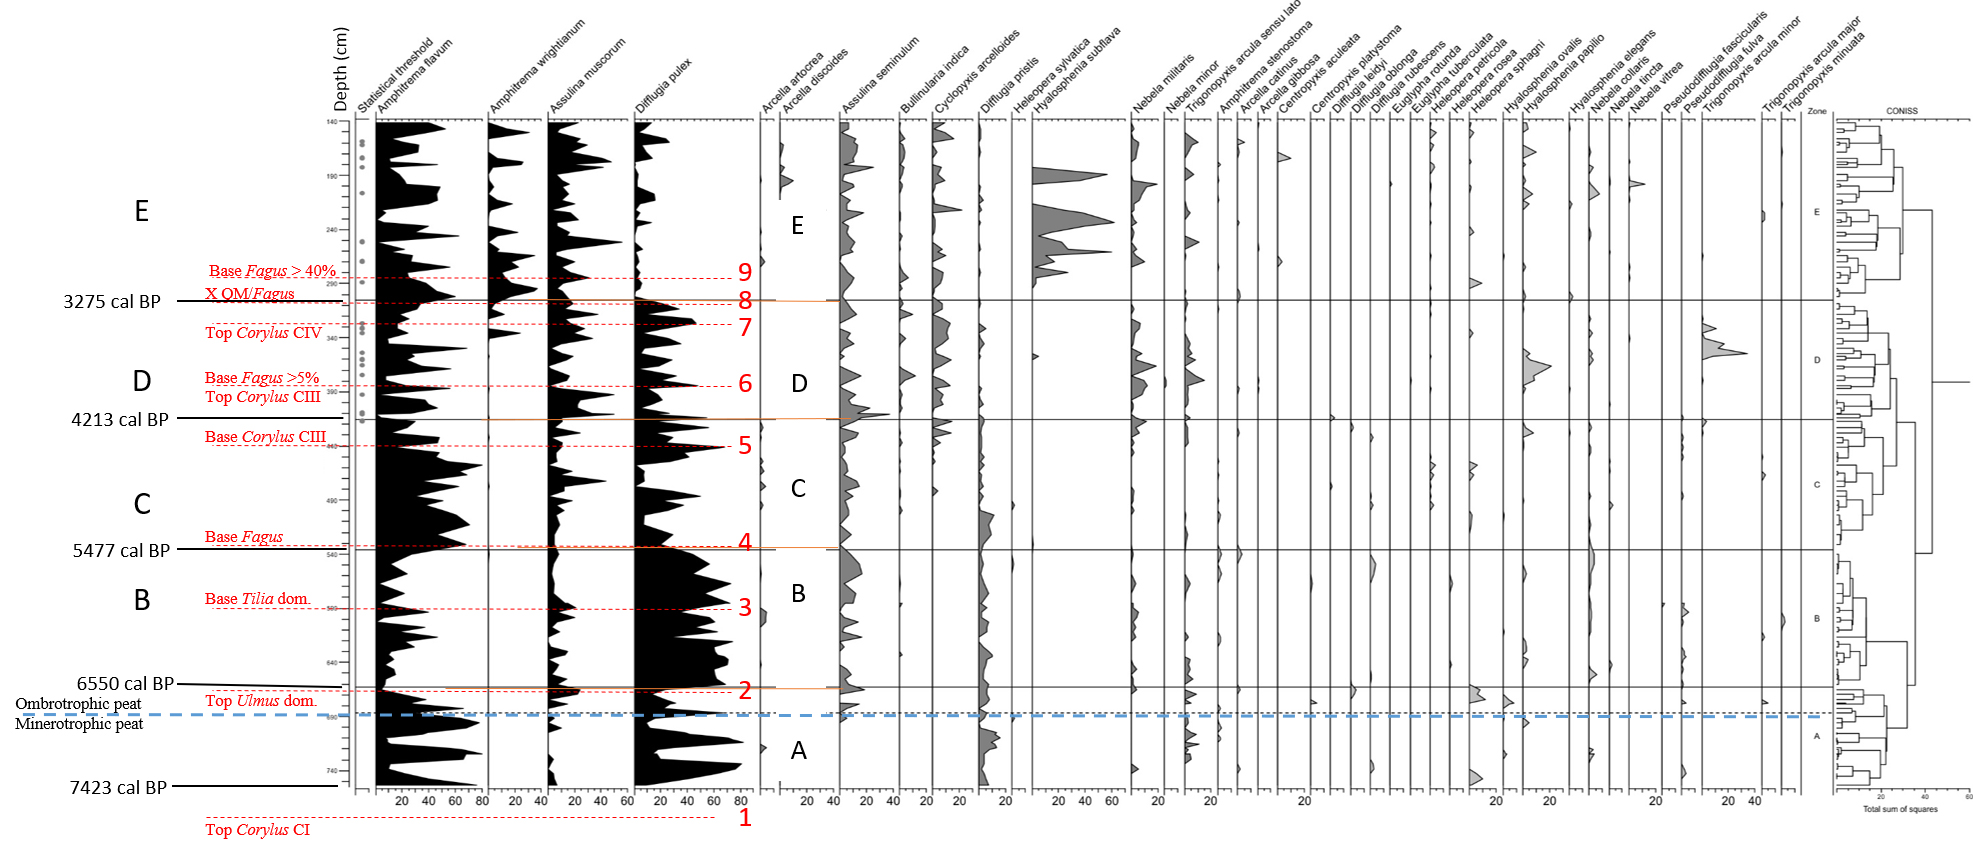
53Figure 6. Distribution of selected testate amoebae in MIS-08-01b. Grey dots indicate the samples that have not reached the statistical threshold of 100 counted tests. Instead of Amphitrema flavum read Archerella (Amphitrema) flavum. Pollen tie-points 1 to 9 are added for comparison purpose with Fig. 4.
54Biozone A (753.5 cm ≈ 5300 BC/7250 BP to 662.58 cm ≈ 4576 BC/6526 BP) displays high-amplitude fluctuations that seem to be alternating for both Archerella (Amphitrema) flavum and Difflugia pulex (Fig. 6). High value of the Shannon-Weaver’s Diversity index occurs at the top of the biozone A.
55Biozone B (662.58 cm ≈ 4576 BC/6526 BP to 535.68 cm ≈ 3528 BC/5478 BP) is dominated by Difflugia pulex; Archerella (Amphitrema) flavum however displays a high relative frequency (47%) at approximately the middle part. Within this biozone, testate amoebae reach a first taxonomic plateau of the Shannon-Weaver Diversity index.
56Biozone C (535.68 cm ≈ 3528 BC/5478 BP to 415.609 cm ≈ 2263 BC/4213 BP) is dominated by Archerella (Amphitrema) flavum; Difflugia pulex however displays also a high relative frequency (50%) at approximately the middle part and three others at the upper part. Within this biozone, a second taxonomic plateau of the Shannon-Weaver Diversity index starts to be reached. According to Allan et al. (2013), a very high humification rate (≈ 78%) occurs at approximately 3000 BC/ 4950 BP.
57Biozone D (415.61 cm ≈ 2263 BC/4213 BP to 305.56 cm ≈ 1326 BC/3276 BP) is not clearly dominated by Archerella (Amphitrema) flavum or Difflugia pulex. Difflugia pulex tends to decrease throughout the biozone. Two peaks of Amphitrema wrightianum are obvious at the top. Cyclopyxis arcelloides type fluctuates but never exceeds more than 15%. Difflugia pristis has a lower relative frequency than in lower zones. Hyalosphenia subflava presents a little but obvious positive shift. Relatively larger positive shifts are also displayed by Bullinularia indica, Nebela militaris, Trigonopyxis arcula sensu lato, Hyalosphenia papilio and Trigonopyxis arcula minor at approximately the middle part of this biozone. Arcella discoides type is missing in biozone D except at the top. At the upper part of this biozone the second taxonomic plateau of the Shannon-Weaver Diversity index is reached.
58Biozone E (305.56 cm ≈ 1326 BC/3276 BP to 141.1 cm ≈ 155 BC/2105 BP) is characterized by (i) a new composition of the testate amoebae assemblage with a high overall value of the Shannon-Weaver Diversity Index, (ii) the lower relative frequency (%) displayed by Difflugia pulex compared with the underlying biozones, (iii) the presence, with higher relative frequency, of alternating Hyalosphenia subflava and Amphitrema wrightianum and (iv) the obvious positive shifts of Arcella discoides type, Cyclopyxis arcelloides type and Nebela militaris at approximately the middle part; Trigonopyxis arcula sensu lato is also present.
59From the base to the top of the entire long core, the relative frequency of Assulina muscorum globally increases with major peaks of high relative frequency (> 40 %) in the biozones C, D (two at the bottom) and E.
4.2.2. Palaeo-hydroclimatic conditions of testate amoebae biozones
60a) General considerations
61The water-table depth optima and tolerances for the taxa used are presented at Figure 7, on the basis of the data of figure 5 of Amesbury et al. (2016). This diagram emphasizes the rather dry character of the Atlantic VIIIb and Subboreal IX and X, the majority of taxa selected being in the optima ranges living 10 to 20 cm above the WTD, reaching sometimes 20 to 30 cm above the WTD (Fig. 7). The wet character of the Subatlantic XI is emphasized by taxa like Amphitrema wrightianum type living 0-5 cm above the WTD or Arcella discoides and Argynnia vitraea living 5-10 cm above the WTD. Additionally, Amphitrema wrightianum is noted by Amesbury et al. (2016) as “skewed” to the Atlantic region, when most of the other taxa are “skewed” to the Continental region. Its high abundance at the base of the Subatlantic XI might be considered the result of a significant general change in the local climate of the Hautes-Fagnes Plateau.
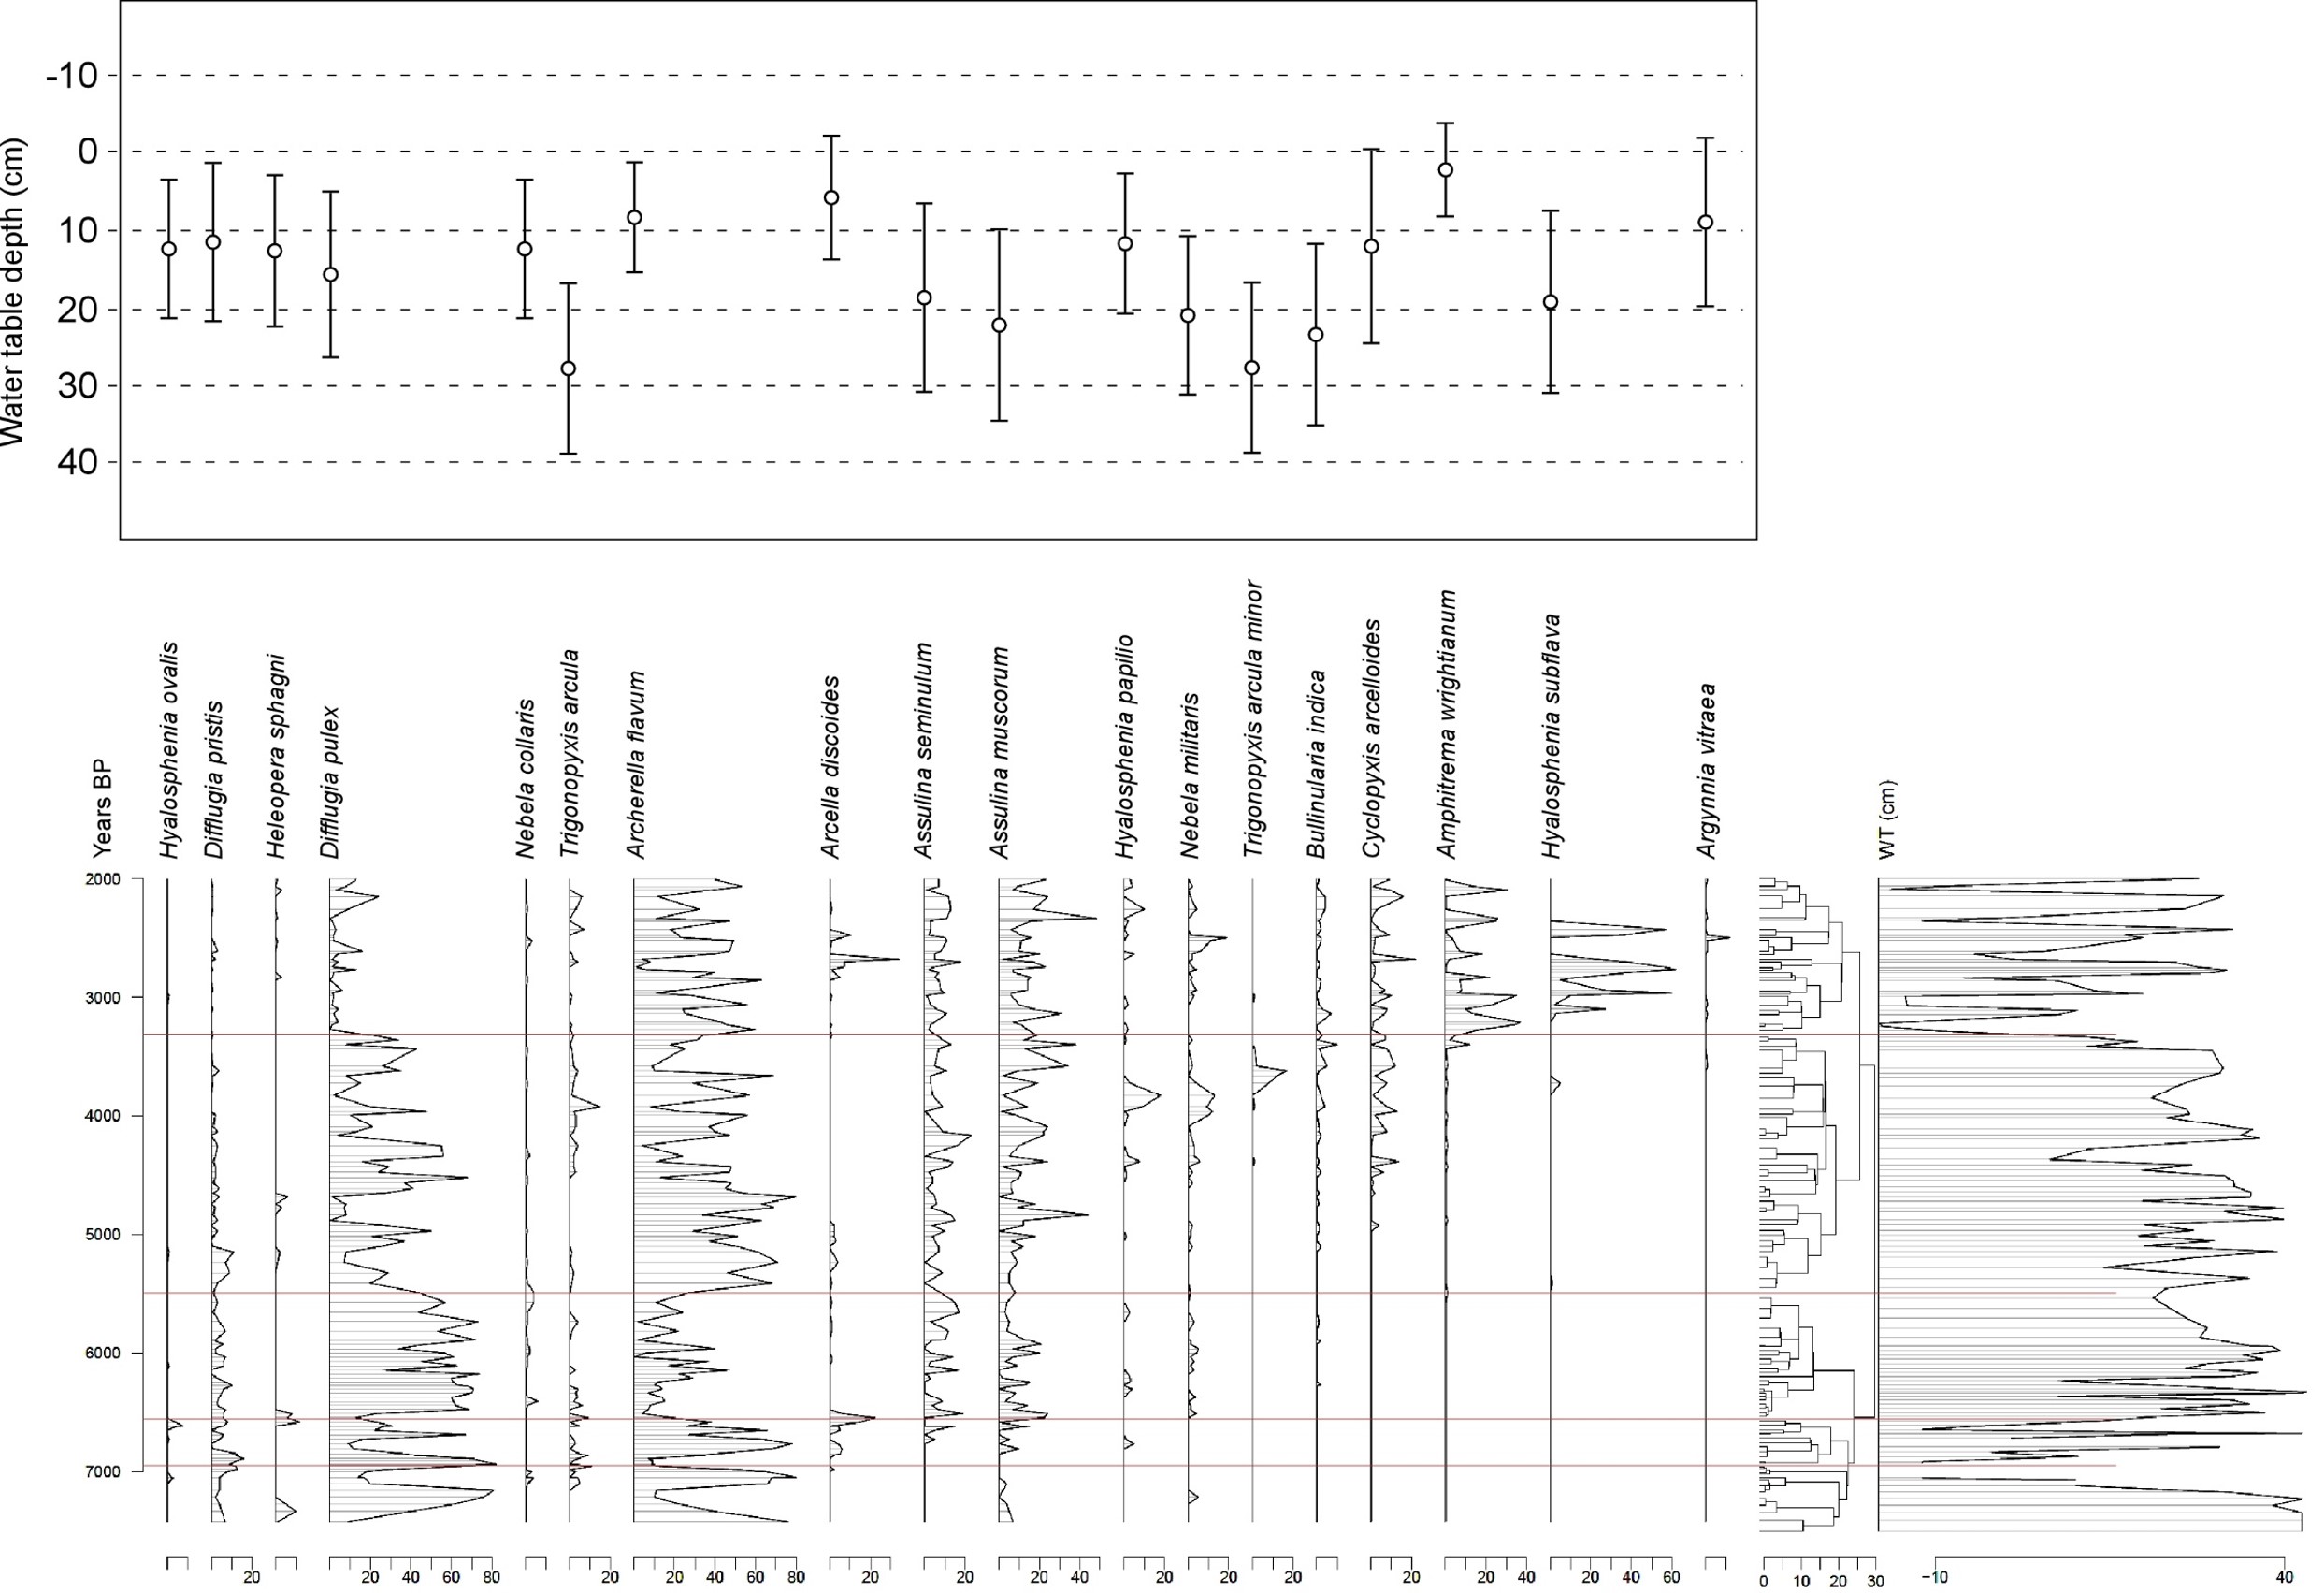
62Figure 7. Distribution of selected testate amoebae in according to the data issued from the transfer function of Amesbury et al. (2016). Range and optimal distance of these taxa above the water-table (WT). Red lines position, deduced from CONISS analysis, is almost identical to subdivisions A to E in Fig. 6 except for the C/D limit.
63In order to assign climatic characteristics to the five above-defined biozones, three transfer functions (Charman et al., 2007 as described by Sillasoo et al., 2007; Lamentowicz et al., 2008; Amesbury et al., 2016) have been applied. The results of the three transfer functions are broadly comparable (Fig. 8).

64Figure 8. Distance of testate amoebae to water-table for the MIS-08-01b. The curves of the depth to water-table (in cm) were inferred by using three testate amoebae transfer functions : a, from Charman et al. (2007); b, from Lamentowicz et al. (2008); c, from Amesbury et al. (2016) in Fig. 7. Header shows biozones (A to E) defined by using CONISS (Grimm, 1987) in Fig. 6.
65b) Detailed description of the palaeo-hydroclimatic conditions of the five biozones
66Biozone A
67A preliminary geochemical study (Salpeteur, 2011) showed that the fen-bog transition (FBT) started at 687 cm depth (mode ≈ 4773.5 BC/ 6723.5 BP) to finish at 663 cm (mode ≈ 4575.9 BC/6525.9 BP), which is the top of the biozone A (Fig. 6). Because ombrotrophic mires receive water mainly from atmospheric precipitation, the depth to water-table is linked to hydroclimatic conditions; on the other side, minerotrophic mires have significant input of water from surface runoff and groundwater (Charman, 1997). Because biozone A includes the minerotrophic part of the extant peat bog, palaeo-hydroclimatic conditions could with less certainty be assigned to this biozone as can be done for the stratigraphically upper ombrotrophic part. At the upper part of the biozone A, testate amoebae reach a first plateau of taxonomic diversity with a very high index of the Shannon-Weaver Diversity followed by an important dropdown (Fig. 5). This high amplitude difference could be due to the transition from minerotrophic to ombrotrophic conditions. Wetter surface conditions are proposed for the biozone A by using the three testate amoebae transfer functions. According to Allan et al. (2013), the time interval [5300-4700 BC/7250 BP-6650 BP] is characterized by wet climatic conditions (but see remarks above about the palaeo-hydroclimatic conditions in minerotrophic mires).
68Biozone B
69Drier climatic conditions can globally be assigned to biozone B. However, at least, one short wetter event with a relatively high amplitude (mode ≈ 4142.9 BC/6092.9 BP) occurs at the middle part of the biozone B, as shown by Archerella (Amphitrema) flavum (Fig. 6). According to Allan et al. (2013) the time interval [4700-4000 BC/6650 BP-5950 BP] is characterized by dry climatic conditions.
70Biozone C
71Wetter climatic conditions can globally be assigned to biozone C with, at least, a short drier event with a relative high amplitude (≈ 2880.8 BC/4830.8 BP) at the middle part, as shown by Assulina muscorum, and drier conditions at the upper part with, at most, two short drier event with a relative high amplitude (≈ 2571.2 and 2423.9 BC/4521.2 and 4373.9 BP), as shown by Difflugia pulex (Fig. 6). Nonetheless, it has to be noted that, within this biozone, there is the start of a climatic transition as shown by the first occurrences of Cyclopyxis arcelloides type and the start of the progressive decreasing of Difflugia pristis (Fig. 6). However, the percentages of Difflugia pristis in the upper part could be underestimated because this species is sometimes difficult to identify amongst organic debris. According to Allan et al. (2013) and Wanner et al. (2011), the time intervals between 3200 and 2500 BC (or 5150 and 4450 BP) are characterized by wet climatic conditions.
72Biozone D
73Biozone D is interpreted as a climatic transition interval (with high taxonomic diversity) as shown by the decrease of Difflugia pulex and Difflugia pristis but also with the increase of Amphitrema wrightianum, Hyalosphenia subflava, Nebela militaris, Trigonopyxis arcula sensu lato, Hyalosphenia papilio and Trigonopyxis arcula minor. The end of this climatic transition is obvious at the top of this biozone (at the transition from biozone D to biozone E) where Difflugia pulex reaches very low percentage of relative frequency (Fig. 6). During this period of time the population of Archerella (Amphitrema) flavum and Difflugia pulex alternate rapidly, with low differences between them; it is consequently difficult to safely qualitatively infer the bog surface wetness. Thanks to the three transfer functions, drier climatic conditions could be assigned to this biozone. At least three short events of driest conditions, with relative high amplitude, occurred at approximately 2238.3 BC/4188.3 BP, 2018.5 BC/3968.5 BP and 1798.8 BC/3748.8 BP, as shown by Difflugia pulex (Fig. 6). According to Allan et al. (2013) the time intervals [2500-2000 BC/4450-3950 BP (transition between biozone C to biozone D) and 2200-1800 BC/4150-3750 BP] are characterized by dry climatic conditions.
74Biozone E
75Biozone E is characterized by the end of a climatic transition displayed by testate amoebae assemblage (mainly by Difflugia pulex, Amphitrema wrightianum and Hyalosphenia subflava) with an overall high Shannon-Weaver Diversity index (Figs 5 and 6). Thanks to the three transfer functions, wetter climatic conditions could be assigned to the lower part of this biozone and drier climatic conditions could be assigned to the upper part of this biozone. Very high amplitude of water-table fluctuations occurred over this period of time (Figs 7 and 8). Two wet shifts are obvious at the lower part of this biozone at ≈ 1243 BC/3193 BP and 932 BC/2882 BP, as shown by Archerella (Amphitrema) flavum. At least, one short event of driest climatic conditions occurs at around 700 BC/2650 BP, as shown by Hyalosphenia subflava (Fig. 6). According to Allan et al. (2013), the time interval [1200-600 BC/3150-2550 BP] is characterized by dry climatic conditions.
4.2.3. Testate amoebae zonation based on dominant species and related humidity on the peat bog surface
76The species with the highest overall relative weight (%) along the entire profile are Archerella (Amphitrema) flavum (suggesting wet conditions) and Difflugia pulex (suggesting drier conditions). The numbers of representatives of the two species seem to vary synchronously but in an opposite way, even though these species have non-significant negative linear correlation (r = -0.4). Accordingly, we tentatively use their respective abundance as indicative of wet (dominance of Archerella (Amphitrema) flavum) or dry (dominance of Difflugia pulex) conditions. Assulina muscorum has also high overall relative weight, but lower than that of the species above mentioned.
4.2.4. Integration of testate amoebae and pollen zonations
77Integration of the two zonations permits the subdivision of the ombrotrophic part of the studied section into 18 smaller time intervals (Table 6; Fig. 9) with various pollen features corresponding to detailed humidity condition “registered” by the testate amoebae on the peat bog surface at each of the studied time intervals. As no significant anthropic actions could be demonstrated on and around that peat bog during that time span, it is assumed here that variations of humidity at the surface of the peat bog reflect also indirectly variation in general climatic conditions on the surrounding area.

78Table 6. Testate amoebae, pollen zones, time-intervals, dates comparisons. Ages cal BP from Table 1, and Figs 4 and 6.
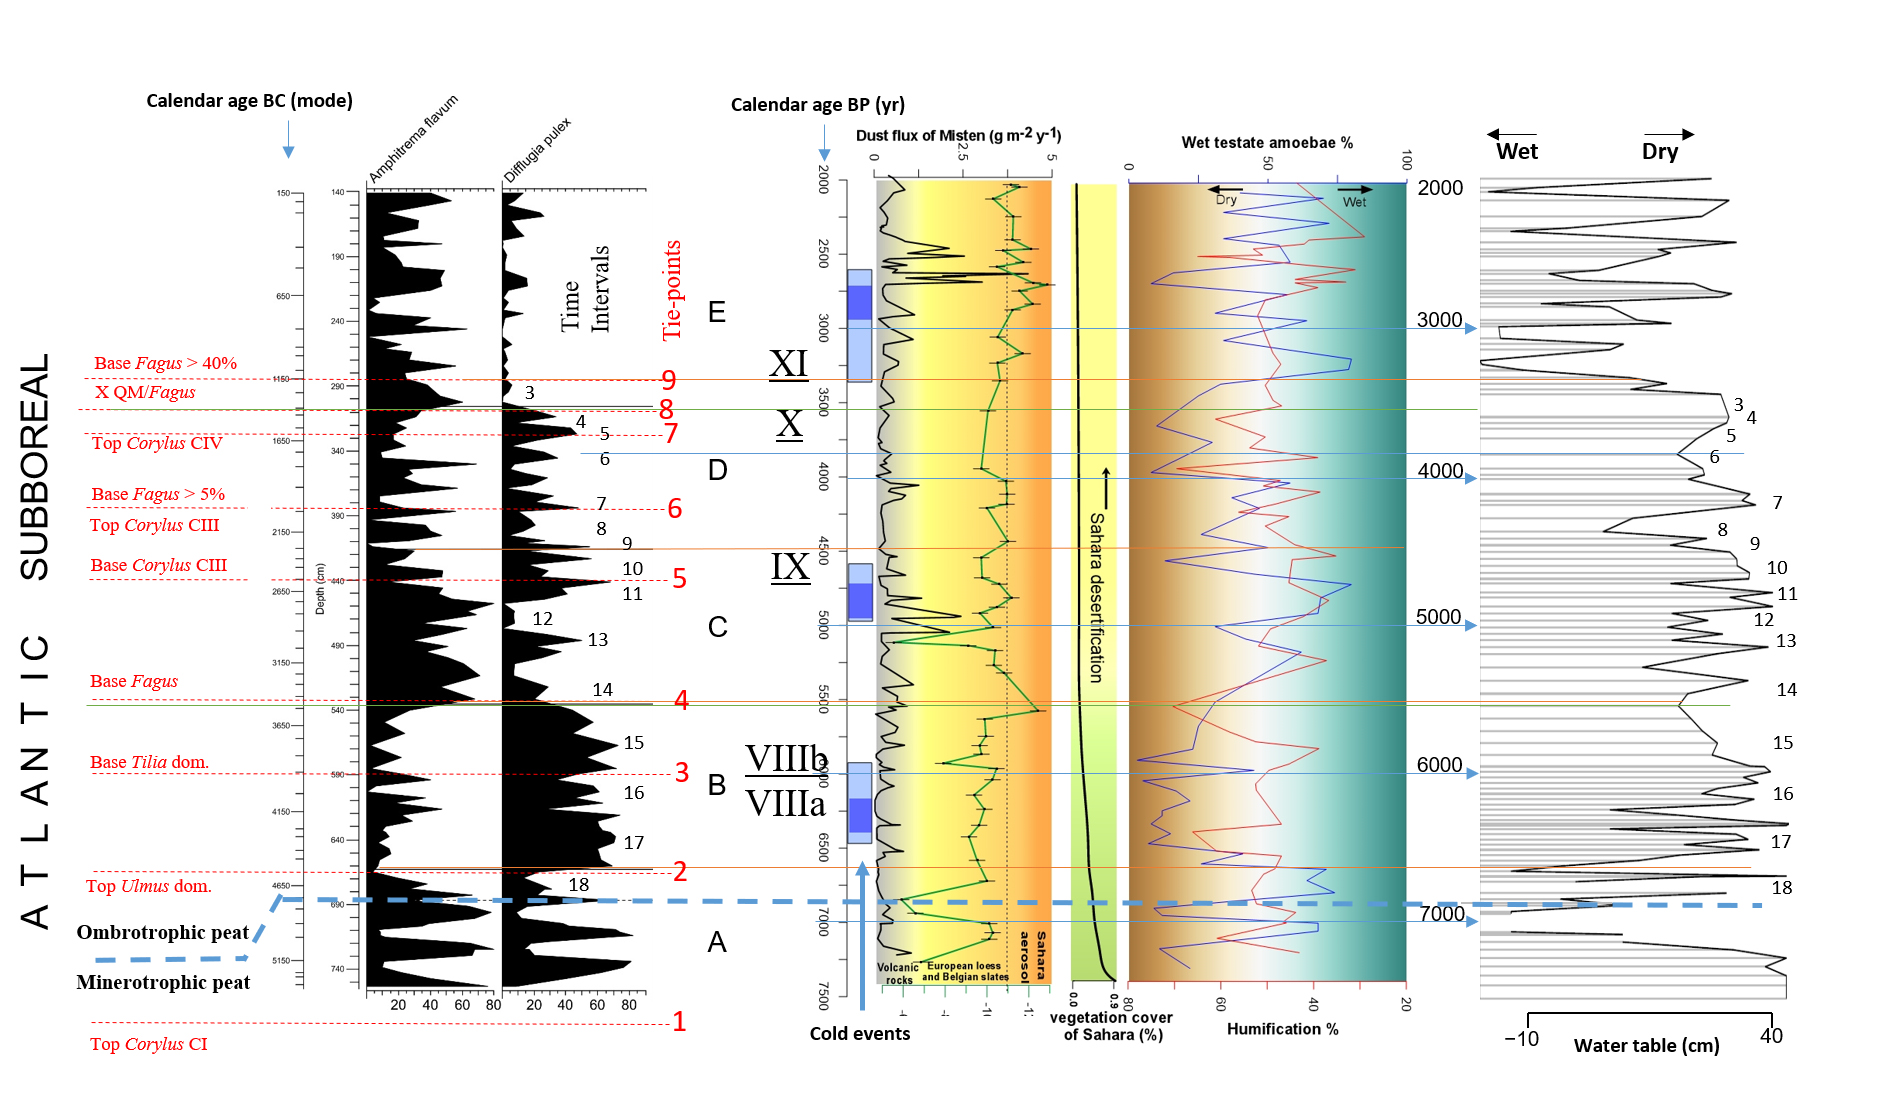
79Figure 9. Comparison of the Misten proxies (pollen, dust flux, εNd, humification, and testate amoebae). Pollen characteristics of tie-points from Fig. 4. Two main testate amoebae in Atlantic–Subboreal periods in the Hautes-Fagnes area, from Fig. 6 (instead of Amphitrema flavum read Archerella (Amphitrema) flavum). Time intervals as deduced from Table 6. Dust flux, εNd, humification, and testate amoebae from Allan et al. (2013). The testate amoebae were classified according to their affinity with wet conditions. The three vertical dark blue bars show the cold events according to Wanner et al. (2011) and the three light blue bars show the uncertainty in the length of cold events. The Saharan desertification model is from Claussen et al. (1999). Water-table (WT) (cm) are reproduced from Fig. 7.
80The analysis of these 18 time intervals gives interesting information on the behaviour of some taxa in response to climatic fluctuations. Increasing values of Tilia are noted in dry to driest conditions from the Atlantic (VIIIa and VIIIb) to the Subboreal IX, a situation met with Calluna on the peat bog in Atlantic VIIIb and Subboreal IX (Fig. 4). Corylus values increase with dry/driest conditions in Subboreal IX, but decrease with the same conditions in Subboreal X. Fagus increases in dry conditions of Subboreal IX and X but also in wet conditions of Subboreal X and Subatlantic XI. Ulmus increases and decreases indifferently in dry and wet conditions during the Atlantic (mainly VIIIb), giving some support to the existence of an anthropic effect on the distribution of this taxon (See 4.1.1).
4.3. Mineral dust analysis
81Based on dust flux data from Allan et al. (2013), the climate imprint in the Misten record during Mid- and Late Holocene and especially for two dust enriched intervals (5150 to 4750 cal BP and from 2750 to 2550 cal BP) is evaluated (Fig. 9).
82(i) Peat growth at the Misten site starts at 7300 cal BP, and becomes ombrotrophic from 6700 cal BP. Damblon (1994) pointed to the wet and warm climate of the Atlantic VIIIa period (6500 cal BP- 6000 cal BP; partially met by time-intervals 18 and 16), which is consistent with the warmest period of the Holocene described in Greenland by Johnsen et al. (2001) (see also Davis et al. (2003)).
83(ii) From 6700 to 5500 cal BP, the dust flux and humification remain relatively constant. The decrease in percentages of wet testate amoebae and the better representation of heathlands in pollen diagrams from the area (Damblon, 1994), show slightly drier local environments met by time-intervals 17 and 15, suggesting a rather dry climate with an increase of Tilia proportion in the local QM Atlantic vegetation. The definitive dominance of Tilia on Ulmus (near 6000 cal BP) separates the Atlantic VIIIa and the Atlantic VIIIb periods. These dry conditions might reflect the cooling event noted in Wanner et al. (2011) from 6500 to 5900 cal BP. A brief episode of wetter conditions (time-interval 16) has little impact on this QM drier Atlantic vegetation. During this interval, there is no significant change in the dust flux intensity but the relatively dry conditions promote the erosion of local soils. Between 8000 and 5500 cal BP, the Sahara aridification increases and the Saharan vegetation cover decreases. Then the available terrigenous material increases (Claussen et al., 1999; de Menocal et al., 2000; Bout-Roumazeilles et al., 2013).
84(iii) During the period from 5500 to 2550 cal BP, the Misten dust flux increases compared to the mean value in the previous intervals. At 4700 cal BP, time-intervals 12 (and 13?) suggest a rather wet climate with adequate local QM Atlantic vegetation, corresponding witha positive humidity anomaly at the scale of the northern hemisphere between 4800 and 4600 cal BP as described in Wanner et al. (2011). These time-intervals are characterized by wet local conditions underlined by the high wet testate amoebae content and the low humification degree. The humid conditions are in agreement with the plant cover changes of the Hautes-Fagnes Plateau deduced from palynology (Damblon 1994) (i.e. local increase in hygrophilous and aquatic pollen taxa). Between 4500 and 4000 cal BP, the general decrease of wet testate amoebae and the increase of the humification degree both indicate a drier local environment, starting with time-interval 11. The observed increase in dust flux may relate to important local erosion. The glaciers retreat in Europe from 4200-3800 cal BP (Mayewski et al., 2004) and the lake level minima (Magny, 2004) confirm a dry interval which is correlated with the first Subboreal (IX) period characterized by Corylus developments (time-intervals 8 and 6), and the last Tilia increase (time-intervals 9 and 7). Between 3700 and 3200 cal BP, the second Subboreal (X) period shows a progressive change from dry (time-intervals 5 and 4) to wet conditions (time-interval 3, with Fagus starting dominance in the QM forest). Between 3200 and 2550 cal BP, the dust flux increases and reaches its maximum value in the core. The humification degree decreases and wet testate amoebae strongly increase. The regional pollen data indicates a strong expansion of beech forests at the expense of the mixed oak woodlands, whereas alders and birches developed again near and on wetlands. These changes point to a climatic deterioration with alternating wet and dry conditions, but also to soil degradation(Damblon, 1994). They coincide with a cold event identified by Wanner et al. (2011) between 3300 and 2500 cal BP. Time-interval 2 where Fagus pollen grains reach more than 40% of the Arborean Pollen (AP) assemblage can be roughly identified to the beginning of the Subatlantic period (XI).
85According to the pollen analysis, anthropic activities appeared in the Hautes-Fagnes Plateau around 3500 BP, but they remained low and did not seem to have affected local ecological evolution before 2550 BP (dates from Damblon, 1994).
86(iv) Between 2550-2000 cal BP,the dust flux displays high values (averages of 0.6 g m-2 yr-1). At the same time, a low humification degree (35%) is consistent with cold and dry conditions and an intensification of the human impact is recorded in the pollen diagrams of the Hautes-Fagnes area (Damblon, 1994). This period is therefore most probably characterized by the influence of human activities related to land use change (regional erosion due to forest clearing and soil cultivation activities).
5. Conclusion
87The present work is dedicated to the study at high resolution of the central area of Misten peat bog (Hautes-Fagnes, Belgium) in order to reconstruct the conditions of peat formation and evolution on the basis of pollen and testate amoebae analysis. The Subboreal and Atlantic pollen diagram of this study has been compared and correlated with the diagram obtained from the periphery of the Misten peat bog (Persch, 1950). Nine tie-points have been selected and characterized, some of them being well dated by radiocarbon ages. Two of those tie-points are recognized, at about the same age, in the Westeifel region at 50 km from the study area.
88As expected, the central part of the Misten peat bog is shown to have received more Corylus pollen grains and less QM pollen grains than the periphery located at a few hundred metres. It presumably reflects a more open vegetation with adequate peat-forming vegetation in the centre, allowing the “capture”, there, of more pollen grains transported by wind than in the periphery where the local pollen rain of the Quercetum mixtum might be more important. The distinction between the central part of the peat bog and its periphery is also reflected in the distribution of the heavier pollen tetrads of Calluna which decrease significantly more on the central peat bog than at the periphery during the youngest part of the Atlantic VIIIb (around 4600-4800 cal BP), characterized by wet conditions and high water-table level. That period of time corresponds to a positive humidity anomaly at the scale of northern hemisphere.
89The testate amoebae analysis allows the assignment of globally drier climatic conditions to the transition (6410-6495 to around 5478 cal BP) from Atlantic VIIIa to Atlantic VIIIb. Wetter climatic conditions may globally be assigned to most of the higher part (5478 to around 4521 cal BP) of Atlantic VIIIb. The Subboreal period IX (around 4374 to 3650-3830 cal BP) is interpreted as a climatic transition interval (with high taxonomic diversity), the Subboreal period X (3650-3830 to 3075-3255 cal BP), marking a clear trend to the wetter climate of the Subatlantic (XI) period.
90The integration of the detailed testate amoebae data within the pollen zones allows the subdivision of the ombrotrophic part of the Misten section in 18 smaller time intervals. Increasing values of Tilia are noted in dry to driest conditions from the Atlantic (VIIIa and VIIIb) to the Subboreal IX. Ulmus increases and decreases indifferently in dry and wet conditions during the Atlantic (mainly VIIIb) giving some support to the existence of an anthropic effect on the distribution of this taxon. The definitive dominance of Tilia on Ulmus (near 6000 cal BP) separates the Atlantic VIIIa and the Atlantic VIIIb periods. These dry conditions might reflect the cooling event noted in North America (Residual Laurentide Ice Sheet) from 6500 to 5900 cal BP.
6. Acknowledgements
91We are very grateful to Bernard Owens (Nottingham) who improved the language of our manuscript and for his constructive remarks. We also thank the referee, Freddy Damblon (Brussels) for his detailed remarks and comments. We are grateful also to Marcela Mezzatesta-Giraldo for her technical assistance.
7. References
92Allan, M., Le Roux, G., Piotrowska, N., Beghin, J., Javaux, E., Court-Picon, M., Mattielli, N., Verheyden, S. & Fagel, N., 2013. Mid- and late Holocene dust deposition in Western Europe: the Misten peat bog (Hautes Fagnes – Belgium). Climate of the Past, 9, 2285–2298. https://doi.org/10.5194/cp-9-2285-2013
93Amesbury, M.J., Swindles, G.Y., Bobrov, A., Charman, J., Holden, J., Lamentowicz, M., Mallon, G., Mazei, Y., Mitchell, E.A.D., Payne, R.J., Roland, T.P., Turner, T.E. & Warner, B.G., 2016. Development of a new pan-European testate amoeba transfer function for reconstructing peatland palaeohydrology. Quaternary Science Reviews, 152, 132–151. https://doi.org/10.1016/j.quascirev.2016.09.024
94Beisel, J-N., Usseglio-Polatera, P., Bachmann, V. & Moreteau, J.C., 2003. A comparative analysis of evenness index sensitivity. Hydrobiology, 88, 1, 3–15. https://doi.org/10.1002/iroh.200390004
95Belokopytov, I. E. & Veresnevich, V. V., 1955. Giktorf’s peat borers, Torfânaâ promyslennost’, 8, 9–10.
96Beug, H.-J., 2004. Leitfaden der Pollenbestimmung für Mitteleuropa und angrenzende Gebiet. Friedrich Pfeil, München, 452 p.
97Blaauw, M. & Christen, J. A., 2011. Flexible paleoclimate age-depth models using an autoregressive gamma process. Bayesian Analysis, 6, 457–474. https://doi.org/10.1214/11-BA618
98Booth, R.K., Lamentowicz, M. & Charman, D.J., 2010. Preparation and analysis of testate amoebae in peatland palaeoenvironmental studies. Mires and Peat, 7, 1–7.
99Bout-Roumazeilles, V., Combourieu-Nebout, N., Desprat, S., Siani, G., Turon, J.-L. & Essallami, L., 2013. Tracking atmospheric and riverine terrigenous supplies variability during the last glacial and the Holocene in central Mediterranean, Climate of the Past, 9, 1065–1087. https://doi.org/10.5194/cp-9-1065-2013
100Bronk Ramsey, C., 2009. Bayesian analysis of radiocarbon dates. Radiocarbon, 51, 337–360. https://doi.org/10.1017/S0033822200033865
101Charman, D.J., 1997. Modelling hydrological relationships of testate amoebae (Protozoa: Rhizopoda) of New Zealand peatlands. Journal of the Royal Society of New Zealand, 27, 465–483. https://doi.org/10.1080/03014223.1997.9517549
102Charman, D.J., Hendon, D. & Woodland, W.A., 2000. The identification of testate amoebae (Protozoa: Rhizopoda) in peats. Quaternary Research Association, London, Technical Guide no. 9, 147 p.
103Charman, D.J., Blundell, A. & ACCROTELM members, 2007. A new European testate amoebae transfer function for palaeohydrological reconstruction on ombrotrophic peatlands. Journal of Quaternary Science, 22, 209–221. https://doi.org/10.1002/jqs.1026
104Claussen, M., Kubatzki, C., Brovkin, V., Ganopolski, A., Hoelzmann, P. & Pachur, H. J., 1999. Simulation of an abrupt change in Saharan vegetation in the mid-Holocene. Geophysical Research Letters, 26, 2037–2040. https://doi.org/10.1029/1999GL900494
105Damblon, F., 1978. Etudes paléo-écologiques des tourbières en Haute Ardenne. Ministère de l’Agriculture, Administration des Eaux et Forêts, Service de la Conservation de la Nature, 10, 126 p.
106Damblon, F., 1994. Les dépôts tourbeux et l’histoire de la végétation sur le plateau des Hautes-Fagnes (Belgique), Annales de la Société géologique de Belgique, 117, 259–276.
107Davis, B.A.S., Brewer, S., Stevenson, A.C., Guit, J. and Data Contributors, 2003. The temperature of Europe during the Holocene reconstructed from pollen data. Quaternary Science Reviews, 22, 1701–1716. https://doi.org/10.1016/S0277-3791(03)00173-2
108De Menocal, P., Ortiz, J., Guilderson, T., Adkins, J., Sarnthein, M., Baker, L. & Yarusinsky, M., 2000. Abrupt onset and termination of the African Humid Period: Rapid climate responses to gradual insolation forcing. Quaternary Science Reviews, 19, 347–361. https://doi.org/10.1016/S0277-3791(99)00081-5
109Dricot, E.-M., 1960. Recherches palynologiques sur le plateau des Hautes- Fagnes. Bulletin de la Société Royale de Botanique de Belgique, 92, 157–196.
110Faegri, K. & Iversen, J., 1989. Textbook of pollen analysis. Wiley, Chichester, 328 p.
111Frankard, P., Ghiette, P., Hindryckx, M-N., Schumacker, R. & Wastiaux, C., 1998. Peatlands of Wallony (S-Belgium). Suoseura, 49, 33–47.
112Giesecke, T., Hickler, T., Kunkel, T., Sykes, M.T. & Bradshaw, R.H.W., 2007. Towards an understanding of the Holocene distribution of Fagus sylvatica L. Journal of Biogeography, 34, 1, 118–131. https://doi.org/10.1111/j.1365-2699.2006.01580.x
113Grimm, E.C., 1987. CONISS: A fortran 77 program for stratigraphically constrained cluster analysis by the method of incremental sum of squares. Computers & Geosciences, 13, 13–35. https://doi.org/10.1016/0098-3004(87)90022-7
114Grimm, E.C., 1990. TILIA and TILIA GRAPH PC spreadsheet and graphics software for pollen data. INQUA commission for study of the Holocene. Sub-commission on data-handling methods. Newsletter, 4, 5–7.
115Hannon, G.E., Bradshaw, R. & Emborg, J., 2000. 6000 years of forest dynamics in Suserup Skov, a seminatural Danish woodland. Global Ecology and Biogeography, 9, 101–114. https://doi.org/10.1046/j.1365-2699.2000.00145.x
116Iversen, J., 1973. The development of Denmark's nature since the last glacial. Danmarks geologiske Undersoegelse, Raekke V, 7-C, 1–126.
117Johnsen, S.J., Dahl-Jensen, D., Gundestrup, N., Steffensen, J.P.,Clausen, H.B., Miller, H., Masson-Delmotte, V., Sveinbjörnsdottir, A.E. & White, J., 2001. Oxygen isotope and palaeotemperature records from six Greenland ice-core stations: Camp Century, Dye-3, GRIP, GISP2, Renland and NorthGRI. Journal of Quaternary Science, 16, 299–307. https://doi.org/10.1002/jqs.622
118Kamran, K, Court-Picon, M., Gerrienne, P. & Streel, M., 2016. Misten peat Bog: High resolution palynological record (Poster). MVP-PPMB meeting-Liège, December 21, 2016. Miscellanea palaeontologica 2016, Program and Abstract, p. 11, 12.
119Lamentowicz, M., Obremska, M. & Mitchell, E.A.D., 2008. Autogenic succession, land-use change, and climatic influences on the Holocene development of a kettle hole mire in Northern Poland. Review of Palaeobotany and Palynoloy, 151, 21–40. https://doi.org/10.1016/j.revpalbo.2008.01.009
120Litt, T., Schölzel, C., Kühl, N. & Brauer, A., 2009. Vegetation and climate history in the Westeifel Volcanic Field (Germany) during the past 11 000 years based on annually laminated lacustrine maar sediments. Boreas, 38, 679–690. https://doi.org/10.1111/j.1502-3885.2009.00096.x
121Magny, M., 2004. Holocene climatic variability as reflected by mid-European lake-level fluctuations, and its probable impact on prehistoric human settlements. Quaternary International, 113, 65–79. https://doi.org/10.1016/S1040-6182(03)00080-6
122Mayewski, P.A., Rohling, E.E., Stager, J.C., Karlen, W., Maasch, K.A., Meeker, L.D., Meyerson, E.A., Gasse, F., van Kreveld, S., Holmgren, K., Lee-Thorp, J., Rosqvist, G. Rack, F., Staubwasser, M., Schneider, R.R. & Steig, E.J., 2004. Holocene climate variability. Quaternary Research, 62, 243–255. https://doi.org/10.1016/j.yqres.2004.07.001
123Moore, P.D., Webb, J.A. & Collinson, M.E., 1991. Pollen Analysis. Blackwell Scientific Publications, Oxford, 216 p.
124Overbeck, F. & Schneider, S., 1938. Mooruntersuchungen bei Lüneburg und bei Bremen und die Reliktnatur von Betula nana in Nordwestdeutschland. Zeitschrift für Botanik, 33, 1–54.
125Paillet, M., 2016. Etude paléopalynologique de la tourbière haute active du Rurhof (Hautes-Fagnes, Belgique). Unpublished Bachelor thesis. Haute école de la province de Liège, La Reid, Belgium, 90 p.
126Payne, R.J. & Mitchell, E.A.D., 2009. How many is enough? Determining optimal count totals for ecological and palaeoecological studies of testate amoebae, Journal of Paleolimnology, 42, 483–495. https://doi.org/10.1007/s10933-008-9299-y
127Peglar, S.M., 1993. The mid-Holocene Ulmus decline at Diss Mere, Norkfolk, UK: a year-by-year pollen stratigraphy from annual laminations. Holocene, 3, 1–13. https://doi.org/10.1177/095968369300300101
128Peglar, S.M. & Birks H.J.B., 1993. The mid-Holocene Ulmus fall at Diss Mere, south-east England disease and human impact? Vegetation History and Archaeobotany, 2, 61–68. https://doi.org/10.1007/BF00202183
129Persch, F., 1950. Zur postglazialen Wald-und Moorentwicklung im Hohen Venn. Decheniana, 104, 81–93.
130Piotrowska, N., 2013. Status report of AMS sample preparation laboratory at GADAM Centre, Gliwice, Poland. Nuclear Instruments and Methods in Physics Research Section B: Beam Interactions with Materials and Atoms, 294, 176–181. https://doi.org/10.1016/j.nimb.2012.05.017
131Piotrowska, N., Blaauw, M., Mauquoy, D. & Chambers, F.M., 2011. Constructing deposition chronologies for peat deposits using radiocarbon dating. Mires and Peat, 7/10, 1-14.
132Reille, M., 1992. Pollen et Spores d’Europe et d’Afrique du Nord. Laboratoire de botanique historique et de palynologie, Marseille, 520 p.
133Reille, M., 1995. Pollen et Spores d’Europe et d’Afrique du Nord. Supplément 1. Laboratoire de botanique historique et palynologie, Marseille, 327p.
134Reille, M., 1998. Pollen et Spores d’Europe et d’Afrique du Nord. Supplément 2. Laboratoire de botanique historique et palynologie, Marseille, 521p.
135Reimer, P.J., Baillie, M.G.L., Bard, E., Bayliss, A., Beck, J.W., Blackwell, P.G., Bronk Ramsey, C., Buck, C.E., Burr, G.S., Edwards, R.L., Friedrich, M., Grootes, P.M., Guilderson, T.P., Hajdas, I., Heaton, T.J., Hogg, A.G., Hughen, K.A., Kaiser, K.F., Kromer, B., McCormac, F.G., Manning, S.W., Reimer, R.W., Richards, D.A., Southon, J.R., Talamo, S., Turney, C.S.M., van der Plicht, J. & Weyhenmeyer, C.E., 2009. IntCal09 and Marine09 radiocarbon age calibration curves, 0–50000 years cal BP. Radiocarbon, 51/4, 1111–1150. https://doi.org/10.1017/S0033822200034202
136Reimer, P.J., Bard, E., Bayliss, A., Beck, J.W., Blackwell, P.G., Bronk Ramsey, C., Buck, C.E., Cheng, H., Edwards, R.L., Friedrich, M., Grootes, P.M., Guilderson, T.P., Haflidason, H., Hajdas, I., Hatté, C., Heaton, T.J., Hoffmann, D.L., Hogg, A.G., Hughen, K.A., Kaiser, K.F., Kromer, B., Manning, S.W., Niu, M., Reimer, R.W., Richards, D.A., Scott, E.M., Southon, J.R., Staff, R.A., Turney, C.S.M., van der Plicht, J, 2013. IntCal13 and Marine13 radiocarbon age calibration curves, 0-50.000 years cal BP. Radiocarbon, 55/4, 1869–1887. https://doi.org/10.2458/azu_js_rc.55.16947
137Salpeteur, T., 2011. Reconstitution de la transition minérotrophie-ombrotrophie de la tourbière du Misten (Hautes-Fagnes belges): approche géochimique et biologique. Unpublished Master thesis. University of Liège, Belgium, 90 p.
138Schmidt, P.A., 1995. Übersicht der natürlichen Waldgesellschaften Deutschlands. Schriftenreihe der Sächsischen Landesanstalt für Forsten, 4/95, 95 p.
139Schwickerath, M., 1937. Die nacheiszeitliche Waldgeschichte des Hohen Venns und ihre Beziehung zur heutigen Vennvegetation. Abhandlungen der Preussischen Geologischen Landesanstalt, Neue Folge, 184, 7–31.
140Shannon, C.E. & Weaver, W., 1963. The Mathematical Theory of Communication. University of Illinois Press, Urbana, 125 p.
141Sillasoo, U., Mauquoy, D., Blundell, A., Charman, D., Blaauw, M., Daniell, J.R.G., Toms, P., Newberry, J., Chambers, F.M. & Karofeld, E., 2007. Peat multi-proxy data from Männikjärve bog as indicators of Late Holocene climate changes in Estonia. Boreas, 36, 20–37. https://doi.org/10.1111/j.1502-3885.2007.tb01177.x
142Smith, B. & Wilson, J.B., 1996. A consumer's guide to evenness indices. Oikos, 76, 1, 70–82.
143Streel, M., 1959. Etude phytosociologique de la fagne Wallonne et de la fagne de Cléfay (structure et évolution des associations végétales à sphaignes dans les Hautes-Fagnes de Belgique). Académie Royale de Belgique, Classe des Sciences, Mémoires in 8°, 31/1, 108 p.
144Streel, M., Beghin, J., Gerrienne, P., Hindrickx, M-N., Luthers, C., Court-Picon, M., Frankard, P., Allan, M. & Fagel, N., 2014. Late Subatlantic history of the ombrotrophic Misten Bog (Eastern Belgium) basedon high resolution pollen, testate amoebae and macrofossil analysis. Geologica Belgica, 17/2,148–160.
145Troels-Smith J., 1960. Ivy, mistletoe and elm: climatic indicators- fodder plants. Danmarks geologiske Undersoegelse, Raekke IV, 4, 1–32.
146Turner, J., 1962. The Tilia decline: an anthropogenic interpretation. New Phytologist, 61, 328–341. https://doi.org/10.1111/j.1469-8137.1962.tb06304.x
147Wanner, H., Solomina, O., Grosjean, M., Ritz, S.P. & Jetel, M., 2011. Structure and origin of Holocene cold events. Quaternary Science Reviews, 30, 3109–3123. https://doi.org/10.1016/j.quascirev.2011.07.010
148Wardenaar, E., 1987. A new hand tool for cutting peat profiles. Revue canadienne de botanique, 65, 1772–1773. https://doi.org/10.1139/b87-243
149Wastiaux, C., 2002. Topographie de surface et de sub-surface des zones tourbeuses des réserves naturelles domaniales des Hautes-Fagnes : Rapport de synthèse, Convention C60 entre le Ministère de la Région Wallonne, Direction générale des Ressources naturelles etde l’Environnement, et l’Université de Liège. Unpublished report. Ministère de la Région Wallonne, Namur, 52 p.
150Wastiaux, C., Halleux, L., Schumacker, R., Streel, M. & Jacqmotte, J-M., 2000. Development of the Hautes-Fagnes peat bogs (Belgium): new perspectives using ground-penetrating radar. Suoseura, 51, 115–120.
151Manuscript received 17.11.2017, accepted in revised form 14.05.2018, available on line 10.08.2018.
