


- Accueil
- Volume 28 (2025)
- number 1-2
- The 1965–1970 seismic episode in the Hainaut coal basin (Belgium): a key period to analyse the triggered nature of a century-long seismic activity


Visualisation(s): 1523 (36 ULiège)
Téléchargement(s): 1380 (33 ULiège)

The 1965–1970 seismic episode in the Hainaut coal basin (Belgium): a key period to analyse the triggered nature of a century-long seismic activity

Document(s) associé(s)
Annexes
Abstract
Damaging earthquakes happened in the Hainaut coal basin (Belgium) in the 19th and 20th centuries but stopped after coal mining. We relocated 54 Hainaut earthquakes of the period 1965 and 1985 by using regional and local seismic phase measurements from recordings in and around Belgium. These new results finalise the Hainaut earthquake catalogue, derived from macroseismic data for the 1887–1965 period and instrumental records after 1965. This updated database allows us to discuss the origin of this intriguing seismicity. Computed focal depths show that the strongest earthquakes before 1985 occurred inside the Upper Palaeozoic part of the Brabant Parautochton, probably below the deepest parts of the coal mines. The shallowness of this seismicity, its spatial link with the coal basin, the compressive to strike-slip focal mechanisms of the stronger earthquakes between 1965 and 1985 and the large quantity of coal mass removal all match with worldwide observations of mining-triggered earthquakes. The earthquake mechanisms agree with the local, compressive to transpressive stress regime derived from differences in upper crustal density and topography that make the Hainaut area more sensitive to fault reactivation at shallow depths, as observed in similar tectonic settings elsewhere in the world.
Table des matières
1. Introduction
1Since seismic activity in stable plate interiors is episodic, known seismicity in many areas occurred before the installation of modern seismic networks. This challenges earthquake source parameter determination and seismotectonic analyses. This is the case for the Hainaut coal mining area in Belgium where significant earthquake activity for Western Europe occurred from the end of the 19th century until the beginning of the 1980s, before the installation of a dense modern digital monitoring seismic network in 1985 (Camelbeeck et al., 1990). From 1887 to 1985, five shallow Moment Magnitude (Mw) 4.0 earthquakes caused moderate to severe damage to buildings corresponding to maximum intensity VII on the European Macroseismic Scale 1998 (EMS-98). In this period, people experienced 111 other felt events, some of them producing slight damage (Camelbeeck et al., 2022). Since 1985, seismicity has strongly decreased and only three Mw < 3.0 earthquakes, that occurred in 1987, were locally felt (Camelbeeck, 1988). Events with Mw > 2.0 were no longer recorded during the last 20 years. Most of the seismicity in Hainaut occurred inside the coal mining area. However, two significant earthquakes with magnitudes Mw 3.9 and 4.1 occurred just outside the surface limits of the Hainaut coal area, respectively on 24 October 1976 near Givry south of the coal basin, and on 20 June 1995 near Le Roeulx to the north of the basin (Fig. 1).
Figure 1. Seismic activity in the Hainaut coal mining area mapped for the different phases of seismic monitoring in Belgium. A. Location of the study area with indication of existing Belgian seismic stations (DOU, Dourbes; UCC, Uccle; WRM, Warmifontaine) and the nearest stations abroad (HEE, Heerlen; ENN, Epen; KLL, Kalborn; STB, Steinbach; WLF, Walfordange), (partially) in operation between 1965 and 1985. The location of the master events (in blue) considered in our study to relocate Hainaut earthquakes between 1965 and 1985 are reported. Black box: location of the main study area. B. 1965–1985 earthquakes computed and studied in this work. H1 and H9 refer to 1979 Hainaut seismic refraction profiles (Dejonghe et al., 1992). C. 1887–1965 seismicity during which only the UCC seismic station was working since 1898. Earthquake source parameters of this period were mainly determined with macroseismic data (Camelbeeck et al., 2022). D. 1985–2022 seismicity monitored by the modern seismic network.
2Mining in the Hainaut coal basin was distributed in three different administrative districts, here further referred to as the Borinage–Mons (Dupont, 2021), Centre–La Louvière and Charleroi basins, which is described in detail in Delmer (1977, 2004, 2013). The deepest mines were in the Charleroi Basin up to a depth of 1050 m (M. Dusar, pers. comm., 2023).
3Most Hainaut earthquakes are associated in time with more intensive mining periods in the 19th and 20th centuries. The origin of this seismicity remains controversial (Descamps, 2009; Troch, 2018; Camelbeeck et al., 2022) while the possible link between mining and seismicity became topical again with the need to update hazard maps for the Eurocode-8 building code and the security of SEVESO industries, and with the development of deep geothermal projects in Belgium (e.g. Licour, 2014).
4As there is no unique definition in scientific literature, “induced earthquakes” and “triggered earthquakes” are defined as follows in this paper:
-
induced seismic activity refers to seismic events occurring inside the excavated volume, that are limited in depth and closely related in time to the industrial activity;
-
triggered seismicity is related to crustal stress changes caused by mining and can occur at larger depths, at distances away from the mines, and can be delayed in time.
5These definitions correspond to the two types of earthquakes related to mining defined by Gibowicz & Kijko (1994).
6The most important episode of activity in Hainaut occurred between December 1965 and 1970, at the end of the intense coal mining and before the capability to determine reliable earthquake epicentres and focal depths from Belgian seismic stations. This seismic episode was recorded by numerous historical stations in Belgium, the United Kingdom, The Netherlands, Germany, and France but especially by the sensitive large aperture seismic network running in France since 1963 and maintained by the Geophysical and Detection Laboratory of the French Alternative Energies and Atomic Energy Commission (CEA-LDG; Massinon & Plantet, 1976). This dataset has never been fully exploited to better localise this earthquake activity, analyse the earthquake mechanisms, and better understand its causes.
7In this study, we first present an overview of this strong seismic episode in Hainaut between 1965 and 1970. Secondly, we developed a multiple event location method to improve the single location quality given by Camelbeeck (1985, 1993) for 21 earthquakes of the Hainaut 1965–1970 seismic episode and the five other earthquakes that occurred up to 1985. We analyse the reliability of the epicentres, focal depths, and fault plane solutions, as well as the location of 28 smaller earthquakes that were only recorded by the Belgian seismic stations of Dourbes (DOU) and Uccle (UCC). Thirdly, we compare the spatial and temporal distribution of this 1965–1985 seismicity with the activity before 1965 and between 1985 and 2022 (Fig. 1). Finally, we discuss the origin of the Hainaut seismicity and its link to mining by analysing its geological and tectonic context and considering the spatial and temporal characteristics of the former coal mining activity, and the local stresses generated by spatial variation of density in the crust and topography.
2. The seismic episode in the Hainaut coal mining area between 1965 and 1970
2.1. The sequence of earthquakes
8Between December 1965 and December 1970, the Centre–La Louvière and the Charleroi basins of the Hainaut coal mining area suffered from an unusual seismic activity for our regions with four damaging and several other well-felt earthquakes (Fig. 1). These earthquakes were followed by sequences of smaller events, part of them also being felt by local populations. We identified 127 events based on the recordings at the Belgian seismic station of Dourbes (DOU), which was working without significant interruptions during the whole considered period and already equipped at this time with 3-components sensitive seismometers (Fig. 2). The 1965 and 1966 DOU seismic bulletins only report arrival time measurements of seismic phases but without event location or event type (i.e. natural earthquake, quarry blast or other event associated with human activities). Fortunately, Van Gils (1966) provided a list of 27 earthquakes that occurred between the strong earthquake of 16 January 1966 and 11 March 1966. We completed this list up to the end of 1966, by adding events from the DOU bulletins if their seismic arrival time occurred before 7 h and after 17 h UTC and if the measured P- and S-wave arrival time difference at DOU was like the ones observed for the largest Hainaut events of this episode of activity. After all, most events reported during the daytime are associated with blasts in the numerous quarries of southern Belgium. From 1 January 1967 onwards, the DOU seismic bulletins changed and from then they clearly reported if an event was an earthquake that occurred in Hainaut.
Figure 2. The 1965–1970 Hainaut seismic episode. Monthly number of earthquakes in the Hainaut area recorded by the Dourbes (DOU) seismic station.
9Amongst a total of 127 earthquakes identified in the Hainaut area during the period December 1965–December 1970, 21 were reported by seismic stations outside Belgium, while 28 were only measured at the DOU and UCC Belgian stations. We provide in this study a location for these 49 earthquakes. The 78 remaining events in our list were only recorded by the DOU seismic station and cannot be located, except for four events (identified by ‘M’ in Table 1) that were large enough to be felt and for which macroseismic data was used to locate them (Camelbeeck et al., 2022).
10Camelbeeck et al. (2022) determined moment magnitude (Mw) for 26 earthquakes between 1965 and 1985 (Table 1) that were recorded by European seismic stations. For events 8 and 9 in Table 1, Mw was estimated from epicentral intensity (Camelbeeck et al., 2022). For events 5, 10, 15, 31, 32, 33 and 42, Mw was estimated from local magnitude (ML) determined by Camelbeeck (1985) using amplitude measurements on the original seismograms and the conversion law presented in Camelbeeck et al. (2022). Unfortunately, amplitude information is not available for the 19 other events of the list and the 59 of the 127 events that were only recorded at the DOU seismic station. Since original seismograms are no longer available to evaluate ground motion amplitudes for these events, the magnitude was estimated by considering that it could be related to the presence or absence of S- and P-waves arrival times measurements in the seismic bulletins of DOU, UCC and Warmifontaine (WRM). We established a relationship using the earthquakes of this period for which Camelbeeck (1985, 1993) evaluated the magnitude from original seismograms. We concluded that if the seismic bulletins mention seismic phase measurements at the three stations, Mw would be around 3.2. If P- and S-wave arrival times are reported at UCC, Mw is reported to be 3.0, whereas if only the S-wave arrival time is indicated, Mw = 2.8. For the events that are only reported in DOU, Mw would be less than 2.5.
11The main conclusion of this analysis is that three earthquakes of the seismic episode had a magnitude Mw greater or equal to 4.0, seven other events had an Mw in the range 3.5–3.9, 48 events had a magnitude between 2.5 and 3.4, and the 63 remaining ones had a magnitude less than 2.5 (Fig. 2).
Table 1. Relocated Hainaut earthquakes between 1965 and 1985. *Relative location using regional seismic phases. M: event identified based on macroseismic data (Camelbeeck et al., 2022). Q: location quality of earthquake using relative locations. [0]: relative location using DOU and UCC data—nearest master event a distance larger than 4 km. [n≥1]: relative location using DOU and UCC data—number of master event(s) used at less than 4 km. Earthquake times here and in the text are mentioned in UTC. Zloc: focal depth, with 1σ uncertainty in brackets, computed relatively to two reference events (ref1 and ref2). Zm: focal depth, with 1σ uncertainty in brackets, from macroseismic data (Camelbeeck et al., 2022). Ert, ery, erx are the 1σ uncertainties on the origin time, latitude (lat) and longitude (lon), respectively. Mw = Moment Magnitude.
|
N° |
Q |
D M YEAR.h m sec |
ert (s) |
LAT°N |
ery (km) |
LON°E |
erx (km) |
Zloc (km) |
Zm (km) |
Mw |
|
01* |
A |
15 12 1965 12 07 14.96 |
0.41 |
50.446 |
1.4 |
4.094 |
1.1 |
ref1 |
2.7(0.8) |
4 |
|
02* |
C |
15 12 1965 13 42 01.36 |
0.26 |
50.443 |
1.5 |
4.103 |
1.9 |
2.3(5.0) |
2.6 |
|
|
03* |
A |
15 12 1965 14 02 14.08 |
0.29 |
50.467 |
1.4 |
4.128 |
1 |
3.3(3.3) |
3.3 |
|
|
04* |
A |
15 12 1965 15 16 34.96 |
1.13 |
50.436 |
1.7 |
4.066 |
1.8 |
3.6(3.4) |
2.9 |
|
|
5 |
[2] |
16 01 1966 00 13 20.7 |
0.2 |
50.476 |
6.2 |
4.349 |
3.7 |
2.6(1.4) |
2.9 |
|
|
06* |
A |
16 01 1966 06 51 34.78 |
0.88 |
50.455 |
1.5 |
4.274 |
1.2 |
3.6(3.4) |
3.3(1.6) |
3.5 |
|
07* |
A |
16 01 1966 12 32 50.53 |
0.68 |
50.466 |
1.4 |
4.293 |
1.1 |
4.9(2.4) |
2.1(0.9) |
4 |
|
8 |
[2] |
17 01 1966 17 04 16.2 |
0.1 |
50.421 |
2.8 |
4.209 |
5.7 |
2.8 |
||
|
9 |
[3] |
17 01 1966 20 29 00.0 |
0.1 |
50.462 |
2.8 |
4.248 |
3.5 |
2.8 |
||
|
10 |
[0] |
24 01 1966 22 13 21.0 |
0.5 |
50.391 |
3.4 |
4.313 |
4.7 |
2.9 |
||
|
M |
03 02 1966 06 50 48 |
50.46 |
4.26 |
3.1 |
||||||
|
11* |
B |
11 03 1966 04 09 32.63 |
0.21 |
50.449 |
1.8 |
4.345 |
1.9 |
3.2 |
||
|
12 |
[4] |
12 03 1966 13 42 09.8 |
0.1 |
50.484 |
4 |
4.321 |
3.9 |
3.2 |
||
|
13 |
[0] |
14 03 1966 05 20 25.2 |
0.5 |
50.34 |
14 |
4.28 |
2 |
3 |
||
|
14* |
C |
16 03 1966 01 21 30.94 |
0.22 |
50.428 |
2 |
4.246 |
2.7 |
3 |
||
|
15 |
[0] |
17 03 1966 18 17 08.5 |
0.5 |
50.445 |
6.8 |
4.258 |
9.2 |
3 |
||
|
16 |
[1] |
19 03 1966 06 28 47.5 |
0.5 |
50.437 |
1.3 |
4.29 |
1.5 |
3 |
||
|
17* |
B |
20 03 1966 00 08 15.38 |
0.47 |
50.457 |
1.4 |
4.368 |
1.3 |
3.5 |
||
|
18 |
[3] |
21 03 1966 17 24 18.2 |
0.1 |
50.457 |
1.9 |
4.239 |
4.7 |
2.5 |
||
|
M |
22 03 1966 00 20 32 |
50.46 |
4.33 |
2.5 |
||||||
|
19 |
[2] |
08 04 1966 16 07 57.0 |
0.2 |
50.458 |
2.9 |
4.344 |
6.6 |
2.5 |
||
|
20 |
[1] |
21 04 1966 18 38 45.1 |
0.5 |
50.448 |
2 |
4.271 |
1.4 |
2.5 |
||
|
21 |
[4] |
05 05 1966 03 01 32.1 |
0.2 |
50.477 |
4.7 |
4.292 |
2.6 |
3 |
||
|
22 |
[3] |
05 05 1966 11 16 33.8 |
0.2 |
50.503 |
5.3 |
4.408 |
13.5 |
2.5 |
||
|
23 |
[2] |
21 09 1966 23 47 53.6 |
0.7 |
50.451 |
4 |
4.246 |
5 |
2.5 |
||
|
24 |
[4] |
22 09 1966 09 57 54.9 |
0.5 |
50.46 |
2.9 |
4.251 |
7.4 |
2.5 |
||
|
25 |
[0] |
03 10 1966 19 57 15.5 |
0.5 |
50.519 |
6.4 |
4.269 |
3 |
2.5 |
||
|
26 |
[0] |
31 10 1966 16 33 14.9 |
0.5 |
50.425 |
1.2 |
4.246 |
12.8 |
3 |
||
|
27* |
A |
28 03 1967 15 49 24.56 |
0.65 |
50.448 |
1.2 |
4.269 |
1.1 |
0.0(2.1) |
3.0(1.0) |
4.1 |
|
M |
04 04 1967 11 16 26 |
50.46 |
4.28 |
2.8 |
||||||
|
28* |
A |
04 04 1967 18 04 48.34 |
0.62 |
50.466 |
1.5 |
4.252 |
1.2 |
0.0(1.8) |
3.3 |
|
|
29 |
[1] |
04 04 1967 21 00 51.8 |
0.5 |
50.463 |
0.4 |
4.263 |
0.8 |
2.5 |
||
|
30 |
[4] |
04 04 1967 21 56 38.0 |
0.1 |
50.481 |
4.4 |
4.333 |
4.5 |
2.5 |
||
|
31 |
[4] |
08 04 1967 13 02 05.8 |
0.1 |
50.492 |
4 |
4.333 |
3.9 |
2.6 |
||
|
32 |
[5] |
09 04 1967 04 53 49.0 |
0.8 |
50.443 |
6 |
4.214 |
11 |
2.9 |
||
|
33 |
[5] |
14 04 1967 14 27 41.5 |
0.8 |
50.448 |
4.4 |
4.228 |
7 |
2.6 |
||
|
34 |
[1] |
16 04 1967 14 49 35.1 |
0.5 |
50.479 |
1.4 |
4.279 |
1.9 |
2.5 |
||
|
35 |
[0] |
04 06 1967 07 31 08.6 |
0.5 |
50.406 |
4.6 |
4.221 |
3.4 |
2.5 |
||
|
36 |
[0] |
07 08 1967 01 44 49.3 |
0.5 |
50.397 |
7.6 |
4.235 |
1.2 |
2.5 |
||
|
37* |
A |
12 08 1968 07 26 41.53 |
0.23 |
50.466 |
1.5 |
4.23 |
1.5 |
2.7(4.5) |
2.3(1.0) |
3.6 |
|
38 |
[2] |
13 08 1968 13 11 44.6 |
0.7 |
50.453 |
2.5 |
4.249 |
5 |
2.5 |
||
|
39* |
B |
13 08 1968 16 17 28.28 |
0.47 |
50.461 |
1.5 |
4.193 |
1.8 |
2.7(6.1) |
3.6 |
|
|
40* |
C |
13 08 1968 16 40 41.80 |
0.25 |
50.478 |
1.5 |
4.263 |
1.4 |
3 |
||
|
41* |
A |
13 08 1968 16 57 14.54 |
0.26 |
50.461 |
1.5 |
4.226 |
1.2 |
6.4(3.4) |
2.3(0.8) |
3.9 |
|
42 |
[2] |
13 08 1968 19 21 13.0 |
0.5 |
50.457 |
1.5 |
4.27 |
5 |
3 |
||
|
43 |
[3] |
16 08 1968 18 35 03.4 |
0.5 |
50.47 |
1.4 |
4.276 |
5.3 |
2.5 |
||
|
44* |
B |
23 09 1968 04 08 12.59 |
0.23 |
50.453 |
1.5 |
4.302 |
1.3 |
5.2(4.4) |
2.8(1.7) |
3.2 |
|
45* |
B |
23 09 1968 05 47 16.22 |
0.24 |
50.44 |
1.6 |
4.303 |
1.6 |
6.5(4.6) |
2.4(1.1) |
3 |
|
46* |
B |
16 01 1970 23 34 58.35 |
0.46 |
50.361 |
1.4 |
4.306 |
1.2 |
3.1 |
||
|
47* |
A |
03 11 1970 08 45 59.01 |
0.31 |
50.383 |
1.4 |
4.388 |
1.2 |
ref2 |
2.3(1.0) |
3.6 |
|
48* |
C |
03 11 1970 12 07 33.72 |
0.19 |
50.367 |
1.7 |
4.326 |
1.4 |
3.1 |
||
|
49* |
B |
20 12 1970 13 48 33.49 |
0.23 |
50.444 |
1.5 |
4.207 |
1.2 |
2.0(3.1) |
3.3 |
|
|
50* |
A |
24 10 1976 20 33 26.99 |
0.42 |
50.358 |
1.4 |
3.983 |
1.2 |
0.0(4.1) |
5.5(1.7) |
3.9 |
|
51* |
A |
14 09 1982 19 24 34.60 |
0.2 |
50.43 |
1.4 |
4.288 |
1.2 |
4.9(3.6) |
3.5(1.6) |
3.4 |
|
52* |
C |
14 09 1982 19 29 08.32 |
none |
50.402 |
1.5 |
4.095 |
1.7 |
2.9 |
||
|
53* |
B |
04 08 1983 07 08 24.71 |
0.22 |
50.417 |
2 |
4.45 |
1.6 |
1.6(5.4) |
3.2 |
|
|
54* |
B |
09 08 1983 01 32 34.80 |
0.37 |
50.437 |
1.9 |
4.442 |
1.2 |
1.8(5.0) |
3.3 |
2.2. Description of the main earthquakes of the 1965–1970 episode
12The 1965–1970 seismic episode began on 15 December 1965 at 12h07m with a violent Mw = 4.0 earthquake that caused a considerable commotion in the region west of the city of La Louvière (Fig. 3). This seismic event caused moderate damage, especially to chimneys and roofs, and to verandas damaged by falling chimneys, particularly in the localities of Bray and Strépy-Bracquegnies where intensity VII was observed (EMS-98 scale—briefly described in the legend of Fig. 3). The official questionnaire of the Royal Observatory of Belgium (ROB) mentions 230 damaged and 122 toppled chimneys in Strépy-Bracquegnies, which corresponds to 10% of the houses in this locality. In the epicentral area, people felt three other lighter tremors on the same day at 13h42m, 14h02m and 15h16m.
Figure 3. Macroseismic maps of the four strongest earthquakes of the 1965–1970 seismic episode in the Hainaut area (Camelbeeck et al., 2022). Each small circle shows the intensity in each locality (EMS-98 macroseismic scale): II = scarcely felt; III = felt indoors by a few people; IV = felt indoors by many people and outdoors by very few, a few people are awakened; V = felt indoors by most, outdoors by few. Many sleeping people awake, hanging objects swing considerably and small objects can be shifted, negligible damage to few buildings; VI = many people are frightened and run outdoors, many houses suffer slight non-structural damage; VII = most people are frightened and run outdoors, furniture is shifted and objects fall from shelves, many well-built ordinary buildings suffer moderate damage including the fall of chimneys, older buildings may show significant damage (Grünthal et al., 1998). Bottom panel shows the location of communes and localities discussed in the text. Geology in the background based upon http://www.onegeology.org/, last access: 1 May 2022.
13One month later, the earth shook again in the localities between La Louvière and Morlanwelz. On 16 January 1966, two earthquakes with magnitudes Mw = 2.9 and 3.5 were felt in the morning, respectively at 0h13m and 6h51m. The second event was strongly felt in Haine-Saint-Pierre with pieces of plaster falling from some ceilings and minor damage to a few chimneys in bad condition (intensity V). These two earthquakes preceded an Mw = 4.0 event that occurred at 12h32m and caused commotion and, in some places, panic among the population. In the localities of Carnières and Morlanwelz, the material damage is quite considerable (intensity VII) (Fig. 3). The shock damaged or toppled around 400 chimneys in Carnières, which corresponds to 14% of their total number in the locality. In Morlanwelz-Mariemont, this percentage is lower but nevertheless reaches 7–8%. These earthquakes were followed by numerous smaller events during the following months.
14One year later, on 28 March 1967, an Mw = 4.1 earthquake was violently felt in the region between La Louvière and Charleroi. In some places, the power was cut off abruptly. Some inhabitants rushed out of their homes, frightened, while others sought refuge in their cellars. The most affected localities were Carnières, Morlanwelz-Mariemont and Trazegnies where the percentage of damaged or destroyed chimneys ranges between 8 and 10% (intensity VII) (Fig. 3). Inside many houses, ceilings and walls were cracked. The earthquake was followed by many (felt) aftershocks up to the end of April 1967.
15The Hainaut area stayed quiet for nearly 1.5 years until another damaging Mw = 3.9 earthquake occurred in the region of La Louvière on 13 August 1968. It was the fourth seismic event of a sequence that began the day before at 7h26m by an Mw = 3.6 earthquake, strongly felt in La Louvière and neighbouring localities. During this event, a few chimneys were damaged in La Louvière, Haine-Saint-Pierre, Haine-Saint-Paul and Morlanwelz-Mariemont (intensity V). On August 13, the first violent shock (Mw = 3.6) occurred at 16h17m, but without evident traces of slight damage (intensity IV-V). A lighter, barely perceptible earthquake occurred at 16h40m (Mw = 3.0), followed at 16h57m by the most important, stronger, and damaging earthquake of this sequence (Fig. 3). It directly affected the region of La Louvière, Haine-Saint-Pierre and Haine-Saint-Paul, which is the most inhabited part of the area. In those localities, there was a moment of panic at the time of the tremor. A few hundred chimneys fell everywhere, but fortunately there were no injuries (intensity VI). These earthquakes were followed by smaller shocks over the next two months. Two of them on 23 September at 4h08m (Mw = 3.0) and 5h47m (Mw = 2.9) were well perceived by the population.
16Detailed information about the damage and effects of these largest felt events can be found in the synthesis on the impact of the seismic activity in Hainaut between 1877 and 1985 published by Camelbeeck et al. (2022).
17The region calmed down up to 16 January 1970 when an Mw = 3.1 earthquake was felt in the region of Fontaine-l’Evêque, closer to Charleroi. On 3 November 1970, an Mw = 3.6 slightly damaging earthquake occurred south of Charleroi in the cities of Dampremy, Marchienne-au-Pont, Marcinelle, Monceau-sur-Sambre et Mont-sur-Marchienne (intensity V). It was followed the same day by an aftershock at 12h08m. The 1965–1970 seismic episode ended with an Mw = 3.3 earthquake that was felt in La Louvière on 20 December 1970. There were no more earthquakes reported in the Hainaut coal basin up to 14 September 1982.
2.3. Previous investigations on the 1965–1970 seismic episode
18Few studies investigated this 1965–1970 earthquake activity. Van Gils (1966) published isoseismal maps of the first damaging earthquakes on 15 December 1965 and 16 January 1966 and provided a list of aftershocks up to 11 March 1966. Ahorner (1972) gave a brief description of the largest events that were recorded at the Bensberg seismic station near Cologne and showed fault-plane solutions for the three largest events (on 15 December 1965 12h07m, 16 January 1966 12h32m and 28 March 1967 15h49m). Camelbeeck (1993) located 18 events that occurred between 1965 and the end of 1970 and 5 earthquakes between 1971 and 1985 with ML ≥ 2.8 by using seismic phase arrival times at European seismic stations. The 1σ uncertainty on these locations was greater than 2.0 km for all the epicentres, between 2 and 3 km for 11 events, between 3 and 4 km for 6 events, between 4 and 5 km for 2 events and greater than 10 km for 4 events. Focal depths ranged from 1 to 7 km for all the events confirming the shallowness of this earthquake activity, but the associated 1σ uncertainty was always greater than 3 km. These large uncertainties complicated establishing a direct relationship between this earthquake activity and geological structures and mining. Camelbeeck (1993) determined fault plane solutions for six of the most important earthquakes, showing variability in the faulting mechanisms either related to a poor focal mechanism quality or evidencing a complex tectonic structure.
3. Method to improve location of 1965 to 1985 earthquakes in the Hainaut area
19Individual locations of the Hainaut earthquakes between 1965 and 1985 resulted in large uncertainties and are only possible for the largest events that were recorded by enough seismic stations outside the Belgian territory (Camelbeeck, 1993). Reducing these uncertainties would require 3-D knowledge of seismic velocities and crustal thickness throughout the whole region covered by all the considered European seismic stations, which is unrealistic due to the complex geological structure of Northwestern Europe. Fortunately, as the Hainaut earthquakes always occurred in the same geological context, using relative location methods would be a way to improve the location quality of each earthquake and to enlarge the number of earthquakes that can be located with good precision. This relative method only requires knowledge of the crustal structure in the region between the different earthquake sources as the largest part of the seismic phase paths towards each recording seismic station is identical for all the earthquakes.
20Relative methods in which earthquake arrivals are compared are routinely used to study aftershocks and earthquake swarms monitored by mobile seismic networks (Waldhauser & Ellsworth, 2000). Such a method was used by Van Noten et al. (2015) to relocate the seismic sequence that occurred in Brabant between 2008 and 2010. We applied this concept for two different Hainaut cases: i.e. for events recorded in Europe up to regional distances and for events only recorded at the DOU and UCC seismic stations.
3.1 Location of earthquakes recorded up to a regional distance
21For seismic stations at more than 170 km from Hainaut, the first seismic phase recorded from crustal seismic events is the Pn head wave, i.e. the seismic wave traveling at the interface of the crust and the mantle. We only used Pn phase measurements in our study because later crustal phases are far less accurate and can often not be identified without ambiguity due to the complexity of seismograms at regional distances. At less than 170 km, Pg and Sg are the main observed seismic phases that can be picked with good accuracy. For shallow earthquakes, Pn, Pg and Sg phases are all head waves travelling along an interface inside the crust and can be modelled in a similar way by a linear equation (Supplementary material S1) like:

22where H0 is the origin time of the considered event, a0 is the time term depending on the focal depth of the event and the refractor depth (Moho depth for Pn-waves and a crustal internal layer for Pg and Sg waves; see eq. S1 in Supplementary material S1), X0 is the distance of the seismic station from the epicentre and Va is the apparent velocity of the considered seismic phase (Pn or Pg or Sg).
23We generalised the method developed by Camelbeeck (1993) that locates single earthquakes relative to an event for which a precise location is known by using the difference of the Pn or Pg and Sg arrival times measured at the same seismic stations. Here, we relocated 26 earthquakes that occurred between 1965 and 1985 in Hainaut by computing their relative location by comparison with the 25 other events of unknown locations, and 4 well-located master events recorded by the modern Belgian seismic network and at regional distances (Fig. 1 and Table 2, see python codes in Supplementary material S3).
Table 2. Master earthquakes used in the multiple event relative location procedure. (*) Mw determined by Denieul (2014) from seismic moment determination. (+) Mw determined from Mw-ML relationship by Camelbeeck et al. (2022). ERH, ERZ are the 1σ uncertainties on the epicentre and focal depth estimations, respectively. Z = focal depth. Mw = Moment Magnitude.
|
Event |
Location |
Latitude (°N) |
Longitude (°E) |
ERH (km) |
Z (km) |
ERZ (km) |
Mw |
|
22 March 1987 21h05m |
Dour |
50.406 |
3.802 |
0.8 |
5.2 |
1.1 |
2.9+ |
|
28 August 1992 09h22m |
La Plate Taille |
50.198 |
4.29 |
1.9 |
7.0 |
2.3 |
3.2* |
|
20 June 1995 01h54m |
Le Roeulx |
50.51 |
4.115 |
1.2 |
24.4 |
0.8 |
4.1* |
|
13 July 2008 13h45m |
Court-St-Etienne |
50.626 |
4.565 |
0.6 |
7.7 |
0.6 |
3.2+ |
24Our method is different to the now widely used method described by Walhauser & Ellsworth (2000) because of the use of a linear inversion and the fact that epicentres are determined independently from focal depth and origin time analysis. Details of our relocation method are presented in Supplementary material S1. The method to estimate apparent velocities for Pn, Pg and Sg phases and the depth dependence of time terms for the Hainaut earthquakes are presented in Supplementary material S2.
25For earthquake couples including one master event, we only considered Pn seismic phases in the computation because two fundamental conditions are not filled to consider Pg and Sg phases at short distance in the analysis. First, the too-large relative distances of these events by comparison to Hainaut earthquakes lead to a too-large difference in their respective azimuth to these closest seismic stations. Second, as three of the master events occurred deeper in the crust, their Pg and Sg travel time variation with distance is no longer linear because these travel paths are upward direct waves.
26The inverted linear system includes 3479 equations composed by comparing 104 earthquake pairs with the 4 master events and 325 pairs comparing the 26 ‘unknown’ earthquakes between each other. In the computations, we took into consideration the uncertainties on the absolute location of the 4 master events reported in Table 1 and on the seismic phase arrival time measurements. We considered that the uncertainty on the arrival times is 1 second at all the stations. This value corresponds to the minimum resolution of time measurements on the paper recordings of historical stations. This resolution can be even better in some stations and reach 0.1 second. We did not consider the uncertainty on seismic velocities because they had a minor influence on the results by comparison to the two main sources of uncertainties, but we used the velocities that minimised the residuals (Supplementary material S2).
27Then, the coordinates of the epicentre of each of the 26 studied earthquakes correspond to the mean of 1000 different solutions of the system of equations obtained by using (i) 1000 different locations of the master events based on their associated mean and 1σ values and (ii) 1000 different arrival times of each phase measurement using a normal distribution centred on the corresponding measurement with a sigma of 1 second. The associated uncertainties in the results are evaluated using the statistical distribution of these 1000 solutions. However, the reliability of our final locations also depends on the number of seismic phase measurements for each earthquake couple and the azimuthal range of the corresponding seismic stations. This aspect is discussed in the presentation of the dataset (section 4). The results of these locations are presented and discussed in section 5.
28Even if the four master earthquakes provide good azimuthal coverage of the studied area (see the small frame in Fig. 1), the lack of strong earthquakes in the Hainaut area since the development of the modern Belgian seismic network in 1985 did not allow choosing master earthquakes located inside or closer to the Centre–La Louvière and the Charleroi coal basins. The only one close to the investigated area is the Mw = 4.1 earthquake on 20 June 1995 near Le Roeulx that occurred at a depth of 24 km in the Brabant Massif basement. Its depth is well evaluated because the earthquake was recorded by three seismic stations at less than 20 km, the closest being 3 km far from the epicentre. The earthquake on 28 August 1992 occurred nearly 20 km to the South of the city of Charleroi. The uncertainty on its location is larger than for the other master events with a 1σ uncertainty of nearly 2 km on its epicentre and slightly greater on the focal depth because the closest station is located at around 20 km distance. For these two events, we considered the location given by the catalogue of the Royal Observatory of Belgium at the date of 1 January 2013. The epicentre of the two other earthquakes on 22 March 1987 near Dour in the Borinage and 13 July 2008 in the Walloon Brabant are better constrained because they were the stronger earthquakes of two seismic sequences that were monitored by mobile local seismic networks (Camelbeeck, 1988; Van Noten et al., 2015). However, their focal depth is less well determined than their epicentre. In the case of the 1987 earthquake, the main reason is the use of a single-layer crustal velocity model that slightly overvalued upper crustal velocity and then also focal depth estimation. The 2008 event occurred before the deployment of the mobile seismic network, which led to a less precise location and especially focal depth than for the events measured by the mobile stations.
3.2. Location of earthquakes only measured at the DOU and UCC seismic stations
29For 28 earthquakes, the only arrival times available are Pg and Sg crustal waves for the DOU station, and Pg or Sg waves for the UCC station. By assuming that focal depths of Hainaut events are similar and shallow (Camelbeeck et al., 2022), we can use the Sg – Pg arrival times at DOU of one of these 28 events and other well-located Hainaut earthquakes to estimate the difference in epicentral distance with DOU. Similarly, the difference of Sg or Pg arrival times at UCC with the one at DOU indicates the difference of UCC epicentral distances between the two events. Those two “double time difference” allows evaluating the distance difference of these earthquakes from the DOU and UCC seismic stations
 are the arrival time measurements of Sg- and Pg-waves, respectively for the DOU and UCC seismic stations, and VS and VP are the mean Sg- and Pg-waves velocity in the upper crust (see Sup. Mat. S2).
30As possible master events, we considered 14 earthquakes of the 26 events between 1965 and 1970 for which Pg and Sg waves measurements are simultaneously available for the DOU and UCC seismic station and which were located using data at regional distances.
31The relative location of each earthquake by comparison to a master event is obtained by solving a system of two equations for the two unknowns Δx and Δy, which are their difference in longitude and latitude. These equations are similar to equation S4 of Supplementary material S1 and are obtained by considering that the azimuth of the seismic stations of DOU and UCC from the two events are identical because the epicentres are very close to each other. In our analysis, we considered that only those earthquake couples that are separated by less than 4 km are compatible with this requirement, which of course strongly reduces the number of eligible master events.
4. The 1965–1985 earthquake dataset
32Due to the small number of seismic stations in Belgium during the period 1965–1985 (Figs 1 and 4), Camelbeeck (1985, 1990) increased the dataset for the 26 studied earthquakes by collecting copies of paper seismograms or arrival time measurements for numerous seismic stations in Western Europe in parallel to phase measurements published in seismic bulletins of (inter)national and regional seismic centres. To fill gaps of data for some Mw < 3.5 studied earthquakes, additional arrival time measurements from the French CEA-LDG seismic network were also collected. The location of the seismic stations for which arrival time measurements and P-wave first motion data were used in this study is reported in Figure 4.
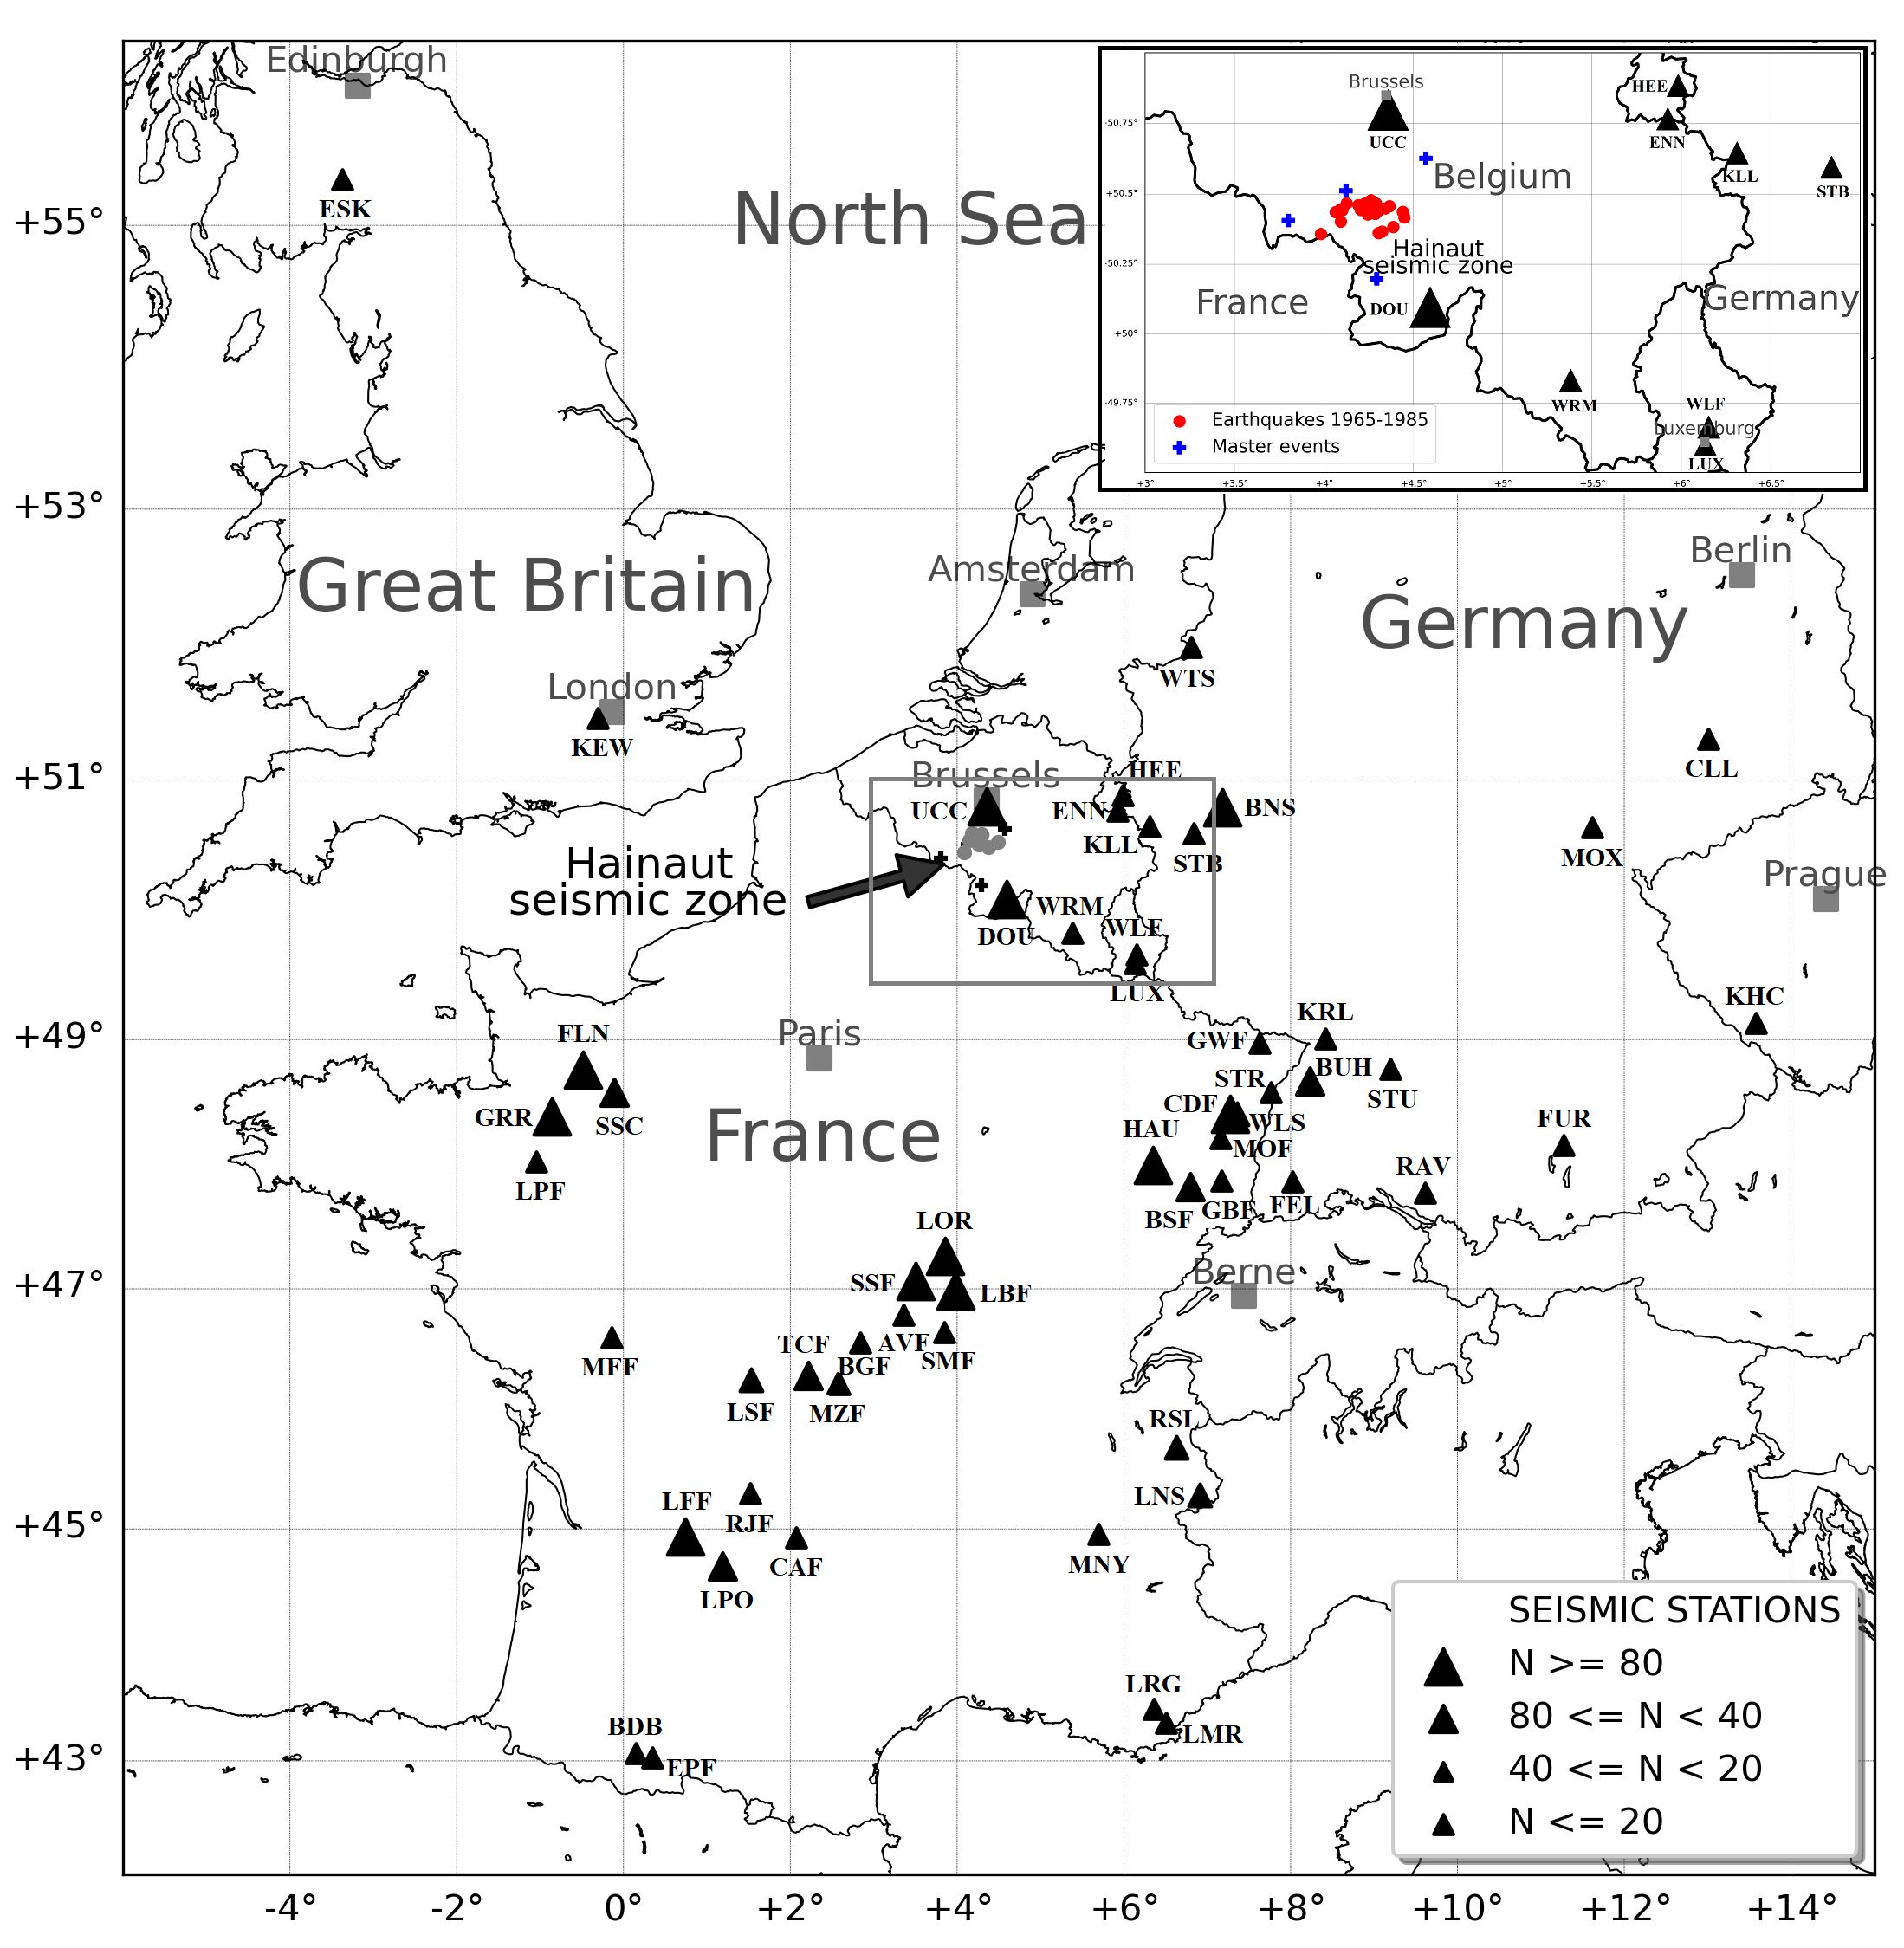
Figure 4. European seismic stations for which arrival time measurements are included in our dataset. The size of the triangles provides the number (N) of earthquake couples that have Pn or Pg, and Sg seismic phases in common in that station.
33Figure 5 reports for each couple of earthquakes the number of stations that have been used in the relative location. For some earthquakes, this number is relatively small, which certainly limits the quality of their location. This is the case for the earthquakes for which there is no couple including more than 7 data: 15 December 1965 at 13h42m (respectively 10 and 6 couples with respectively 5 and 6 data and no couple with more data for a total of 127 equations), 16 March 1966 at 1h21m (4 couples with 5 data and no couple with more data for a total of 127 equations), 13 August 1968 at 16h40m (respectively 3 and 4 couples with respectively 5 and 6 data and no couple with more data for a total of 96 equations), 3 November 1970 at 12h07m (respectively 5 and 9 couples with respectively 6 and 7 data and no couple with more data for a total of 155 equations) and 14 September 1982 at 19h29m (8 couples with respectively 7 data and 1 couple with 8 and 10 data for a total of 165 equations).
Figure 5. Number of seismic stations for which arrival phase measurements have been used in the location inversion for the different earthquake couples.
34For the other earthquakes, the dataset is more consistent. In that respect, most of the couples formed by the largest earthquakes (15 December 1965 at 12h07m, 16 January 1966 at 12h32m, 28 March 1967 at 15h49m, or 24 October 1976 at 20h33m) show measurements of phase arrival time for more than 20 stations. For the couples formed by these earthquakes and the master events, the number of stations is smaller, but greater than 12 to 15 in most cases. This reduced number is explained by the progressive diminution of historical stations that recorded the stronger earthquake well before 1970 but were dismantled in the following decade. However, during the 1970s and 1980s, modern digital seismic networks progressively replaced old seismic stations. Moreover, the French CEA-LDG modern network also evolved with time since its creation in 1964, with the closing of some stations and the creation of new ones. Then, data from the five earthquakes that occurred between 1976 and 1983 (mainly the 24 October 1976 at 20h33m and 14 September 1982 at 19h24m earthquakes), which were recorded by part of the different generations of stations or networks, provide additional equations related to the recent master events in the common relative inversion process.
35An important parameter in the analysis of the reliability of the computed earthquake epicentres for each couple of earthquakes is the distribution of the azimuth of the seismic stations reporting a difference in arrival times. A better relative location of the two earthquakes will be obtained if the corresponding dataset samples at least an azimuthal range of π radians, with several intermediate values sampling this minimum interval (see eq. S6 in Supplementary material S1). Figure 6 reports the largest gap in seismic station azimuth for all the earthquake couples of the dataset. For many couples, this value is larger or of the order of π radians. It is poor for the earthquakes we already mentioned because of their small number of available data. However, one of the advantages of our multiple events inversion is the possibility to obtain a reliable location with the presence of only a few couples including this event respecting this “π radians” condition.
Figure 6. Azimuthal gap (in degrees) between seismic stations for each couple of earthquakes.
5. Regional earthquake location
5.1. Results
36The results of our locations are reported in Table 1 and in Figure 7 and Figure 1. For the 26 events located using European seismic stations, the location corresponds to the mean value of the 1000 different locations computed for each of them in the way described in section 3.1., while the error bar corresponds to the 1σ of the location distribution. Figures 8 and 9 provide maps reporting this information respectively for the 4 earthquakes on 15 December 1965 and for the years 1966, 1967, 1968 and between 1970 and 1985.
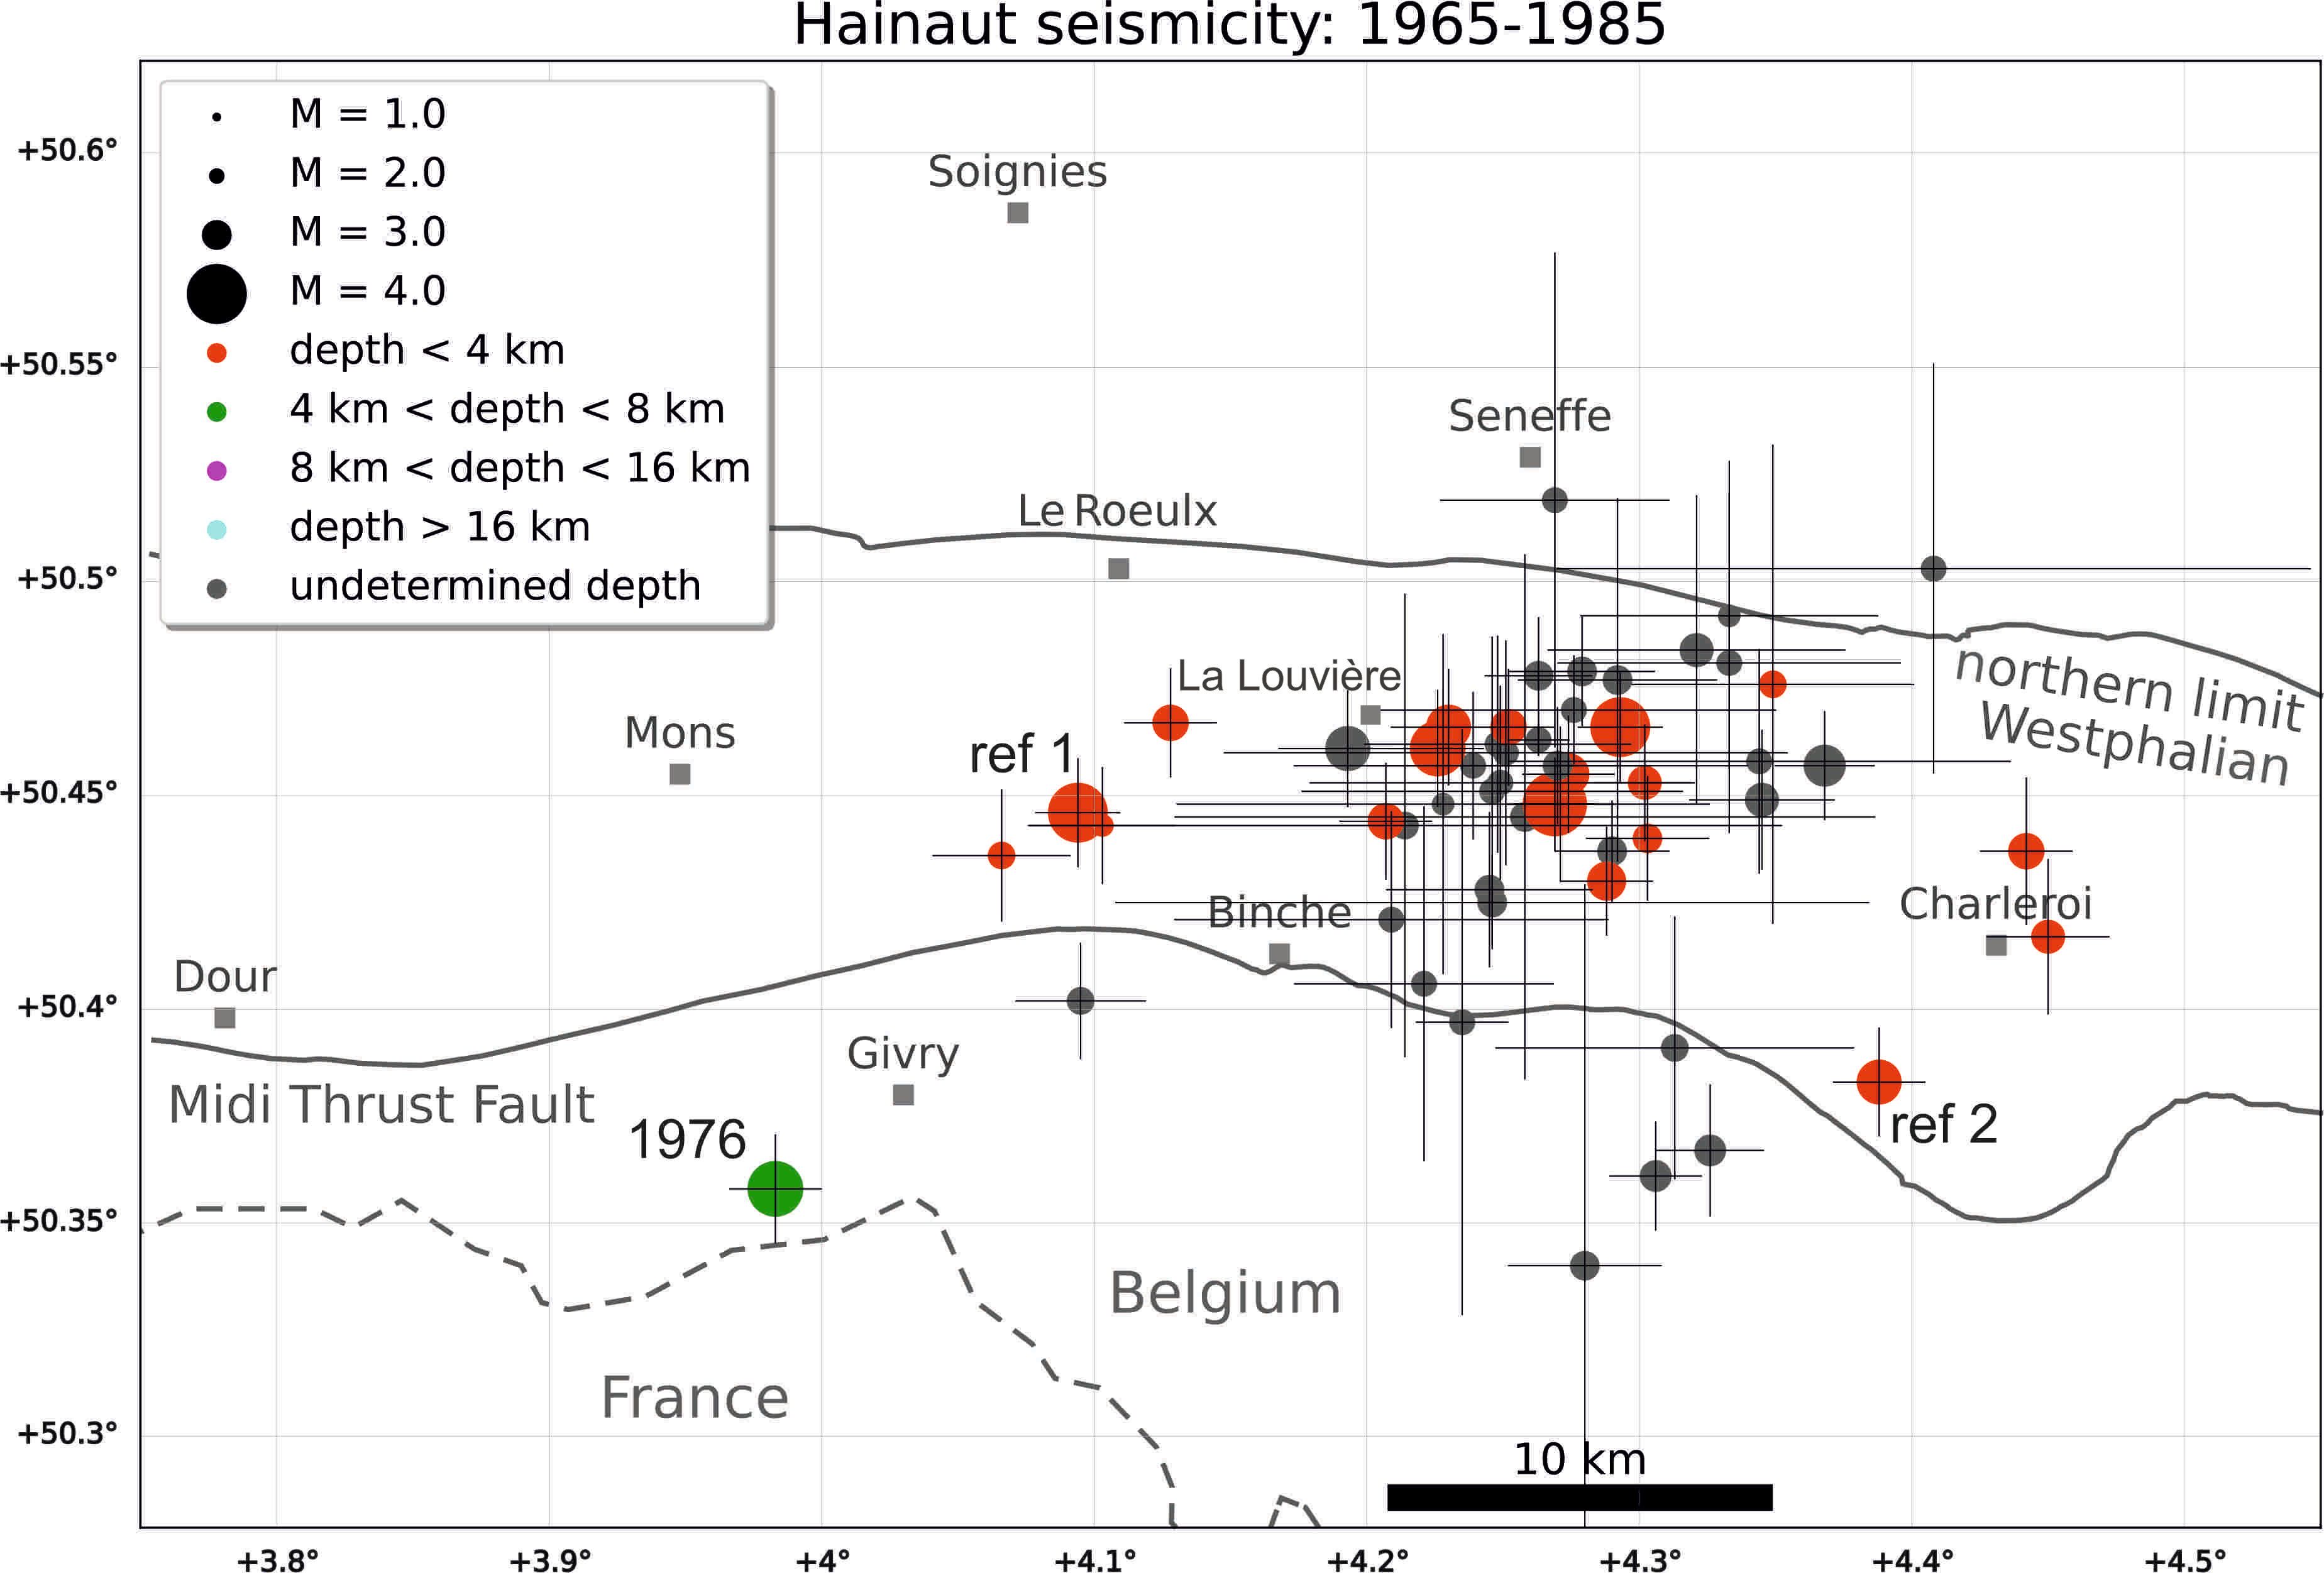
Figure 7. Seismic activity in the Hainaut seismic zone between 1965 and 1985. 1σ location uncertainty is indicated by the thin black error bars which are scaled to distance.
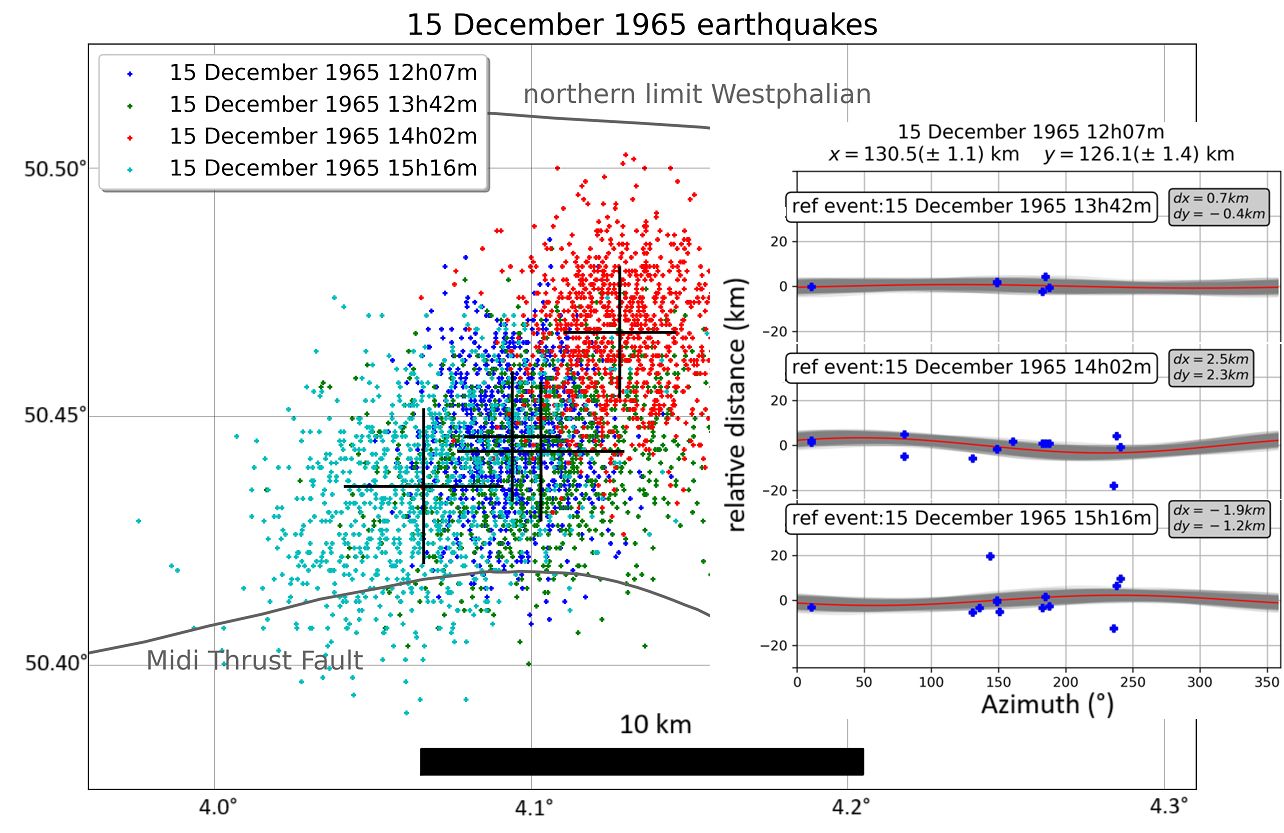
Figure 8. Map of the 1000 different locations of the four 15 December 1965 events with the epicentre as the mean value of all the solutions and the 1σ of the distribution. The inset to the right reports the data diagrams, similar to Fig. 10, reporting the fit of the data (blue dots).
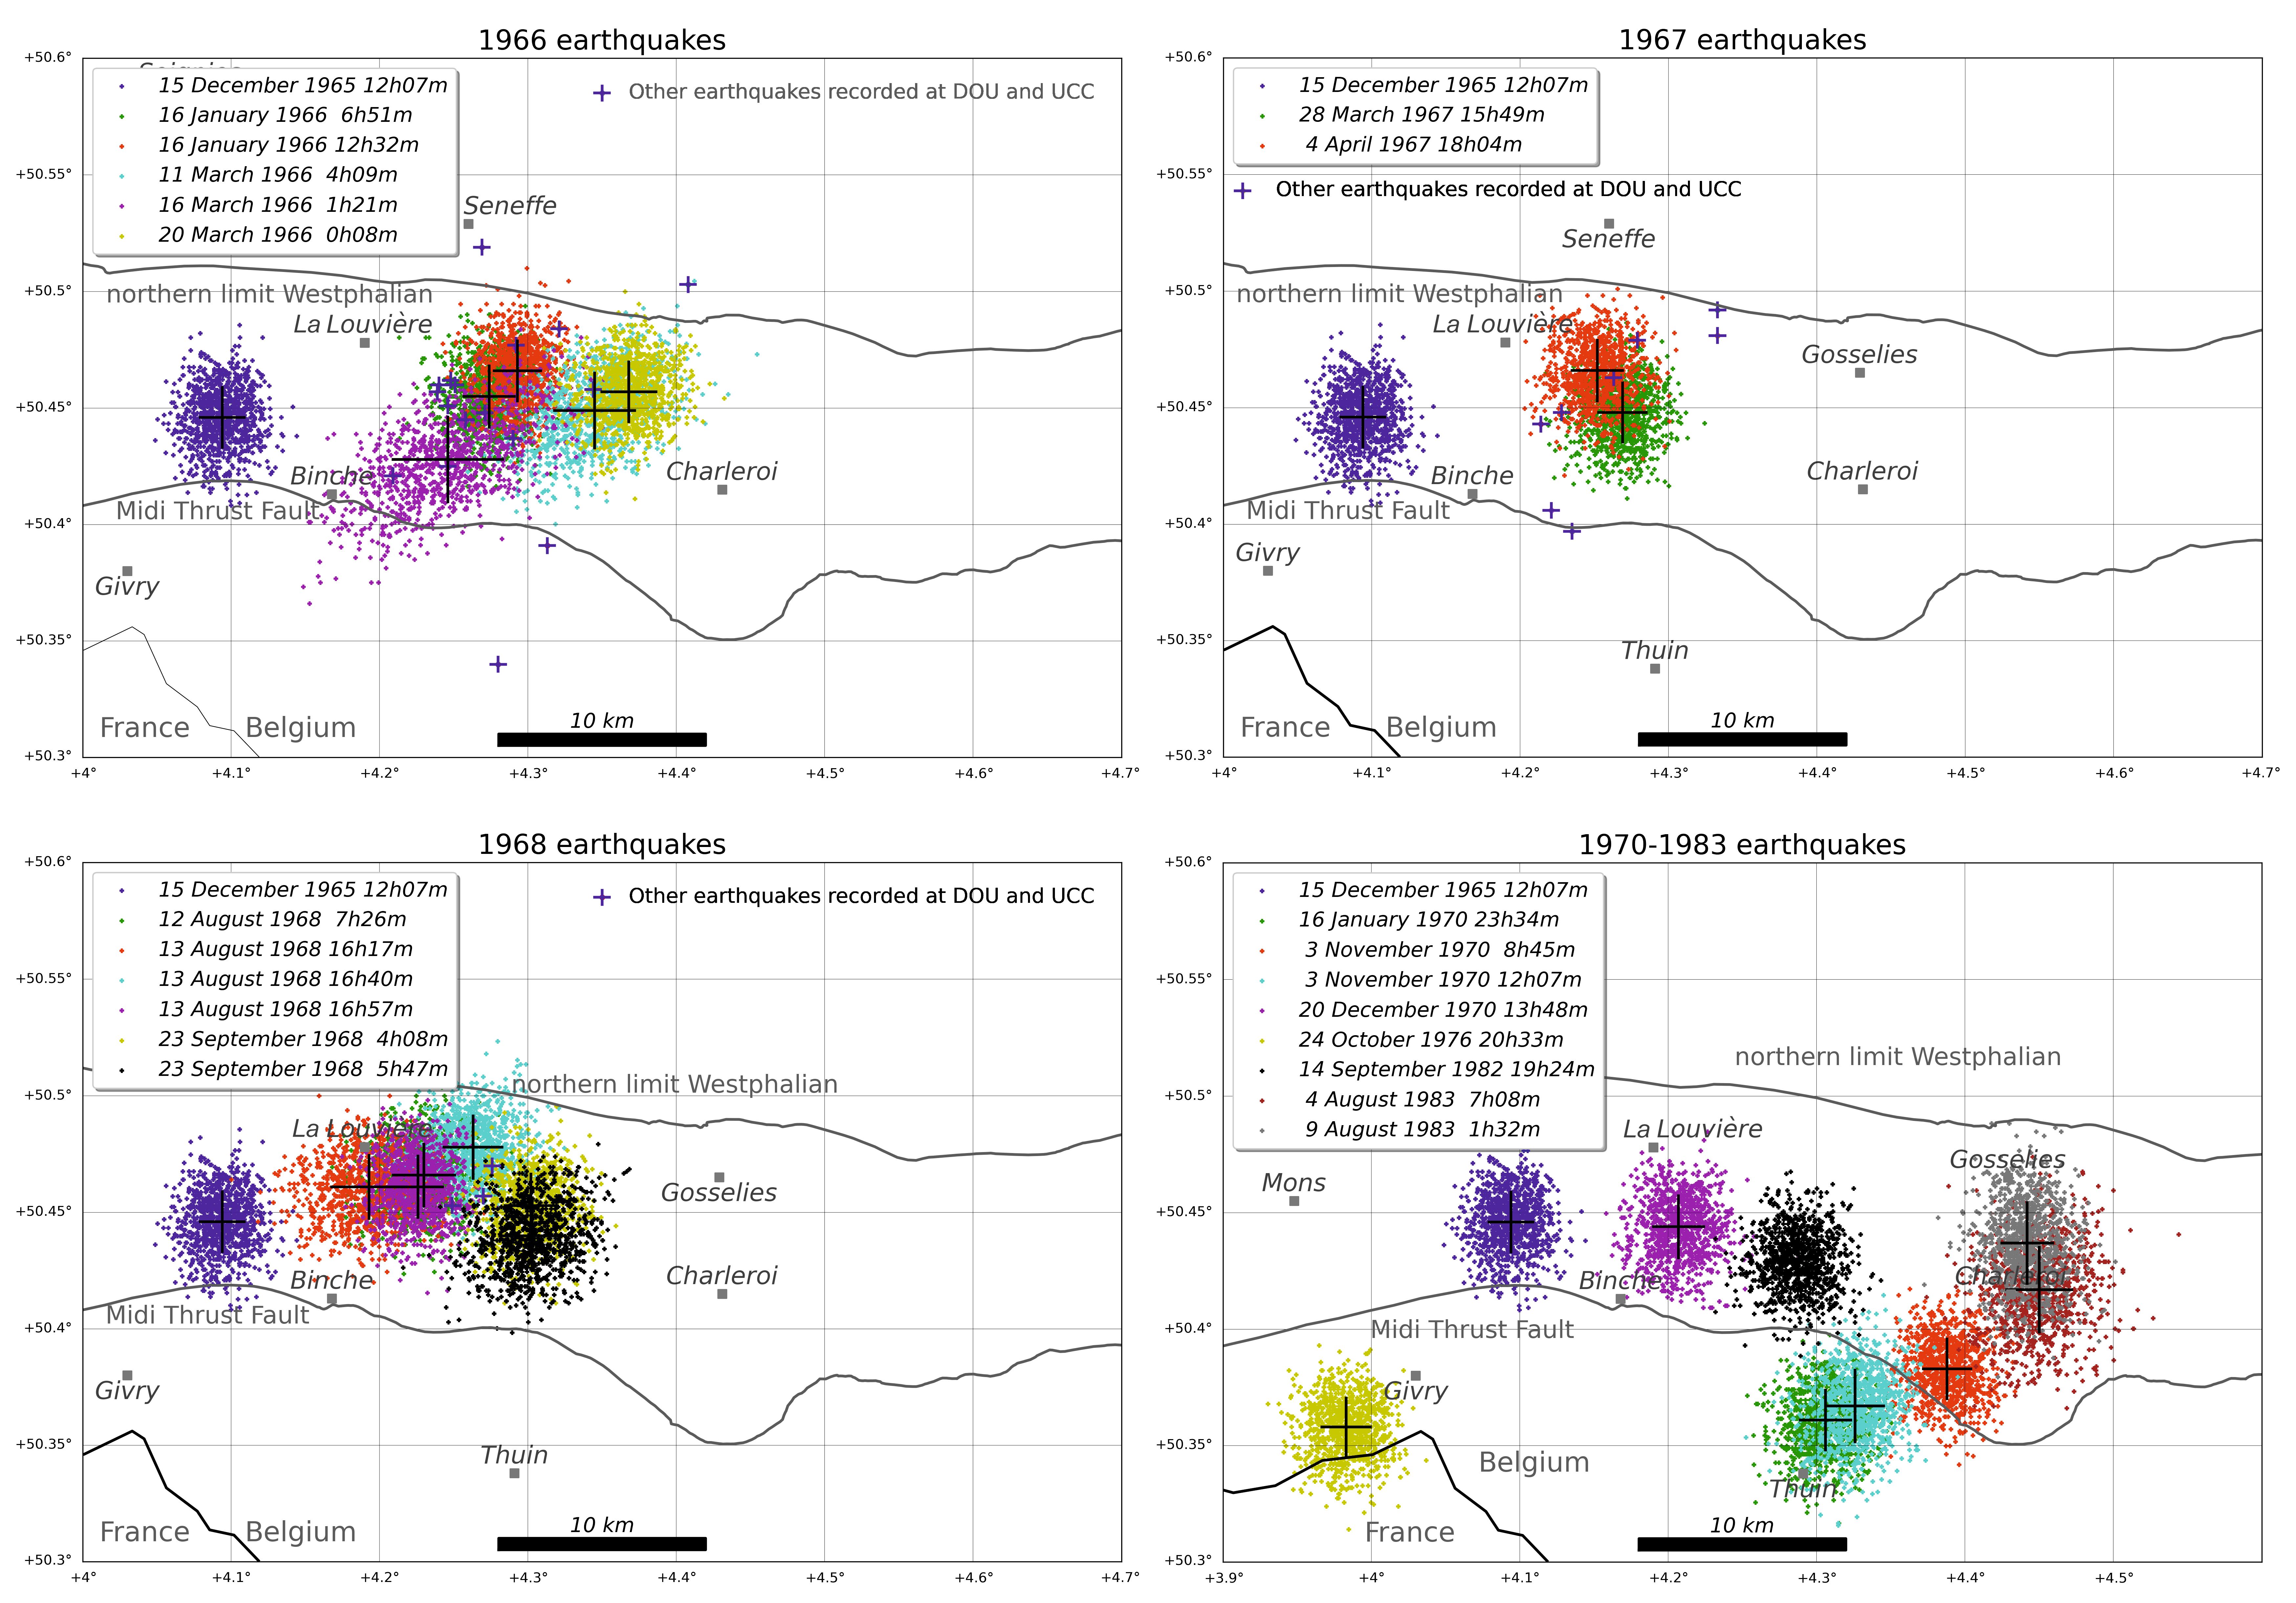
Figure 9. Maps of the 1000 different locations for the earthquakes that occurred respectively in 1966, 1967, 1968 and between 1970 and 1983. The respective epicentres are the mean value of all the solutions and the 1σ of the distribution corresponding to each earthquake. The 1000 locations cloud for the 15 December 1965 earthquake is reported in each figure as a reference epicentre location.
37To visualise the fitting of the dataset with the epicentre solution for the set of the 26 studied earthquakes, we provide in Supplementary material S3.2. all diagrams like Figure 10. This diagram shows the difference in the seismic phase propagation times (transformed to distance using the phase velocity) at each seismic station between the 15 December 1965 earthquake at 12h07 and the master event on 12 July 2008 at 13h46m. These data fit well with the curve representing the difference in epicentre location of both events obtained by inversion of the entire dataset of the 26 studied earthquakes. The x and y location (Belgian Lambert projection) in the title of the figure reports the solution for the epicentre of the 1965 earthquake with its 1σ uncertainty. The relative distance between the 2008 and 1965 earthquakes is indicated as dx and dy. The red sinusoidal curve reports the mean solution of fitting the azimuthal variation of the relative distance between the two earthquakes. The black curves correspond to each of the 1000 solutions of the system of equations. Blue markers correspond to each seismic station that provided measurements for the two earthquakes. They are reported on the diagram following their azimuth and relative distances from the two earthquakes of the couple. This relative distance is equal to the product of the time difference of the Pn or Pg or Sg phase for the two earthquakes with the apparent velocity of the corresponding seismic phase. For each couple of events, the value of the measured time difference residuals for each station are reported in Supplementary material S3.1.
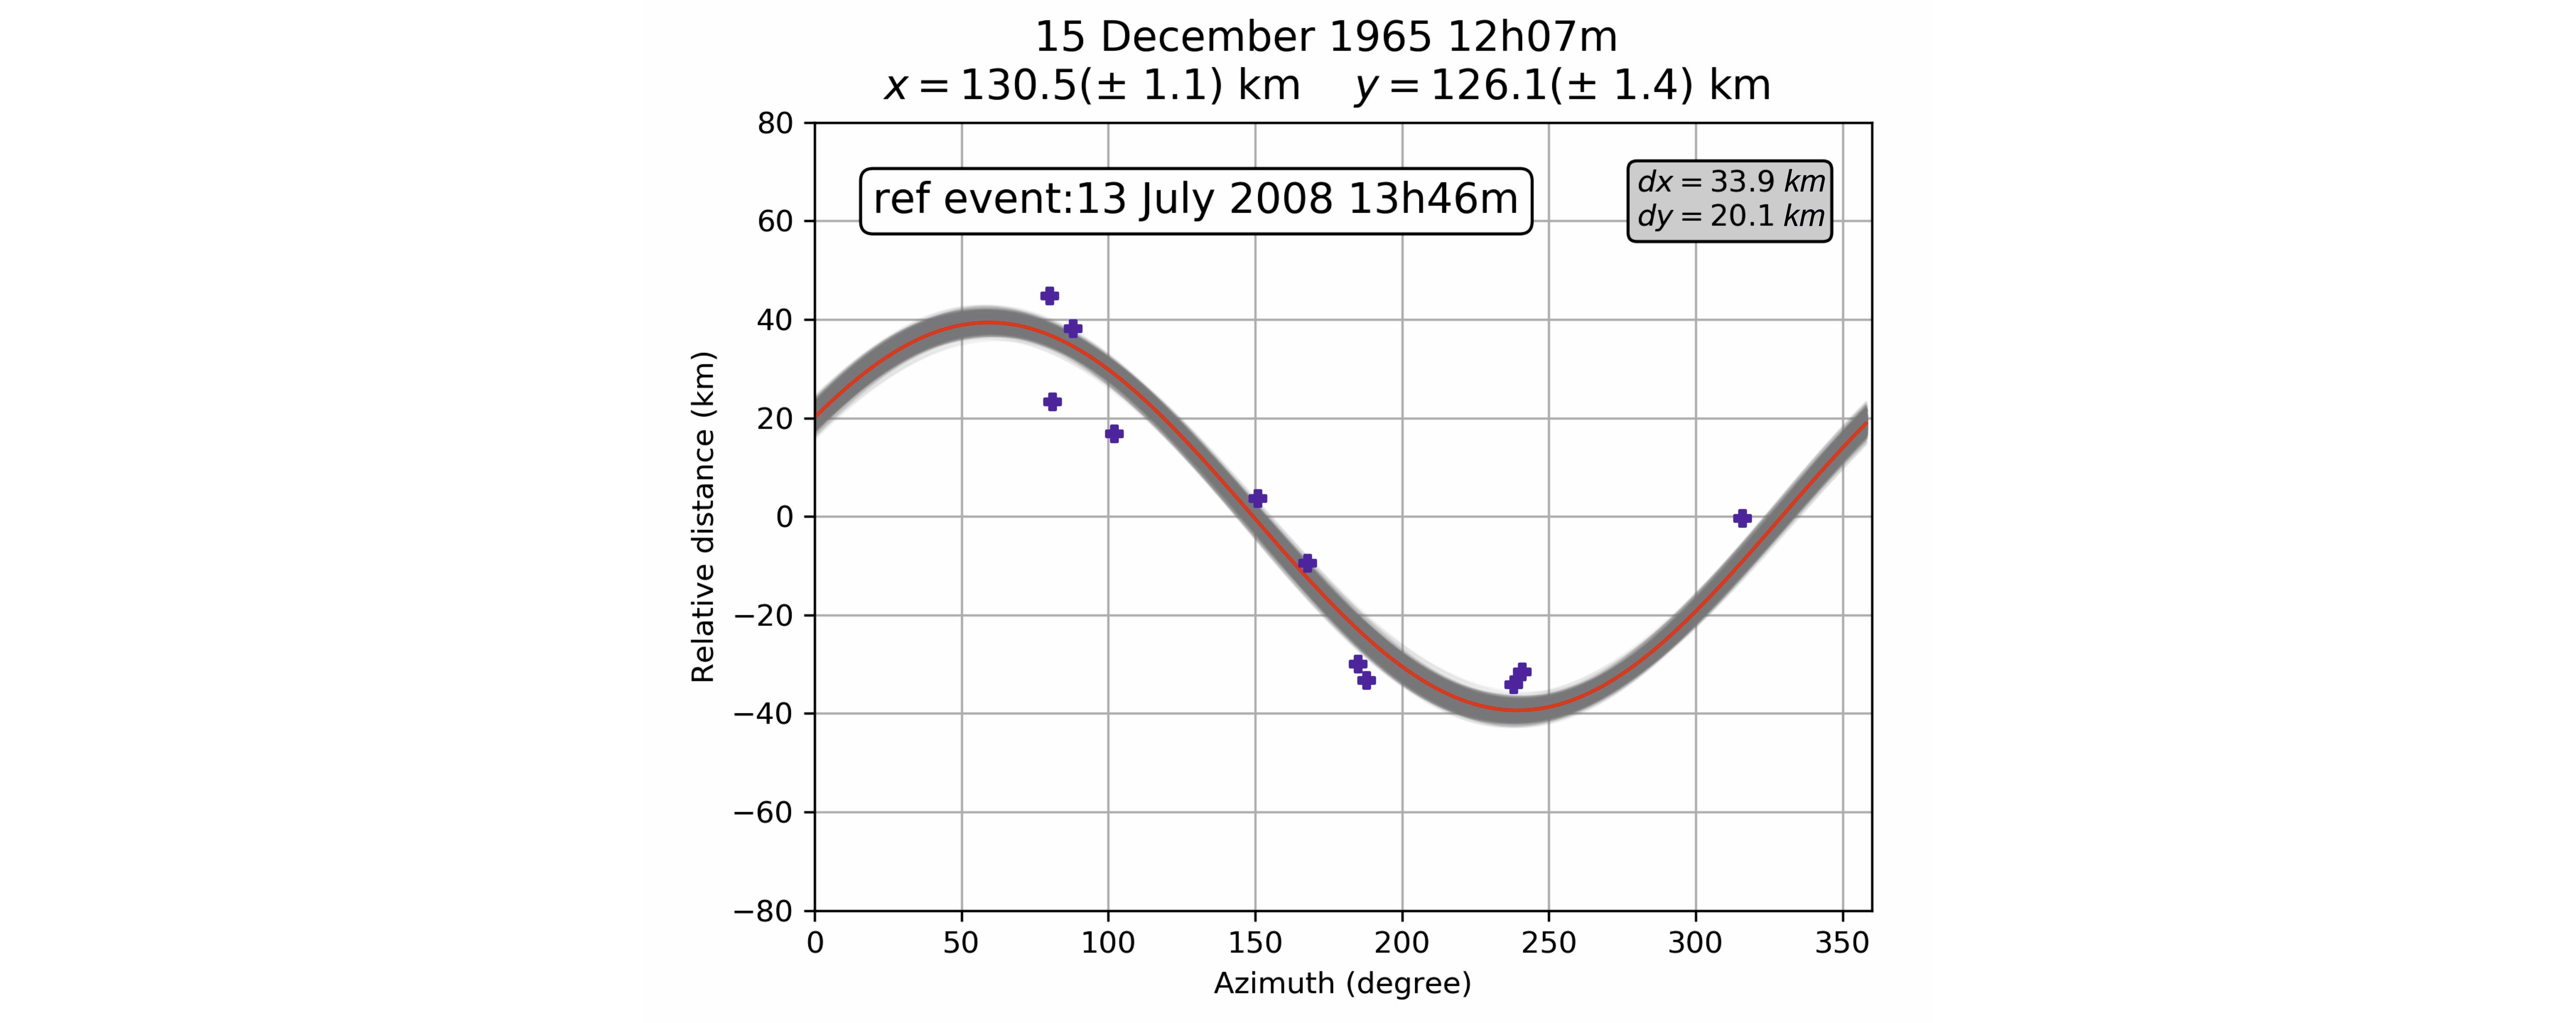
Figure 10. Azimuthal difference of the seismic phase propagation times (converted to distance) for all stations that recorded the 15 December 1965 12h07m and 13 July 2008 13h46m earthquake couple. Blue dots: station data points. Grey shade: Solution given by 1000 times computing the relative location. Red curve: Mean solution.
38In Table 1, the quality Q of the 28 events located only using seismic measurements at the DOU and UCC seismic stations are reported by a bracket, in which the number of specific master earthquakes used in the process is indicated.
39For [0]: no master event is at less than 4 km from the considered earthquake. The location is computed only using the nearest master event. We considered that the event would be a foreshock or an aftershock of this master event, and we fixed the uncertainty on its location as the latitude and longitude difference with this master event.
40For [1]: only one master event is at less than 4 km from the considered earthquake. As for the previous case, we considered that the uncertainty on the location would be the latitude and longitude difference with this master event.
41When more than 1 master event is at less than 4 km, the reported epicentre corresponds to the mean of the different computations and the uncertainty corresponds to the 1σ value on the different estimations.
5.2. Reliability of the epicentre estimates
42The 1σ values around the mean of the 1000 epicentre locations for each of the studied earthquakes suggest a quality improvement of our multiple event location method over the single location of Camelbeeck (1993). They vary from 1.2 km to 2.0 km in latitude and 1.1 km to 2.7 km in longitude (Table 1). However, validating the reliability of these results requires analysing the residuals and the completeness of the dataset in terms of azimuthal representation and amount of data for each earthquake couple. To do this, we compared our epicentres and their associated uncertainties with the reliable macroseismic locations estimated by Camelbeeck et al. (2022) for 11 earthquakes of the seismic episode (Table 3). These macroseismic epicentres were computed as the weighted centre of the intensity data points (IDPs) with the maximum and maximum minus one degree observed intensity. Their uncertainties are estimated as the mean value of those IDPs and are relatively small as the higher observed intensities are spatially concentrated in small areas with radii of a maximum of a few kilometres.
Table 3. Comparison between new locations and macroseismic analysis by Camelbeeck et al. (2022). ΔLat: latitude difference (in km) between our relative epicentre and the macroseismic location. ΔLon: longitude difference (in km) between our relative epicentre and the macroseismic location. dR: distance between the relative location and macroseismic epicentres (in km). EM: macroseismic epicentre uncertainty in km (weighted mean of Imax and Imax-1 locality centres). σR: 1σ around the mean of the 1000 computed epicentres for each earthquake.
|
N° |
D M YEAR |
h m |
LAT°N |
LON°E |
ΔLat(km) |
ΔLon(km) |
dR(km) |
EM(km) |
σR(km) |
|
01 |
15 12 1965 |
12 07 |
50.446 |
4.094 |
-0.4 |
-1.8 |
1.9 0.5 1.4 |
0.5 |
1.4 |
|
06 |
16 01 1966 |
06 51 |
50.455 |
4.274 |
-1.7 |
1.0 |
2.5 |
1.8 |
1.5 |
|
07 |
16 01 1966 |
12 32 |
50.466 |
4.293 |
0.7 |
2.4 |
2.5 |
0.6 |
1.4 |
|
27 |
28 03 1967 |
15 49 |
50.448 |
4.269 |
3.1 |
-0.8 |
3.2 |
1.3 |
1.2 |
|
37 |
12 08 1968 |
07 26 |
50.466 |
4.23 |
0.7 |
1.4 |
1.6 |
1.7 |
1.5 |
|
41 |
13 08 1968 |
16 57 |
50.461 |
4.226 |
0.1 |
1.1 |
1.2 |
2.0 |
1.5 |
|
44 |
23 09 1968 |
04 08 |
50.453 |
4.302 |
-0.8 |
5.2 |
5.2 |
2.0 |
1.5 |
|
45 |
23 09 1968 |
05 47 |
50.44 |
4.303 |
-3.3 |
6.0 |
6.8 |
1.2 |
1.6 |
|
47 |
03 11 1970 |
08 45 |
50.383 |
4.388 |
-3.0 |
-1.6 |
3.4 |
1.6 |
1.4 |
|
50 |
24 10 1976 |
20 33 |
50.358 |
3.983 |
-0.2 |
-2.7 |
2.7 |
2.4 |
1.4 |
|
51 |
14 09 1982 |
19 24 |
50.43 |
4.288 |
-1.1 |
3.4 |
3.6 |
2.0 |
1.4 |
43For 9 of these 11 earthquakes, our epicentres are very close to the macroseismic ones (e.g. Fig. 11). For that reason, the number of data (Fig. 5), their maximum azimuthal gap (Fig. 6) and their residuals (Fig. 12) for most of the couples including these earthquakes appear sufficient to obtain reliable locations. Then, the associated 1σ values would represent a reliable evaluation of their uncertainty. These events are assigned with a Quality A level (uncertainty estimated between 1 and 2 km).
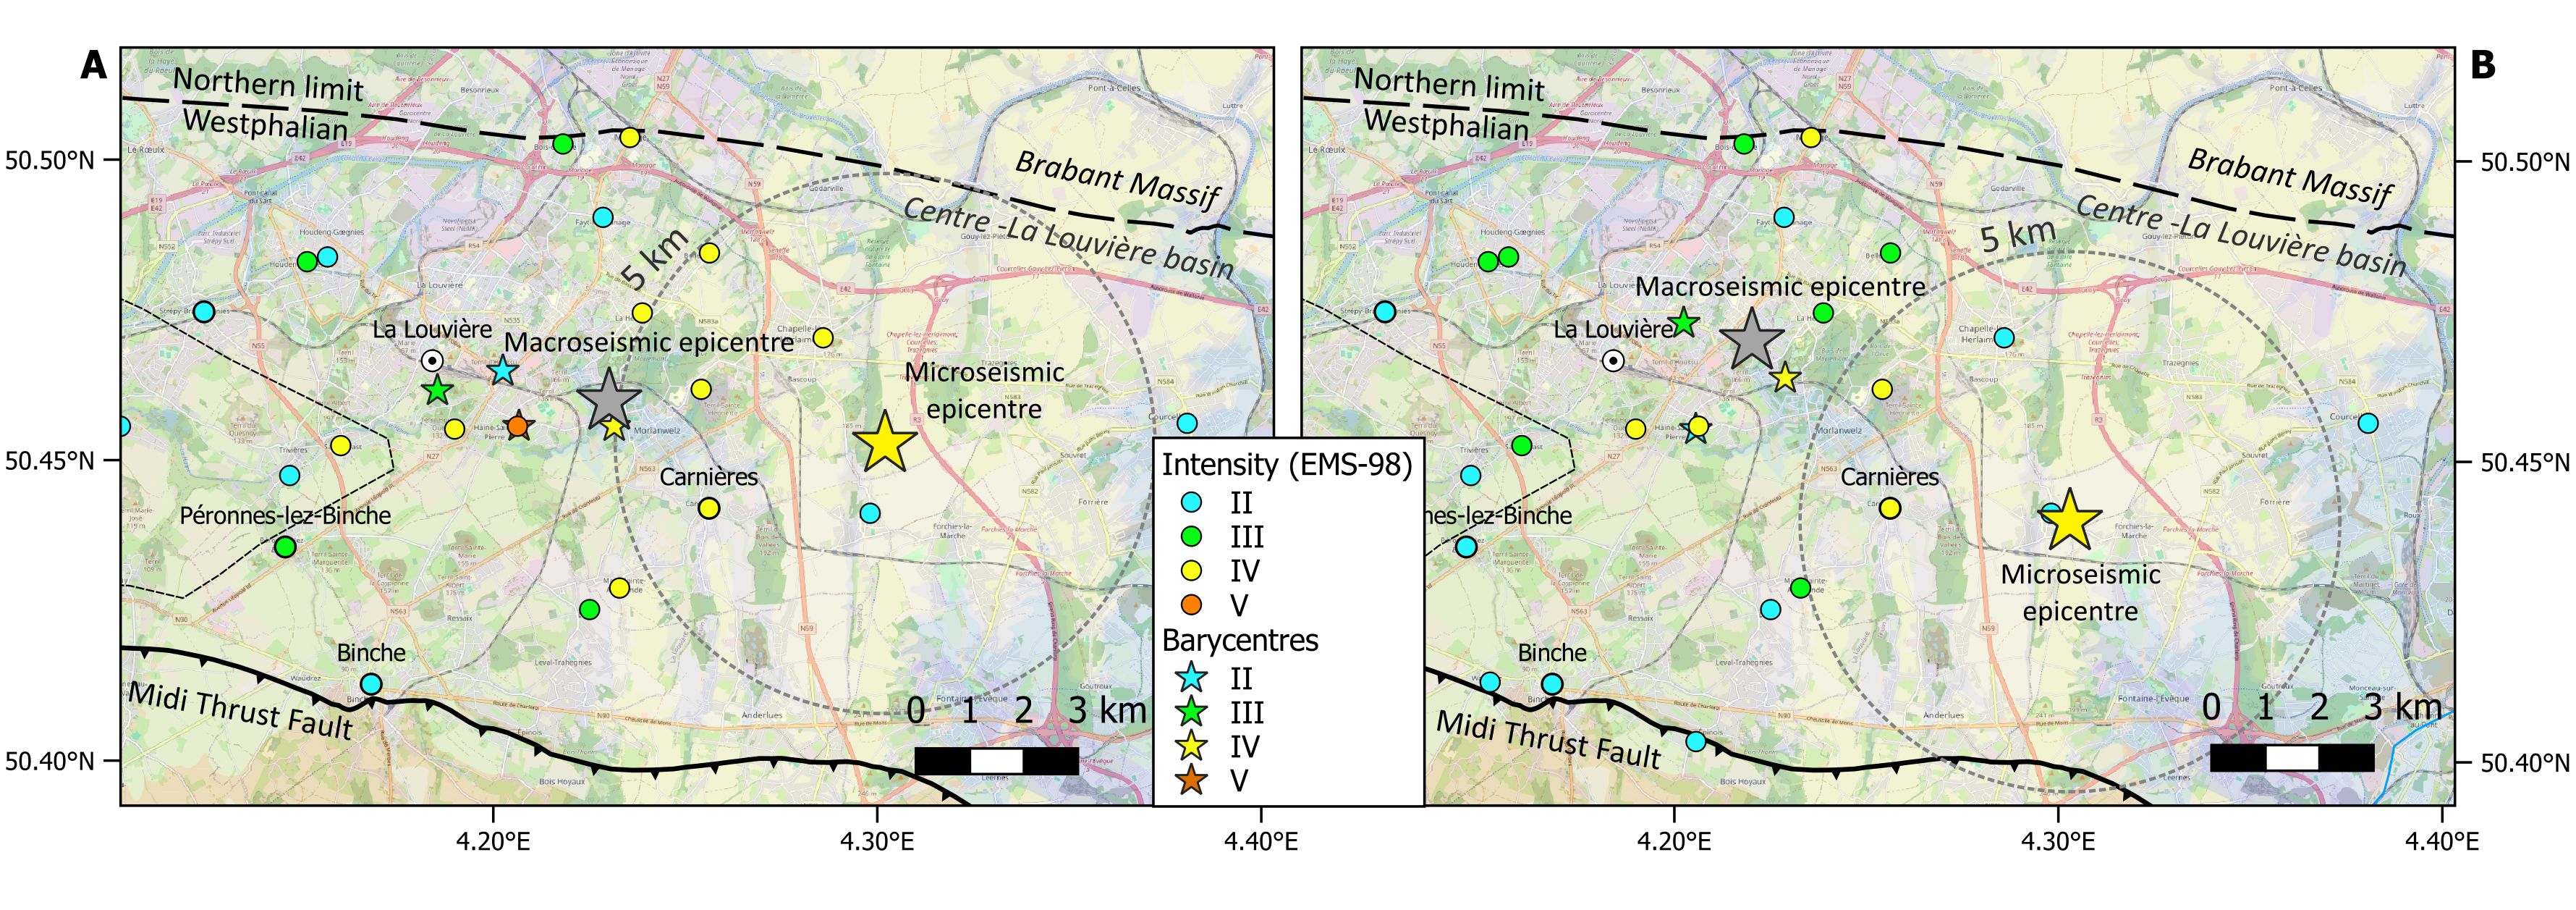
Figure 11. Epicentral zone of the 23/09/1968 earthquakes at 04h08 (A) and 05h49 (B). Note the difference in location between the macroseismic and microseismic epicentre that could be partly explained by a low population density around the microseismic epicentre (more rural areas shown in yellow and green colours).
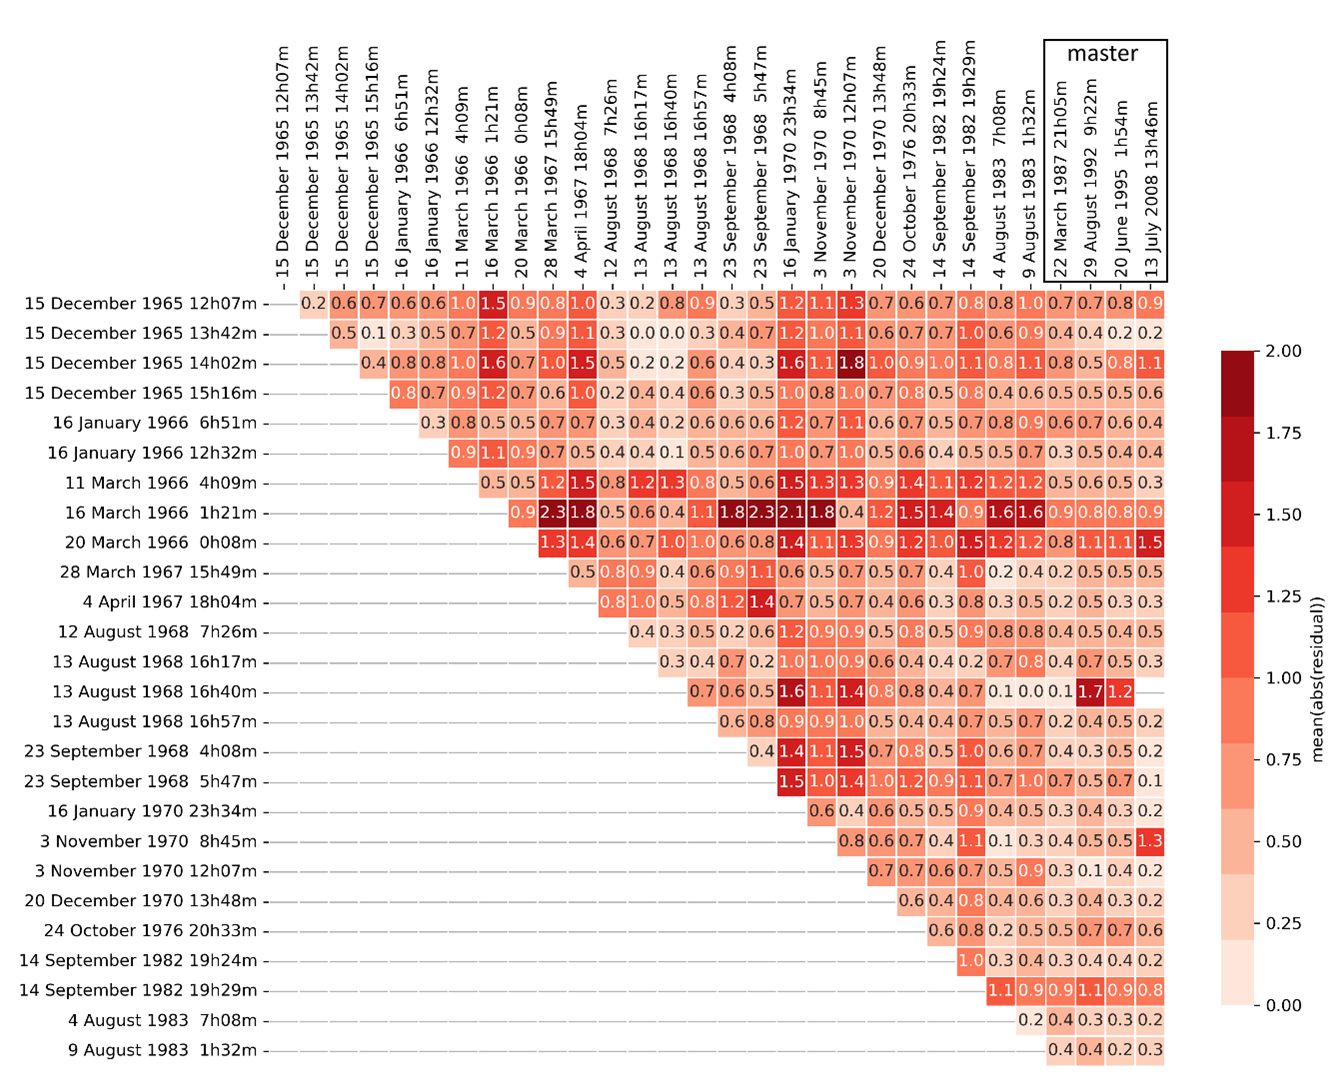
Figure 12. Mean of absolute time difference residuals for each couple of earthquake locations.
44For two earthquakes on 23/09/1968 (shadow lines in Table 3), the distance between the two epicentre estimations is of the order of 5–6 km, which is large compared to the 1σ given by the two methods. However, it is difficult to evaluate whether this discrepancy is caused by a diminution of the reliability of one or the two methods. The asymmetric repartition of the IDPs for the 23/09/1968 04h08m earthquake (Fig. 11) suggests a spatial inhomogeneity in the official reports of the Royal Observatory of Belgium that questioned the effects of the earthquake. For an earthquake that occurred early in the morning and only produced weak effects on the people, interpreting these answers is somehow difficult and can lead to uncertainties in the intensity evaluation. Moreover, the absence of information to the East of the macroseismic field could also be related to the weaker population density in parts of the area at the epoch (Fig. 13). This is corroborated by the observation that both the macroseismic epicentre and the barycentres of individual intensities are located near the larger population centre of La Louvière.
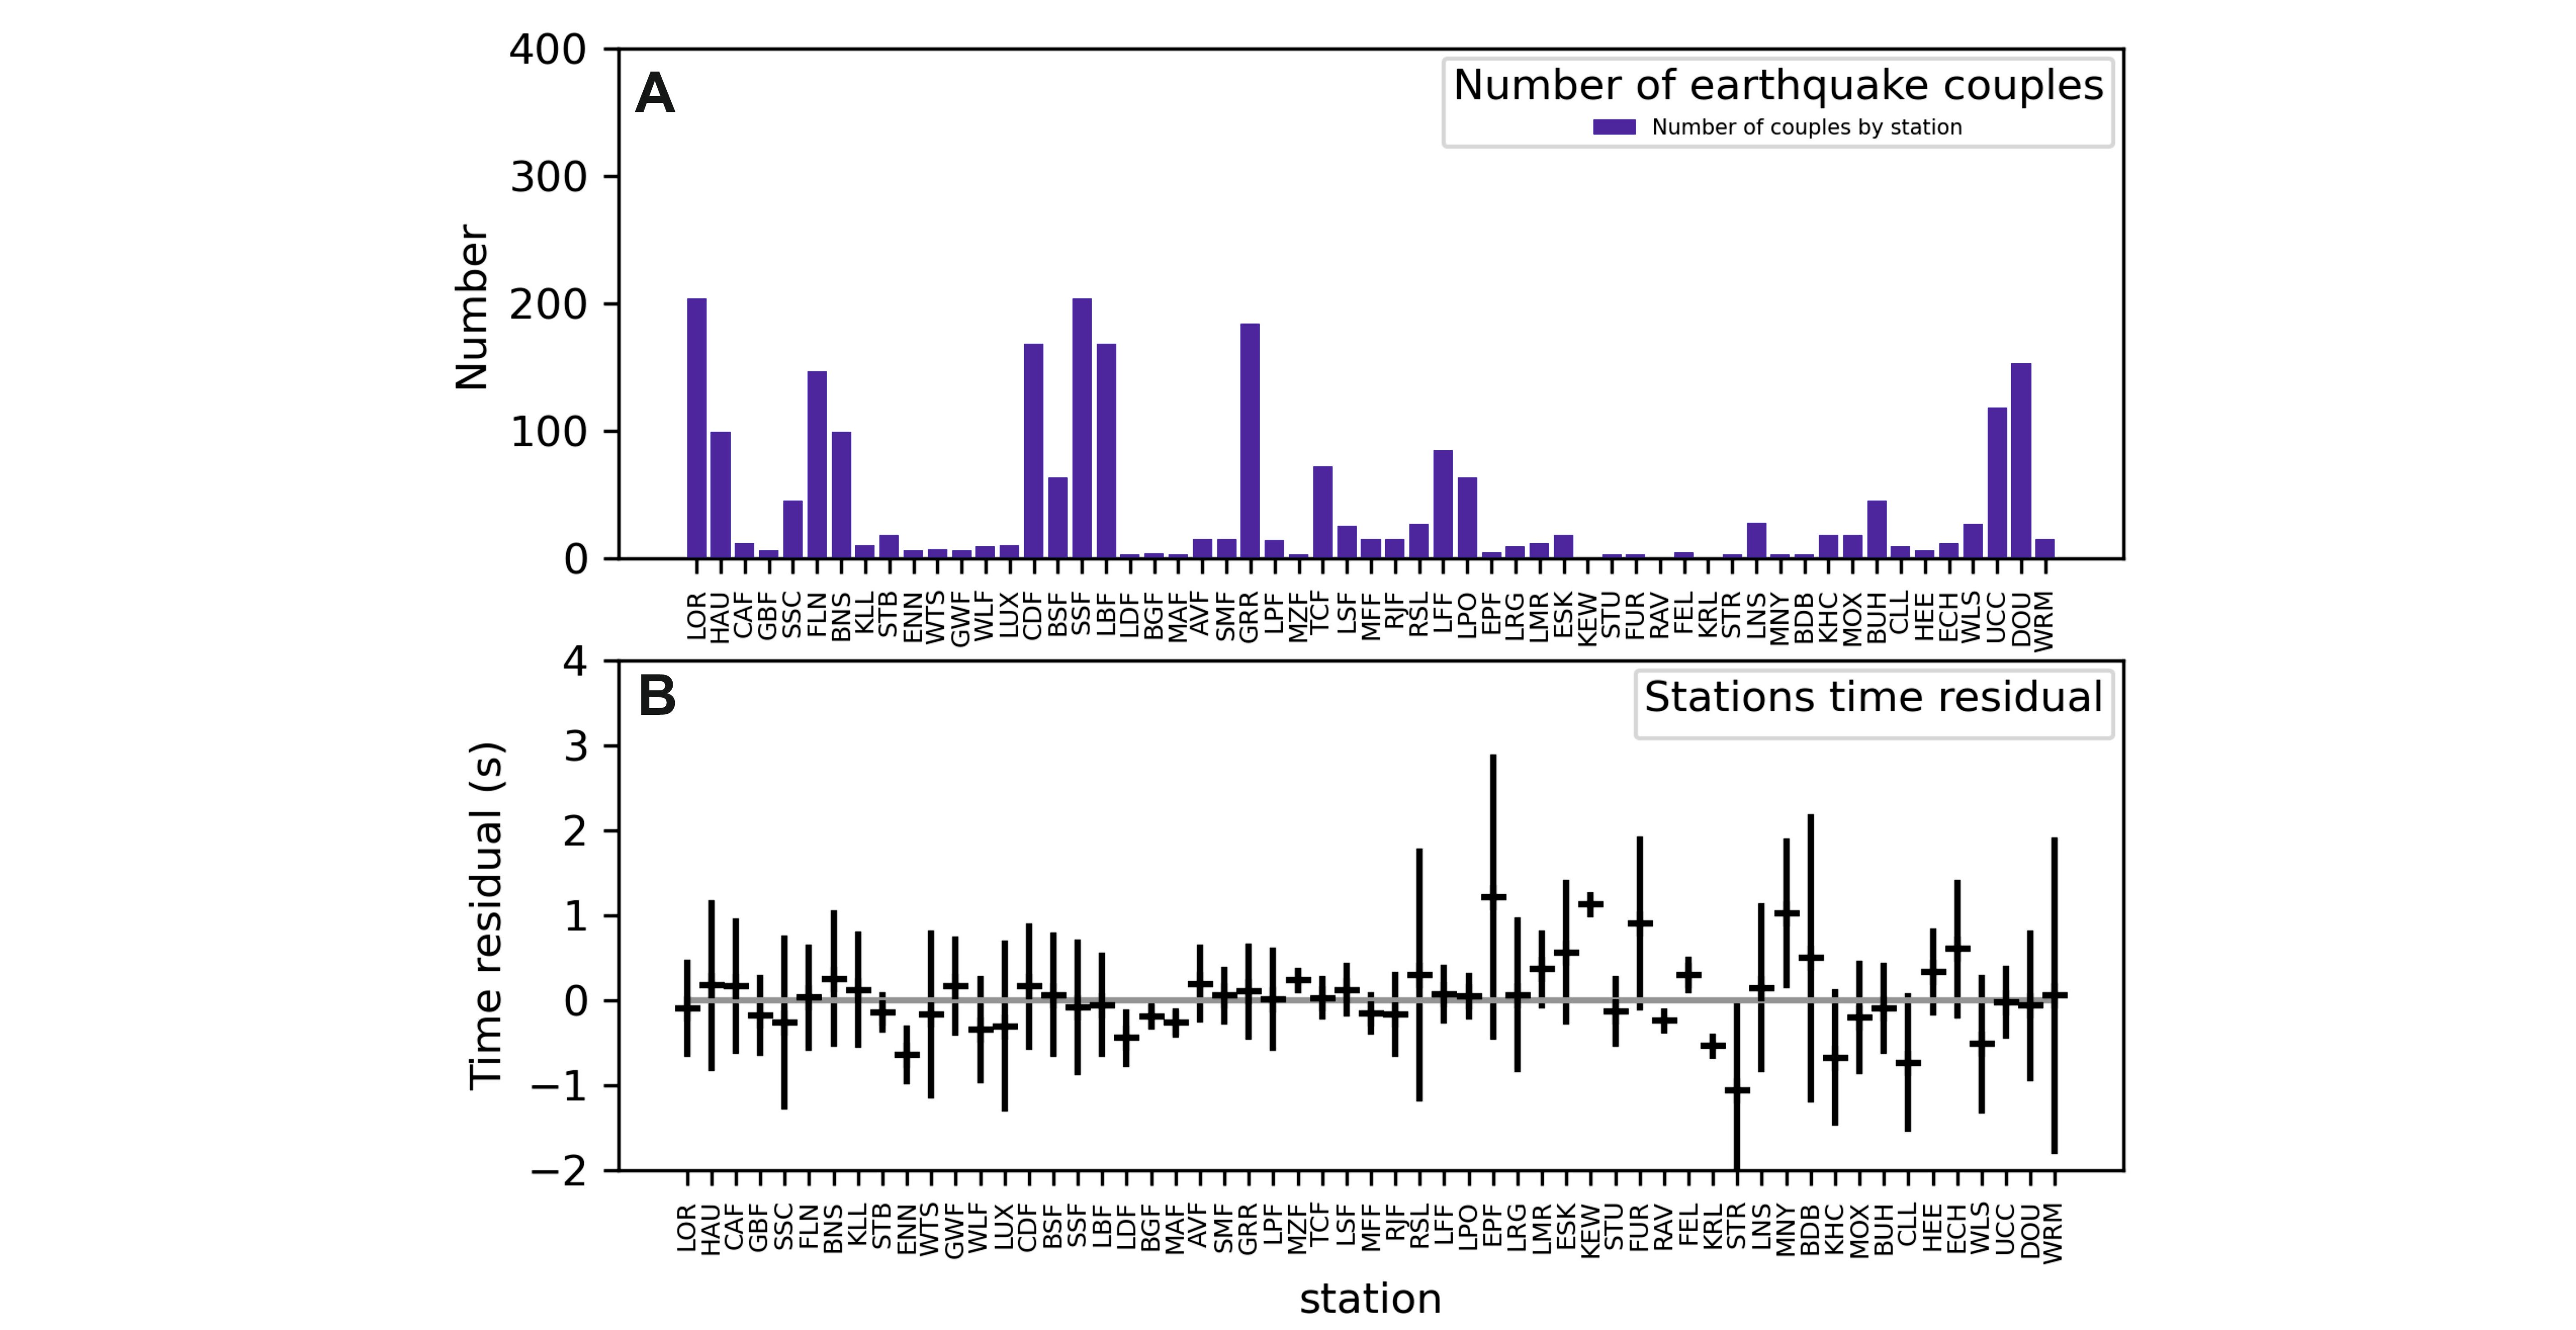
Figure 13. A. Number of earthquake couples for which difference of arrival time measurements at each seismic station is used in the location process. B. Mean and 1σ value of the residuals on the difference of arrival time measurements at each station. The three-letter abbreviations refer to their official seismic station names.
45Furthermore, the arrival time difference dataset for these two earthquakes is characterised by maximum azimuthal gaps of less than 180° for 18 earthquake couples out of 29 associated with the two events, which fulfils the necessary condition for reliable locations. However, this gap is around 300° for the couples with the master events, which gives small weights to the corresponding equations in the inversion (Fig. 6). The number of equations in the inversion process with earthquakes couples including the 4h08m and 5h47m earthquakes are respectively 246 and 188. For the 4h08m earthquake, 11 couples of earthquakes contain differences in arrival times for 10 stations, while 9 couples of the 5h47m include more than 8 stations (1 couple with 10 stations, Fig. 6). Residuals on the arrival time differences for couples including the 4h08 earthquake are respectively less or equal to 0.5 (1.0) second for respectively 11 (22) couples (Fig. 12), which is less than the assumed 1σ uncertainty for arrival time measurement of 1 s in the computations. For couples including the 5h47m earthquake, these numbers are respectively 8 and 22. Then, these three markers for the two events on 23 September 1968 (Figs 5, 6 and 12) suggest that their quality is relatively like the ones of the 9 stronger earthquakes, but the number of available data could be at the origin of a slightly lower quality of the location for these two events. These events are assigned with a Quality B level (uncertainty estimated between 2 and 4 km).
46Among the five earthquakes for which the values of the considered markers are less favourable to obtain reliable location, four of them occurred on the same day as earthquakes with Mw ≥ 3.6. Assuming that they are foreshocks or aftershocks of these events, the comparison of their location with the main shock furnishes a way to understand whether their location could be reliable. Our location of the earthquakes on 15 December 1965 at 13h42m and 13 August 1968 at 16h40m is respectively at 0.7 and 3.3 km from their probable mainshock that occurred at 12h07m and 16h57m. For the two other events on 3 November 1970 at 12h07m and on 14 September 1982 at 19h29m, the difference of location with their mainshock is far larger, respectively 10.5 and 14 km. This difference is very likely caused by errors in one or even more of the seismic phase measurements. However, these errors are not necessarily evidenced in the residuals, because they are modulated by the station azimuth in the inversion process. Hence, for events with only few data, errors in measurements can be partially hidden, resulting in a good fitting corresponding to a bad earthquake location. However, we tried to reduce this effect by doing a first computation using all the available data and considering that phase arrival time residuals greater than 3 seconds are outliers. Then, the final computation is done without them. For the events with few data, we attributed a Quality C level (minimum uncertainty estimated to 4 km).
47We also analysed our dataset to identify if some of the seismic stations introduced systematic errors in the computation. For most of the stations, the mean residual is a few tenths of a second while its standard deviation is less than 1 second (Fig. 13). It is the largest for the stations for which few data were used in the computations. Then, we were certainly not too optimistic in our modelling by assuming that our uncertainty on the arrival time measurements was 1 second. Moreover, this residual distribution by station indicates that using the mean residuals as station correction would not improve our relative locations.
6. Focal depths
48Two different approaches can be used to evaluate earthquake focal depth from Pn wave arrival time measurements.
49The first approach consists of fitting to equation (1) the available Pn arrival time measurements T0 of a given earthquake with recording distance X0. Knowing Va the Pn wave velocity and H0 the earthquake origin time, an estimation of the Pn time term a0 that depends on the focal depth and crustal velocity structure (equation S1) can be determined. In the Supplementary material S2, we computed the Pn time term with its uncertainty for 12 earthquakes of our dataset by a common inversion (upper part of Fig. 14). In this study, the origin time of the earthquakes is estimated from Sg minus Pg arrival time measurements at the seismic stations of DOU and UCC. The seismic phase velocities are the ones determined in the Supplementary material S2. The results of this time term analysis are shown in the upper part of Figure 14. Their value ranges between 6.8 and 7.5 s for 6 of the 7 earthquakes that occurred in the Centre–La Louvière coal basin. It is greater than 8.0 s for the 5 other earthquakes, three of them occurred in the Charleroi basin, and one is the 1976 Givry earthquake to the southwest outside the coal basins. However, the 1σ uncertainty on these time-term evaluations is large. Their comparison with the ones of the master events and one controlled explosion in the southern North Sea suggests that the focal depth of these 12 Hainaut earthquakes is shallow and would range between the surface and 7 ± 2.3 km, the depth of the 28-08-1992 master earthquake.
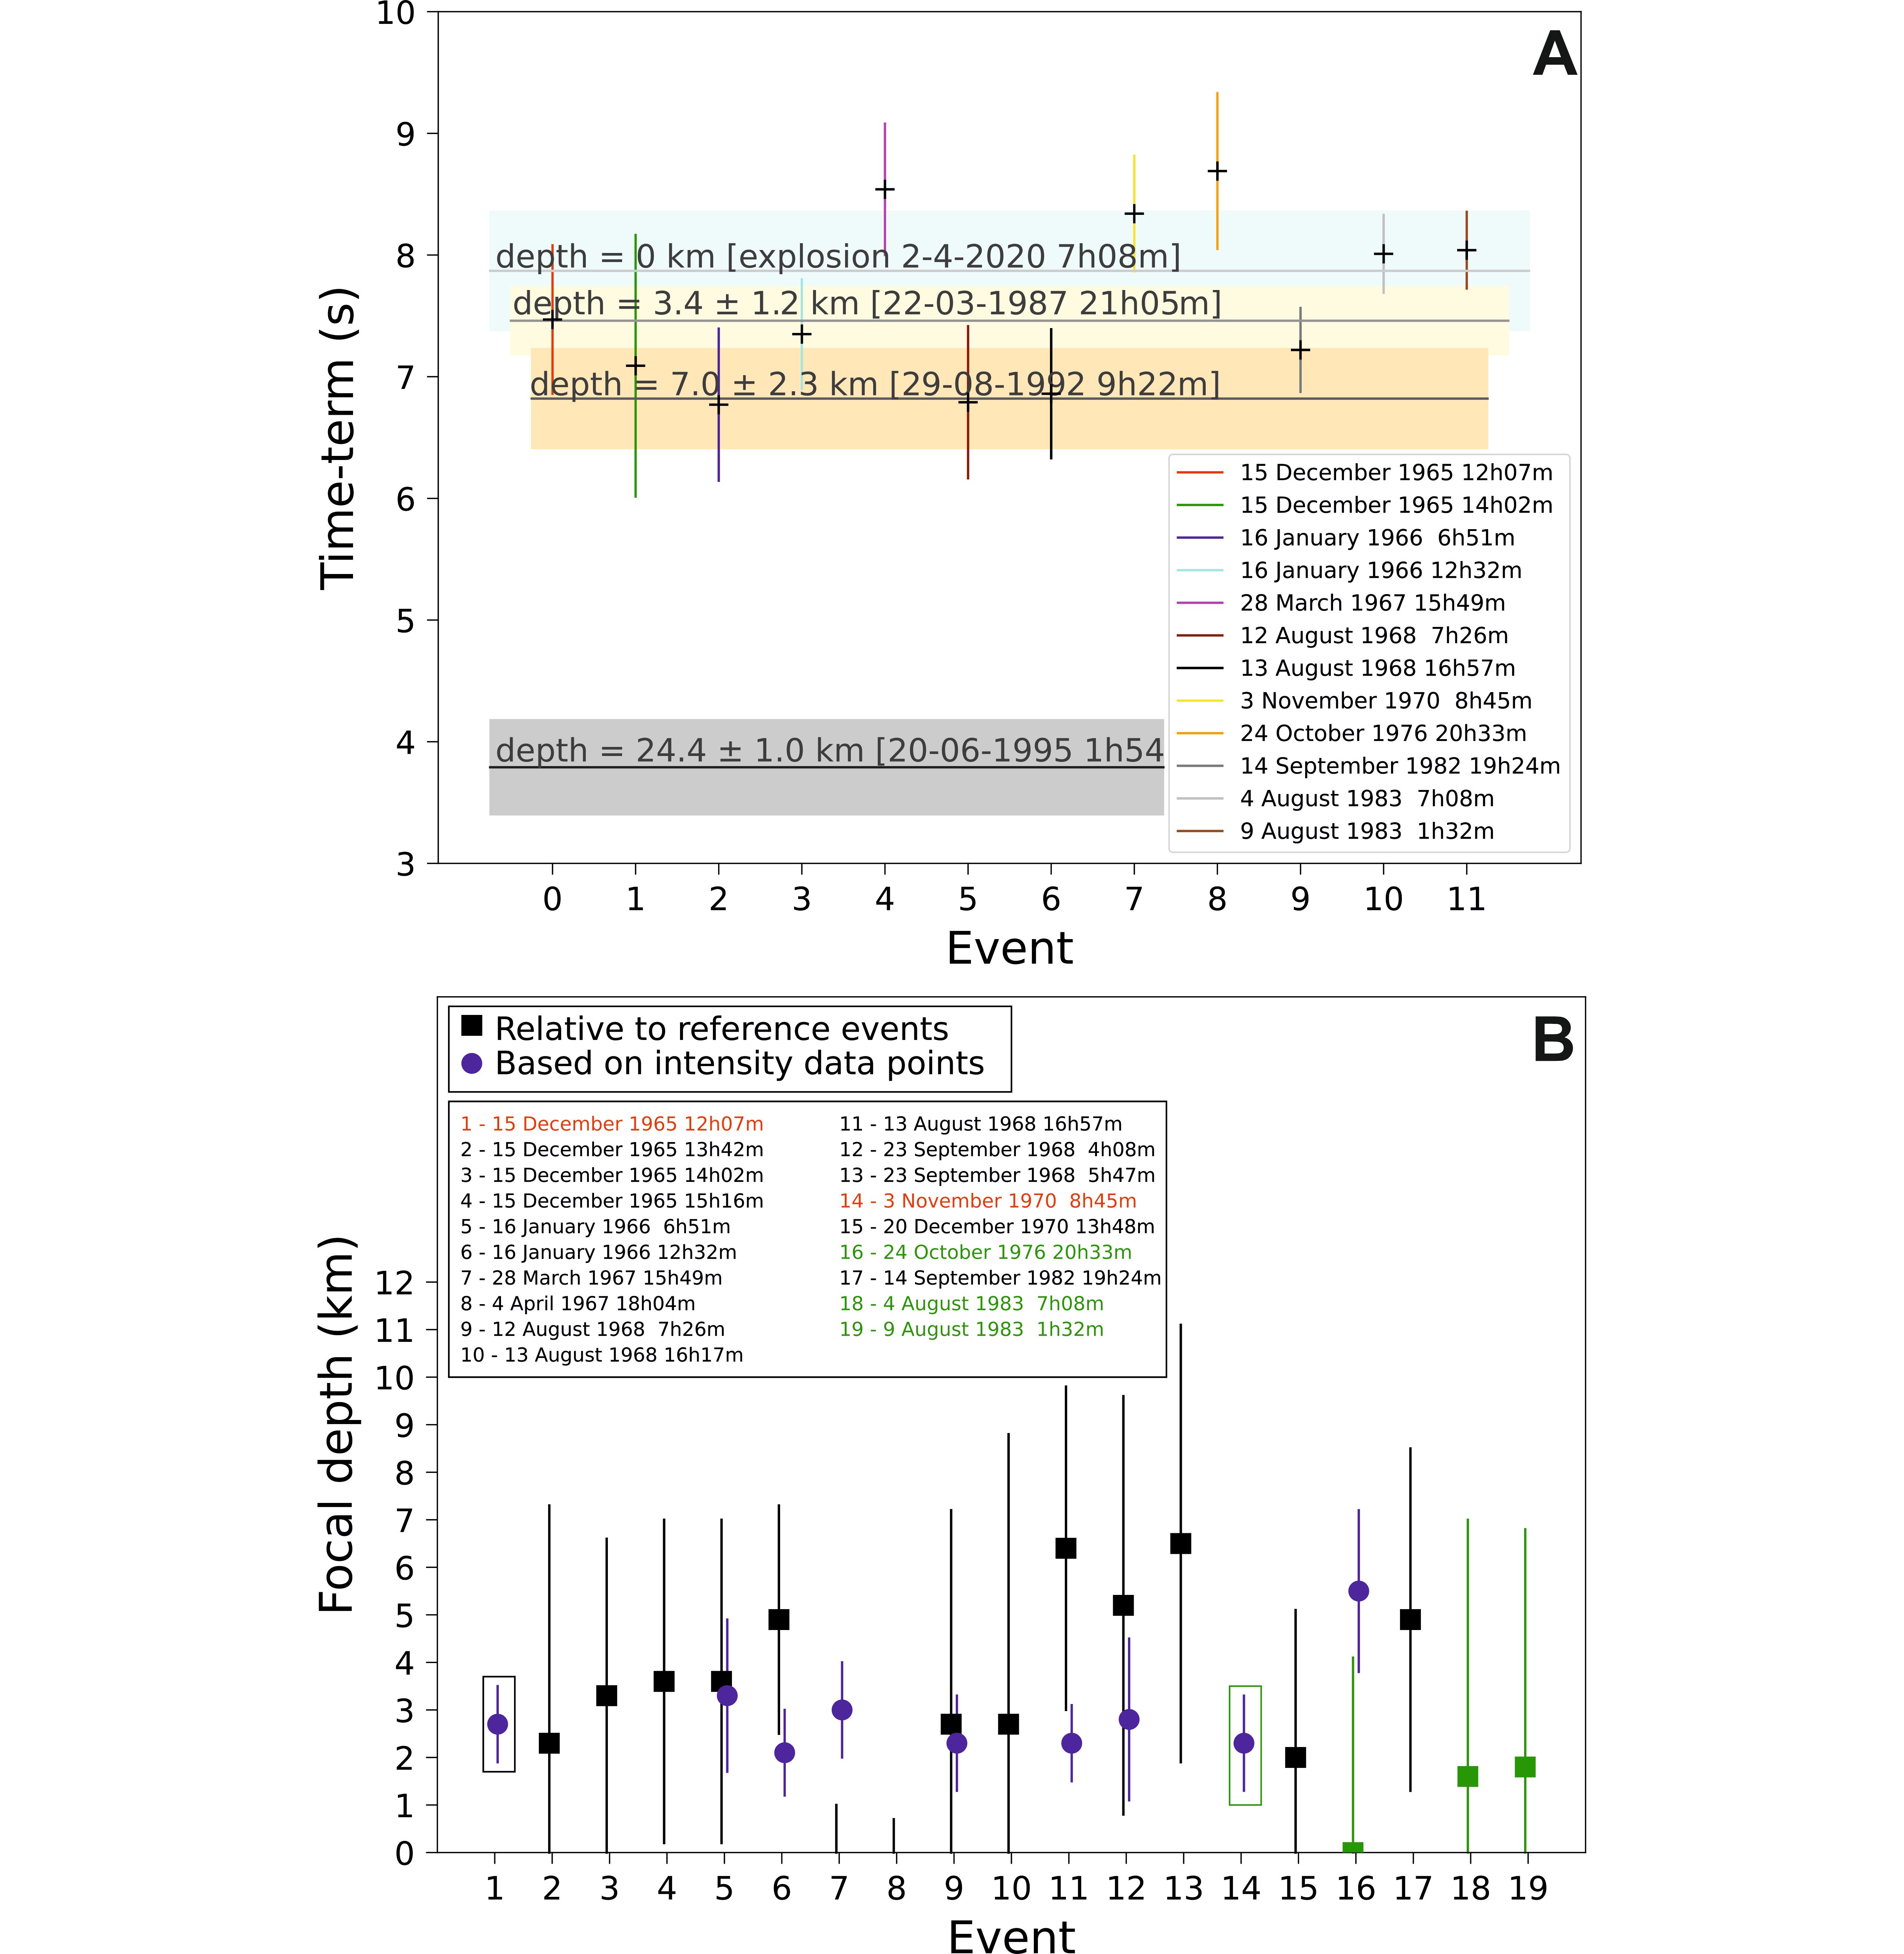
Figure 14. A. Time-terms of Pn-waves for the 12 stronger earthquakes between 1965 and 1985 and for three master events (Table 2) and one North Sea controlled explosion. B. Focal depth and their uncertainty (1σ) based on intensity data points analysis by Camelbeeck et al. (2022) (in blue) and on the difference of Pn wave time terms by comparison to the two reference earthquakes on 15 December 1965 at 12h07m (Ref1) and 3 November 1970 at 8h45m (Ref2). Information in black and green corresponds to the earthquake focal depths evaluated by comparison with the reference earthquakes Ref1 and Ref2, respectively.
50The two different classes of time terms evidence a bias in our analysis that is caused by using a model with a constant crust thickness and velocity in the crust. Events with a larger time term occur more to the South than other events. This observation can be related to the increased crustal thickness up to the Moho of the order of 5 to 10 km on a distance range of less than 100 km to the South across the Hainaut coal mining basins noticed by Sichien et al. (2012). Unfortunately, this structural anomaly of the Moho depth is not sufficiently documented to take it into account in our earthquake focal depth estimations. We therefore prefer the following relative approach.
51In this second approach, the difference of Pn time terms, resulting from the inversion of the system of equations (Supplementary material S1, eq. S10), for the two earthquakes of all the couples in our dataset allows us to estimate their focal depth difference. Afterwards, absolute focal depths can be determined by adding earthquakes in the dataset for which reliable focal depths have been determined by an independent method. Following this strategy, nine earthquakes were added and their depth was evaluated by fitting intensity distance bins with the macroseismic intensity attenuation models for the Hainaut area of Camelbeeck et al. (2022) (Table S1 and lower part of Fig. 14).
52The robustness of these macroseismic estimations is associated with the strong variation of the decrease of macroseismic intensity with epicentral distance in function of focal depth. For focal depths of 1, 2, 3 and 4 km in the Hainaut basin, a decrease of 3 intensity degrees is respectively observed at epicentral distances of around 6 km, 10 km, 15 km, and 17.5 km. To minimise the influence of the strong variation of the Moho depth between the Brabant Massif and the Paris Basin, we considered separately the two identified classes of events with different ranges of Pn wave time term. We considered two reference earthquakes (see Table 1 and Fig. 7): the 15 December 1965 at 12h07m earthquake and the 3 November 1970 earthquake at 8h45m. The first event is representative of most of the earthquakes in the Centre–La Louvière basin and is used to evaluate focal depth of the earthquakes in this area with time terms between 6.8 and 7.5 s. The second event is representative of the earthquakes located more to the south in the Charleroi basin, mainly most of the events with time terms greater than 8.0 s.
53Their respective macroseismic focal depths are 2.7 ± 0.8 km and 2.3 ± 1.0 km. Lower part of Figure 14 reports focal depths for 19 of the 26 studied earthquakes. For 17 earthquakes, it has been determined by the difference in Pn time term. In the computation, we considered a mean P-wave velocity V0 = 4.5 km/s for the upper crustal layers in which the Hainaut seismicity occurred, based on coal layer Two-Way-Traveltime (TWT) mean velocities in the H1 and H9 seismic profiles of la Companie Générale de Géophysique (Dejonghe et al., 1992) shot through Hainaut in 1979 (see their location on Fig. 1). The uncertainty on these focal depths is relatively large and is a combination of the uncertainty on the origin time of the earthquakes and on the difference of Pn time term. A good coherence is also observed for the nine events for which focal depth was evaluated from macroseismic data.
7. Discussion
7.1. Relation between Hainaut seismicity and the local geological tectonic structure
54Figure 15 shows a synthetic map including local geology, tectonic faults and the earthquake activity for three discussed periods of known seismic activity in the Hainaut area, including: (i) the 1887–1965 macroseismic catalogue (Camelbeeck et al., 2022), (ii) the 1965–1985 microseismic catalogue (analyses and locations of this paper) and (iii) the post-1985 microseismic catalogue corresponding to the period of continuous monitoring since the installation of the modern seismic network in Belgium in 1985. Figure 16 shows the interpretative Jeumont cross-section of the ECORS deep seismic reflection profile (Raoult, 1986). Relocated Hainaut earthquakes have been laterally projected on this profile using the Northing Lambert72 coordinate of the earthquakes.
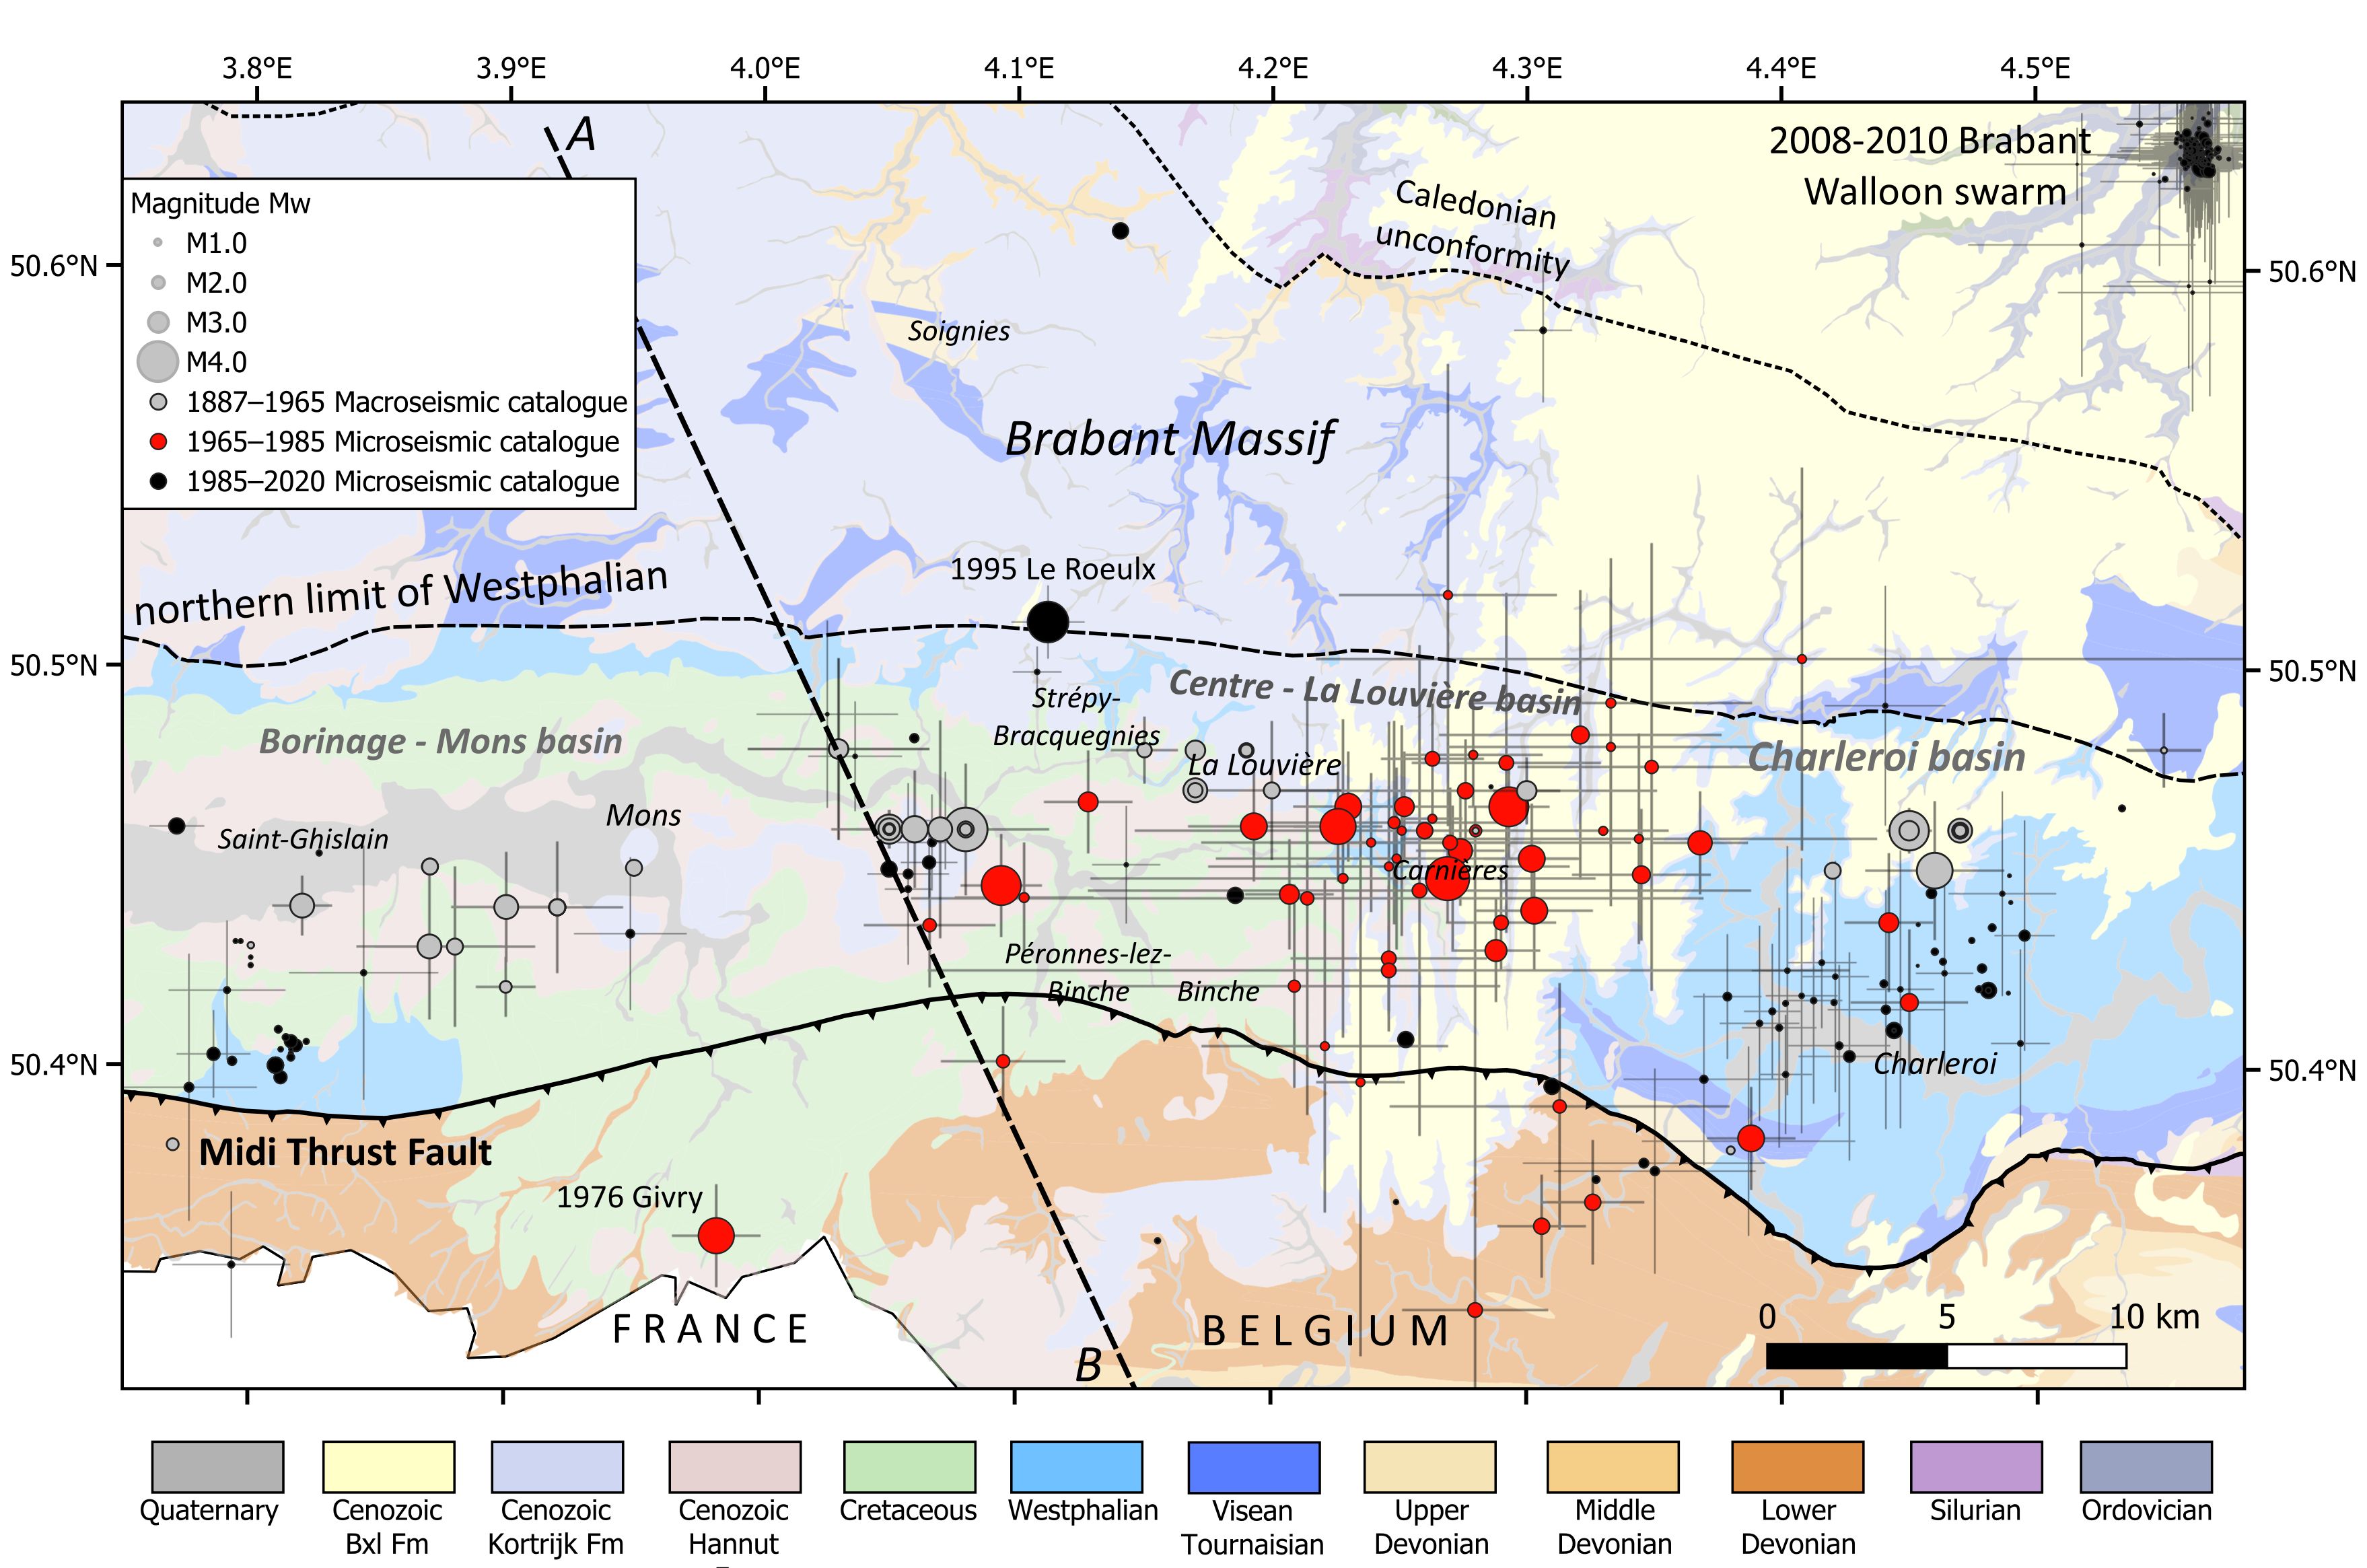
Figure 15. Overview of 1887–2020 Hainaut seismicity in relation to the local geology. Black dashed line shows the location of the NNW-SSE cross-section in Fig. 16.
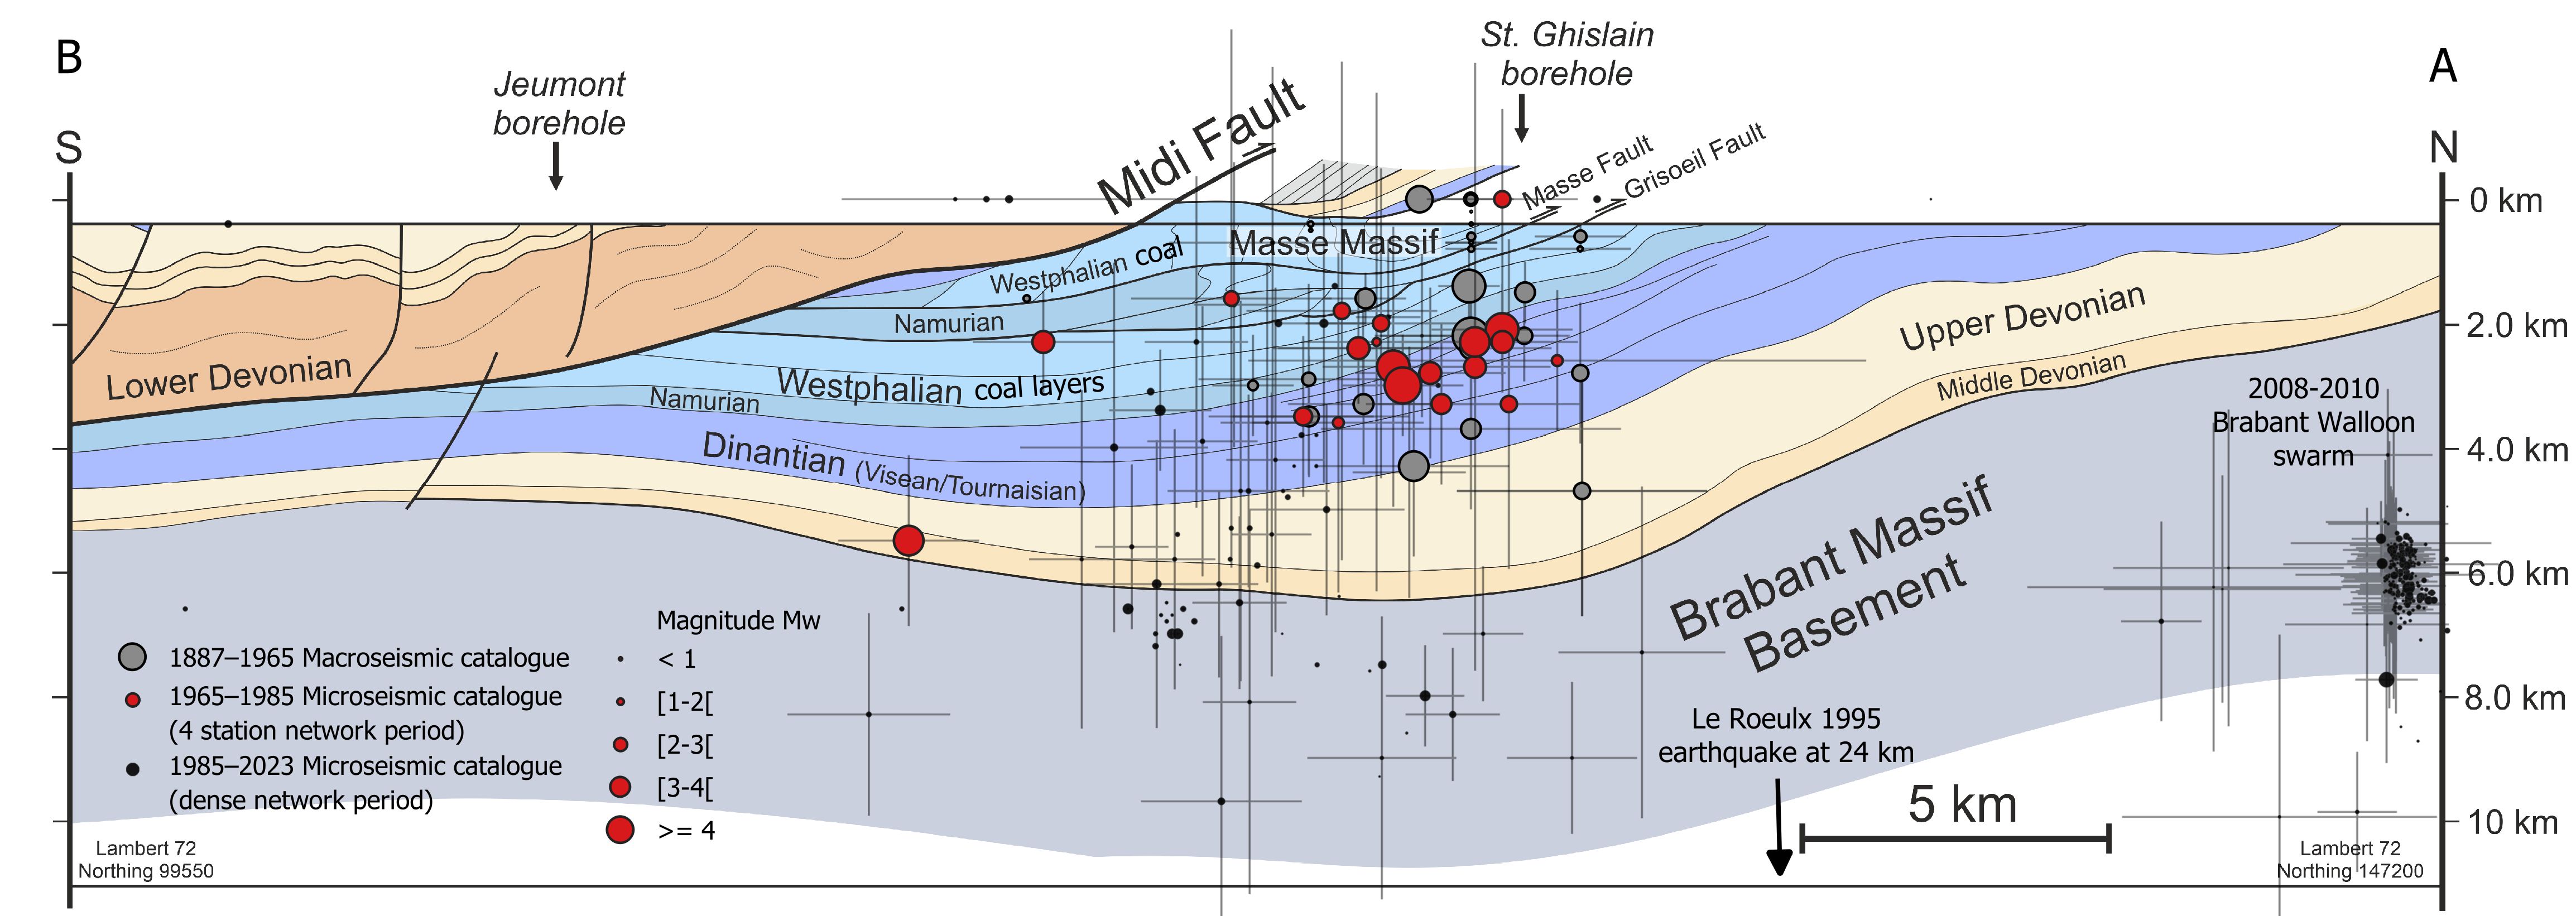
Figure 16. Hainaut earthquake activity laterally projected along the Lambert72 Northing coordinate on an SSW-NNE cross-section through the Hainaut coal basin. Grey lines show uncertainty on the earthquake locations. Three different periods are shown: (1) 1887–1965 macroseismic events; (2) 1965–1985 seismicity (this paper) and (3) post-1985 events (ROB catalogue). Note the limited depth of (1) and (2) compared to the microseismic activity of (3). Cross-section based on the Jeumont section of the ECORS profile (Raoult, 1986). For colour legend, see Fig. 15. Structure of the Brabant Massif is unresolved.
55The spatial repartition of the seismic activity in the Hainaut coal area extends from the Borinage–Mons basin across the Centre–La Louvière basin to the Charleroi basin (Fig. 15). The annual seismic moment release (Fig. 17) shows the inhomogeneity of the earthquake activity inside the three coal mining basins indicating that: (1) the most important period of activity in Hainaut is the seismic episode between 1965 and 1970 in the Centre basin and partly in the Charleroi basin, (2) the Centre basin is the most active of the three coal basins, essentially due to the Havré sequence in 1948–1949 and the 1965–1970 episode, (3) the strongest episode of activity in the Charleroi basin occurred in 1911 in its northern part, and (4) the Borinage was seismically less active than the two other Hainaut basins.
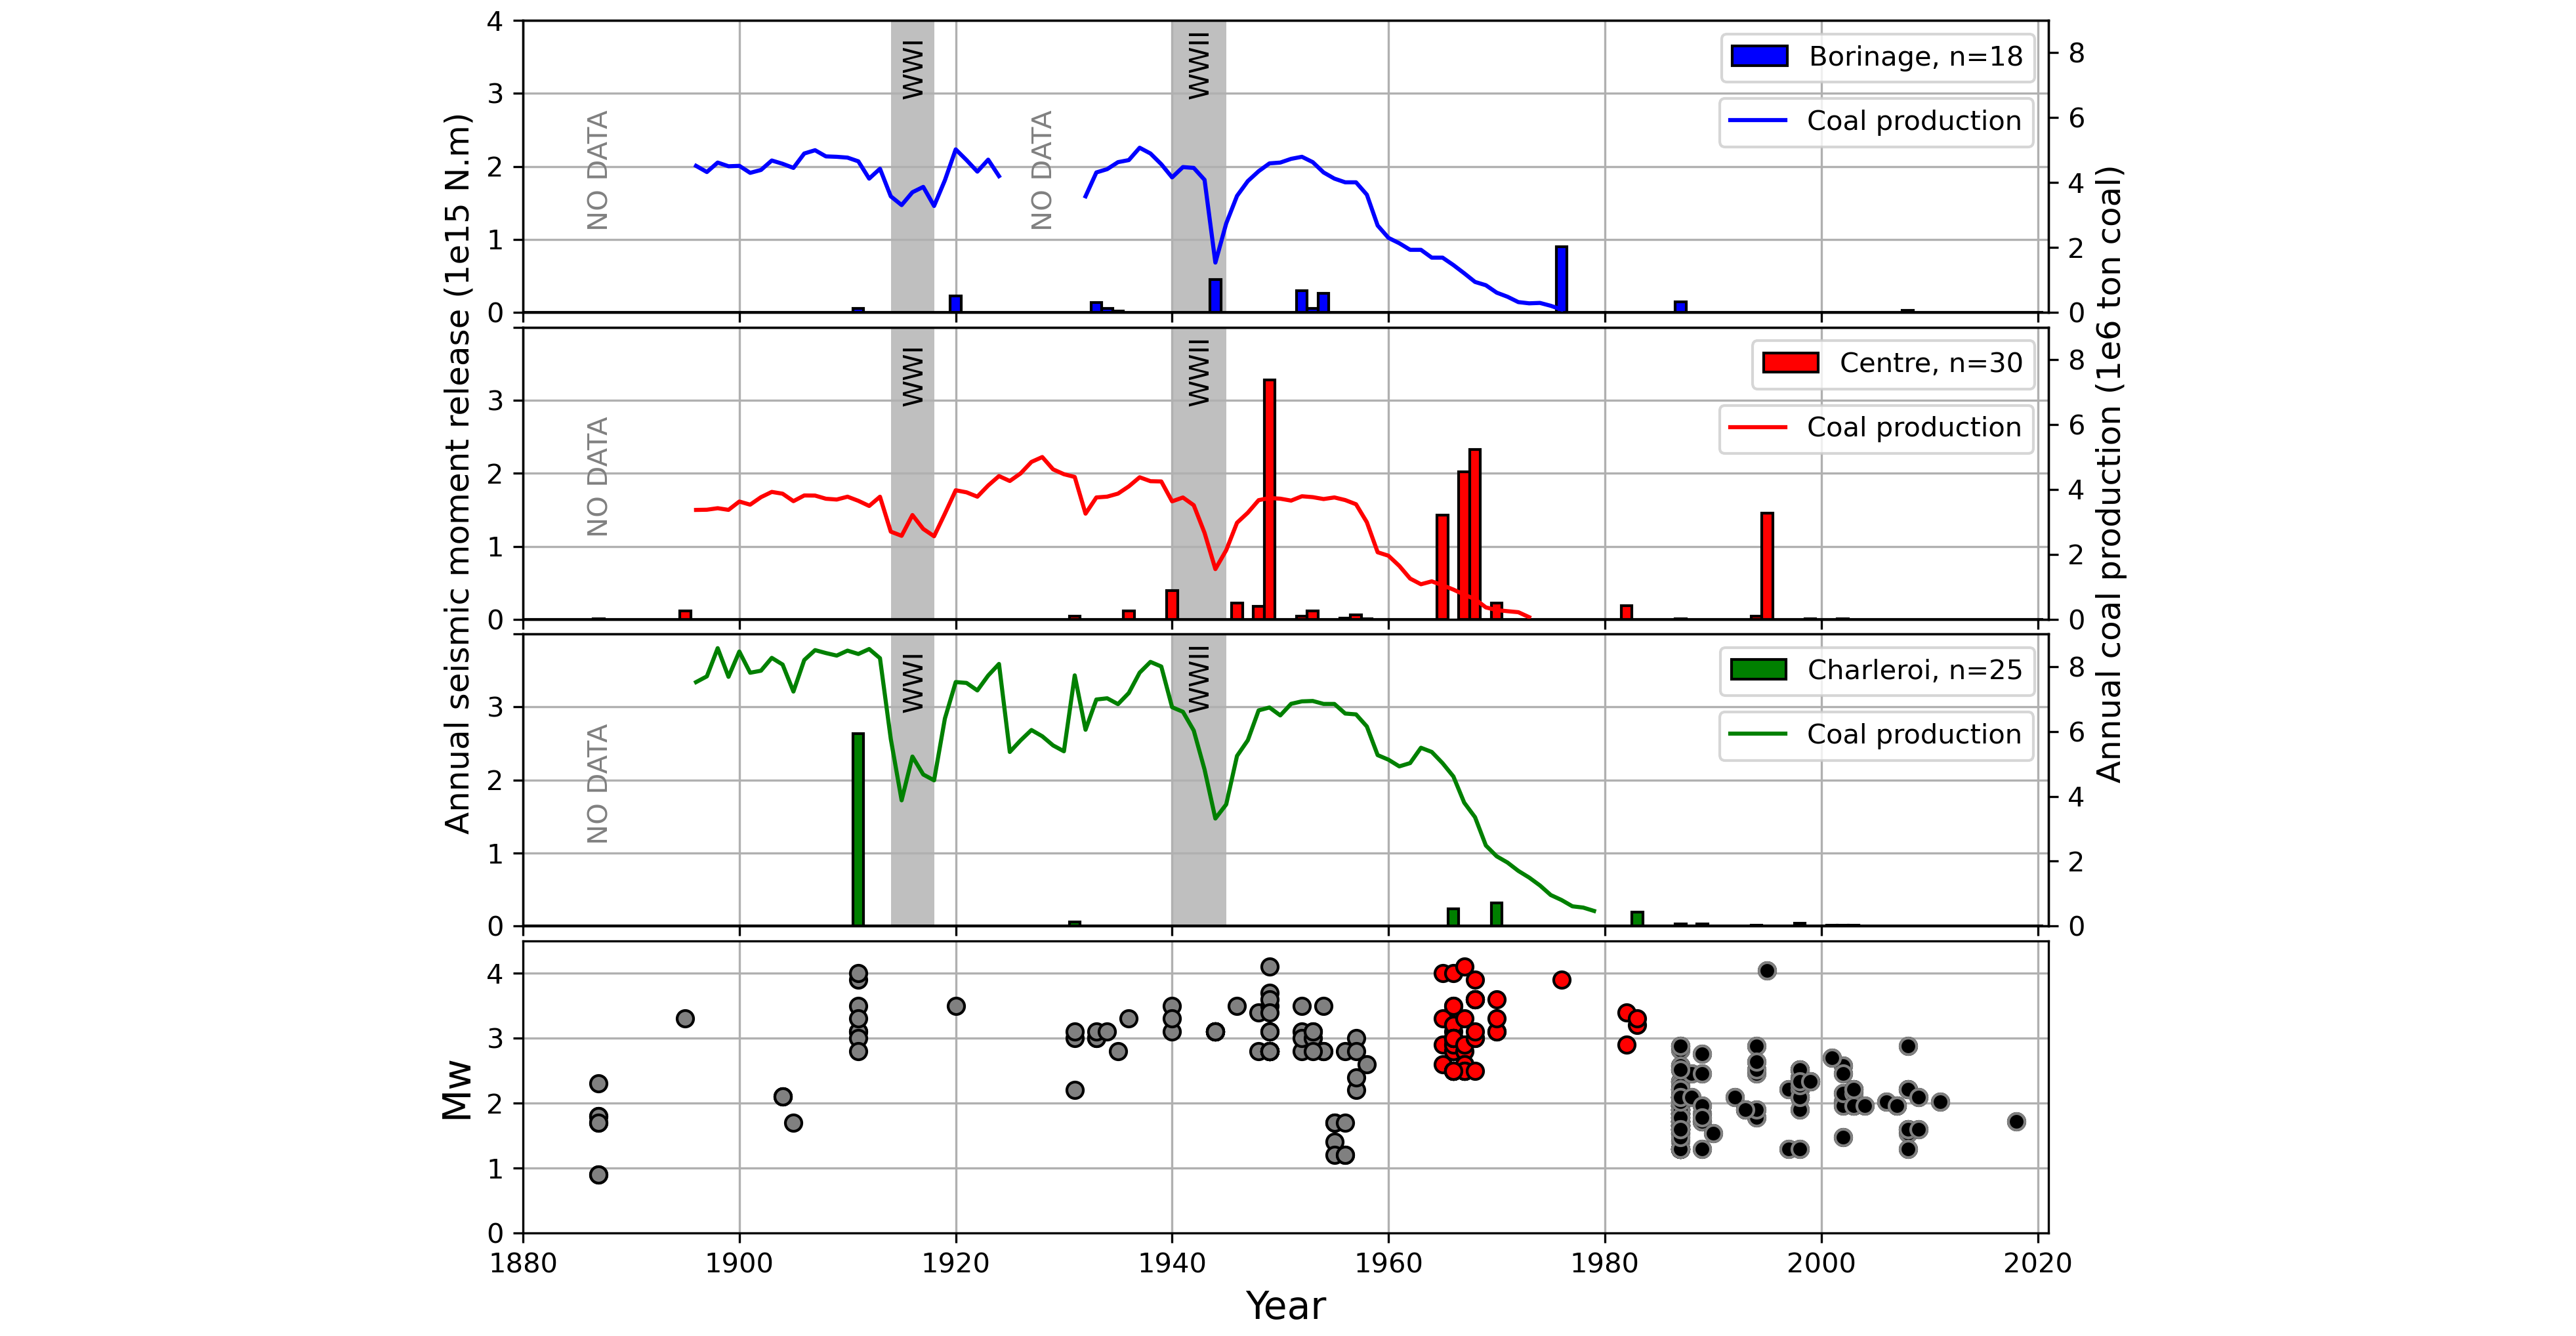
Figure 17. Correlation between annual seismic moment release (histograms; N.m = Newton metres) and annual coal production (full coloured lines) for the three different coal mining basins from 1880 to 2020. Annual coal production per basin is only available from 1896 onwards (Descamps, 2009), but production of large volumes already started at the beginning of the 19th century. Mining operations stopped at the end of the seventies in the Borinage, Centre and Charleroi basins. Bottom figure shows moment magnitude (Mw) evolution through time for the pre- to early-instrumental period (grey dots), for the 1965–1983 period (red dots) and for the post-1983 period (black dots).
56Most earthquakes spatially occurred inside the coal extraction limits except for the two Mw ~ 4.0 1976 Givry and 1995 Le Roeulx earthquakes, which occurred outside the Hainaut coal basin. Based on their focal depth, the Givry earthquake is located at the base of the Middle Devonian unconformity over the Brabant Massif basement underneath the Midi Thrust Fault while the Le Roeulx earthquake occurred at a depth of 24 km inside the Brabant Massif basement (Fig. 16). Focal depths indicate that most of the earthquakes prior to 1985 occurred inside the upper Palaeozoic part (Westphalian and Dinantian) of the Brabant Parautochton, but below the excavated Westphalian coal layers. After 1985, only low-magnitude earthquakes have been recorded by the modern network. These events are usually deeper and located either at the base of upper Palaeozoic or within the lower Palaeozoic of the Brabant Massif basement.
57Similar small deep events may also have occurred during coal mining, but as they are only detectable by a dense sensitive seismic network, their detection may have been missed at that time. Because of the lateral projection on the conceptual cross-section, it is at this stage not possible to make tentative suggestions on specific fault systems responsible for the Hainaut seismicity. A few earthquakes have very shallow focal depths, around 1 km or below. Most of them occurred during the coal mining period and were very likely induced by mining. These rock failure events (Cook, 1976) are different from aseismic events observed up to the surface and related to collapses and subsidence due to excavation (M. Dusar, pers. comm., 2024).
7.2. Improved fault-plane solutions and seismotectonic context
58We recomputed fault-plane solutions for eight earthquakes that occurred between 1965 and 1985 (Fig. 18 and Table 4). The mechanisms are based on the first motion polarity of the first P-wave phase, respectively Pg and Pn waves at local and regional distances. Compared to the solutions of Camelbeeck (1990, 1993) and Camelbeeck et al. (2007), we benefited from a better evaluation of the focal depth of the events and more station data.
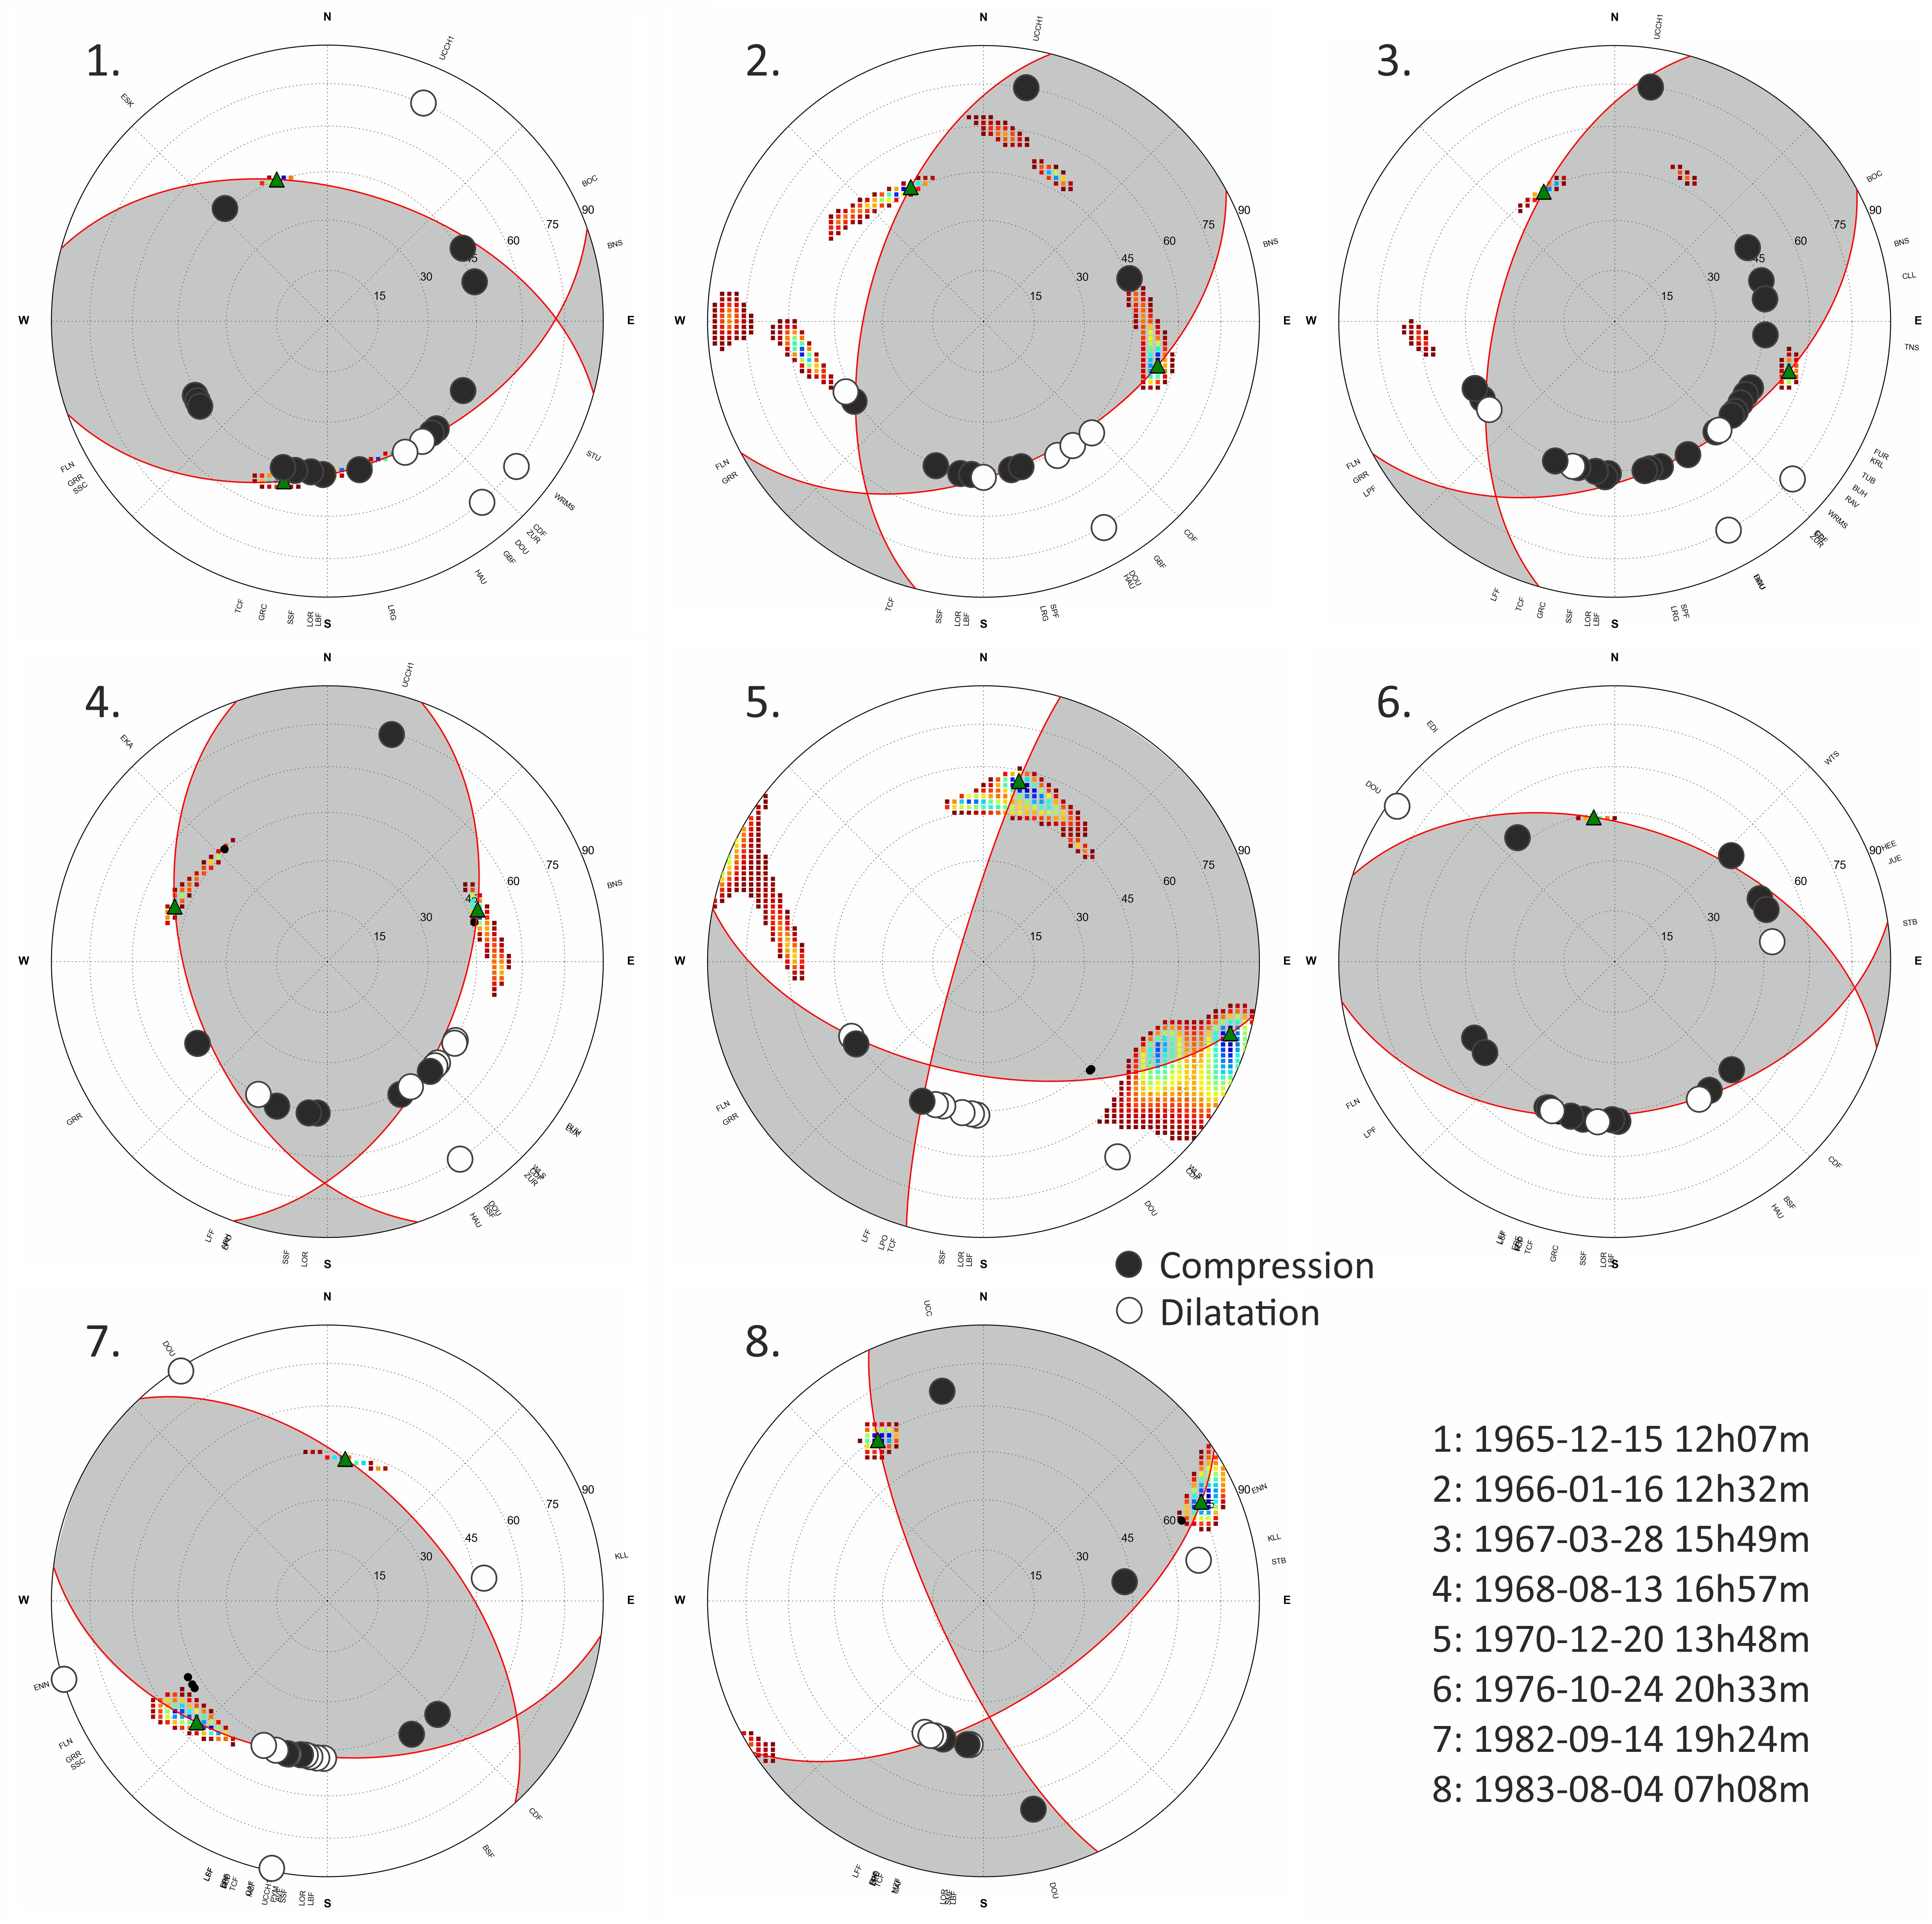
Figure 18. Re-evaluated fault-plane solutions of Hainaut earthquakes between 1965 and 1985. The 0.95 confidence level of the slip vector in the two nodal planes is shown as coloured regions on the focal spheres.
Table 4. Focal mechanisms for Hainaut earthquakes for the period 1965–1985. Strike1, dip1 and rake1, and strike2, dip2 and rake 2 (in degree) are the strike, dip, and rake of the first nodal and second nodal plane, respectively.
|
Nr |
Date |
strike1 |
dip1 |
rake1 |
strike2 |
dip2 |
rake2 |
|
1 |
15-12-1965 12h07m |
285 |
50 |
114 |
70 |
45 |
64 |
|
2 |
16-01-1966 12h32m |
194 |
55 |
58 |
62 |
46 |
127 |
|
3 |
28-03-1967 15h49m |
196 |
55 |
60 |
61 |
45 |
126 |
|
4 |
13-08-1968 16h57m |
20 |
49 |
118 |
161 |
48 |
61 |
|
5 |
20-12-1970 13h48m |
196 |
82 |
34 |
101 |
56 |
171 |
|
6 |
24-10-1976 20h33m |
288 |
49 |
108 |
82 |
44 |
70 |
|
7 |
14-09-1982 19h24m |
317 |
54 |
116 |
97 |
43 |
58 |
|
8 |
04-08-1983 07h08m |
155 |
76 |
32 |
57 |
59 |
163 |
59The upper part of Figure 19 shows the geographical repartition of these mechanisms combined with those determined by Englert (1995) for four 1987 Dour earthquakes and Camelbeeck et al. (2007) for three other earthquakes after 1985. The background of this map provides information on the stress generated at the local scale by the lateral variations of topography and density in the crust. These local stress sources are derived from the second spatial derivative of the geoid (Camelbeeck et al., 2013). The local stress regime deduced from the geoid shows that the Mons, the Centre–La Louvière and Charleroi basins are all in compression (blue background colour on Fig. 19). Within the Centre basin, the stress regime is more transpressive (softer blue colour). North of the Westphalian border inside the Brabant Massif, the local stress sources indicate extension (red colour). In between the Hainaut region and the Brabant Massif, a strike-slip regime must be present as conversion from compression to extension always must move over a strike-slip regime (Vandycke, 2002; Van Noten et al., 2012). South of the Midi Thrust Fault, the generated stress regime is less pronounced. In the following part, we investigate if the Hainaut focal mechanisms are compatible with these observed local stresses derived from the second derivative of the geoid. The link between these both tools has already been demonstrated to work well for the 2008–2010 seismic swarm in the Brabant Massif (Van Noten et al., 2015).
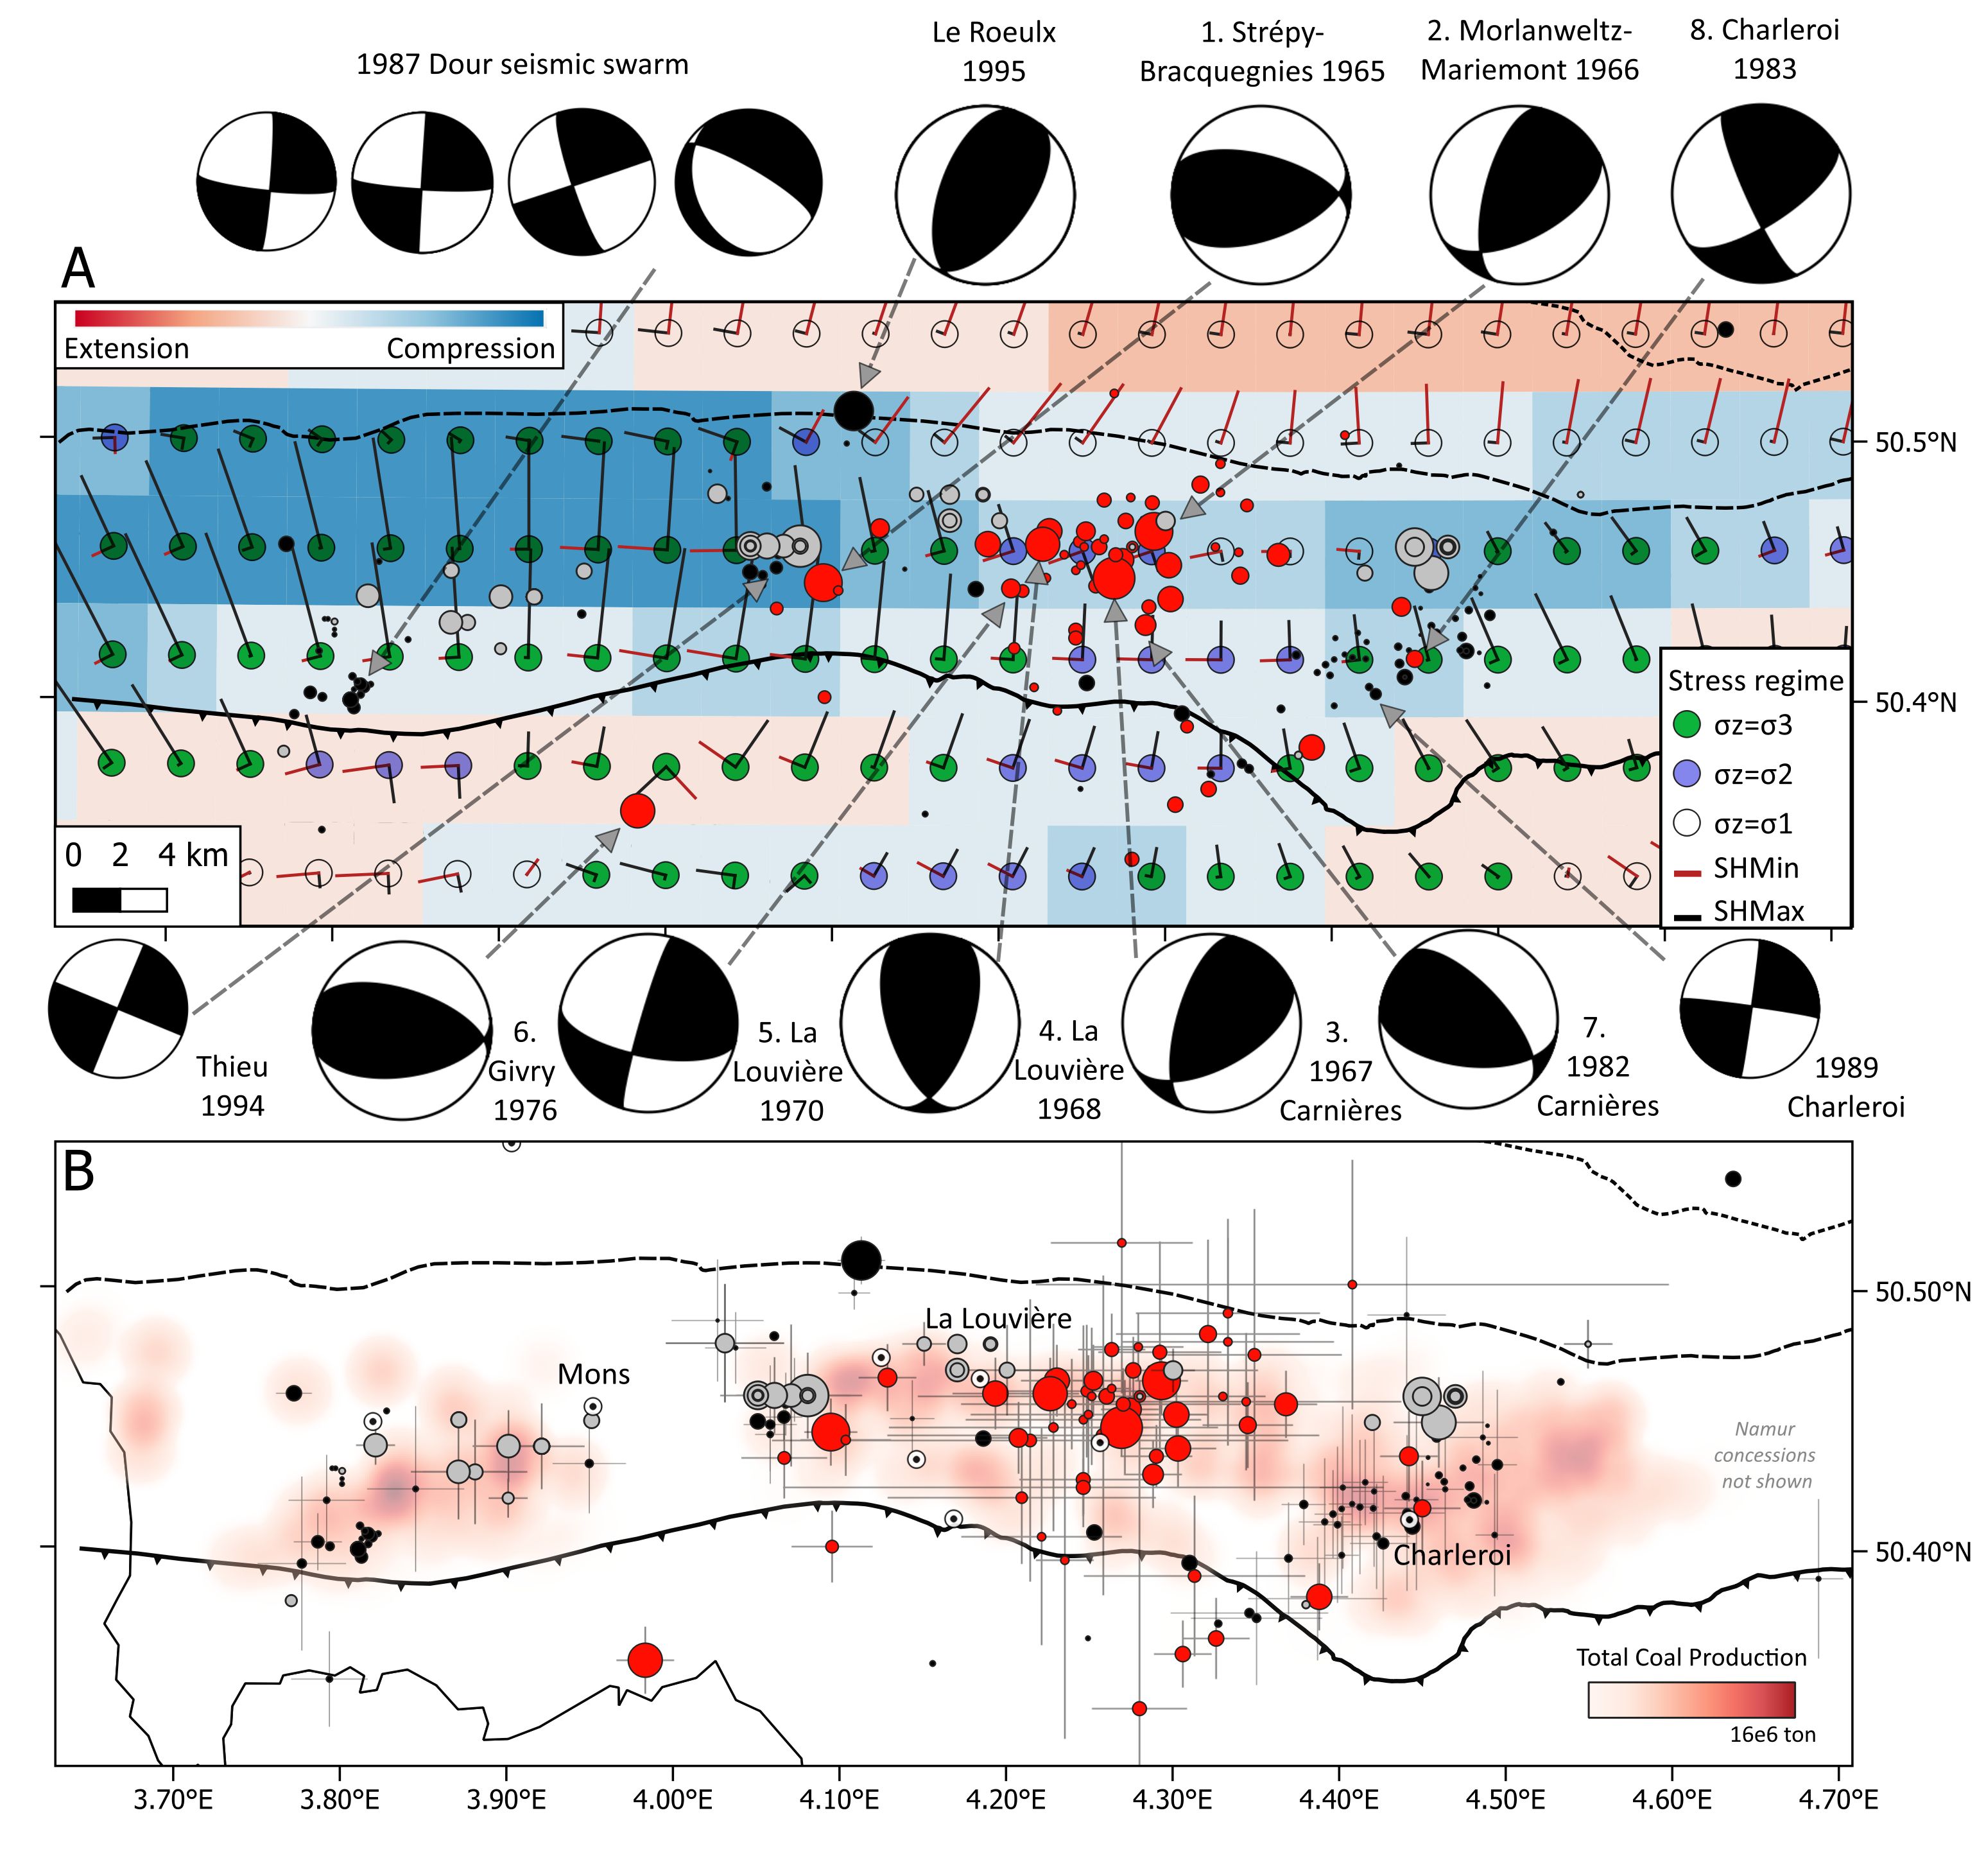
Figure 19. A. Fault-plane solutions of the largest earthquakes in the Hainaut coal mining region in relation to the 2nd derivative of the geoid (Camelbeeck et al., 2013). Coloured circles show the local stress regime while the intensity of the background colour represents the change in differential stress from extension to compression. Red and black bars show the size and direction of each horizontal principal stress component. See Fig. 16 for explanation on the colours of the seismicity data. Numbers one to eight refer to earthquakes listed in Table 4. B. Relation between seismic activity (dots) and total coal production produced by all concessions in Hainaut coal area since 1896 (Descamps, 2009).
60For most stations reported on the focal mechanisms, the take-off angle from the seismic source is the same because they are measured on Pn waves, regardless of the distance of the station to the earthquake. As a result, those first motions (compression or dilatation) are all plotted at the same distance from the centre of the focal sphere. Combined with only a few Pg motions, this can result in a poorly sampled focal sphere, which results in large or multiple confident regions for the possible solutions. This is the case for events 2 and 5 (Fig. 18). This does not mean that the obtained solutions for those events are not of interest to our analysis. The comparison of the 0.95 confidence area of the slip vectors for events 2, 3 and 4 indicates a coherence between them and suggests that these three earthquakes could have a similar thrust mechanism with a small strike-slip component along NNE-SSW faults. These earthquakes are among the four larger earthquakes in the Centre basin and as such correspond to an important part of the deformation caused by the seismicity in this area. The maximum likelihood solution for event 5 that occurred close to these earthquakes is a strike-slip mechanism with a significant thrust component, which is also compatible with the mechanisms of 2, 3 and 4. The mechanism of the strong event 1 in the western part of the Centre basin is well determined and corresponds to a thrust fault with the two E-W striking nodal planes. The fault mechanisms of these five earthquakes are fully compatible with compressive to transpressive local stress sources determined from the geoid.
61Event 7 which also occurred in the Centre basin shows a nearly pure thrust mechanism with a strike in a direction perpendicular to the other five events of the area, parallel to the Variscan tectonic structures. It is similar to the fault-plane solution for the 1976 Givry earthquake (event 6). Also, these mechanisms agree with the local stress sources. The mechanism of event 8 in the Charleroi basin is a strike-slip event with a small thrust component, which poorly fits the local stress sources.
62Computing fault-plane solutions for events after 1985 was only possible for a few events that were sufficiently strong to be recorded by the modern Belgian seismic network. Despite its great focal depth of 24 km, the 1995 Le Roeulx earthquake focal mechanism is similar to the ones of the shallow stronger events (numbers 2, 3 and 4) in the Centre basin. This suggests a compressive local stress field consistent at the crustal scale in and near the western and central part of the Centre basin.
63The only mechanisms computed for the Borinage basin are the ones of the Mw = 2.0–2.5 earthquakes of the 1987 Dour seismic sequence. Three of them are quasi-pure strike-slip faulting and are compatible with the transtensional to transpressive stress sources defined by the geoid at the southern limit of the Borinage basin but are different from the nearly North-South strong compressive stress inside the basin. The focal mechanism of the 1989 Charleroi shows pure strike slip, which is more difficult to relate with the local stress sources as it is in a region where differential local stress is small with a stress regime rapidly changing spatially (illustrated by different coloured circles and background colours in Fig. 19).
7.3. Origin of the Hainaut seismicity
64The relationship between Hainaut seismicity and mining was controversial during the mining industry period but this discussion was spoiled because of the economic importance of coal mining in Belgium (Troch, 2016, 2018). Up to recently, the general understanding in the Belgian earth sciences community is that this seismicity would be of natural origin because most of the earthquake sources occurred deeper than mining works (Fourmarier & Charlier, 1950), into the Dinantian and the Brabant Massif basement. The low seismicity rate in Hainaut since the installation of the modern network in 1985 explains the lack of recent investigations on the subject. However, the strong decrease in earthquake activity since the end of mining in the 1970s clearly suggests that mining played a role in causing this seismicity. The discussion was recently reopened by Descamps (2009, 2010) who created a database of coal production out of the Annales des Mines de Belgique for all the concessions in the three Hainaut basins since 1896. Descamps also showed the difficulty of proving an unambiguous link between individual earthquakes and close-by coal production in space and time. Recently, in the worldwide dataset of earthquakes associated with human activities from Klose (2013) we found new arguments to re-open this discussion.
65In our dataset, several small seismic events before 1960 were not detected by any Belgian seismic station but were felt locally by the population. From their effects at the surface, we estimated their focal depths below 1 km which directly corresponds to mining depth (Camelbeeck et al., 2022). Although their mechanism is unknown, they should have occurred inside or near the mine galleries during the period of coal production and could be induced by one of the four different types of rock failures described by Cook (1976): i.e. rock falls resulting from loosened wall material falling inside the galleries, or rock bursts or bumps resulting from strong breakings, or outbursts corresponding to ejected rocks in the mines by a rapid gas release. Current modern practices allow locating and studying the mechanisms of such failures using modern seismic networks (e.g. Bischoff et al., 2010, Olivier et al., 2015).
66Many other earthquakes in Hainaut, even if they are considered shallow, occurred at depths greater than the mining works and some reached Mw greater than 4.0. However, the uncertainty on their focal depth (Fig. 14) suggests that some of them could also have occurred close to the exploitation zone. Hence, the Mw = 4.0 of 15 December 1965 was felt by workers inside mine galleries close to its epicentre, but without damage or observed movements and perturbations inside the galleries, while it was destructive on large areas at the surface, suggesting that the event was not directly related to works in these mines. We compared our gathered information with numerous examples of worldwide seismicity stimulated by mining for which causative forces and their importance, tectonic context, and pore pressure influence have been studied (Klose, 2013; Mc Garr et al., 2002). In conclusion, the characteristics of the Hainaut seismicity (mechanism, location, magnitude, timing) compared to the location, timing, and quantity of coal production in the Hainaut concessions perfectly fit with these worldwide statistics and strongly support the hypothesis of the triggering of a large part of this seismicity by mining. This hypothesis is supported by the following seismological arguments:
-
The most favourable tectonic context to trigger earthquakes by mining is compressive, which is evidenced in the Hainaut area by our fault plane solution and geoid analysis (Fig. 19).
-
The lateral distance of earthquakes to mining operation points in the Klose (2013) dataset is less than 3 km, which is coherent with most of the observed seismicity in Hainaut (Fig. 19). A significant observation in support of the link with mining is the total absence of any events in the non-exploited area between the eastern limit of the Borinage basin and the western limit of the Centre basin.
-
Estimated focal depths in Hainaut are coherent with the observations that seismicity triggered by mining would extend down to below the depth of mining works (Klose, 2013; Mc Garr et al., 2002).
67and mining industry characteristics:
-
The total coal production in many concessions in Hainaut since 1895 ranges between 106 and 107 tons (Figs 17 and 19), which is in the range of mass changes by mining that would trigger earthquakes with Mw around 4.0 in a compressive regime, as estimated by Klose (2013). Remark that these values only give the total extraction of coal in Hainaut and that the total extraction of rock material (including burden rock) is much higher, supporting these conclusions even more.
-
Klose (2013) also observed that the delay in earthquake occurrences after the beginning of nearby mining activities ranges from 10 to several hundreds of years. This would explain the delay of the seismic activity in Hainaut with respect to the beginning of intensive coal production in the early 19th century.
68The seismic episode between 1965 and 1970 occurred at an epoch during which most of the concessions in the Centre basin were already closed (see closure dates of mine concessions in Descamps, 2009). Then, an additional factor to support the triggering of these seismic events are groundwater changes in the upper crust. During operational periods, long-term, continuous pumping to lower the water table was needed to prevent flooding of galleries. In the long term, this could have modified the ambient pore pressure in the upper crust, which is generally close to hydrostatic pressure (Zoback & Healy, 1984), which potentially led to an apparent normal stress increase. At the end of mining operations, re-flooding of the mines had the inverse effect and led to a pore fluid pressure increase resulting in normal stress reduction. Combined with coal mass removal and associated unloading, this increases the potential for fault failure. Moreover, wetting of joints and fractures may also have facilitated tectonically-induced movements (M. Dusar, pers. comm., 2024). Mining operations stopped in the Centre basin at the beginning of the seventies. This thus could explain the triggering of the 1965–1970 seismic episode because many reverse faults that were well oriented to the local stress regime were close to failure. It is also well possible that the static stress drop generated by the first event on 15 December 1965 would accelerate the triggering of other events in the Centre basin, as described for natural earthquakes by King et al. (1994) and Stein (1999). However, this should be confirmed by specific stress modelling in a future study.
69Klose (2013) mentions that triggered seismicity can last for decades after mining stops, which suggests that the recent post-mining events inside the Hainaut coal basin could still be related to this industrial activity. Moreover, methane drainage and gas-storage activities continued into the 21st century in the Hainaut basin and flooding caused a significant uplift of the surface area above the mines in a way similar to the Campine Basin (Declercq et al., 2023). Given the strong reduction of seismicity, these activities seem to have less seismic impact than the coal and burden extraction. Also, the mine-related triggered earthquake occurrences described in this work are clearly different in nature than current induced events caused by geothermal exploitation in the Dinantian in the Campine Basin (Kinscher et al., 2023). This study shows that faults in the Dinantian are susceptible to local stress changes due to their loading and unloading tectonic history and that the impact of anthropogenic activities within these basins should not be underestimated. By comparison, in the Ruhr-District in western Germany, the impact of coal mining is also different than that of the Hainaut basin. Earthquakes are limited to the mining depth, Gutenberg-Richter b-values are higher (up to 2 versus 0.8 in Hainaut), the largest magnitudes are limited to ML ~ 3.3, and there is a strong temporal correlation with the mining (Hinzen, 1982; Bischoff et al., 2010). These arguments favour a coal mining-induced rapid energy release resulting in many, small-magnitude, shallow seismic events (Hinzen, 1982).
70We finally hypothesise that even the Mw ~ 4.0 Givry 1976 and Le Roeulx 1995 earthquakes, and the small events that occurred down to the base of the Middle Devonian unconformity over the Brabant Massif after the end of mining, could also be triggered by mining. The current, smaller-magnitude events, which occur deeper in the basement of the Brabant Massif and can only be detected by the current dense seismic network in Belgium, may reflect the natural background seismicity.
8. Conclusions
71In this work, we relocated the 26 strongest earthquakes that happened in the Hainaut coal basin between 1965 and 1985. Our relocation demonstrates the power of applying linear multiple events relative location method and provides the possibility to relocate seismicity during the same period in other areas of Western Europe. The updated hypocentres and the original epicentres of 28 other events allow a quantitative analysis of the seismic episode between 1965 and 1970, complementing the Camelbeeck et al. (2022) macroseismic synthesis on the seismic activity in the Hainaut area up to 1985. Our comprehensive analysis reveals that:
72(1) the 1965–1970 seismic episode released a significant part of the total seismic moment in the Hainaut area. The updated focal mechanisms agree well with the acting compressive and transpressive local source stresses, that result from the difference in topography and crustal density (computed from the second derivative of the geoid) with regard to the surrounding areas.
73(2) the compressive and transpressive stress regime in the Hainaut basin is the most favourable tectonic context to trigger earthquake activity in regions of intense mining. Moreover, the concordance of the epicentres with the different mining concessions and the shallowness of the hypocentres supports our finding that seismicity was triggered by human activity in Hainaut.
74Our conclusions should be considered in future seismic hazard evaluations (e.g. Vanneste et al., 2024) and suggest that current or future industrial processes modifying stresses in the Hainaut coal basin and the underlying Dinantian limestone should be accompanied by specific seismic monitoring.
Supplementary material
75Supplementary material S1 contains a detailed explanation of the method used to improve the location of the 1965 to 1985 earthquakes in the Hainaut area.
76Supplementary material S2 explains the method to estimate apparent velocities for Pn, Pg and Sg phases and the depth dependence of time terms for the Hainaut earthquakes.
77Supplementary material S3 is a zip file in which a jupyter ipython notebook is included that applies the multiple event location method developed in this study using station phase arrival times. The output relocation data and figures (similar as Fig. 10) are included as well.
Acknowledgements
78T. Camelbeeck greatly acknowledges Geologica Belgica for the honour of receiving the Van den Broeck medal in 2021. T. Camelbeeck also sincerely thanks the successive ROB directors Paul Melchior, Paul Paquet, Roland Verbeiren and Ronald Van der Linden for their continued support throughout his career. We thank Gilles Mazet-Roux and Laurent Bollinger from the CEA-LDG for providing additional station data from LDG stations, and editor Annick Anceau for her support during the submission of this paper. Reviewers Michiel Dusar, Klaus G. Hinzen and Frédéric Nguyen are sincerely thanked for their input and for providing additional information on this topic. We also sincerely thank all technical staff of the Royal Observatory of Belgium for their invaluable work on seismic station maintenance.
Author contributions
79Thierry Camelbeeck (TC) collected original seismological data from Belgian and European seismic stations, measured phase arrivals, conceptualised the relocation methods, constructed the earthquake catalogue, performed focal mechanism and depth analysis. Koen Van Noten (KVN) validated the seismotectonic significance of the analysis including the geological and mining context, created the maps and the geological cross-section. Thomas Lecocq created and validated the software developments needed for relocation and focal mechanism analyses. TC and KVN wrote the paper. All authors reviewed and approved the final version.
Data availability
80The Hainaut earthquake catalogue composed and used in this paper is available from different sources. For the 1887–1965 period, the catalogue is available in Camelbeeck et al. (2022). The 1965–1985 catalogue is presented in Table 1 in this paper. The post-1985 catalogue is available on the website of the Royal Observatory of Belgium: https://seismologie.be/.
81Seismic phase arrival time measurements of 26 relocated earthquakes in the 1965–1985 period in the Hainaut basin and those of the four master events are available in the Supplementary material.
References
82Ahorner, L., 1972. Erdbebenchronik für die Rheinlande 1964-70. Decheniana, 125/1-2, 259–283.
83Bischoff, M., Cete, A., Fritschen, R. & Meier, T. 2010. Coal mining induced seismicity in the Ruhr area, Germany. Pure and Applied Geophysics, 167, 63–75. https://doi.org/10.1007/s00024-009-0001-8
84Camelbeeck, T., 1985. Recent seismicity in Hainaut. Scaling laws from the seismic stations in Belgium and Luxemburg. In Melchior, P. (ed.), Seismic Activity in Western Europe, with Particular Consideration to the Liège Earthquake of November 8, 1983. Reidel, Dordrecht, 109–116.
85Camelbeeck, T., 1988. La séquence séismique dans la région de Dour de février à mai 1987. Académie Royale de Belgique, Bulletin de la Classe des Sciences, 5e série, 74, 2–3.
86Camelbeeck, T., 1990. L’activité séismique actuelle (1985-1988) en Belgique. Comparaison avec les données de séismicité historique et instrumentale. Analyse séismotectonique. Annales de la Société géologique de Belgique, 112, 347–365.
87Camelbeeck, T., 1993. Mécanismes au foyer des tremblements de terre et contraintes tectoniques : le cas de la zone intraplaque belge. Unpublished Ph.D. Thesis, Université Catholique de Louvain, Louvain-la-Neuve, 295 p.
88Camelbeeck, T., Snissaert, M. & Verbeiren, R., 1990. The Belgian seismic network: present and future. Cahiers du Centre Européen de Géodynamique et de Séismologie, 1, 93–102.
89Camelbeeck, T., Vanneste, K., Alexandre, P., Verbeeck, K., Petermans, T., Rosset, P., Everaerts, M., Warnant, R. & Van Camp, M., 2007. Relevance of active faulting and seismicity studies to assessments of long-term earthquake activity and maximum magnitude in intraplate northwest Europe, between the Lower Rhine Embayment and the North Sea. In Stein, S. & Mazzotti, S. (eds), Continental Intraplate Earthquakes: Science, Hazard, and Policy Issues. Geological Society of America Special Papers, 425, 193–224. https://doi.org/10.1130/2007.2425(14)
90Camelbeeck, T., de Viron, O., Van Camp, M. & Kusters, D., 2013. Local stress sources in Western Europe lithosphere from geoid anomalies. Lithosphere, 5/3, 235–246. https://doi.org/10.1130/L238.1
91Camelbeeck, T., Van Noten, K., Lecocq, T. & Hendrickx, M., 2022. The damaging character of shallow 20th century earthquakes in the Hainaut coal area (Belgium). Solid Earth, 13, 469–495. https://doi.org/10.5194/se-13-469-2022
92Cook, N.G.W., 1976. Seismicity associated with mining. Engineering Geology, 10/2-4, 99–122. https://doi.org/10.1016/0013-7952(76)90015-6
93Declercq, P.-Y., Dusar, M., Pirard, E., Verbeurgt, J., Choopani, A. & Devleeschouwer, X., 2023. Post mining ground deformations transition related to coal mines closure in the Campine Coal Basin, Belgium, evidenced by three decades of MT-InSAR data. Remote Sensing, 15/3, 725. https://doi.org/10.3390/rs15030725
94Dejonghe, L., Delmer, A. & Hance, L., 1992. Les enseignements d’une campagne sismique conduite en Belgique, dans le Hainaut, selon l’axe Erquelinnes-Saint-Ghislain. Annales de la Société géologique du Nord, 2e série, 1, 135–142.
95Delmer, A., 1977. Le Bassin du Hainaut et le sondage de St-Ghislain. Service géologique de Belgique, Professional papers, 1977/6, 143, 12 p.
96Delmer, A., 2004. Tectonique du front varisque en Hainaut et dans le Namurois. Memoirs of the Geological Survey of Belgium, 50, 1–62.
97Delmer, A., 2013. L’orogenèse varisque dans le sillon houiller de Haine-Sambre-et-Meuse. Geological Survey of Belgium, Professional Papers, 2013/2, 315, 1–44.
98Denieul, M., 2014. Moment sismique et coda d’ondes crustales. Unpublished Ph.D. Thesis, EOST-IPGS de l’Université de Strasbourg, Strasbourg, 180 p.
99Descamps, L., 2009. Relations entre l’activité sismique dans le Hainaut et l’activité minière. Unpublished Master Thesis, Faculté Polytechnique de l’Université de Mons, Mons, 53 p + annexe.
100Descamps, L., 2010. Etude complémentaire - suite du travail de fin d’études : relations entre l’activité sismique dans le Hainaut et l’activité minière. Internal report, Faculté Polytechnique de l’Université de Mons, Mons, 29 p.
101Dupont, N., 2021. Analyse de la structure du socle paléozoïque hainuyer. Implications sur les propriétés des réservoirs profonds. Unpublished Ph.D. Thesis, Université de Mons, Mons, 373 p.
102Englert, S., 1995. Mécanisme au foyer des tremblements de terre de la séquence de Dour (1987) : apport à la séismotectonique de la zone du Hainaut. Unpublished Master Thesis, Université Libre de Bruxelles, Département des Sciences de la Terre et de l’Environnement, Bruxelles, 63 p.
103Fourmarier, P. & Charlier, C., 1950. Les séismes dans la province de Hainaut de 1900 à 1949. Académie royale de Belgique, Bulletin de la Classe des Sciences, 5e série, 36, 207–219.
104Gibowicz, S.J. & Kijko, A., 1994. An Introduction to Mining Seismology. Academic Press, San Diego, 399 p.
105Grünthal, G., Musson, R.M.W., Schwarz, J. & Stucchi, M. (eds), 1998. European Macroseismic Scale 1998. Centre Européen de Géodynamique et de Séismologie, Luxembourg, Cahiers du Centre Européen de Géodynamique et de Séismologie, 15, 99 p.
106Hinzen, K.-G., 1982. Source parameters of mine tremors in the eastern part of the Ruhr-District (West-Germany). Journal of Geophysics, 51, 105–112.
107King, G.C.P., Stein, R.S. & Lin, J., 1994. Static stress changes and the triggering of earthquakes. Bulletin of the Seismological Society of America, 84/3, 935–953.
108Kinscher, J.L., Broothaers, M., Schmittbuhl, J., de Santis, F., Laenen, B. & Klein, E. 2023. First insights to the seismic response of the fractured Carboniferous limestone reservoir at the Balmatt geothermal doublet (Belgium). Geothermics, 107, 102585. https://doi.org/10.1016/j.geothermics.2022.102585
109Klose, C.D., 2013. Mechanical and statistical evidence of the causality of human-made mass shifts on the Earth’s upper crust and the occurrence of earthquakes. Journal of Seismology, 17, 109–135. https://doi.org/10.1007/s10950-012-9321-8
110Licour, L., 2014. The geothermal reservoir of Hainaut: the result of thermal convection in a carbonate and sulfate aquifer. Geologica Belgica, 17/1, 75–81.
111Massinon, B. & Plantet, J.L., 1976. A large-aperture seismic network in France: description and some results concerning epicenter location and upper-mantle anomalies. Physics of the Earth and Planetary Interiors, 12, 118–127. https://doi.org/10.1016/0031-9201(76)90041-8
112McGarr, A., Simpson, D. & Seeber, L., 2002. Case histories of induced and triggered seismicity. In Lee, W.H.K., Kanamori, H., Jennings, P.C. & Kisslinger, C. (eds), International Handbook of Earthquake and Engineering Seismology. Academic Press, Amsterdam, International Geophysics, 81A, 647–661. https://doi.org/10.1016/S0074-6142(02)80243-1
113Olivier, G., Brenguier, F., Campillo, M., Roux, P., Shapiro, N.M. & Lynch, R., 2015. Investigation of coseismic and postseismic processes using in situ measurements of seismic velocity variations in an underground mine. Geophysical Research Letters, 42, 9261–9269. https://doi.org/10.1002/2015GL065975
114Raoult, J.-F., 1986. Le front varisque du Nord de la France d’après les profils sismiques, la géologie de surface et les sondages. Revue de Géologie dynamique et de Géographie physique, 27/3-4, 247–268.
115Sichien, E., Henriet, J.-P., Camelbeeck, T. & De Baets, B., 2012. Estimating crustal thickness in Belgium and surrounding regions from Moho-reflected waves. Tectonophysics, 560-561, 105–119. https://doi.org/10.1016/j.tecto.2012.06.050
116Stein, R.S., 1999. The role of stress transfer in earthquake occurrence. Nature, 402, 605–609. https://doi.org/10.1038/45144
117Troch, K., 2016. Une vulnérabilité délibérément acceptée par les pouvoirs publics ? Extraction du charbon et inondations dans la vallée de la Haine, 1880-1940. Vertigo, 16/3, 108–144. https://doi.org/10.4000/vertigo.17998
118Troch, K., 2018. Ne pas grever l'avenir au bénéfice du présent : Une histoire environnementale de l’extraction du charbon de la fin du 18e siècle à l’Entre-deux-guerres : un développement non soutenable. : L’exemple du Couchant de Mons et du Valenciennois. Unpublished Ph.D. Thesis, Université de Lille 3, Lille, Université de Namur, Namur, 651 p. https://tel.archives-ouvertes.fr/tel-02918115
119Vandycke, S., 2002. Palaeostress records in Cretaceous formations in NW Europe: extensional and strike–slip events in relationships with Cretaceous–Tertiary inversion tectonics. Tectonophysics, 357, 119–136. https://doi.org/10.1016/S0040-1951(02)00365-7
120Van Gils, J.-M., 1966. Les séismes des 15 et 21 décembre 1965 et du 16 janvier 1966. Ciel et Terre, 82, 243–267.
121Vanneste, K., Neefs, B. & Camelbeeck, T., 2024. Testing the applicability of ground motion prediction equations for the Hainaut region (Belgium) using intensity data. Bulletin of Earthquake Engineering, 22, 5321–5345. https://doi.org/10.1007/s10518-024-01958-1
122Van Noten, K., Van Baelen, H. & Sintubin, M., 2012. The complexity of 3D stress-state changes during compressional tectonic inversion at the onset of orogeny. Geological Society, London, Special Publications, 367, 51–69. https://doi.org/10.1144/SP367.5
123Van Noten, K., Lecocq, T., Shah, A.K. & Camelbeeck, T., 2015. Seismotectonic significance of the 2008–2010 Walloon Brabant seismic swarm in the Brabant Massif, Belgium. Tectonophysics, 656, 20–38. https://doi.org/10.1016/j.tecto.2015.05.026
124Waldhauser, F. & Ellsworth, W.L., 2000. A double-difference earthquake location algorithm: Method and application to the northern Hayward fault, California. Bulletin of the Seismological Society of America, 90/6, 1353–1368. https://doi.org/10.1785/0120000006
125Zoback, M.D. & Healy, J.H. 1984. Friction, faulting and in-situ stress. Annales Geophysicae, 2, 689–698.
126Manuscript received 31.01.2024, accepted in revised form 02.09.2024, available online 08.04.2025.
