


- Accueil
- 72 (2019/1) - Géomatique (hommage à J.-P. Donnay)
- The coastal transport information system (CO.TR.I.S.) as an integrated approach for the maritime transport design


Visualisation(s): 3617 (35 ULiège)
Téléchargement(s): 68 (0 ULiège)

The coastal transport information system (CO.TR.I.S.) as an integrated approach for the maritime transport design

Document(s) associé(s)
Version PDF originaleRésumé
Le système d'information sur le transport côtier (Co.Tr.I.S.) est un système d'information multifonction qui peut être utilisé pour la conception efficace de lignes de transport côtier. Co.Tr.I.S. intègre huit sous-systèmes («S1» à «S8»), qui comprennent des modèles, des outils et des techniques susceptibles de prendre en charge la conception de réseaux côtiers améliorés. Un apport majeur attendu de Co.Tr.I.S. est qu’il puisse supporter le processus de prise de décision par des décideurs et des parties prenantes (ministères, entreprises maritimes, autorités locales, ...) pour améliorer ce système de transport. Afin de prendre en charge cette fonctionnalité, Co.Tr.I.S. est équipé de sous-systèmes de récupération de données (« S1 », « S2 »), d'analyse statistique (« S3 »), de visualisation des données (« S4 »), ainsi que de sous-systèmes dotés de modules spécialisés pour la génération de réseau, la validation de scénarios (« S5 »), l’optimisation de la solution et l’aide à la décision («S6»), la gestion du transport côtier pour le transport de blessés ou de patients depuis des îles isolées («S7») et la gestion du transport maritime en cas d’urgence majeure («S8»). Tous ces sous-systèmes peuvent avoir accès à la grande quantité de données à jour classées et modélisées par Co.Tr.I.S. Par conséquent, les utilisateurs de ce système (concepteur de lignes de transport côtiers ou décideur, par exemple) bénéficieront de la représentation et des propositions de solutions améliorées offertes par Co.Tr.I.S. Par conséquent, l’objectif de cet article est de présenter les différents sous-systèmes de Co.Tr.I.S., en mettant l’accent sur les sous-systèmes « S5 » et « S6 » et sur l’incorporation de processus d’optimisation. En outre, la description détaillée du système du schéma de la base de données spatiale, les métadonnées et le dictionnaire de données développés dans le cadre de la même recherche sont également présentés et discutés. Enfin, il convient de souligner que la Grèce a été choisie comme étude de cas pour la conception du système et à des fins d’illustration, car il s’agit d’un pays comptant plus de 200 îles habitées, dont la plupart sont dispersées géographiquement sur de petites distances à travers la mer Égée (Grèce orientale).
Abstract
The Coastal Transport Information System (Co.Tr.I.S.) is a multifunction information system that can be used for the effective design of coastal transportation lines. Co.Tr.I.S. incorporates eight subsystems (‘S1’ to ‘S8’) which include models, tools and techniques that may support the design of improved coastal transport networks. A major contribution expected by Co.Tr.I.S. is that it may support the decision making process of the policy makers and the involved stakeholders (i.e., of Ministries, Maritime companies, Local Authorities) towards an improved Coastal Transport System. In order to support this functionality, Co.Tr.I.S. is equipped with subsystems for data retrieval (“S1”, “S2”), statistical analysis (“S3”), data visualization (“S4”), as well as subsystems with specialized modules for network generation, scenario validation (“S5”), solution optimization and decision support (“S6”), coastal transport management for transporting injured people or patients from isolated islands (“S7”) and maritime transportation management in case of a major emergency (“S8”). All these subsystems can have access to the vast amount of up-to-date data classified and modeled by Co.Tr.I.S. Therefore, the system users (e.g., coastal transport line designer or decision maker) will benefit from the improved representation and the improved solution proposals offered by Co.Tr.I.S. Therefore, the objective of this paper is to present the Co.Tr.I.S. subsystems, by giving emphasis to subsystems “S5” & “S6” and incorporating optimization process. Furthermore, the detailed description of the system, as well as, the Spatial Database Schema, the metadata and the data dictionary developed in the framework of the same research are also presented and discussed. Finally, it is highlighted that Greece is selected as a case study for the design of the system and for illustration purposes, as this is a country with more than 200 inhabited islands, most of which are geographically scattered in small distances across the Aegean Sea (Eastern Greece).
Table des matières
INTRODUCTION
A. State of the art
1Coastal transportations lines may affect not only the development of a coastal city in many ways, but also the development of an entire country. Especially in countries like Greece, which is considered an important maritime crossroad with more than 200 inhabited islands, the formation of urban networks and city-hierarchies under the conditions of economic globalization and European integration is strongly affected by the coastal transportation network. Geographic Information Systems (GIS) have an important role in research and implementation of integrated transport solutions, providing a context for the dynamic integration of the island and marine environments. The development of GIS allows the construction and use of models permitting the development of a simulation of the real world. GIS also support 3D applications for maritime transportation systems (Gold et al., 2004). Indicatively, Gold et al. (2004) proposed a 3D application in the wider research field of Marine Geographic Information Systems (Marine GIS) and also authors developed a tool for navigation training. Afterwards, Petit et al. (2006) built a GIS architecture that has the ability to adapt to changes in geographic data and the environment. Specialized and flexible models (Mobile GIS) deal with technical interaction and adaptive interaction techniques, playing an important role in sea transport management (Petit et al., 2006). By using wireless communication, they developed a maritime navigation application with the aid of mathematical models. According to Gold and Condal (1995), the advantage of an adaptive GIS system is that it is directly linked to the flexibility of adapting and analyzing different contexts and problems, which are especially made for maritime transportation systems (e.g., continuously changing weather conditions, locations, routes, orientations, ports, etc.).
2The maritime transport development, the complex technology and technical infrastructure make the use of GIS imperative in this field of research. GIS technologies are not the only tool of geoinformation analysis related to transport. Traffic Information Systems are trying to incorporate more information for more than one means of transport, building useful models for moving passengers using a combination of transport modes, Multi-modal transport system (Preuss & Syrbe, 1997), as well. In another relevant paper, Dragan & Fernetti (2002) utilize GIS capabilities and suggest a spatially integrated GIS for tourists and travellers that includes their opinions, activities, attractions and other tourist information for departures and itineraries covering the tourism authorities and administrative agencies. In general, GIS can give a complete information system that provides information on departures, transportation, interactive maps, etc. Moreover, Claramunt et al. (2007) developed an application that goes beyond simple information monitoring; particularly, they tried to solve problems in information and transport systems when integrating with navigation systems. The model for monitoring real-time traffic (e.g. through the Automatic Identification System / AIS) attempts to prevent delays in schedules, potential obstacles and conflicts. In this concept, the objective of Pietrzykowski (2011) was to incorporate the geographic information into a well-designed system that includes maritime transport of goods and maritime transport (hours of service, transfer stations, loading and unloading etc.). The proposed Intelligent Transportation Maritime System (IMTS) adopts a model that can react automatically with the logic of human action in order to change and to fit with many features and options in various complex environments. Furthermore, Kulawiak et al. (2010) created an online Web-GIS, as a tool for supporting research in maritime transport. This system enables exchange of data among researchers that can be used in various research activities. An important application from a different research field that is related to the design of transport management is the example of Curitiba in Brazil. The system called “Bus Rapid Transit of Curitiba” follows a hierarchical structure where mini buses routed through residential neighbourhoods, which feed passengers to conventional buses on circumferential routes around the central city and on inter-district routes (Goodman et al., 2005). Another related application to transport systems is the management of the airplane lines. According to Giannopoulos (2004), the development of the European airplane navigation system includes communication, monitoring and surveillance services that aim to optimize the air traffic management with safety. The Automatic Dependent Surveillance system plays an important role, as it uses an automated way for data collection (position, speed, direction) and has online communication with the administrators in the ground. This system has been applied in international bodies, such as EUROCONTROL.
B. The Greek paradigm
3Greece and more specifically the Aegean islands complex is a challenging option for developing a network of maritime transport in the Eastern part of the Mediterranean Sea, mainly due to the size of the islands, their number and spatial distribution. Generally, the geographical configuration of Greece is characterized by an extensive coastline which is 14854 km and an insular complex with more than 3500 islands (inhabited or not). In this coastline there are more than 700 harbours and bays, more than 400 ports (small, medium, major) and hundreds of coastal navigation lines, served by dozens of maritime companies. These islands constitute the 19% of the Greek territory, with 14% of the country’s total population, while 92 of them demand regular coastal transport line connection with the mainland. Coastal transport in Greece consists of a network of mainland-to-island, island-to-island and mainland-to-mainland connections that concern the transportation of passengers, vehicles and goods. It is a very complex network of coastal transport lines, structured into 34 main lines. The system service demand continuously increases, as, according to the Ministry of Tourism it is estimated that until 2020, the coastal transport line passengers will reach the number of 20 million people per year. Regarding current situation, until the end of 2009, the domestic coastal transport was operating by about 170 vessels and small ferries of which only a few serviced the barren lines (i.e., isolated/unprofitable islands with a small number of inhabitants). Some of these coastal transport lines have been entirely subsidized by Greek governments. It is estimated that in Aegean Sea more than 17 barren lines out of a total of 51 lines do exist. During 2008-2009 these subsidies immensely increased and surpassed the amount of 70 million Euros. Indicatively, in total, during 2003-2010, the Greek state has spent 250 million Euros for these lines. The barren lines problem is linked to macroeconomic and microeconomic issues. At a microeconomic scale, the issue of barren lines is very crucial. The state finances the shipping companies to conduct particular itinerary to barren lines, otherwise such itinerary is hardly viable economically. As already mentioned, barren lines are serviced through subsidized ships; although there are subsidies, the shipping companies deny operating on certain unprofitable lines. On the other hand, it is argued that the Greek state systematically lacks to achieve its obligation in subsidies (i.e., subsidized coastal transport lines), resulting in the operation interruption. As a consequence, many islands remain without coastal transport that means losses in local economy and reduction in life quality. The problem of barren lines is intense, and, indicatively for 2010, six important barren lines were not served regularly because there was no interest by any shipping company. Policy issues also play a crucial role; the lack of transparency has immense impact in coastal transport policies. During 2008 - 2010, the Greek competition committee reported that 14 shipping companies developed cartel in order to control the ticket pricing policy. Similarly, very often the press accused the efforts of shipping companies to obligate the Greek state to readdress the tender announcement for unprofitable lines. Since 2008, certain shipping companies argued that tenders involved clientelistic practices in favour of specific companies and, therefore, these tenders are against the 3577/1992 EU law. However, it is argued that a number of suitable ships that used to operate the barren lines were drawn from their owners because the state compensation to the shipping companies has usually been under the actual cost. As previously mentioned, such practices -apart from establishing distortion of competition and corruption of the system of state tendering-, they also have resulted in the surcharge of Greek state with the amount of hundreds of million Euros. Additionally, the fact that the consumers have been surcharged by the harmonized shipping companies’ tickets pricing policy is crucial, as well. In addition, during 2006-2008 the shipping companies were accused for coordinating efforts to similarly adjust prices to any increase of the fuel cost. That is, the shipping companies were in agreement in case of increased energy prices to pass the surcharge on the tickets at the same amount. Because of the situation described above, the development of a Maritime Transport Management System (DMTMS) was an attempt to modernize Greek costal transport system by providing a software to assist the decision-making of the administration or the stakeholders; however, this project has never been completed (Lekakou et al., 2002). Another important attempt was the application of expert techniques in combination with optimization methods for the design of costal transport lines in Greece (e.g., Aifandopoulou, 2001).
C. Research objectives
4The study of the global literacy shows that some efforts have been made in order to create Marine GIS, which incorporates 3D applications for ports that have particular difficulty in navigation. Significant efforts have also been done for the integration of the Internet, not only in monitoring but also in achieving electronic navigation and intelligent solutions to a maritime transport system. Nevertheless, above analysis has highlighted the lack of a holistic and integrated spatial information system for the effective planning for coastal transport lines; although a lot of models for road / land transport networks exist, only a few researches for the coastal transport (e.g. motorways of the sea, EC; Wright & Bartlett, 2000) or multi-modal transport networks is mentioned in the literature (Xie, 2009). According to the facts described above, particularly for Greece there is an urgent need to develop an integrated system that will have the ability to plan and schedule the optimum routes in islands in the Aegean Sea, given the current national economic situation. In this context, the objective of this research is to present an integrated system that is designed as a digital platform with related tools useful for any similar situation (i.e., other case studies/islands environments). Particularly, in the frame of a research project co-funded by the European Union and the Greek Government, an integrated and holistic spatial information system named Coastal Transport Information System (Co.Tr.I.S.) has been developed. The main scope of this system is the effective design of coastal transportation lines in any island environment. It should be noted that the coastal transport lines networks have not physical materialization and are not realized as infrastructure works in the sea. Thus, these networks are designed by introducing various nodes (departure, intermediated and arrival nodes) in the frame of a specific methodology. As a result, a specific theory has been developed considering all these particularities, as it is depicted through the database schema. Given the lack of the global literacy and of other similar systems, the main innovation of this system is that it gives integrated solutions to the design of coastal transport networks. Co.Tr.I.S. uses original and multi-parametric tools incorporating spatial and statistical analysis, cartographical visualization, Game theory and optimization. This system can be used in any island environment, taking into account topics like geography, fleet composition, volume of traffic, network design, port infrastructure and other system parameters (Pantazis et al., 2013a). The potential users of Co.Tr.I.S. may be the local authorities, ship-owners union, coastal lines companies, ministries as policy makers and even passengers, however, the entire analysis mainly concerns local authorities, coastal lines companies and the Ministry of Marine and Aegean as the interested party. The value of this Coastal Transport Information System is also highlighted by the relatively limited literature on this specific topic.
5The new version of Co.Tr.I.S. presented here includes eight major subsystems, as shown in Figure 1. These subsystems are summarized as follows: ‘S1’ is the subsystem for information retrieval and queries from Databases; ‘S2’ is the subsystem for information retrieval from relative websites; ‘S3’ is the subsystem for statistical treatment and forecasting scenarios; ‘S4’ is the subsystem for thematic mapping and graphic representations; ‘S5’ is the subsystem for new lines design, line modifications, what-if scenarios and cost/benefit calculations; ‘S6’ is the subsystem for decision support using optimization & Game theory techniques; ‘S7’ is the subsystem for supporting coastal transport management for transporting injured people or patients from isolated islands and, finally, ‘S8’ is the subsystem for maritime transportation management in case of emergency situations (e.g., a natural disaster) or a crisis (e.g., migrant waves). This paper analyses the eight subsystems of Co.Tr.I.S. with a more detailed description of the subsystems ‘S5’ and ‘S6’ and the involved optimization process in these subsystems. The paper is a synthesis of the overall Co.Tr.I.S., a long and mature project. Nevertheless, new perspectives and some new aspects of the system are also included.
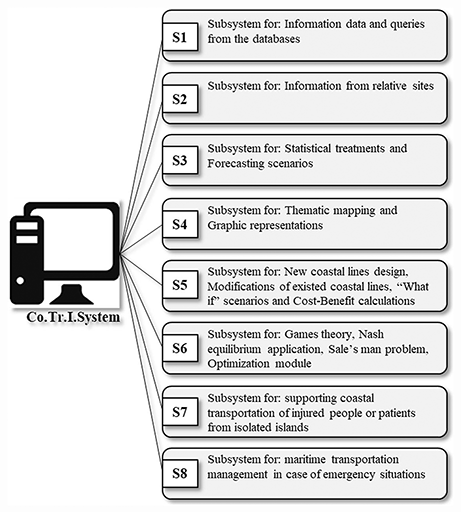 Figure 1. Co.Tr.I.S. subsystems
6Furthermore, many tools have been used for the optimal design of coastal transport (e.g., geographic information systems/GIS, database management systems/DBMS, transportation software, statistical tools), as for Greece there does not exist any integrated platform that could be used as an analysis and simulation reality tool helping in the optimal design of such a complex system. Therefore this research results in the creation of a tool, based on an integrated and holistic spatial information system, to effectively design coastal transport lines, using specific concepts of the “salesman” problem, Graph and Game theory. Overall approach took into account the constraints of reality and the existing possibilities. The proposed system is innovative because it will definitely contribute to:
-
improve the quality of coastal transport lines,
-
solve the problematic issue of barren lines,
-
constitute a powerful tool for decision making in maritime transport policy,
-
allow customization of all factors of the problem (the costs, the need of inter-island communication, the ability of itineraries with response, the attractiveness of the solution for the ferry companies, the need for quality of coastal transport of the residents, the available funds, the current annual subsidies, etc.), offering a digital platform in which the solutions of coastal transport may be developed and tested.
7In this article, Section I presents the overall Co.Tr.I.S. System and its subsystems (‘S1’ to ‘S8’), while section II includes the Optimization module with reference to the optimization tools used in the framework of Co.Tr.I.S.
I. THE Co.Tr.I.S. SYSTEM
A. The objectives and general description of Co.Tr.I.S.
8Co.Tr.I.S. design and operation is based on a GIS software, adds-on traffic management and other applications (mapping, statistics, and design) and it is divided into eight different subsystems (Figure 1). The design of the system was based on MECOSIG method (Pantazis & Donnay, 1996), which was initially developed in the frame of the corresponding author’s PhD thesis (Pantazis, 1994) in Liege University. The system’s functionality combines network (vector) analysis, spatial analysis of raster surfaces (e.g., representing the cost), Graph and Game theory including Nash equilibrium and the Travelling Salesman Problem (Pantazis et al., 2013a). Coastal transport network is stored in a geodatabase using a custom transportation data model. The system user requirements are met by the system’s functions using the necessary data (Figure 2).
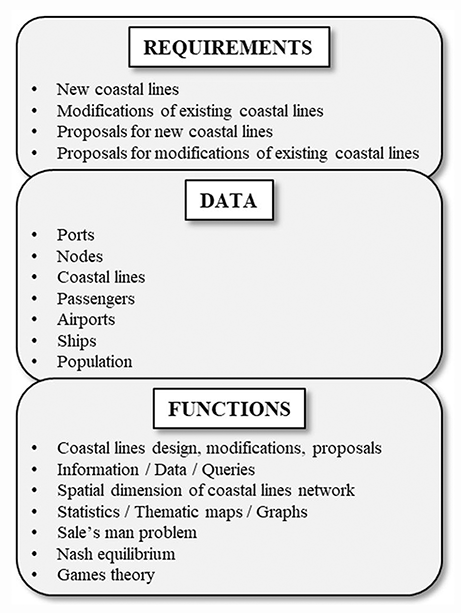 Figure 2. Co.Tr.I.S. requirements data and functions (from Moussas et al., 2015b, with modifications)
9The system’s users are divided into five different categories (groups), while each group uses a slightly different version of the application that is adjustable (data & functions) to their needs (Figure 3; potential users). Some subsystems of the system are still under development and are not for the moment under operational use. The actual system architecture is a full package including database, interfaces, functions, etc., which can be installed in a single pc. In the near future, this architecture will be transformed to a server-client system.
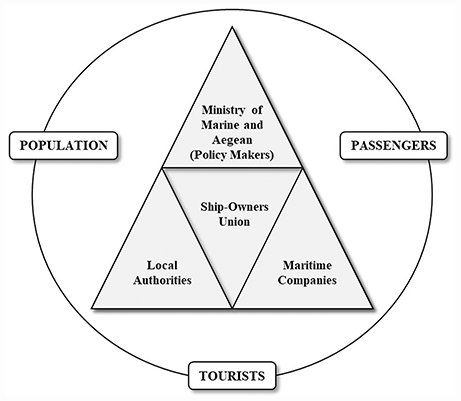 Figure 3. Co.Tr.I.S. potential users (from Moussas et al., 2015b, with modifications)
10Co.Tr.I.S. is mainly a decision support tool. Nevertheless the system also accomplishes transactional procedures, e.g., statistical analysis, thematic map production, coastal transport lines updated maps, etc. This means that some of spatial and alphanumerical database data are updated regularly, e.g., coastal transport lines for summer/winter, number of passengers, etc. (seasonal update). It should be noted that client analysis results are stored in both GIS layers and system databases.
B. Subsystem ‘S1’: information data and queries from Co.Tr.I.S. databases
11Subsystem ‘S1’ hosts data collected by Co.Tr.I.S. and stored in the system’s database. It provides extended editing capabilities and a user-friendly interface to facilitate the queries into the system. Some examples of supported queries (Figure 4) are the following (Pantazis et al., 2013b): Which are currently the coastal transport lines? Which are the ports that had a specific number of passengers (set by the user) disembarked last year? Which are the coastal transport lines (or itineraries) that start from Piraeus, for instance, and have a ticket fare less than e.g. 40 euros? Which are the coastal transport lines (or itineraries) that have Paros as an intermediate port (or destination or final destination)? Which are the coastal transport lines (or itineraries) that have Chania, for instance, as destination (or intermediate port or final destination)? The system has extended capabilities concerning the automatic generation of reports and the display of summarized numerical tables with integration or not of schemas or maps. These modules are mainly designated to the local authorities, helping them to create proposals for new costal lines including a preliminary cost-benefits analysis. ‘S1’ also includes the functions of databases updating.
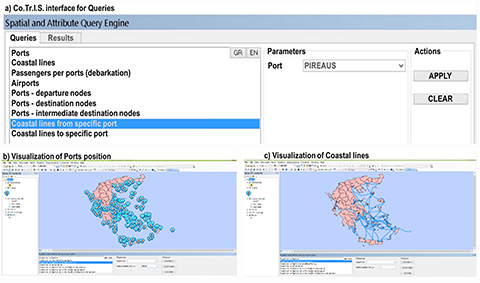 Figure 4. Example of the Spatial and Attribute Query Engine of Co.Tr.I.S. (Note that Co.Tr.I.S. environment is in Greek language) (from Moussas et al., 2015b, with modifications)
1. System’s rules and Spatial Database Schema
12The initial analysis of the system establishes the methodological framework on which the Spatial Database Schema was based. The developed set of the system’s rules was transformed into relations between the spatial entities of the database. Those rules are listened below:
-
In practice or in reality, direct connections (by shipping lines) from any port to all other ports are impossible.
-
The term “direct connection” means the arrival in the destination port from the departure port without any intermediate stop.
-
The term “intermediate stop” or “intermediate destination node” is the place where a ship stops for embarkin g/ disembarking of passengers/loads. It is located between the departure and destination ports.
-
The term “local / intermediate itinerary” is the one serving small nodes with low number of passengers / loads / cars.
-
“Local / intermediate itineraries” from smaller ports to bigger ports and vice versa are essential to be exist.
-
Any connection between nodes can be considered as “local / intermediate itinerary”. This term is an additional explanatory term.
-
The term “small node” is related to its port infrastructure.
-
It is essential for the implementation of the third rule, the existence of “connection shipping lines” between main and local costal transport lines.
-
The term “small port” refers to the term “small node”.
-
The “ports” are defined as “nodes of departure, or nodes of destination, or nodes of intermediate destination, or nodes of final destination”.
-
“Initial departure node” is the port of the initial departure of the ship.
-
“Destination node” is the port which consists the last station that the ship reach for the first time.
-
“Final destination node” is the port where it is not possible to have immediate and simultaneous embarking / disembarking of passengers / loads / cars, but there is a waiting time in between (defined as “time delay”).
-
The “Destination node” may be the “Final destination node”.
-
The term of “Auxiliary node” refers to points in the see where the navigation direction of the ship change.
-
Ports (nodes) are classified in different categories based on specific parameters (size, capacity, depth etc.).
-
The term “Main shipping line” refers to the distance between the initial node (departure node) and the final node (node of final destination).
-
The term “Partial shipping line” refers to the distance between two nodes where at least one of them is not departure node or final destination node.
-
One shipping line can include from 2 to N nodes.
-
A node may be the start (Initial departure node or Intermediate destination node) or the end (Final destination node, Destination node, Intermediate node) of 0 to N partial shipping lines.
-
The departure node may be a destination node as well.
-
Two nodes define minimum two partial lines (e.g. nodes A and B define the partial lines AB and BA). If a ship travels through those nodes set for a third time continually, a new partial line is defined (ΑΒt3 or ΒΑt3).
-
The term “itinerary” refers to the service of a shipping line from a specific maritime company, using a specific ship, at a specific time, at a specific ticket price (for every single passenger type and vehicle). Every single change to one of these parameters means that there is a new itinerary on this specific shipping line.
-
A shipping line may be serviced by one or more itineraries.
-
The itineraries are executed from specific maritime companies, at specific timetable of departure and arrival time to the nodes that are included at the itinerary.
-
In order for a node (port) to be a part of a shipping line, it must be either a departure node, or a destination node, or final destination node, or an intermediate node. The topology of the other nodes is stored via the entity “partial shipping lines” that include the other nodes. The Graph topology is managed by the ArcGIS software.
-
The conceptual schema of the spatial database (Figure 5) is based on an enriched entity relationship model with a) pictograms ([.], [/], [O]) for each type of spatial entity and, b) with the graphic attributes of the spatial entities for lines (line colour, line width, line type), points (symbol colour, symbol size, symbol type) and polygons (outline colour, outline style, outline width, Fill symbol type, Fill symbol colour, Fill symbol size). Based on the previous system rules, the entities were defined with their attributes and classified in spatial (with graphic georeferenced representation) and alphanumerical. For the development of the conceptual model of the system, the CONGOO formalism is also used.
13The suggested conceptual model includes 11 spatial entities that include three line entities, seven point entities and one polygon entity; six alphanumeric entities; 24 relations; 48 relationship numbers. The Spatial Database Schema of Figure 5 has been created with the aid of the software DBmain v.9.16 Computer-Aided System Engineering Tool (CASE Tool). The database always reflects the current situation. Nevertheless, past information (e.g., inactive itineraries, number of passengers of previous years, etc.) are also gathered and stored in order to create thematic maps, comparison analysis, etc.
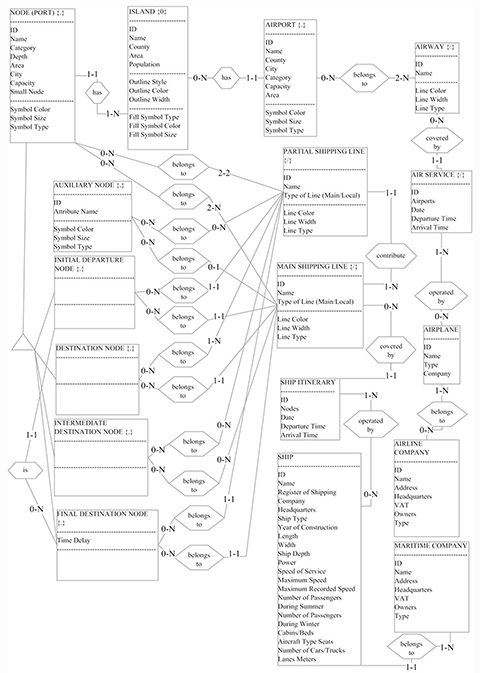
Figure 5. Spatial Database Schema (from Pantazis et al., 2014, with modifications)
2. Metadata and Data Dictionary
14Co.Tr.I.S. spatial data documentation follows the metadata standards proposed by the International Organization for Standardization (ISO 19115). ISO 19115 defines more than 400 metadata elements for the description of the geographic information. Co.Tr.I.S. uses metadata editor of ArcGIS Desktop 10 software from ESRI that supports the above mentioned standard. The metadata used, are the minimum required core elements for spatial data and include: Identifier, Title, Author, Date, Type, Summary, Description, Topic, Scope of the data, Distribution format, Dataset language, Spatial Representation type, Geographic extent, Spatial Reference and Scale of the resource data.
15There are no official directions or standards on the structure of a data dictionary. A data dictionary is a subset of the entire metadata set. However, in some cases, modifications of the existing metadata or creations of metadata specific to the dictionary are necessary (Pantazis et al., 2002). The main assets of a data dictionary are its flexibility (in comparison to the complete metadata set), and its easiness of access for the end user (Pantazis et al., 2002). While most real world elements have a commonly accepted cognitive meaning, their representation in (spatial) databases requires a precise and unambiguous semantic definition. This definition is different from the (geo-) graphic (spatial) object’s definition in the database (e.g., the real object is different of his representation). Co.Tr.I.S. databases dictionary (Figure 6) mainly concerns the potential end users. The significance is on the comprehensive help that a database dictionary can provide to the end user. The main difficulty was to balance between the contradictory requirements of exhaustively and of minimal information.
 Figure 6. Example of Co.Tr.I.S. Dictionary (from Pantazis et al., 2014, with modifications)
16As shown, the selected elements of a dictionary are the following:
-
Type: type of geographical implementation (point, line, polygon or any combination of these types). The type is described by a text and a pictogram.
-
Name: name of the object, should be unique.
-
Real object definition: description of the corresponding object in the real world. This textual definition must be illustrated by a scheme, a photo or any kind of visual information that can help to understand the object.
-
Identifier (included in the logical attribute): characteristic that allows to identify strictly each instance of the object. Usually this attribute is a numeric integer.
-
Logical attributes: all the alphanumeric (non geometric) attributes describing the object’s instances.
-
Graphic attributes.
-
Example of graphic representation.
-
Definition of the graphic representation of the object: description of the graphical representation of the object.
17This description is textual and visual using real example of the database (sources and / or digitalization process, origin of the data, document, property, etc.). Co.Tr.I.S. is not a static system; in the same way, the proposed dictionary is not a static tool too, nor a definitive product, it is an evolving one. The dictionary is not complementary to another document e.g. a conceptual data model, or to another metadata set, or to the database itself. In this sense, the dictionary is an autonomous document, in our specific case. Nevertheless, the dictionary is not an independent document, for it cannot exist by itself. The database dictionary is related to the database: modifications to the database imply modifications to the data dictionary. This is a feature common to every dictionary (Pantazis et al., 2002).
C. Subsystem ‘S2’: Information from relative websites
18Information regarding the marine traffic and the vessels’ positions tracking based on Automatic Identification System (AIS) data are available in the Co.Tr.I.S. interface. Data concerning the available itineraries between islands or ports in general, the ships available, the coastal transport lines between specific ports and fare prices are also available via the system’s connection with the relative websites (i.e., www.petas.gr). ‘S2’ functions give an additional control of the stored information facilitating the error identification and the future proposals creation (for new coastal transport lines).
D. Subsystem ‘S3’: Statistical treatments and Forecasting scenarios
19Co.Tr.I.S. capabilities are mainly related with monitoring, evaluating and analysing coastal transport lines and the relative infrastructure facilities (e.g. ports), and supports: a) strategic queries (e.g. given a number of passengers at a specific line, how many itineraries could simultaneously operate in a week base?), and, b) operational tasks (e.g. how many and what kind of ships can simultaneously arrive to a port?), based on a number of statistical results and data which are integrated into the system. The system uses statistical analysis results for an effective decision making during the process of new costal lines design.
20Data concerning the Greek coastal transport network have been organized, analysed and interpreted through statistical processes. For statistical purposes, after the collection and the initial classification of the data, the following assumption was made: The numerical data correspond only to the disembarked passengers (residents/visitors) per each port and not to those who have embarked on the same ship of the same line at the same time. There is not any significant quantitative difference between these two categories. The applied statistical treatments are summarized as follows:
-
Calculation of central tendency measures (arithmetic mean, median) and variation measures as well (standard deviation, minimum, maximum, range), for disembarkations per each year and season.
-
Calculation of percentage change between the three years per quarter, shipping line and port, in order to have comparable results between the same intervals of different years where data are available.
-
Creation of linear graphic charts presenting the coastal traffic of disembarked passengers per quarter, shipping line and port.
-
Creation of diagrams showing distributions of passengers per quarter, shipping line and port. The statistical treatments are performed with Statistical Package for Social Science (S.P.S.S.) and with Microsoft Excel. The integration of statistical process in ArcGIS platform is under development. Co.T.Ri.S. will be able to produce reports, charts and statistical treatment, as, for instance, the total distribution of passengers per year and per port (Figure 7).
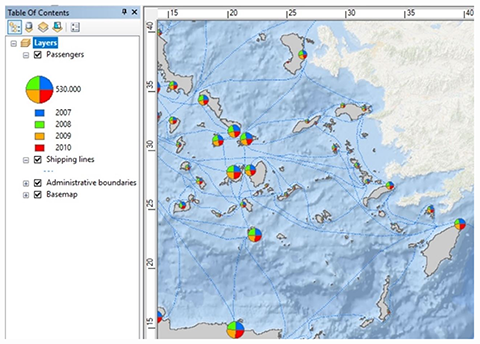 Figure 7. Example of statistical treatment and graphic representation by Co.T.Ri.S. (from Moussas et al., 2015b, with modifications)
E. Subsystem ‘S4’: Thematic mapping, Graphic representations
21Co.Tr.I.S. has the capability to create and visualize various maps such as:
-
digital maps representing the coastal transport lines, the ports and the types of ships (with indicative photos),
-
thematic maps based on the islands and coastal transport lines characteristics such as: island populations, island tourists/passengers number, frequency of ship itineraries, etc.,
-
animated maps.
22The most important question to answer for the development of the subsystem ‘S4’ was: “what kinds of maps are necessary to improve the costal lines design?” The visualization of all the spatial entities related to the system (ports, hubs/nodes, coastal transport lines) may be realized in classic (with topographic background) and schematic (thematic) maps helping the decision making.
23This section presents the thematic maps created by Co.Tr.I.S. The cartographic representation helps to understand the current situation in costal transport network and reviles its weaknesses. This information is used by the system in order to identify potential connections which are missing and to support the process for new lines proposals in the costal network. The spatial data used for the thematic maps are the following:
-
Coastline from the Organization of Cadastre of Greece (data type: line).
-
Administrative boundaries of municipalities of Greece according to the last reform of the Ministry of Interior called “Kallicrates” (data type: polygon).
-
Location of the ports in Greece (data type: point).
-
Location of the airports in Greece (data type: point; Figure 8).
-
Location of the hospitals and health centres (data type: point).
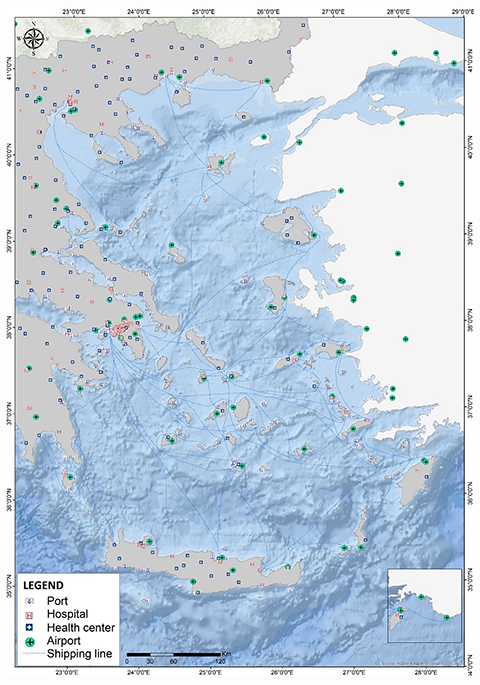 Figure 8. Airports, hospitals and health centres positions at the region of Aegean Sea - Eastern Greece. The existence of airports or hospitals in a coastal or island city is directly related to the importance of the city’s port as the start, the end or a stop in a coastal transport line planning
24The creation of the coastlines was based on a map of the Hellenic Military Geographical Service (HMGS), 1 : 100.000 scale, which was scanned at a high resolution and georeferenced at the Greek Geodetic Reference System (EGSA 87). The coastlines were also verified with data from the Ministry of Maritime and the Aegean. Passenger’s number in each line and each port, provided by the Hellenic Statistical Authority (EL.STAT.) were joined with the above mentioned spatial data, in order to be used for map creation.
25There are three different categories of maps created based on the main spatial data type. The first refers to the polygon data type, where the attributes have a different colour graduation according to the population number. The second refers to the point data type, where there is a different symbol size based on to the number of the passengers at each port. The third category of the maps refers to the schematic representation of the costal lines. There are 23 thematic maps that have been created in order to describe the current situation of the coastal transport traffic network.
26Co.Tr.I.S. provides a specific interface to the user, in order to permit the on-the-fly creation of those thematic maps. This means that the user will be able to create spatial and attribute queries regarding the coastal transport network, and the system will respond the query with the resulting map. These queries are kept in a separate table and each one of them has an SQL statement assigned to it. The parameters of the SQL statement are managed via the ArcMap interface.
F. Subsystem ‘S5’: new coastal transport lines design, modification of existing coastal transport lines, what if scenarios, cost-benefit calculations
27Subsystem ‘S5’ handles the main Co.Tr.I.S. functions; creation and /or modification of coastal transport lines. The system’s user may create new costal transport lines or generally interact with the network in order to determine whether a new connection between ports is needed to be created or removed or altered and modified. The system substantially supports the decision making process concerning the costal transportation issues, e.g.: “Α specific costal line must be removed? Why? How? When?”, “Αn existing coastal transport line must be changed?”, “Α new costal transport line must be created?”, “How is it possible to reduce the cost of a specific coastal transport line?” (Pantazis et al., 2013b). The new coastal transport lines creation or modifications may be realized manually (manual generation) or semi-automatically or automatically. In the first case, the user chooses the ports involved in the itinerary directly from the geographic interface in order to create the new coastal transport line (the system will provide all the relative information stored in the databases; e.g., Figure 9). In the second case, the user chooses the ports from a popup menu and in the third case the system may suggest new lines, having specific characteristics and according to selected rules, that will be displayed in digital maps. Based on these rules, the system could also generate all coastal transport lines connections that are relevant.
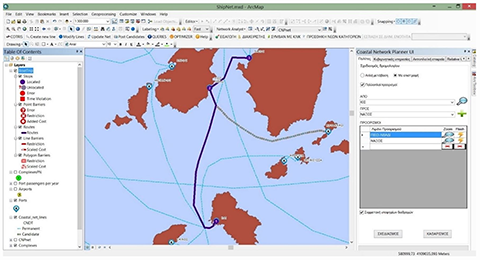 Figure 9. GUI of manually creation coastal transport line in ArcMap Environment (ESRI, 2014) (from Moussas et al., 2015b, with modifications)
G. Subsystem ‘S6’: decision support with Game theory, Nash equilibrium application, Travelling Salesman Problem
28The coastal transport problem in the Aegean Sea is very complex and multivariable. It can be generally described with the classic “salesman” problem. Given a collection of
-
cities/ports/ harbours etc.
-
the cost of travel between each pair of them, the Travelling Salesman Problem (TSP) is to find the cheapest way of visiting all the cities and return to the starting point.
29In the standard version of the problem, the travel costs are symmetric in the sense that travelling from port X to port Y costs just as much as travelling from Y to X. In our case
-
the latter does not apply,
-
the salesman does not wish to visit all the customers,
-
the salesman visits some customers only in specific periods through the year,
-
the salesman needs different transportation means to reach every customer,
-
the salesman agrees to visit some customers if they pay a specific price,
-
exists many salesman,
-
some salesmen wish to collaborate with other salesmen or wish not (Pantazis et al., 2013b).
30Elements of Game theory can be also used and integrated in our conceptual framework. Traditional applications of game theory attempt to find equilibriums in these games. In equilibrium, each player of the game has adopted a strategy that they are unlikely to change.
31The subsystem ‘S6’ is addressing to the coastal transport lines companies in order to help them in the strategic choices of coastal transport lines design and creation. It is also addressing to the ship-owners union in order to avoid unnecessary conflicts if possible (Figure 10). This module is not yet completely developed. For example, it is still under investigation the fact that Nash equilibrium application may lead to cartel situations. ‘S6’ and ‘S5’ are the main subsystems for decision support and they are, in turn, supported by a set of tools including: simulators, route generators, cost evaluators, and optimizers as described in the next section.
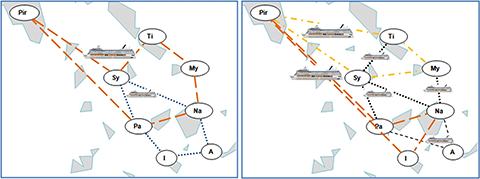 Figure 10. Two extreme coastal transport lines scenarios: a) for ship typical owners’ preferences only (left), and, b) for typical local Authorities’ preferences only (right). The system must be able to provide both, as well as, a number of feasible solutions between these extremes. (from Moussas et al., 2015a, with modifications)
H. Subsystem ‘S7’: Coastal transport management for transporting injured people or patients from isolated islands
32Subsystem ‘S7’ refers to the management of coastal transportation for injured people/patients who live in isolated islands, as a need for Greece, where due to the large number of islands and the national health system limitations, health care services -in terms of patients’ transportation from small islands- need improvements, especially in case of an emergency or the tourist season numerous accidents. The subsystem’s contribution refers to the management of short sea shipping and special routes for the transportation of injured people/patients. In addition, it will be able to interact on an existing route and propose improvements. It will also utilize all parameters with the available geospatial and alphanumeric data and will be able to propose new navigation routes that will exploit the combination of other available forms of transport, such as airplanes or helicopters using the large network airports in Greece.
I. Subsystem ‘S8’: coastal transport line design in case of an emergency
33The main objective of ‘S8’ is the collaboration in the design of coastal transport lines in case of a crisis (e.g., migrant waves) or emergency (i.e., natural/anthropogenic disasters). The conditions of application are particular as this subsystem will only be used under pressure of time (when a crisis hits). Thus, a different approach is required, depending on the situation. Before an event occurs, this system is useful for the actions planning and it aims at preparing society and infrastructure in an appropriate way. During a catastrophe, it is involved in the action plan implementation and in the effective disaster management. After the event, it aims to address the consequences of the disaster and to evaluate the existing action plans. Subsequently, subsystem ‘S8’ includes the creation of the Co.Tr.I.S.’ observatory, the collection of relevant data and, finally, the operational contribution during the stages of prevention and management of a crisis through the incorporated modelling concerning the transport coastal transport lines.
II. DECISION SUPPORT AND OPTIMIZATION IN Co.Tr.I.S. SUBSYSTEMS ‘S5’ & ‘S6’
34Co.Tr.I.S. subsystems ‘S5’ & ‘S6’ include several specialized modules for network generation, scenario validation, solution optimization and decision support. These subsystems constitute a major contribution offered by Co.Tr.I.S, i.e. to support the decision making process of all stakeholders, policy makers and involved players (Ministry, Maritime companies, Local Authorities, etc.). In order to better support this functionality, these modules have access to the vast amount of data classified and modeled by Co.Tr.I.S. and, therefore, offer globally improved solution proposals. The overall complexity of a Coastal Transport System increases exponentially with the number of lines, destinations and realistic parameters included. Any typical enumeration or Branch and Bound method would require an unacceptable long time to reach an optimal solution. The size and complexity of the entire Aegean costal transport system prohibit any manual or interactive search for better or optimal solutions. To resolve this problem, a tool using Evolutionary Methods was developed, capable to provide optimization support based on user demands and also provide a ranked list of the best alternative scenarios according to the user’s requirements and priorities.
35Several methods for general or coastal transport optimization and simulation have been proposed in the literature during the last decades (Donnay, 1984). In coastal transport problems, they usually tackle only a small part, or a reduced version, of the entire problem (Chainas, 2012; Giziakis et al., 2006; Darzentas & Spyrou, 1996). Research on coastal transport network optimization demonstrated the promising use of evolutionary/heuristic techniques when applied to solve the container ship fleet problems such as cost, consumption, distance and deadlines (e.g., Karlaftis et al., 2009; Sun & Li, 2006), the hub positioning problem the liner shipping problem (Tsilingiris & Psaraftis, 2006; Al-Hamad et al., 2012) or, to consider environmental issues (Windeck, 2013). Evolutionary techniques were also successfully combined with methods from Graph theory or Game theory especially in a search of equilibrium for network design with competing goals (Dinu & Odagescu, 2011; Fagerholt, 2004).
36The Co.Tr.I.S.’ user is typically a decision maker trying to find the solution/scenario that will best satisfy several competing goals such as: cost, consumption, user satisfaction, etc., retrieved by the Co.Tr.I.S. database (ArcGIS), which offers all kinds of current and past information about the Aegean Sea transport system, e.g.: connection lines, ships, schedules, geographical & thematic maps, passenger & vehicle demand, prices, etc. These multifold and detailed data and their numerous alternative values, create a huge solution space of potential coastal transport scenarios. The Co.Tr.I.S. user is supported by the decision/optimization modules to come up with a set of the best solutions ranked according to the user’s criteria. Co.Tr.I.S. framework aim is to accelerate the entire procedure and conclude the search in a fraction of the time usually required.
A. Modeling of coastal transport for Co.Tr.I.S. decision and optimization tools
37The large amount of information on the Aegean Sea coastal transport and the realistic and complex relationships employed in Co.Tr.I.S., further combined with the many and contradicting goals of the users, creating a Non-deterministic Polynomial (NP-hard) optimization problem that cannot always be solved within acceptable computer time by the exact algorithms. Therefore, the Co.Tr.I.S.’ subsystems optimization module is largely based on heuristics/evolutionary techniques (i.e. Genetic Algorithms) that are more suitable, as, they search only a part of the vast solution space and converge faster to, or near, the optimal solution.
1. Optimization methodology and stages
38The problem of coastal transport system can be seen as a multi-level or multi-stage problem consisting of several interconnected stages such as:
-
The geometry of the network with all the nodes (i.e., ports) and their connections. At this stage, the mainland ports, the potential hub ports, principal and secondary connections, fixed connections set by the state, forbidden connections due to safety or environmental issues, redundant connections for reliability, and alternative connection combinations are defined. At this stage, constrains and goals may include the overall distance, the total number or the reliability of the connections.
-
The routes service. The routes & trips, as well as, the sequence of ports per trip are defined here. Different types of routes like shuttle trips, circles, or hub & spoke structures can be selected. At this stage constrains and goals may include the number of ports per trip, the allowed deviation, the overall distance, capacity of ports concerning the type of ships, etc.
-
The schedule and frequency of service. The frequency of service is defined by the Routes and their corresponding demand. This stage is highly dependent on the previous stage (#2) decisions and, at the same time, its results may lead to a route rearrangement, in order to cover demand. Other goals may include minimum frequency per destination, reduction of bottlenecks, minimum connection delays, etc.
-
The ship allocation. For each route/schedule defined in the stages 2&3 the company must assign a ship with the appropriate characteristics of type, speed, capacity. The overall Fleet deployment must satisfy constrains and goals such as maximum demand coverage, maximum ship utilization, minimum ship cost, ports posed by the maritime companies.
-
Operational issues. This stage is based on the results of the stages 3&4. Ship operation issues like speed, port queues, and time windows for arrival/departure or load/unload are defined here, and the results may lead to a ship reallocation at stage 4 or re-scheduling at stage 3.
39The optimization tools in Co.Tr.I.S. are able to face either single stage or multi-stage problems. When facing a simple network problem or when the optimization focuses in only one of the above stages, the use of a simple optimization technique is usually sufficient to provide the required solution. But, the typical problems that Co.Tr.I.S.’ user / decision maker is about to face, will cover most of these five stages, thus, this fact results in a multi-level hierarchical system. The optimization tool employed in most stages is based on the Genetic Algorithm (GA) method. An Input Processing/Validation module validates all user inputs and collects any required information from the Arc-GIS database, a Scenario Generation module creates valid routes & scenario solutions, a Scenario Evaluation module evaluates the scenario performance based on selected performance indices, and the GA optimization module implements the GA until convergence is reached (Moussas et al., 2015a).
2. System modelling for Genetic Algorithm (GA) optimization
40Evolutionary methods and GAs represent each member of the population by a chromosome. In our case this chromosome is created using the variables set by the user and these retrieved from the System database. These variables will create the search space for the optimal scenario. In order to achieve globally optimal solutions and search flexibility, the system model contains a large number of coastal transportation parameters and variables. All together they build the set of Measured Values (MV) of our system. From the full set of MVs, another set of Calculated Values (CV) is also produced. Altogether MVs and CVs create the phenotype (chromosome) of a system solution / scenario. (Table 1).
|
Measured Values (MVs) |
|
Per scenario Performance Indices (PIs) |
|
- Island characteristics per island (population, autonomy, hospitals and public services, airports, local population transportation demand, visitors demand, etc.) |
PI 01 - Total travelling distance PI 02 - Total delay, PI 03 - Total cost, PI 04 - Total revenues, PI 05 - Total demand coverage, PI 06 - Total fleet coverage, PI 07 - Coverage of local demand PI 08 - Coverage of state demands, (etc., accumulative values, per scenario from all its Routes) |
|
|
- Port characteristics - per port (capacity constrain for ships – size and number, infrastructure for refuelling, waste, passenger accommodation, load/unload delays, etc.) |
||
|
- Connections - all possible combinations (geographical distance, nautical distance, shuttle line or cyclic route, forced route, number of stops, alternative routes, etc.) |
||
|
- Demand - per route (passengers, cars, trucks, seasonality, etc.) |
||
|
- Fleet – per ship (type, capacity, speed, various costs, various fares, etc.) |
||
|
- Schedule (frequency of each route, departure, travel time, delays, time windows, bad weather delays, winter/ summer adjustments, waiting queues, etc.) |
||
|
- Demand statistics and forecasts, weather statistics, etc. |
||
|
- Calculated Values (CVs) |
||
|
- Calculated from the above MVs, per implemented route: e.g.: - travel time, - delays, - over-length, - productivity, - reliability, - demand coverage, - fleet capacity coverage, - cost, - income, etc. |
||
|
Key Performance Index (KPI) per scenario (or Scenario Score) |
||
|
Per user preferences / goals: |
||
Table 1. Indicative list of the problem (scenario), model variables & overall score evaluation (from Moussas et al., 2015b)
41v
42Phenotype contents are then combined to form the major (n) Performance Indices (PI) for each scenario (PIk). Finally, all major PIs are finally combined to a single KPI (Key Performance Index). The KPI corresponds to the overall score of the fitness function of the optimization algorithm. There is no unique KPI, as it is a weighted sum of all PIs and the corresponding weights (wu/k) are not fixed but they are defined by the user (KPIu).
43Each user may have different priorities which correspond to a separate set of weights Wu that best represent the user objectives and goals. For a typical user request, some of the above quantities will be fixed (constant value), others will be free to change inside an acceptable range (discrete or continuous) and the rest of them will be set/adjusted/restricted by the user. The non-fixed variables will define the form of the search space that will contain all the alternative solutions (scenarios).
44In addition to the model variables & parameters a large number of constrains is always imposed to the designer and/or decision maker. For the coastal transport system under development, an indicative list of constrains follows: available fleet (set of available ships) and shipping companies, min/max capacity per route (required / permitted), minimum / maximum speed per route (required / permitted), minimum wind speed (for delays, for cancelation), maximum over-length (final route length over direct connection), maximum time per route (sum of travel + delays time allowed to complete a trip), maximum number of stops (number of intermediate ports), minimum allowed frequency of service (required number of trips per week), average / maximum load / unload delay (acceptable delays per port / stop), average / maximum waiting for connection line (waiting time in a hub port), maximum number of hubs, minimum demand coverage, minimum capacity coverage, etc.
B. Optimal scenario selection for a sample case
45A sample of the Aegean islands was selected (Moussas et al., 2015b) to demonstrate the basic workflow during the optimization & decision making phase that is supported by the Co.Tr.I.S. tools, in order to find an optimized scenario of itineraries depending on several constrains. The sample contains 6 ports: the mainland port and 5 islands in the Cyclades, Greece area: Syros, Paros, Naxos, Mykonos, and Amorgos. Data are retrieved from the database and contain the required information such as: the distances between all ports, the passenger demands from one port to the other, etc., mainly in a form of symmetric matrices. Distance, demand and infrastructure information is used to classify and select the ports more suitable to act as hubs (the mainland port is always a hub). For each hub setup, all possible port combinations are detected and classified as: mainland lines, hub lines or local lines. For the 6 ports of the above example, and by considering the use of up to 3 hubs, a total of 523 different permutations was found, creating a large pool of routes from where, each scenario should select the ones to implement.
46A first optimization step is applied to reduce the number of routes, by selecting the optimal one between permutations of the same combination. The shortest path optimization is used to select the shortest route servicing the same set of ports, leading to the best 106 ports combinations. A classification step is then applied to further reduce the number of routes by removing the less efficient ones. The efficiency of each route is calculated as a function of its demand, distance, time number of stops and other characteristics. The less efficient routes to ports that are already serviced by more efficient ones can be discarded, thus reducing the available lines to 59 or:
-
23 using 1 hub,
-
20 using 2 hubs,
-
16 using 3 hubs.
47These numbers are still large as they can create hundreds & thousands of different scenarios to implement even for just those 6 islands.
48From the available set of routes, hundreds or thousands of valid scenarios can be created. In this optimization step, a GA is implemented to cope with the huge number of alternatives in a more manageable way. The GA population is consisted of different implementation scenarios. Each scenario will contain a number of routes in order to serve the 6 ports. For each scenario, the network implementation is represented by a chromosome containing 1s and 0s indicating if a route of the set is included or not in the scenario (Figure 11a). The GA starts with an initial population of randomly generated scenarios, and, after a number of generations concludes to a ranked list of the best individuals survived.
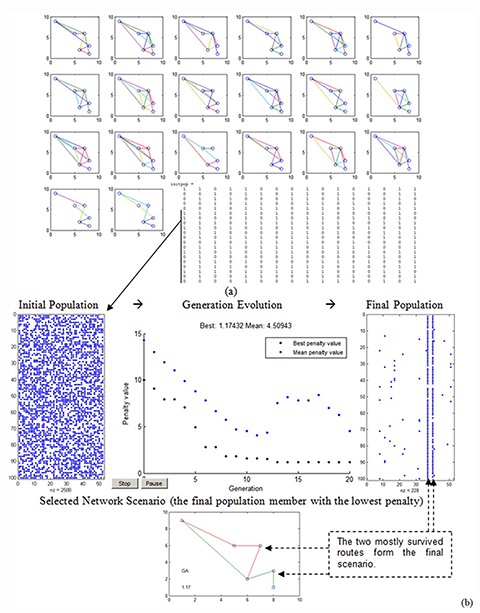 Figure 11. (a) A random initial population of scenarios (network implementations), their networks and the corresponding GA’s chromosomes (lower-right) or elementary routes, each shown in a different colour in the network. (b) The GA’s result (lower), its convergence after 20 generations (up-middle), the chromosomes of the random initial set (left) and the last (right) generation at convergence (right) (from Moussas et al., 2015b, with modifications)
49The objective function calculates the overall efficiency of each scenario and the members of each generation are classified and reproduced according to their score. In this demo sample the overall score of a scenario is a function of the number and the efficiency of the implemented routes, their redundancy and of any penalty due to missing connections. The scenario having the highest score when convergence is met, it is considered as the best or optimal (Figure 11b).
50The above described scheme demonstrates only the Co.Tr.I.S workflow towards the selection of an optimal Aegean Sea coastal transport network scenario. It is not the complete solution of the problem as another complementing part with chromosomes representing the traffic of the network (ships & schedules) is developed in parallel, also using GA’s. Depending on the case under consideration and the user selections, the two GA’s will function either separately in sequence (first network then traffic) or in collaboration as the Bi-level optimization scheme. A more complete answer, with traffic & schedule results, is shown above, in section I.2.G. (Figure 10).
CONCLUSIONS - FUTURE STEPS AND RESEARCH PERSPECTIVES
51The optimal design of coastal transportation lines is a complex, interdisciplinary and multidimensional problem, especially when it concerns an important number of no similar capacity’s ports. In order to manage this problem, an integrated spatial information system, named Co.Tr.I.S., is under development (Moussas et al., 2018). The presented system’s Spatial Database Schema is based on an innovative, original set of rules concerning the coastal transport. The necessary metadata and the data dictionary are also discussed. The system / spatial databases analysis and design are based on the MECOSIG method and the CONGOO formalism (Pantazis & Donnay, 1996). The main role of Co.Tr.I.S. for each potential user has been determined together with the final crucial functions of the system for each user, which are:
-
Ministries: the existence of coastal transport lines during the whole year for all islands.
-
Local authorities: the possibility of new projects development regarding new coastal transport lines.
-
Maritime companies: the foundation of new profitable coastal transport lines.
52Based on the results presented here, most of the initially forecasting system outputs (besides the re-planning of optimal coastal transport lines) have been already achieved. These are summarized mainly in the distribution method of passengers’ movement / traffic per port, the design of thematic maps with the number of passengers per time periods, number of boarding per port etc., the provision of accessible information for any coastal transport line, as well as, coastal transport line maps, the representation of travel duration according to the ship / transfers, the estimation of optimum route with transfer from island to island / mainland to island / island to mainland / mainland to mainland / multiple islands itinerary and, finally, the development of a digital platform in which all involved stakeholders (e.g., local authorities, ministries, shipping companies, etc.) may discuss for readjusting the organization of coastal transport network and reformation, in order to improve it. In the updated version of Co.Tr.I.S., the system’s contribution in the event of a natural disaster is also considered by collecting and developing the following data, functions and databases:
-
information about the number and type of ships which can arrive at the same time in a port, information about the airports and choppers fields,
-
information regarding the time / distance of the nearest hospital / health centre for each island,
-
automatic production of useful maps representing: location of schools, hospitals, area of natural disaster, etc. with possibility of crowd sourcing mapping capabilities.
53This module is still under development.
54Although the research presented here regarding the system development has been completed, many aspects of the system’s functions are still under investigation. Future research concerns national and international collaborations in order to make Co.Tr.I.S. capable for operational purposes and also research on Co.Tr.I.S. subsystems evaluation is underway (e.g., Pantazis et al., 2018). Further system investigation may provide a feedback with any proposed changes in order to improve the system functionality. Data, spatial database, system’s rules, system’s interface, system’s functions, etc. will be modified in the future if deeded. Finally, future research concerns the development of a “cost model” as an independent new subsystem or integrated to one existing, by monitoring the tickets pricing policy, calculating the subsidies of the tickets of islands‟ permanent residents, re-planning the coastal transport network, developing a suitable business plan to support the lines that are of state interest, establishing a discount policy for vulnerable groups of the society, presenting new coastal transport opportunities (e.g. new inter-island connections, circular coastal transport lines) that will encourage investment for the modernization of the coastal transport fleet and mapping the ports‟ needs with the use of relevant studies. Additionally, mapping of the coastal transport line of a single ticket that may allow transfer from one ship to the other without surcharge including combined coastal transport (e.g. from one island to another and to mainland) will be also considered together with a process allowing any user to receive information on how will get to an island from anywhere. Furthermore, as an important number of islands lacks health infrastructure (e.g., medical centres, clinics or hospitals) and as many islands have neither a doctor nor a dentist, in serious diseases or accidents the patient transfer is necessary by helicopter or ship or special boats rented by the state for this purpose. Regarding this fact, a future version of Co.Tr.I.S. will also incorporate the provision of the necessary information for the location (ports) of the special boats for patient transport, permitting a better and overall management of their fleet.
ACKNOWLEDGEMENTS
55This research has been co-funded by the European Union (European Social Fund) and Greek National Resources under the framework of the “Archimedes III: Funding of Research Groups in the University of West Attica” project of the “Education & Lifelong Learning” Operational Programme.
REFERENCES
56Aifandopoulou, G. (2001). Application of expert techniques for the optimum design of vessel transport. PhD Thesis, Aristotle University of Thessaloniki, Greece (in Greek).
57Al-Hamad, K., Al-Ibrahim, M. & Al-Enezy, E. (2012). A genetic algorithm for ship routing and scheduling problem with time window. American Journal of Operations Research, 2(3), 417-429. DOI: 10.4236/ajor.2012.23050
58Chainas, K. (2012). The optimization of the Greek coastal shipping transportation network. Tourismos, 7(1), 351-366.
59Claramunt, C., Devogele, T., Fournier, S., Noyon, V., Petit, M. & Ray, C. (2007). Maritime GIS: From Monitoring to Simulation Systems. Proceedings of the Third International Workshop, Information fusion and Geographic Information Systems, Lecture Notes in Geoinformation and Cartography, 1, 34-44. https://www.springer.com/us/book/9783540376286
60Darzentas, J. & Spyrou, T. (1996). Ferry traffic in the Aegean Islands: a simulation study. Journal of the Operational Research Society, 47(2), 203-216. DOI: 10.1057/jors.1996.19
61Dinu, S. & Odagescu, I. (2011). Research on an Optimization Model for Transportation Network Design. SSRN Electronic Journal. DOI: 10.2139/ssrn.1760663
62Donnay, J-P. (1984). Théorie des graphes et transports. Conférence sur invitation à la Société Géographique de Liège, 24 Octobre 1984.
63Dragan, M. & Fernetti, M. (2002). Geographical Awareness for Modern Travellers: A GIS Application for Maritime Transportation in the Mediterranean Sea. In Wright, D.J.; Earle, S. (Eds.), Undersea with GIS, ESRI Press: Redlands, 230-244. https://dusk.geo.orst.edu/undersea/
64ESRI (2014). ArcMap 10.2. Redlands, USA.
65Fagerholt, K. (2004). Designing optimal routes in a liner shipping problem. Maritime Policy & Management, 31(4), 259-268. DOI: 10.1080/0308883042000259819
66Giannopoulos, G. A. (2004). The application of information and communication technologies in transport. European Journal of Operational Research, 152(2), 302-320. https://www.sciencedirect.com/journal/european-journal-of-operational-research/vol/152/issue/2
67Giziakis, K., Paravantis, J. A., Michalochrista, M., & Tsapara, A. (2006). Optimal Operation of Passenger Shipping in the Aegean. International Conference: Shipping in the Era of Social Responsibility, Cephalonia, Greece, 14-16.
68Gold, C. M. & Condal, A. R. (1995). A spatial data structure integrating GIS and simulation in a marine environment. Marine Geodesy, 18(3), 213-228. DOI: 10.1080/15210609509379757
69Gold, C., Chau, M., Dzieszko, M. & Goralski, R. (2004). The ‘Marine GIS’ – Dynamics GIS in Action. ISPRS Archives – Volume XXXV Part B2, 2004, XXth ISPRS Congress Technical Commission II, 688-693. https://www.isprs.org/proceedings/XXXV/congress/comm2/papers/215.pdf
70Goodman, J., Laube, M. & Schwenk, J. (2005). Curitiba’s bus system is model for rapid transit. Race, Poverty and the environment Journal, 75-76. https://www.reimaginerpe.org/curitiba-bus-system
71Karlaftis, M. G., Kepaptsoglou, K., & Sambracos, E. (2009). Containership routing with time deadlines and simultaneous deliveries and pick-ups. Transportation Research Part E: Logistics and Transportation Review, 45(1), 210-221. DOI: 10.1016/j.tre.2008.05.001
72Kulawiak, M., Chybicki, A. & Moszynski, M. (2010). Web-based GIS as a tool for supporting marine research. Marine Geodesy, 33(2-3), 135-153. DOI: 10.1080/01490419.2010.492280
73Lekakou, M., Papandreou, N., & Stergiopoulos, G. (2002). Setting foundations for coastal shipping policy: The case of Greece. IAME Panama 2002 Conference Proceedings.
74Moussas, V., Pantazis, D. N. & Stratakis, P. (2018). The Co.Tr.I.S system: towards a smarter coastal transport network for smart islands. ISPRS Annals of the Photogrammetry, Remote Sensing and Spatial Information Sciences, Volume IV-4/W7, 3rd International Conference on Smart Data and Smart Cities, 4-5 October 2018, Delft, The Netherlands, 01-98. DOI: 10.5194/isprs-annals-IV-4-W7-91-2018
75Moussas, V., Pantazis, D. N. & Stratakis, P. (2015a). Modeling methodologies for optimization and decision support on Coastal Transport Information System (Co. Tr. IS). WASET Intl. J. of Geological and Environmental Engineering, 9(5), 1108-1112.
76Moussas, V., Pantazis, D. N., Stratakis, P., Lazarou, E., Gkadolou, E., Karathanasis, C. & Daverona, A. C. (2015b). Coastal Transport Information System (Co. Tr. IS): System and Subsystems Description. In Gervasi O. et al. (eds), Conference on Computational Science and Its Applications - ICCSA 2015, Springer, Cham, 591-606. DOI: 10.1007/978-3-319-21470-2_43
77Pantazis, D. N. Moussas, V., Stratakis, P., Stathakis, D. & Gkadolou, E. (2018). GIS applications in coastal transport: the Co.Tr.I.S case and its contribution towards the islands sustainable smartification. In O. Gervasi et al. (Eds.), Computational Science and its Applications - ICCSA 2018. Lecture Notes in Computer Science 10962, Springer International Publishing AG, part of Springer Nature, 284-299. DOI: 10.1007/978-3-319-95168-3_19
78Pantazis, D. N., Stratakis, P., Daverona, A. C., Gkadolou, E., Lazarou, E. & Babalona, E. (2014). Coastal transport integrated system: spatial database schema, metadata and data dictionary. Proceedings of 2nd International Conference on Advances in Computing, Electronics and Electrical Technology - CEET, Malaysia, 20-21.
79Pantazis, D. N., Stratakis, P., Karathanasis, C. Gkadolou, E. Pagounis, V., Chronis, K., Gatsiou, M. Moumouri-Fragkou, F. & Tsekos, P. (2013a). Coastal Transport Integrated System in the Aegean Sea islands: Framework, Methodology, Data Issues and Preliminary Results. International Archives of the Photogrammetry, Remote Sensing and Spatial Information Sciences, Volume XL-4/W1, 29th Urban Data Management Symposium, 29-31 May, 2013, London, United Kingdom, 133-138. DOI: 10.5194/isprsarchives-XL-4-W1-133-2013
80Pantazis, D. N., Stratakis, P., Karathanasis, C. & Gkadolou, E. (2013b). Design of a coastal transport integrated system: preliminary system specifications and data collection for the Aegean Sea islands. In Murgante B. et al. (eds) Computational Science and Its Applications – ICCSA 2013, Lecture Notes in Computer Science, vol. 7974, Springer, Berlin, Heidelberg, 268-283. DOI: 10.1007/978-3-642-39649-6_19
81Pantazis, D. N., Cornélis, B., Billen, R. & Sheeren, D. (2002). Establishment of a geographic data dictionary: a case study of UrbIS 2©, the Brussels regional government GIS. Computers, environment and urban systems, 26(1), 3-17. DOI : 10.1016/S0198-9715(01)00012-6
82Pantazis, D. & Donnay, J. P. (1996). Conception des SIG Méthode et formalisme. Éditions Hermès, Paris, 343 p.
83Pantazis, D. (1994). Analyse Méthodologique des Phases de Conception et de Développement d’un SIG. Thèse de doctorat, Université de Liège, 556 p. + 2 annexes.
84Petit, M., Ray, C. & Claramunt, C. (2006). A contextual approach for the development of GIS: Application to maritime navigation. In Carswell J.D., Tezuka T. (eds), Web and Wireless Geographical Information Systems, W2GIS 2006, Lecture Notes in Computer Science, Springer, Berlin, Heidelberg, 4295, 158-169. DOI: 10.1007/11935148_15
85Pietrzykowski, Z. (2011). Navigational decision support system as an element of intelligent transport systems. Scientific Journal Maritime University of Szczecin, 25(97), 41-47.
86Preuss, T. & Syrbe, J. H. (1997). An integrated traffic information system. Proceedings of Sixth International Conference on the Application of Computer Networking in Architecture, Construction, Design, Civil Engineering and Urban Planning, Edinburgh, EuropIA’97.
87Sun, X. & Li, N. (2006). A new immune genetic algorithm for the large scale ship routing problems. International Conference on Management of Logistics and Supply Chain, Chang Sha/Chine, Sydney/Australia.
88Tsilingiris, P. S. & Psaraftis, H. N. (2006). A multi-stage optimization-based approach for the liner shipping problem. 3rd International Congress on Transportation Research in Greece, Thessaloniki, Greece.
89Windeck, V. (2013). A Liner Shipping Network Design: Routing and Scheduling Considering Environmental Influence. Produktion und Logistik, XXVI, Springer Gabler, Germany, 136 p. DOI: 10.1007/978-3-658-00699-0
90Wright, D. J. & Bartlett, D. J. (Eds.). (2000). Marine and coastal geographical information systems. CRC press, 352 p.
91Xie, X. (2009). An integrated sea–land transportation system model and its theory. Transportation Research Part C Emerging Technologies, 17(4), 394-411. DOI : 10.1016/j.trc.2009.02.002
Pour citer cet article
A propos de : Dimos N. PANTAZIS
University of West Attica, Athens, Greece
dnpantaz@otenet.gr
