


- Portada
- 81 (2023/2) - Varia
- The water management system of the Haute-Comoé sub-watershed under multiple uses pressure in South-West in Burkina Faso


Vista(s): 1487 (11 ULiège)
Descargar(s): 133 (2 ULiège)

The water management system of the Haute-Comoé sub-watershed under multiple uses pressure in South-West in Burkina Faso

Documento adjunto(s)
Version PDF originaleRésumé
À l’instar du grand Ouest burkinabé, le sous-bassin de la Haute Comoé dispose d’un fort potentiel hydrique utile pour le développement des activités économiques des populations. Cependant, avec l’amenuisement de la ressource face à l’accroissement des besoins, le partage de l’eau fait l’objet de rapports conflictuels entre les usagers ces dernières décennies. La présente étude vise à analyser le système de gestion des ressources en eau face aux risques de conflits communautaires dans le sous-bassin de la Haute Comoé. La méthodologie adoptée intègre l’exploitation documentaire, l’observation et les enquêtes mixtes de terrain.
Les résultats révèlent que les conflits hydriques sont alimentés par l’amenuisement de la ressource du fait de la demande croissante des usagers et de la pression foncière. On note un déficit en quantité d’eau de 7 284 915 m3 (17 %) par rapport à la demande totale des groupes d’usagers (43 398 317 m3). Les reliques de formations ripicoles, jadis utiles pour la protection des berges des eaux de surfaces, ont régressé de 4,8 % au profit des savanes arbustives (0,9 %) et des cultures pluviales (0,9 %). Cette dégradation de la flore des berges liée à la forte demande foncière est perçue par 58 % des enquêtés. Pour y remédier, les communautés locales ont créé un Comité local de l’eau (CLE) assorti d’un dispositif d’allocation de l’eau. Celui-ci reste perfectible mais, avec les actions de restauration des terres et de protection des berges, il constitue déjà un outil pertinent de prévention des conflits et de partage équitable de l’eau qui peut inspirer certains CLE du pays.
Abstract
In Burkina Faso, the Upper Comoé sub-basin has a high potential of water, useful for the development of the population's economic activities. These economic activities create the increase needs of water with conflictual relations between the users the last few decades.
This study analyses the water resource management system in the face of the risk of community conflicts in the Upper Comoé sub-basin.
The methodology integrates literature review, observation and mixed field surveys.
The main results are that the driving force of water conflicts are the decrease of its available quantity, the increasing demand of users and land pressure. Indeed, there is a decrease of the quantity of estimated at 7,284,915 m3 (17%) compared to the total demand of the user groups (43,398,317 m3). The relics of riparian formations, once useful for protecting the banks of water surface, have regressed by 4.8% to the benefit of shrubby savannahs (0.9%) and rainfed crops (0.9%) between 1990 and 2020. This degradation of the flora of the banks, linked to the high demand for land, is perceived by 58% of the respondents. To fix the problem, the local communities have created Local water committees. These committees use a water allocation system. At this step, some improvements are necessary, but going from land restoration and riverbank protection actions, these Local water committees are already relevant actors for conflict prevention and equitable water sharing.
Tabla de contenidos
Introduction
1When the philosopher Thales of Miletus (625-547 BC) stated that water is the material cause of all things, he underlined the importance of water for the development of civilizations since antiquity. However, the multi- sectoral use of water could be a source of competition and contradiction. These frictions sometimes lead to open armed conflicts "water wars" as in the case of the United States and Mexico in 1930 around the Colorado River (Lasserre, 2006, p. 176) and of Israel and Syria (Bouquet, 2011, p. 342).
2Thanks to the cooperation of supranational institutions (Niger River Basin Authority created in 1963; Organisation for the Development of the Gambia River created in 1972; Organisation for the Development of the Senegal River created in 1972; Volta Basin Authority created in 2006, etc.) around transboundary rivers, Africa has not experienced any real 'water wars' (Wolf, 2001, p. 29). However, historically, the management of water resources has been constantly punctuated by a multitude of tensions and conflicts. These oppositions are manifested at both the international and local levels. The opposition between Senegal and Mauritania in 1989 over the Senegal River, between Benin and Niger over the Lété Island on the Niger River in 1960, and between Burkina Faso and Ghana around 1990 over the waters of Lake Volta (Niasse, 2004, p. 6-9; Hellendorf, 2013, p. 11) are examples. There were also conflicts between villagers on the Mauritania-Mali border in 1999, around the Tana River in Kenya in 2001 over access to water and pasture, and around wells in the El Bur region north of Mogadishu in Somalia between 2004 and 2006 (Bouquet, 2011, p. 343). Furthermore, with population growth and declining water availability accentuated by climate variability (MERH, 2015, p. 43), the pressure on water resources exacerbates the risk of conflict (Bouquet, 2011, p. 350).
3In Burkina Faso, the situation is similar with other countries in the sub-saharian region. Burkina's has well-developed hydrographic network with four basins : the Mouhoun basin, the Niger basin, the Nakanbé basin and the international Comoé basin. The international Comoé basin is located in the western part of the country, with a surface area of 17,590 km², the Comoé basin drains three regions (Hauts Bassins Hauts Bassins, Sud-ouest and Cascades). Burkina Faso's third-largest industrial hub, after Center and Hauts Bassins, this region is well endowed with water resources. At basin is drained by two permanent rivers - the Comoé and the Léraba. Moreover, there are dams, lakes, springs and a high water table and that constitutes significant water resources. This water is used to meet the water needs of the town of Banfora (approx. 70,000 inhabitants), to irrigate the Bérégadougou sugar complex (4,000 ha), the Karfiguéla irrigated perimeter and market garden crops along the Comoé River (Cour J., 2010, p. 11). In addition, there are other, lower-order uses of water. These include uses linked to tourism and fishing. Notwithstanding the abundance of the resource, the Haute Comoé sub-basin is witness to numerous latent conflicts between users of the resource. Finally, the increase of needs due to agricultural migrants and the diversity of users, the exploitation of water resources in the Upper Comoé sub-basin is not free of conflicts (Zerbo, 2017, p. 15). These observations underline the relevance of questioning the water resource management mechanism in order to prevent conflicts whose consequences could be irreparable. So how are water resources managed in the face of the risk of community conflicts in the Upper Comoé sub-watershed? Does the appropriation of the system for allocation and protection of water resources makes it possible to reduce the risks of conflicts inherent in the diversity of uses and land pressure in the Upper Comoe sub-watershed?
4The development of the text is based on the geographical and methodological framework as well as the results and discussions.
I. Materials and methods
A. Geographical setting of the study area
5The Upper Comoé sub-watershed is located upstream of the international Comoé basin, in the south-west of Burkina Faso (Figure 1). Its area is estimated at about 1928 km² (11.3% of the Comoé basin).
6The Haute Comé sub-watershed is located at latitudes 10°30'N and 11°10'N and longitudes 04°10' and 05°20'. Its surface area is shared between the commune of Banfora, the communes of Bérégadougou and Moussodougou in the Comoé Province, the communes of Samogohiri and Kangala in the Kénédougou Province, the commune of Toussiana in the Houet Province and the commune of Wolokonto in the Léraba Province.
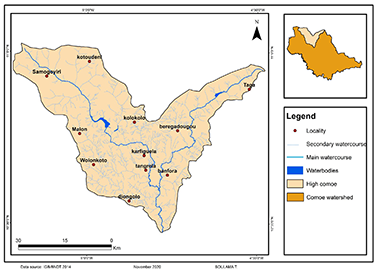
Figure 1. Geographical location of the study area
7The climate is the South Sudanese type. It’s characterised by an alternating dry season (October to April) and a rainy season (May to September) with an annual isohyet of 1000 mm. Rainfall is higher than the national average (700 to 800 mm) but is subject to intra- and inter-annual variation. Monthly temperatures vary between 28.7°C and 32.2°C. Evapotranspiration reaches its maximum value during periods of high heat and insolation (March, April, May), when physical evaporation is also intense. The sedimentary and crystalline formations of the south-eastern edge of the Taoudéni Basin favoured the development of the sandstone massif and the peneplain (Sanogo, 1997, p. 8). The cutting of the edge of the massif by the valleys has allowed the isolation of multiple promontories and buttes such as Mount Ténakourou (747 m). This confinement explains the density of the hydrographic network, dominated by the Comoé River and its tributaries, whose outlet is located at Diarabakoko. The water bodies are made up of dams (Comoé, Lobi and Toussiana) and lakes (Tengréla, Lemouroudougou and Karfiguéla). These water resources are used for domestic (drinking water), industrial and agricultural purposes.
8The different soil types (kaolinic, sandy-clay and hydromorphic soils), despite their sensitivity to erosion, have physico-chemical properties that are generally favourable to agro-pastoral activities. The flora is generally of the mesophilic type, characterised by a savannah formation with varied facies, but there are relics of open forests and gallery forests.
9The agricultural potential of the physical environment has partly enabled the settlement of socio-cultural groups. Indeed, the first inhabitants of the Comoé province were the Gouins, the Turkas, the Karaboro and the Dioulas (Soulama, 1994, p. 20); those of the Samogohiri and Toussiana communes were the Samos and the Tousians.
10In 2019, the National Institute of Statistic and Demography has estimated the number of inhabitants at around 34,475 in 2019. The majority of them practices agriculture and livestock as main economic activities. Howver, agricultural production is essentially extensive and dominated by cash crops (cotton, groundnuts, sesame), food crops (millet, maize, sorghum) and tubers (potatoes, yams, cassava). Livestock rearing is also extensive and depends on the existence of transhumance routes and the agro-climatic conditions of the area. The livestock is made up of small ruminants (goats, sheep, pigs), large cattle (bovines, asins) and poultry (guinea fowl, chickens).
B. Sampling and data collection
11The study is based on a systemic approach that aims to be comprehensive and integrated. Quantitative and qualitative data were therefore collected through the adoption of a mixed method. It includes household surveys, semi-structured interviews and field observations, documentary analysis, geo-referenced databases from the geographical Institute in Burkina and Landsat 5 (30m x 30m) satellite images from 1990 and Landsat 8 from 2020. The images (covered by scenes 197052/197053), from the end of the rainy season (October) were preferred given the low cloud cover (Zoungrana and al., 2015, p. 12080).
12The geographical position (upstream and downstream of the river) and the proximity of the land to the irrigated areas (formal or informal) guided the choice of survey locations. The individual questionnaire interview was administered randomly to 158 heads of household, 50 of whom were upstream, 70 downstream and 38 in the Karfiguéla plain (Table 1).
|
Geographical location |
|
|
En amont |
En aval |
|
Lougoua et Samogohiri |
Karfiguela, Lemouroudougou, Siniéna, Diarrabakoko |
|
50 households surveyed out of a total of 500 |
70 households surveyed out of a total of 700 |
|
Total |
158 households |
Table 1. Spatial and demographic sampling. Source: Field work and NISD data
13Interview guides were also sent to the heads of institutions and actors such as the public administration, local authorities, water users, the Cascades Water Agency (CWA) and the Local Water Committee (LWC) and farmers' organizations. The collection material consisted of survey sheets and a camera.
C. Data processing and analysis
14Envi.5.3 software was used for satellite image processing and ArcGIS 10.5 for mapping. The Landsat images were geometrically rectified and projected into the Universal Transverse Mercator Zone 30 North system, which is the planimetric reference covering the sub-catchment. A mosaicking operation was necessary to extract the area covered by several scenes. Referring to the FAO Land Cover Classification System (LCCS) (Di Gregorio and Jansen, 2000, p. 1-42), the colour composition combining the three near-infrared/red/green bands (bands 5-4-3) was preferred because of its strong discriminatory capacity of the land use units. This resulted in the identification of seven land use units. Global Positioning System (GPS) reconnaissance outputs of the land use units allowed the maximum likelihood method to be used in the classification. The classification was validated with Kappa coefficients (93%/1990 and 88%/2020) above 75% (Pontius, 2000, p. 1014).
15The statistical evaluation of the evolution of land use units was based on the determination of the average annual rate of spatial expansion of each land use class (Tc). The calculation of the rate is based on the formula of B. Bernier (1992):
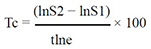
16(Fangnon et al., 2013, p. 270).
17where t is the number of years of evolution between 1990 and 2020; ln, the neperian logarithm; e, the base of neperian logarithms (e = 2.71828); S1 and S2 are respectively the area of an occupancy class in 1990 and 2020. The modalities for analysing change are defined as follows: if Tc ˃ 0, then there is 'progression'; if Tc = 0, then there is 'stability'; and if Tc ˂ 0, then there is 'regression' of the unit in question. By overlaying the land cover map developed by image matrices were generated to describe landscape changes between 1990 and 2020.
18The data from the field surveys were processing by Sphinx plus software. The univariate analysis of the response modalities made it possible to generate descriptive statistics. The incorporation of the statistics in Excel made it possible to generate appropriate graphs and tables.
II. Results and discussion
A. Increasing need for water due to diversity of users
19Due to the water potential of the Upper Comoé sub-watershed, water is an important link in the chain of economic activities. Figure 2 shows that in 2020, the main water users will be agro-industrial (93%), sanitary (5%) and domestic (2%).
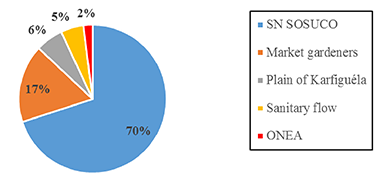
Figure 2. Water demand by user group in the Upper Comoé sub-basin. Source: Interview with Local Committee of Water-Haute Comoé, March 2021
20The agro-industrial uses of water are manifested in the production and processing of sugar cane, horticulture and rice cultivation. The displacement of the populations of 10 villages in the Cascade regions in 1975 enabled Burkina Faso to develop 10,000 ha of land for the irrigation of the sugar plain. The exploitation of 4000 ha of the plain by the ‘’Société Nouvelle/Société Sucrière de la Comoé (SN-SOSUCO)’’ consumes 30 523 256.3 m3 /year (70% of the demands of the sub-watershed) and also allows for the harvesting of 239040 to 313000 tons/year of sugar cane. A flow of 75 l/s is also mobilized to cool the engines of the sugar cane processing factory (blond or white refined sugar). This allows SN-SOSUCO to produce 35,000 tons of sugar per year, i.e. 46% of national consumption. The water demand of the SN-SOSUCO sugar complex is followed by the water demand (17% of the uses) of the market gardening sites (1355.25 ha) installed along the banks of the rivers of 21 villages. A dozen vegetable crops are grown there, but the most dominant are cabbage, chilli and bulbous onions, which account for 69.3% (939.4 ha) of the total vegetable area (photo 1)
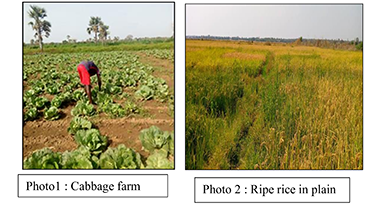
Photo 1. Market gardening and rice production in the Upper Comoé sub- watershed. Source: Field shots, 2020
21In the rice-growing area (750 ha) in Karfiguéla on the right side, approximately 21,032 m³/day of water are withdrawn to irrigate 350 ha of rice during a 120 days crop cycle. This withdrawal is equivalent to a volume of 2,543,888.86 million m³/year, i.e. 6% of total demand. The ecological need (5%) remains low compared to previous uses, but it ensures the maintenance and preservation of flora and fauna. The domestic use of households provided by the National Office of Water and Sanitation represents 2% of total demand.
22The pressure on surface water is likely to increase due to multiple uses. Indeed, the proliferation of water users following the influx of migrants is leading to ever-increasing demand (Zerbo, 2017, p. 15). Similar observations have also been made in the Mouhoun basin (V. Koudougou and al., 2018, p. 3 et F. Sanogo et al., 2023). For these authors, the water resources of the Mouhoun basin are under increasing pressure due to multiple and competing uses such as agriculture, livestock, fishing, gold panning, domestic and industrial use. The land pressure linked to the expansion of the agricultural front also accelerates the degradation of the surface water reserves of the study area. In Benin, AZIAN et al., (2023) highlighted the impacts of climate change and multiple uses on the hydraulic infrastructures. These impacts lead to pollution and breakdows of the infrastructures.
B. Effect of land pressure on water resources
23The results of the Landsat image processing show a landscape change in the Upper Comoé sub-watershed between 1990 and 2020 (Figure 3).
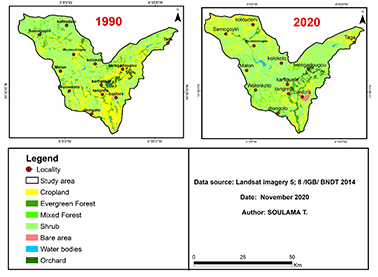
Figure 3. Land use between 1990 and 2020
24The statistics of the state of the land use units indicate a predominance of natural formations in 2020 with 74.8% of the sub-watershed area (Table 2).
|
Occupancy units |
Area in 1990 |
Area in 2020 |
Rate of change (1990-2020) |
||
|
In Ha |
% |
In Ha |
% |
||
|
Rainfed crop |
61078,02 |
31,1 |
43530,77 |
22,1 |
-1,34 |
|
Orchard |
3297,35 |
1,7 |
3963 |
2,0 |
+0,56 |
|
Bare soil |
708,72 |
0,4 |
2096,97 |
1,1 |
+2,21 |
|
Surface water |
653,60 |
0,3 |
1197 |
0,6 |
+1,51 |
|
Riparian formation |
10394,43 |
5,3 |
4897 |
2,5 |
-3,74 |
|
Tree savannah |
3415,67 |
1,7 |
7248,51 |
3,7 |
+1,76 |
|
Shrubby savannah |
117059,82 |
59,5 |
133674,36 |
68,0 |
+0,41 |
|
Total |
196607,61 |
100 |
196607,61 |
100 |
|
Table 2. Area of land use units in Ha and % between 1990 and 2020. Source: LANDSAT 5 1990 and 8 image processing from 2020 2020 + sign: Increase and - sign: Decrease
25The data in the table show an increase in tree savannahs (+1.8) and shrublands (+0.4) and a decrease (-1.3) in rainfed crops between 1990 and 2020. These statistics seem to reflect a slight degradation of natural vegetation. However, they do not necessarily indicate a decline in the anthropisation of the landscape, especially since the areas of orchards (+0.6) and bare soil (+2.2) have increased during the same period. The interviews also reveal that the reduction in rainfed cultivation areas is linked to their conversion to arboriculture (mango and cashew orchards, etc.). However, depending on the density of trees, orchards can have a spectral response similar to that of shrubby savannahs (Ducros-gambart and al., 1984, p. 211). This explains the conversion of 13% of rainfed crops into shrub savannah (Table 3). This expansion of arboriculture (orchards) to the detriment of rainfed crops in some parts of western Burkina Faso was also highlighted by the study of Kekele (2015, p. 34).
|
Occupancy Units in ha |
RC |
RF |
TS |
SS |
BS |
SW |
Onchard |
Total 1990 |
|
Rainfed crop |
7,0 |
0,9 |
1,1 |
20,4 |
0,3 |
0,2 |
1,1 |
31,1 |
|
Riparian formation |
1,5 |
0,5 |
0,5 |
2,7 |
0,0 |
0,0 |
0,1 |
5,3 |
|
Tree savannah |
0,5 |
0,0 |
0,1 |
1,1 |
0,0 |
0,0 |
0,0 |
1,7 |
|
Shrubby savannah |
13,0 |
0,9 |
1,9 |
42,6 |
0,7 |
0,2 |
0,3 |
59,5 |
|
Bare soil |
0,1 |
0,0 |
0,0 |
0,2 |
0,1 |
0,0 |
0,0 |
0,4 |
|
Surface water |
0,0 |
0,1 |
0,0 |
0,0 |
0,0 |
0,2 |
0,0 |
0,3 |
|
Onchard |
0,0 |
0,1 |
0,1 |
0,9 |
0,0 |
0,0 |
0,6 |
1,7 |
|
Total 2020 |
22,1 |
2,5 |
3,7 |
68 |
1,1 |
0,6 |
2 |
100 |
Table 3. Transition matrix of land use units (in %) between 1990 and 2020. Source: LANDSAT 5 1990 and 8 2020 image processing. RC: Rainfed crop; RF: Riparian formation; TS: Tree savannah; SS: Shrubby savannah; BS: Bare soil; SW: Surface water
26The relics of riparian formations, useful for protecting the banks of surface waters, have also regressed by 4.8% to the benefit of shrubby savannahs (0.9%) and rainfed crops (0.9%). This degradation of the vegetation cover along the watercourses (photo 2) is perceived by 58% of the households surveyed. The degradation of the vegetation in the study area has been accentuated by land pressure following the expropriation of local populations for the benefit of irrigated areas3. In general, the high demand for arable land and poor agricultural practices under contrasting climatic conditions contribute to the regression of vegetation (Yaméogo and al., 2020, p. 53 ). However, the increased denudation of the riverbanks in the sub-watershed is mainly linked to land pressure and the non-respect of easement strips (100m from the riverbed). The main reasons for the anarchic occupation of riverbanks are the permanent quest for water resources (proximity to water) and soil fertility (Drabo et al., 2016, p. 949). This proximity to water and the richness of the soil explain the proliferation of mango orchards and sugar cane crops in the area, which leads to the regression of forest galleries (Ouandé and al., 2021, p. 224-225).
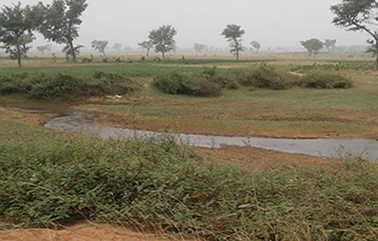
Photo 2. Bare banks of the Comoé River in Siniena, favouring the filling of the riverbed. Source: Field shots, 2020
27With regard to the anti-erosion role of plant cover (Adamou et al., 2022, p. 9), the denudation of riverbanks accelerates water erosion; all the more so as soils under plant formations are more resistant to water erosion than soils under cultivation and bare soils (Yaméogo et al., 2020, p. 50-53). The absence of vegetation cover favours surface runoff, whose transport of solid particles (detachment by splash effect) towards surface depressions contributes to the filling of surface waters (Karambiri et al., 2009, p. 230).
28In addition to soil denudation, the uncontrolled use of chemicals (fertilisers, insecticides, pesticides) for plant treatment and soil improvement also leads to surface water pollution. Beyond chemical pollution, Adjagodo and al. (2016) reveal that industries and hospitals, through their effluent and solid waste discharges, constitute a source of pollution of aquatic ecosystems. This pollution leads to degradation of water quality and death of aquatic animals (fish, frogs, toads). The degradation of surface water resources, together with the multiplicity of users, increases the risk of conflicts in the study area.
C. Risk of intensifying conflicts due to gradual water need
29As water is a territorial resource, its appropriation is subject to competition that sometimes leads to conflicts. Water conflicts between users are likely to increase, as Figure 4 illustrates a chronic decrease of water quantities in the sub-catchment area, while demand is constantly increasing. The data that have been used to build the Figure 4 come from the regional agency of Comoé basin and the Local water committee.
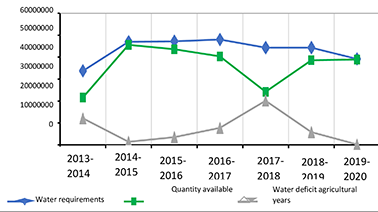
Figure 4. Evolution of the gap between water needs and real water quantity for users in the sub-basin. The blue curve represents water needs; the green curve represents the real quantity of water and the gray color is the water shortage. Source: CLE-Haute Comoé, March 2021
30Despite the slight increase in surface water volumes from the 2018- 2019 season onwards, the demand expressed by all users between 2013 and 2020 (43 398 317.29 m3) remains high compared to the real quantity of water (36 113 402.14 m3). This translates into a water need of estimated at 7,284,915.14 m3 (17% of total demand). However, agricultural water abstractions show that the magnitude of the water deficit varies according to user groups (Table 4).
|
Users |
Withdra wal in m3 |
Sown area in ha |
Withdrawal m³/ha |
Water requirement (m³/ha) recommended by FAO/cycle |
|
SN- SOCUCO |
30523256,3 |
4000 |
7,630.81 (6 months) |
15 000 - 25 000 |
|
Vegetable farmers |
7190204,14 |
1355,25 |
5,305.44 (5months) |
12 250 |
|
Rice farmers |
2 543888,86 |
350 |
7,268.25 (4 months) |
5000 – 9500 |
Table 4. Water abstraction by agricultural users in the Upper Comoé sub-basin. Source : CLE-Haute Comoé, March 2021
31The volumes of water withdrawn by market gardeners and SN- SOSUCO for irrigation purposes are well below the standards recommended by FAO in 2017. On the other hand, water withdrawals by rice farmers seem to respect the standards set by FAO (2017). This disparity in the use of agricultural water explains the conflictual relations between SN-SOSUCO and other users on the one hand, and between the market gardeners at the upper end of the river (Karfiguéla, Lemouroudougou, Tengréla, etc.) and those at the lower end of the river (villages of Diarrabakoko and Siniena) on the other. These results are line with F. Sanogo (2023, pp. 151-153) who revealed the risks of conflicts due to pressure on water resource in the sub catchment Planti 2 of High Mouhoun. However these results contrast with those of an earlier study by S. Palé and al. (2021, pp. 437-438) in the study area. The authors reveal that the volumes of water withdrawn by market gardeners and the ‘’Société sucrière de la Comoé (SOSUCO)’’ meet FAO (2017) standards while rice is over-irrigated. The difference in results can be explained by the conflicting relationships between user groups for the appropriation of the resource. These conflicting tensions have favoured the creation of an endogenous system of equitable and rational sharing of water resources.
D. Effective water resource allocation and protection
1. Strength of the water allocation system
32Aware of the conflicting tensions inherent in multiple uses and land pressure, the communities have instituted an innovative mechanism for rational and equitable water allocation. Created in 2008 from the ashes of the dam management committee, the Local Water Committee of the Haute- Comoé (CLE-HC) is the operational body for Integrated Water Resources Management (IWRM) at the sub-watershed level. It has a restricted technical committee of 14 members, including 4 representatives of the State, 4 civil societies, 3 local authorities and 3 users (Table 5).
|
Water users |
Representative of the State |
Local authority |
Civil society |
|
National office in charge of water and sanitation |
Regional office in charge of agriculture |
Commune of Banfora |
Association Munyu |
|
National industry for sugar production (SN-SOSUCO) |
Regional office in charge of water and sanitation |
Commune of Bérégadougou |
AEDE (water and development association) |
|
Karfiguéla Plain |
Regional office in charge of agriculture |
Commune of Toussiana |
WOUOL |
|
Regional agriculture chamber |
AGEREF (Association for the forest wildlife resources management) |
Table 5. Stakeholders of the IWRM Core Technical Committee in CLE-HC. Source: CLE-Haute Comoé, March 2021
33The development of water allocation plans follows a three-stage process. At the beginning of each dry season (October-December), the select committee estimates the volumes of water stored in the main reservoirs of the sub-watershed (Comoé, Lobi and Toussiana dams). The assessment of the stored water volumes is first done by reading the water level of the reservoir using a limnometric scale. The water height is then converted into volume by means of a relationship established between the height-volume variables (reservoir filling curve). Finally, the committee assesses the water needs of all users before starting negotiations with the users on the areas to be planted, the flows to be released from each reservoir and the flows to be delivered to each group of users according to the month. When the negotiations are concluded, the representatives of the stakeholder groups on the select committee are responsible for disseminating the information to the stakeholders at the grassroots level. Unannounced field trips are also made in case of friction between users or to check the effectiveness of the recommended flow rates.
34The water allocation plan of the CLE-HC Select Committee, developed on the basis of consultation between stakeholders, remains the main tool for informing water users in the sub-catchment. By allowing users to inform each other about the equitable sharing of water, the allocation system becomes an effective mechanism for preventing conflicts of use.
2. Weakness of the water allocation system
35The results of the CLE-HC allocation scheme in terms of equitable water sharing seem to be globally effective. However, its level of effectiveness varies from one territory to another. The effectiveness of the system is very high (85% of respondents) in the downstream and upstream terroirs (along the river). However, it is average (moderate) in the rice-growing plain of Karfiguéla (60% of respondents). The high efficiency of the allocation plan along the river can be explained by the relative access to water due to the predominance of market gardening, which requires less water. On the other hand, in the Karfiguéla plain, the demand for water for rice cultivation added to the decrease in the volume of water from the dams prevents the beneficiaries from exploiting all the plots in the dry season. Although marginal, the non- appropriation of the allocation system by 4% of market gardeners and 10% of rice farmers also demonstrates a weakness in the CLE-HC information dissemination system. In addition to the low frequency of monitoring trips, which reduces the effectiveness of the select committee's decisions, the members of the non-agricultural users do not feel concerned by the dissemination of information on the water allocation system. This is due to the fact that their representatives have not been integrated in the select committee of the CLE-HC.
36The study of S. Palé and al. (2021, p. 439) also revealed the weakness of the CLE-HC's 'dissemination' link. The authors attest that, due to the risks of omission and the non-inclusiveness of the select committee, the information supposed to be relayed by the CLE-HC representatives within the select committee is not well relayed to all IWRM stakeholders or to the general public of the sub-watershed.
37Despite the weaknesses of the CLE-HC allocation system, it is a relevant tool for preventing conflicts of use in the sub-watershed. In addition to the allocation system, endogenous methods for protecting water resources are developed.
3. Concerted action by stakeholders to protect water resources
38Aware of the water conflicts and the threats of agro-industrial activities on water resources, the actors of the sub-watershed carry out concerted actions of land restoration and protection of surface water banks. The financial and technical support of the Agence de l'Eau des Cascades (AEC) to the CLE-HC has enabled reforestation sessions to be carried out (photo 1 of photographic plate n°2); this has contributed to the densification of the vegetation cover along the banks of the dams and rivers. The creation of 200 ha classified forest of Lougoua in the commune of Samogohiri is an illustrative example (Photo 3). In addition, the delimitation of the easement strip of the main dams (Moussodougou, Toussiana and Lobi water bodies) and watercourses to reduce sedimentation and the filling of surface waters. Training and awareness-raising on soil protection techniques (stone barriers, grass strips, agroforestry, etc.) and chemical waste management are also carried out by the CLE-HC, the AEC and the decentralised services of the State for the benefit of farmers. In terms of chemical waste management, 83% of respondents abandoned the practice of disposing of chemical packaging in the wild in favour of incineration.
39These endogenous actions of land restoration and water resource protection are not the only isolated cases. The work of Drabo and al. (2016, p. 948-950) also indicates community awareness-raising actions for the respect of the easement strip, the planting of trees, the adoption of technological packages (stone cordons, zai, mulching), the erection of grass strips and the treatment of gullies around Lake Bam. However, unlike the endogenous methods of protecting the banks in this study, the failure to establish an easement strip around Lake Bam is a major weakness of these farmers' strategies.
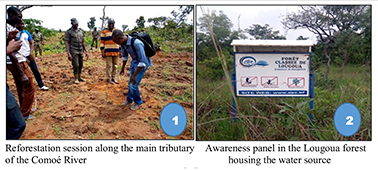
Photo 3. Farmers' actions for land restoration in the sub-basin. Source: Field shots, 2020
40About the initiatives of stakeholders, M. Dieng (2011, p. 2) mentioned:” the consequences of the increasing of water resources scarcity provide an opportunity for certain groups of stakeholders to develop strategies to capture external funding’’. So, it’s important to be careful about the stakeholder’s management in the sense water resources essential for life and economic progress.
Conclusion
41The Upper Comoé sub-watershed has a relative abundance of water resources. But with the multiplicity of users and increasing land pressure, water sharing is the subject of latent conflicts between users. This led to the creation of an integrated water resources management body (CLE-HC) in 2008, which adopted an allocation plan for the equitable sharing of water. As a tool for producing useful information for decision-making, the allocation system helps to prevent the risk of conflict through the equitable sharing of water between users. The concerted actions of the CLE-HC with state and parastatal actors also promote the sustainable protection of surface water banks.
42However, the allocation system could be improved, as the select committee is not inclusive and its dissemination is limited. Improving the system therefore requires expanding the select committee to include other stakeholders such as non-agricultural users, customary and religious leaders to facilitate the appropriation of information at the grassroots. Despite the ups and downs of the CLE-HC allocation system, it remains an important tool for conflict prevention and equitable water sharing that could inspire the CLEs of other sub-watersheds in the country.
References
43ADAMOU, S. N., GOURFI, A., TOURÉ, A. A. and DAOUDI, L. (2022). "Water erosion in southwest Niger: impacts of natural and anthropogenic factors on soil losses", Geomorphology: relief, processes and environment, vol. 28, n°2, pp.1-28 https://doi.org/10.4000/geomorphologie.16744
44ADJAGODO, A., AGASSOUNON, DJIKPO TCHIBOZO, M., KELOME, N. C. and LAWANI, R. (2009). "Fluxes of pollutants linked to anthropic activities, risks on surface water resources and the trophic chain throughout the world: bibliographic synthesis", Int. J. Biol. Chem. Sci, vol.10, n°3, pp.1459-1472 DOI:10.4314/ijbcs.v10i3.43
45BOUQUET, C. (2011). "Conflicts and risks of water-related conflicts in Africa", Les Cahiers d'Outre-Mer, n°255, pp.341-362 DOI : 10.4000/com.6283
46CHALIFOUX, S., NASTEV, M., LAMONTAGNE, C., LATIFOVIC, R. and FERNANDES, R. (2006). "Mapping of land use and occupation by Landsat satellite imagery in hydrogeology", Revue Télédétection, vol.6, n°1, pp. 9-17
47COUR J., 2010. Gestion des eaux du bassin de la Haute Comoé (Burkina Faso), Institut International de Gestion de l’eau, Ouagadougou, Burkina Faso, 40 p:
48DIEN M., 2011. L’eau en Afrique, les paradoxes d’une resource très convoitée www.leadinafrica.org
49DI GREGORIO, De A. and JANSEN, L. J.-M. (2000). Land Cover Classification System, Classification Concepts and User Manual, Software Version 2, Food and Agriculture Organization of the United Nations: Rome, Italy, 2005, 190 p.
50DRABO, K., YAMEOGO, J. and SAWADOGO, L. (2016). "Examination of the management and protection strategies of the banks of Lake Bam in Kongoussi in the Centre-North of Burkina Faso" Int. J. Biol. Chem. Sci, vol.10, n°3, pp.944-956
51DUCROS-GAMBART, D., LE TOAN, T. and DESHAYES, M. (1984). "Utilisation des données Landsat pour la cartographie des formations végétales tropicales dans le sud de Sumatra", L'Espace géographique, Vol.13, n°3,
52pp. 205-214 https://www.jstor.org/stable/44382326
53FANGNON, B., BABADJIDE, C. L., GONZALLO, G. and TOHOZIN, A. Y., (2013). "Demographic pressure and environmental degradation in the department of Couffo in Benin", review of geography of the Leïdi laboratory, - ISSN0051 - 2515 -N°11, pp. 267-276
54FAO, (2017). Crop Water Information. FAO. Retrieved September 10, 2017, from http://www.fao.org/landwater/ databases-and-software/crop- information/en/
55HELLENDORFF, B. (2013). Water, Conflict and Cooperation-Water Management in West Africa: Risks and Opportunities, Analysis Note of the Groupe de Recherche et d'Information sur la Paix (GRIP), Brussels, 18 p.
56KARAMBIRI, H., YACOUBA, H., BARBIER, B., MAHÉ, G., PATUREL, J.-E. (2009). "Characterization of runoff and erosion from the plot to the watershed in the Sahelian zone: the case of the small Tougou watershed in northern Burkina Faso". In: Blöschl G. (ed.), Van de Giesen N. (ed.), Muralidharan D. (ed.), Ren L. (ed.), Seyler Frédérique (ed.), Sharma U. (ed.), Vrba J. (ed.). Improving integrated surface and groundwater resources management in a vulnerable and changing world: proceedings of symposium JS.3. Wallingford: IAHS, pp. 225-230. (Publication - IAHS; 330). JS.3 Symposium: Improving Integrated Surface and Groundwater Resources
57Management in a Vulnerable and Changing World, Hyderabad (IND), 2009/09/06-12. ISBN 978-1-907161-01-8. ISSN 0144-78
58KOUDOUGOU, V., OUMAROU, A. and DEBEVEC, L. (2019). La Police de l'Eau, instrument de la GIRE au Burkina Faso: réalisations et limites, technical note-International Water Management Institute, 7 p.
59LASSERRE, F. (2006). "Le partage de l'eau dans le monde : un enjeu majeur du XXIe siècle", Mélanges de la Casa de Vélasquez, vol.36, n°2, pp.171-183 URL : http://mcv.revues.org/2324
60Ministry of the Environment and Fisheries Resources (MERH), (2015). Burkina Faso's National Climate Change Adaptation Plan (PNA), final report, 155 p.
61NIASSE, M. (2004). "Preventing conflicts and promoting cooperation in the management of transboundary rivers in West Africa", VertigO, Vol.5, n°1, 21 pp.1-21
62OUANDÉ, M., YAMÉOGO, L., YAKA, P., OUÉDRAOGO, A. and LANKOANDÉ, B. (2021). "Carapa procera, a marginal species of gallery forests in western Burkina Faso under climate change and anthropic pressure", Cahiers de l'IREA, n°45- 2021, pp. 213-245
63PALE, S., TRAORE, F., WELLENS, J. and TYCHON4, B. (2019). "Diagnosis of a water management information system for agricultural use in the Haute-Comoé sub-watershed, Burkina Faso", Geo-Eco-Trop, vol.43, n°3, Special Issue, pp. 433-443
64PONTIUS, R. G. (2000). "Quantification error versus location error in comparison of categorical maps", Photogrammetric engineering and remote sensing, vol. 66, no. 8, pp. 1011-1016
65SANOGO F., OUEDRAOGO T. L., SODORE A. A., KEKELE A., 2023. Aménagements hydro-agricoles et conflits fonciers dans le sous bassin versant Plandi 2 du Mouhoun supérieur, Burkina Faso, Revue de Géographie de Ouagadougou, pp. 143-157
66SANOGO, I. (1997). Études hydrométéorologiques du bassin de la Comoé et bilan hydrologique des retenues de Toussiana, Lobi, et Moussodougou, Mémoire d'ingénieur, École Inter-État d'Ingénieurs de l'Équipement Rural (EIR) de Ouagadougou, Burkina Faso, 89 p.
67SOULAMA, S. (1994). L'insertion des migrants en milieu urbain: Cas de Banfora-Burkina Faso. Tome 1- Insertion sociale, Master's thesis, Department of Geography, University of Ouagadougou, 94 p.
68WOLF, A. T. (2001). Water and human security, Department of Geosciences, Oregon State University, WOLF, Journal of Contemporary Water Research and Education, vol.118, n°1, pp.29-37.
69YAMÉOGO, A., SOMÉ, Y. S. C., PALÉ, S., SIRIMA, B. A. and DA, D. É. C. (2021). "Application of GIS/RUSLE to the estimation of erosion by sheet runoff in the upper Sissili watershed (Burkina Faso)", Geo-Eco- Trop, vol.45, n°2, pp. 299-310
70ZERBO, D. (2017). Etat de la mise en œuvre de la gestion intégrée des ressources en eau (gire) dans le sous bassin versant de la haute- Comoé au Burkina Faso, Mémoire de Master en sciences et gestion de l'environnement dans les pays en développement, Université de Liège et Université Catholique de Louvain, 49 p.
71ZOUNGRANA, B. J.-B., CONRAD, C., AMEKUDZI, L. K., THIEL, M., DA, D. E. C., FORKUOR, G. and FABIAN, L. (2015). "Multi-Temporal Landsat Images and Ancillary Data for Land Use/Cover Change (LULCC) Detection in the Southwest of Burkina Faso," West Africa, Remote Sensing [Online], vol. 7 no. 9, pp.12076-12102, URL: www.mdpi.com/journal/remotesensing
Para citar este artículo
Acerca de: Abdoul Azise SODORE
Université Joseph KI-ZERBO
Abdoulazise.sodore@ujkz.bf
Acerca de: Moumouni OUANDE
Université Joseph KI-ZERBO
ouandmoumouni@gmail.com
Acerca de: Tiécoura SOULAMA
Université Joseph KI-ZERBO
tiecksoul96@gmail.com
