


- Accueil
- 80 (2023/1) - Estimer les changements climatiques ...
- Discussing an extreme mock/what-if scenario over the antarctic peninsula: the effect of intense melt on surface mass balance


Visualisation(s): 1377 (20 ULiège)
Téléchargement(s): 167 (3 ULiège)

Discussing an extreme mock/what-if scenario over the antarctic peninsula: the effect of intense melt on surface mass balance

Document(s) associé(s)
Version PDF originaleRésumé
Cet article interprète, sous forme d’une discussion générale, les résultats d'une étude récente comparant les estimations de fonte du Modèle Atmosphérique Régional (MAR), celles dérivées des modèles de stations météorologiques automatiques (AWS), et l’imagerie satellitaire micro-onde sur la Péninsule Antarctique de 2019 à 2021. Notre interprétation révèle un paradoxe : MAR surestime la fonte par rapport à la fonte basée sur les AWS, mais sous-estime la fonte par rapport à l'imagerie satellitaire.
Cette divergence souligne notre compréhension limitée des processus de surface. Pour en illustrer les implications potentielles, nous présentons un scénario fictif (“what-if”) qui explore un cas extrême de fonte, basé sur les paramétrisations de Kittel et al., 2022, et les valeurs aberrantes de l'étude de Dethinne et al., (2023). Nous examinons l'impact sur le bilan de masse en surface (SMB) de la calotte glaciaire, en établissant des parallèles avec la situation au Groenland pendant les années 1990, où une augmentation de la production de fonte en surface a eu des effets en cascade sur le SMB.
De plus, nous soulignons que la présence d'eau liquide à la surface du manteau neigeux peut être un précurseur de processus de déstabilisation significatifs sur les plateformes de glace, bien que cet aspect ne soit pas l'objet de notre article. En ouvrant un débat sur la précision et l'interprétation de la modélisation de la fonte, nous visons à attirer l'attention sur les conséquences potentielles des événements de fonte extrême sur la SMB et la stabilité de la calotte polaire antarctique.
Abstract
This discussion paper interprets the findings of a recent study comparing melt estimates from the regional atmospheric model MAR, those derived from Automatic Weather Stations (AWS), and microwave remote sensing images over the Antarctic Peninsula from 2019 to 2021. Our interpretation reveals a paradox: MAR overestimates melt when compared to AWS-based melt estimates, yet underestimates melt when compared to satellite imagery.
This discrepancy underscores a fundamental gap in our understanding of surface processes. To illustrate the potential implications of this gap, we present a fictional (“what-if”) scenario that explores an extreme case of melting, based on parametrizations from Kittel et al., 2022, and the outliers of Dethinne et al., 2023. We examine the potential impact on the ice sheet's surface mass balance (SMB), drawing parallels with the situation in Greenland during the 1990s, where increased melt production had cascading effects on SMB.
Moreover, we highlight that the presence of liquid water at the surface of the snowpack can be a precursor to significant destabilization processes over ice shelves, although this aspect is not the focus of our current paper. By opening a debate on the accuracy and interpretation of melt modeling, we aim to draw attention to the potential consequences of extreme melting events on the Antarctic Ice Sheet's SMB and stability.
Table des matières
Introduction
1The Antarctic Ice Sheet (AIS) holds significant potential for contributing to global sea-level rise. If completely melted, AIS has the potential to raise the sea level by up to 56 meters, in addition to the 7-meter sea-level rise from the Greenland Ice Sheet (GrIS) (Fretwell et al., 2013; Pfeffer et al., 2014). The AIS presently contributes 0.6 mm/yr to sea level, with projections indicating potentially a greater contribution in the future. Predictions suggest a rise of up to 1 meter in sea level by 2100 (IPCC, 2023), but these projections are characterized by considerable uncertainties arising from incomplete process understanding and limited high-resolution data (Seroussi et al., 2020).
2Seroussi et al. (2020) highlighted the absence of consensus regarding future ice sheet mass change estimates due to disparities in representing physical processes. The necessity for a comprehensive assessment of surface meltwater and its drainage is emphasized to comprehend the influence of water movement across the ice surface. Despite extensive research in Greenland, the broader comprehension of Antarctic-wide surface hydrology and its evolutionary trajectory remains limited. Within a warming climate, the potential acceleration of ice-mass loss from Antarctica is underscored, driven by intricate positive feedback loops interlinking exposed rock extent, ice sheet melting, and thinning. This interplay is compounded by the interrelated effects of melting and wind erosion, leading to a lowering of the ice surface, expansion of exposed rock areas, and consequent blue-ice formation (Seroussi et al., 2020).
3While the Surface Mass Balance (SMB), the difference between accumulation and ablation factors, of the AIS has remained relatively stable, the surface melt, particularly over the ice shelves, is expected to increase, potentially leading to significant destabilization processes (Favier & Pattyn, 2015; Furst et al., 2016; Gilbert & Kittel, 2021). Currently, most of the mass loss of the AIS comes from ice discharge and ice shelves basal melting, driven by enhanced ice flows in certain parts of the AIS that are in contact with warm, salty, subsurface circumpolar deep water (Vaughan et al., 2006).
4Overall, the AIS mass is projected to increase, particularly due to snowfall, but could be offset when warming exceeds 2.5°C (Kittel et al., 2021). While snowfall events exhibit a linear relationship with surface temperature, runoff displays an exponential response, and the equilibrium between these processes can be achieved. However, Bell et al. (2018) identified a mitigating feedback mechanism: enhanced snowfall could thicken the firn layer on both ice sheets and shelves, thereby boosting its ability to infiltrate, store, and refreeze meltwater.
5Our current understanding of Antarctic hydrology remains limited, posing challenges to predicting future hydrological patterns (Kingslake et al., 2017). With surface melt increasing, ice shelves tend to weaken. Bell et al. (2018) revealed three key “modes” of this melt-related destabilization. First, low-albedo regions like exposed rock formations (nunataks), 'blue ice', and lakes on ice sheets experience enhanced direct surface ablation due to the albedo feedback, reducing the reflection of incoming shortwave radiation compared to adjacent snow or ice surfaces. Second, connections between ice surface hydrology and the ice-sheet base alter ice dynamics through modified basal thermal and hydrologic conditions, often via lakes draining into fractures, rivers into moulins, and firn aquifers into fractures. Third, on the floating ice shelves of Antarctica, water accumulates in surface depressions, which are influenced by factors such as basal crevassing and ocean melting. As water fills these depressions, enhanced lake-bottom ablation and the flexural response of the floating ice to the water load deepen the basin. Concurrently, water-filled fractures can vertically propagate, potentially leading to through-ice fractures. As a consequence of ice shelves’ thinning and collapse, they are less able to constrain the ice flows by buttressing, which will eventually lead to an increase in ice flow velocity and consequently in mass loss (Paolo et al., 2015).
6Finally, a part of the uncertainty can be attributed to local atmospheric processes. In particular, atmospheric rivers, characterized by concentrated water vapor fluxes, play a significant role in meridional moisture transport. Atmospheric rivers contribute to solid and liquid precipitations in East Antarctica and influence surface melt events, affecting the surface mass balance either positively or negatively (Wille et al., 2019). These events also contribute to the prevalence of wet snow at high altitudes. Notably, the random nature of these events contributes to climate variability from year to year.
7In the following discussion, we would like to explore the discrepancies in the way melt is estimated from a regional atmospheric model, Automatic Weather Station (AWS), and passive microwave and scatterometer satellites, over the Antarctic Peninsula from 2019 to 2021, and draw some conclusions with regards to the current literature in this matter.
I. Melt estimates: model vs. weather station vs. satellites
8There are multiple ways to characterize melt in Antarctica. First, we can estimate it from weather stations and use an inverse modeling approach. The approach computes the surface energy balance and derives the corresponding amount of melt flux (Jakobs et al., 2020). Another approach is using a regional climate model with a dynamical snow component, such as MAR (Modèle Atmosphérique Régional, see Supplementary). This model is forced at its boundaries using Earth System Models and derives atmospheric and surface states at each pixel for each time step, which includes the amount of water within the first layers of the snowpack (Kittel et al., 2021). Finally, Earth Observation (EO) from satellite images, and microwave sensors in particular, are highly sensitive to the presence of liquid water. Because of rapid signal saturation, simple methods only detect binary wet-snow masks (Picard et al., 2022), but have the double advantage of large coverage, high resolution and short revisit time.
9Our study underlines a paradox in the comparison of melt estimates from MAR and AWS (see Supplementary for data and simulation descriptions). While MAR overrepresented melt when compared to AWS-based melt (Figure 1, left), it underrepresented melt when compared to satellite imagery (Figure 1, right). In Figure 1 (left), melt estimated by climate models and energy-balanced-based estimates from AWS diverge, with MAR overestimating the melt fluxes in comparison to AWS by more than 30%.
10The discrepancy between the model and the integration of EO-based data within the model is significant, as the introduction of EO-based melt products drastically increases the number of melt days over ice shelves (Figure 1, right). More specifically, Larsen ice shelves are presumably prone to more melt than what the model alone estimates.
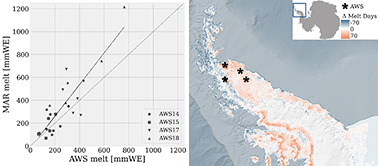
Figure 1. (left) Comparison between surface melt production modeled by the regional climate model MAR and the surface melt production modeled by automatic weather stations (AWS) [millimeter Water Equivalent - mmWE/day]. (right) Difference in the number of melt days between MAR with assimilation of satellite images and MAR without assimilation over the Antarctic Peninsula for the 2019-2020 melt season as done in Dethinne et al., (2023). A positive value indicates that the integration of satellite images increases the number of melt days in the model. The details of the simulation and AWS data are presented in the Supplementary section.
11The comparison of modeled melt extent from MAR and observed melt extent from active and passive microwave spaceborne sensors further highlights the discrepancies in melt estimates (Figure 1, right). The significant differences observed between the two methods of estimation underscore the need for further investigation and refinement of our melt modeling techniques (Dethinne et al., 2023).
12Similarly, Figure 2 displays the melt extent from MAR compared to satellites, where important differences are observed. It also shows the different results from sensor to sensor, encouraging multi-frequency approaches to analyze the spectral signature of the wet snow. In particular, microwaves have a penetration depth depending on the frequency, meaning that a lower frequency microwave sensor (such as ASCAT) can see subsurface liquid water content while a higher frequency sensor (ASMR2) detects no presence of water. This can be observed by ASCAT detecting significant liquid water content later at the end of the melt season, probably at a depth not observable by the higher frequency AMSR2 sensor.
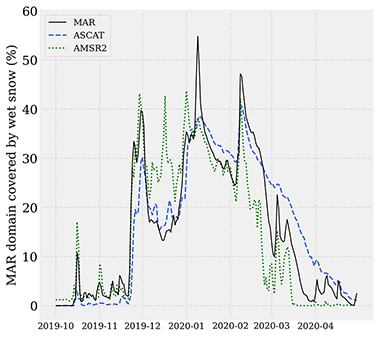
Figure 2. Comparison between modeled melt extent from the regional climate model MAR (version 3.12) and observed melt extent from passive microwave spaceborne sensors over the Antarctic Peninsula.
13This difference between RCM and satellites is not tied to MAR. Kingslake et al. already showed in 2017 that RACMO, another state-of-the art RCM (van Wessem et al., 2018), could underestimate the liquid water content on the Amery ice shelf by several orders of magnitude. He also exposed the lack of association of these models to blue ice or exposed rock, accounting for this difference. In general, RCMs tend to model much less water than what high-resolution satellites are observing, pointing out the need for better refining surface hydrology in regional models.
II. What-if scenario: an extreme case of melting
14Given prior discussions, due to the uncertainties surrounding precise measurements of surface meltwater, it may be beneficial to consider a hypothetical scenario (“what-if”). This would involve exploring an extreme melt event and analyzing its potential consequences.
15Based on parametrizations from Kittel et al., 2022, and the outliers of Dethinne et al., 2023, we present a fictional scenario where surface meltwater in MAR amplifies drastically (by roughly a factor of four – see Figure 3). It's crucial to note that each snow or firn layer can retain a maximum of 5% water (variable among models). When the density of the underlying snow approaches 830 kg/m³, water beyond this threshold percolates down. Excess surface water that might typically form melt ponds is deemed as runoff. The consequence of this modeling scheme is that important levels of surface meltwater led to a rise in snowpack density, indicating saturation, and culminating in a negative cumulative surface mass balance over the melting season (Figure 3). Moreover, such an event should also impact on the next melting seasons, which is not discussed here.
16Additionally, as highlighted by Kuipers et al., 2014, such saturation in the firn layer is a precursor to hydrofracturing. This situation is exacerbated in the case of successive years of intensified melt events, compromising the firn's ability to maintain its air content and its capacity to hold liquid water. Paired with increased rainfall, these compound events are prone to increase in future simulations (Kittel et al., 2021), with a (near-)linear increase in precipitation with air temperature and an exponential increase of surface meltwater production (Trusel et al., 2015).
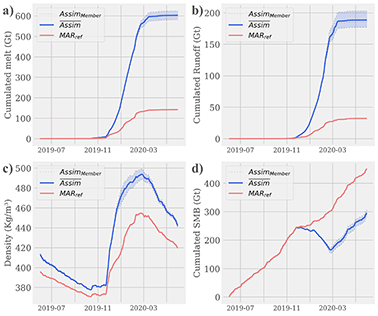
Figure 3. Evolution of essential snowpack variables for the period 2019-2020 over the Antarctic Peninsula. a) Melt; b) Runoff; c) Snow density; d) Surface Mass Balance. Blue = forced extreme melt simulations, and its sensitivity range as outlay; Red = reference case.
III. Potential implications and future research
17Historically, the Antarctic Peninsula (AP) has experienced atmospheric warming that surpasses Antarctic averages, resulting in melting levels not seen over the past millennium in its northeast. This accelerated melting has expanded meltwater ponding, leading to hydrofracturing, a dominant cause of the area's ice shelf collapses. In 2015, Trusel et al. pose an insightful question: if other ice shelves encounter conditions similar to those preceding the collapse of Larsen A and B, might they face a similar fate?
18The potential impact of extreme melting events on the Antarctic Ice Sheet's SMB should open discussions about our current representation of melt. We can draw parallels with the situation in Greenland during the 1990s, where rapid changes in atmospheric conditions induced increased melt production, which had cascading effects on SMB (Noel et al., 2017). In addition to this direct SMB contribution, the presence of liquid water at the surface of the snowpack can be a precursor to significant destabilization processes over ice shelves (Banwell et al., 2021).
19However, it is important to note that our current understanding of these processes is limited, and largely depends on observations on the Antarctic Peninsula. There are still many unanswered questions about the long-term consequences of melting events and snowpack saturation on ice shelf stability, and upstream grounded ice (Donat-Magnin et al., 2021; van Wessem et al., 2023). Moreover, accurate SMB observations are scarce, given the need for extensive spatial and temporal coverage, exacerbated by the harsh Antarctic environment. More specifically, our current interpretation of Antarctic hydrology is primarily derived from satellite and airborne imagery, highlighting a pressing need for more comprehensive field-based observations (Bell et al., 2018).
20Among the “known unknowns”, we can cite the discrepancies between albedo over bare ice in MAR compared to satellite data (Antwerpen et al., 2022). Over fresh snow, albedo representation between the different regional climate models also greatly differs, for present and future climate, as demonstrated within the European H2020 PROTECT project. Albedo has a great influence on the surface energy balance and consequently on melt production. This is particularly important as surface albedo plays an important role in controlling Antarctic surface melt, with low-albedo areas like blue ice and nunataks facilitating melting by absorbing solar energy. This process, enhanced by melting and wind erosion, enlarges exposed rock areas, establishing a coupling between melting, rock exposure, and blue-ice formation (Kingslake et al., 2017).
21This position is shared by Kittel et al. (2021), acknowledging MAR limitations, and recognizing the influence of present (but undetectable) biases on future projections and the need for thorough climate evaluation. Unrepresented processes like melt-elevation feedback and changing surface geometry contribute to their uncertainties. The study's findings underscore the intricate balance of Antarctica's SMB and the imperative of accurate representation in climate models.
22In this context, the concept of “what-if” presented here is to be taken with a grain of salt, because the simulations we pmroduced were based on historical reanalysis data, with tweaks on the regional climate model MAR related to its EO-data assimilation module. Nevertheless, our study highlights and confirms the complex interactions between melt production, snowpack density, and runoff, emphasizing the importance of ongoing research in this area. These “what-if” scenarios are encouraged and increasingly made possible in the context of the development of regional Digital Twin initiatives (https://dte-antarctica.org), in order to investigate hypothetical situations and assess their consequences (Gourmelen et al., 2023).
23From a forward-looking standpoint, understanding meltwater accumulation on ice shelves and the impact of large-scale drainage emerges as a critical aspect of forecasting future ice-sheet stability. Given the non-linear relationship between melt rates in Antarctica and atmospheric temperature, known as "melt–temperature nonlinearity", minor inaccuracies in modeling present-day climate could lead to considerable biases in forecasting future meltwater production (Bell et al., 2018). In particular, underestimation of meltwater production over current climate could significantly dampen the melt increase with rising temperatures while over current climate, models and observations compare well, as melt is fully absorbed by the snowpack.
24We note that some regions of Antarctica's surface hydrology appear to be mirroring Greenland's present-day ablation and percolation zones. The comparison reveals that projected melt rates in Antarctica by century's end align with current melt rates observed in Greenland (Bell et al., 2018). Notably, the Antarctic Peninsula may experience intensified melt akin to that of Greenland's lower ablation zone. While we can draw some similarities between the current GrIS and future AIS (referred to as “Greenlandification” - Mottram et al., 2021), the characteristics of these two ice sheets are distinct, and direct comparisons may have limitations.
25By opening a debate on the accuracy and interpretation of surface meltwater modeling, we aim to draw attention to these questions and highlight the need for further research in this area. Studies underscore the importance of improving our observations and modeling capabilities, leveraging Earth Observation, and advancing climate models to enhance our understanding of ice sheet processes and the associated impacts on the cryosphere.
26The concurrent development of observational capabilities and advancements in climate modeling and cryospheric research is a notable symbiosis. By analyzing model uncertainties via Earth Observation techniques, a more nuanced understanding of the complex ice sheet processes that govern the cryosphere and its implications is revealed. In this context, the upcoming launch of the passive microwave CIMR satellite, Europe's answer to the Japanese AMSR2 and American SSMIS satellites, is a promising indication of ESA's future directions. This launch complements the current Copernicus constellation of synthetic aperture radar satellites, all aimed at enhancing our understanding of Earth's evolving dynamics.
IV. Supplementary: models and EO data
A. Automatic weather stations
27The Wisconsin AWS 2B system records meteorological parameters in Antarctica. Some stations are distributed across the Antarctic Peninsula: AWS 14 (67.02°S, -61.5°E), from Jan '09 to Jun '15; AWS 15 (67.57°S, -62.15°E), from Jan '09 to May '14; AWS 17 in Larsen C Ice Shelf (65.93°S, -61.85°E), from Feb '11 to Mar '16; and AWS 18 in the Larsen B Ice Shelf (66.4°S, -63.73°E), from Nov '14 to Sep '18. They capture data on air temperature, air pressure, wind speed and direction, relative humidity, snow accumulation, water temperature, and surface energy components, from which melt rates are determined (Jackobs et al., 2020).
B. Model used for illustrations
28In this paper, we primarily employed results from the regional climate model MAR - Modèle Atmosphérique Régional, although results from RACMO were also part of the discussion (Kingslake et al., 2017). MAR (version 3.12, Lambin et al. 2023) is a specialized regional climate model extensively used in polar research. It is built on the hydrostatic approximation of the primitive equations (Gallée and Schayes, 1994) and incorporates a microphysics module managing five separate water entities, thereby contributing to the atmospheric heat and moisture balance (Gallée, 1995).
29The model includes a radiative transfer scheme akin to the ECMWF ERA-40 reanalysis (Morcrette, 2002) and the SISVAT (Soil Ice Snow Vegetation Atmosphere Transfer) module, which models mass and energy exchanges between the atmosphere and the surface (De Ridder and Gallée, 1998). Based on the CROCUS snow model (Brun et al., 1992), it provides a detailed representation of snow metamorphism across multiple layers, as extensively used in this paper.
30MAR also calculates dynamic surface albedo, adjusting for various factors such as snow properties and cloud presence (Tedesco et al., 2016). MAR includes atmospheric and sea surface conditions as model drivers, adding detailed physics to the atmospheric and surface levels.
C. Simulation characteristics
31The MAR was set with a horizontal resolution of 7.5km, 6-hourly forced by ERA-5 reanalysis data, over a time period from 2019 to 2021, with an initial spin-up period of 2 years for the atmosphere and snowpack. The representation of the snowpack is discretized in 30 layers representing the first 20 meters of the upper layers of the ice sheet, with a variable vertical resolution (upper layers being thinner than deeper ones). This reference simulation is then compared to EO-based assimilated simulations. These simulations utilize wet-snow masks, which allow for adjustments in the model's dynamics. The application of these masks assumes them as ground truth and modifies the model's snowpack temperature accordingly, either warming it up or cooling it down to align with satellite observations. The detailed description of the EO-based data is provided in the following section, while the assimilation techniques employed are elaborated on in Dethinne et al., 2023. The simulations considered in this paper were discarded in the paper of Dethinne et al., 2023, but instead discussed here, as part of a “what-if” scenario.
D. Remote sensing data
32The study incorporates data from two sensors: the Advanced Microwave Scanning Radiometer 2 (AMSR2) and the Advanced Scatterometer (ASCAT). AMSR2, part of the GCOM-W1, provides daily polar region observations. Using the 18.7 GHz channel data, we created two wet-snow masks by separately processing the satellite's ascending and descending paths. ASCAT, on the MetOp satellites, offers a backscattering coefficient at 4.45-km resolution.
33Wet-snow detection algorithms are described in Dethinne et al. 2023. For both sensors, wet-snow masks are interpolated onto the MAR grid, with each grid pixel state determined based on the most common condition in the corresponding satellite mask area.
Acknowledgments
34This project has received funding from the European Union’s Horizon 2020 research and innovation programme under grant agreement No 869304, and in the framework of the Digital Twin Antarctica Project European Space Agency Contract No. 4000128611/19/I-DT. This material reflects only the author’s view and the European Commission is not responsible for any use that may be made of the information it contains. The authors appreciate the support of the University of Wisconsin-Madison Automatic Weather Station Program for the data set, data display, and information, NSF grant number 1924730.
References
35Agosta, C., Amory, C., Kittel, C., Orsi, A., Favier, V., Gallée, H., van den Broeke, M. R., Lenaerts, J. T. M., van Wessem, J. M., van de Berg, W. J., & Fettweis, X. (2019). Estimation of the Antarctic surface mass balance using the regional climate model MAR (1979–2015) and identification of dominant processes. The Cryosphere, 13(1), 281-296. https://tc.copernicus.org/articles/13/281/2019/
36Antwerpen, R. M., Tedesco, M., Fettweis, X., Alexander, P., & van de Berg, W. J. (2022). Assessing bare-ice albedo simulated by MAR over the Greenland ice sheet (2000–2021) and implications for meltwater production estimates. The Cryosphere, 16, 4185–4199. https://doi.org/10.5194/tc-16-4185-2022
37Banwell, A. F., Datta, R. T., Dell, R. L., Moussavi, M., Brucker, L., Picard, G., Shuman, C. A., & Stevens, L. A. (2021). The 32-year record-high surface melt in 2019/2020 on the northern George VI Ice Shelf, Antarctic Peninsula. The Cryosphere, 15, 909-925. https://doi.org/10.5194/tc-15-909-2021
38Bell, R. E., Banwell, A. F., Trusel, L. D., et al. (2018). Antarctic surface hydrology and impacts on ice-sheet mass balance. Nature Climate Change, 8, 1044-1052. https://doi.org/10.1038/s41558-018-0326-3
39Brun, E., David, P., Sudul, M., & Brunot, G. (1992). A numerical model to simulate snow-cover stratigraphy for operational avalanche forecasting. Journal of Glaciology, 38, 13-22. https://doi.org/10.3189/S0022143000009552
40De Ridder, K., & Gallée, H. (1998). Land surface-induced regional climate change in Southern Israel. Journal of Applied Meteorology, 37, 1470-1485. https://doi.org/10.1175/1520-0450(1998)037<1470:LSIRCC>2.0.CO;2
41Dethinne, T., Glaude, Q., Picard, G., Kittel, C., Alexander, P., Orban, A., & Fettweis, X. (2023). Sensitivity of the MAR Regional Climate Model snowpack to the parametrization of the assimilation of satellite-derived wet-snow masks on the Antarctic Peninsula. EGUSPHERE. Manuscript submitted for publication.
42Donat-Magnin, M., Jourdain, N. C., Kittel, C., Agosta, C., Amory, C., Gallée, H., Krinner, G., & Chekki, M. (2021). Future surface mass balance and surface melt in the Amundsen sector of the West Antarctic Ice Sheet. The Cryosphere, 15, 571-593. https://doi.org/10.5194/tc-15-571-2021
43Favier, L., & Pattyn, F. (2015). Antarctic ice rise formation, evolution, and stability. Geophysical Research Letters, 42, 4456-4463. https://doi.org/10.1002/2015GL064195
44Fretwell, P., Pritchard, H. D., Vaughan, D. G., Bamber, J. L., Barrand, N. E., Bell, R., Bianchi, C., Bingham, R. G., Blankenship, D. D., Casassa, G., Catania, G., Callens, D., Conway, H., Cook, A. J., Corr, H. F. J., Damaske, D., Damm, V., Ferraccioli, F., Forsberg, R., Fujita, S., Gim, Y., Gogineni, P., Griggs, J. A., Hindmarsh, R. C. A., Holmlund, P., Holt, J. W., Jacobel, R. W., Jenkins, A., Jokat, W., Jordan, T., King, E. C., Kohler, J., Krabill, W., Riger-Kusk, M., Langley, K. A., Leitchenkov, G., Leuschen, C., Luyendyk, B. P., Matsuoka, K., Mouginot, J., Nitsche, F. O., Nogi, Y., Nost, O. A., Popov, S. V., Rignot, E., Rippin, D. M., Rivera, A., Roberts, J., Ross, N., Siegert, M. J., Smith, A. M., Steinhage, D., Studinger, M., Sun, B., Tinto, B. K., Welch, B. C., Wilson, D., Young, D. A., Xiangbin, C., & Zirizzotti, A. (2013). Bedmap2: improved ice bed, surface and thickness datasets for Antarctica. The Cryosphere, 7, 375–393. https://doi.org/10.5194/tc-7-375-2013
45Fürst, J. J., Durand, G., Gillet-Chaulet, F., Tavard, L., Rankl, M., Braun, M., & Gagliardini, O. (2016). The safety band of Antarctic ice shelves. Nature Climate Change, 6(5), 479-482. https://doi.org/10.1038/nclimate2912
46Gallée, H., & Schayes, G. (1994). Development of a three-dimensional meso-primitive equation model: Katabatic winds simulation in the area of Terra Nova Bay, Antarctica. Monthly Weather Review, 122, 671–685. https://doi.org/10.1175/1520-0493(1994)122<0671:DOATDM>2.0.CO;2
47Gallee, H. (1995). Simulation of the Mesocyclonic Activity in the Ross Sea, Antarctica. Monthly Weather Review, 123(7), 2051-2069.
48Gilbert, E., & Kittel, C. (2021). Surface Melt and Runoff on Antarctic Ice Shelves at 1.5°C, 2°C, and 4°C of Future Warming. Geophysical Research Letters, 48, 9. https://doi.org/10.1029/2020GL091733
49Gourmelen, N., Wearing, M., Goldberg, D., Ewart, M., Horton, A., Picard, G., Glaude, Q. , Fettweis, X., McMillan, M., Leeson, A., Nagler, T. (2023). EO Digital Twin Component: Antarctica. Unpublished communication submitted to European Space Agency, 15th of May 2023
50IPCC, 2023: Climate Change 2023: Synthesis Report. A Report of the Intergovernmental Panel on Climate Change. Contribution of Working Groups I, II and III to the Sixth Assessment Report of the Intergovernmental Panel on Climate Change.
51Jakobs, C., Reijmer, C., Smeets, C., Trusel, L., Van de Berg, W., Van den Broeke, M., & Van Wessem, J. (2020). A benchmark dataset of in situ Antarctic surface melt rates and energy balance. Journal of Glaciology, 66(256), 291-302. https://doi.org/10.1017/jog.2020.6
52Kingslake, J., Ely, J., Das, I., et al. (2017). Widespread movement of meltwater onto and across Antarctic ice shelves. Nature, 544, 349-352. https://doi.org/10.1038/nature22049
53Kittel, C., Amory, C., Agosta, C., Jourdain, N. C., Hofer, S., Delhasse, A., Doutreloup, S., Huot, P.-V., Lang, C., Fichefet, T., & Fettweis, X. (2021). Diverging future surface mass balance between the Antarctic ice shelves and grounded ice sheet. The Cryosphere, 15, 1215-1236. https://doi.org/10.5194/tc-15-1215-2021
54Kittel, C., Fettweis, X., Picard, G., & Gourmelen, N. (2022). Assimilation of satellite-derived melt extent increases melt simulated by MAR over the Amundsen sector (West Antarctica). Bulletin de la Société Géographique de Liège, 78(1). https://popups.uliege.be/0770-7576/index.php?id=6616
55Kuipers Munneke, P., Ligtenberg, S., Van Den Broeke, M., & Vaughan, D. (2014). Firn air depletion as a precursor of Antarctic ice-shelf collapse. Journal of Glaciology, 60(220), 205-214. https://doi.org/10.3189/2014JoG13J183
56Lambin, C., Fettweis, X., Kittel, C., Fonder, M., & Ernst, D. (2023). Assessment of future wind speed and wind power changes over South Greenland using the Modèle Atmosphérique Régional regional climate model. International Journal of Climatology, 43(1), 558–574. https://doi.org/10.1002/joc.7795
57Morcrette, J.-J. (2002). Assessment of the ECMWF model cloudiness and surface radiation fields at the ARM SGP site. Monthly Weather Review, 130, 257–277. https://doi.org/10.1175/1520-0493(2002)130
58Mottram, R., Hansen, N., Kittel, C., van Wessem, J. M., Agosta, C., Amory, C., Boberg, F., van de Berg, W. J., Fettweis, X., Gossart, A., van Lipzig, N. P. M., van Meijgaard, E., Orr, A., Phillips, T., Webster, S., Simonsen, S. B., & Souverijns, N. (2021). What is the surface mass balance of Antarctica? An intercomparison of regional climate model estimates. The Cryosphere, 15(10), 3751–3784. https://doi.org/10.5194/tc-15-3751-2021
59Noël, B., van de Berg, W. J., Lhermitte, S., Wouters, B., Machguth, H., Howat, I., Citterio, M., Moholdt, G., Lenaerts, J. T. M., & van den Broeke, M. R. (2017). A tipping point in refreezing accelerates mass loss of Greenland's glaciers and ice caps. Nature Communications, 8, 14730. https://doi.org/10.1038/ncomms14730
60Paolo, F. S., Fricker, H. A., & Padman, L. (2015). Volume loss from Antarctic ice shelves is accelerating. Science, 348, 327-331. https://doi.org/10.1126/science.aaa0940
61Pfeffer, W. T., Phillips, T. J., & O'Neel, S. (2014). Greenland ice sheet mass balance: A review. Journal of Geophysical Research: Earth Surface, 119(2), 292-311.
62Picard, G., Leduc-Leballeur, M., Banwell, A. F., Brucker, L., & Macelloni, G. (2022). The sensitivity of satellite microwave observations to liquid water in the Antarctic snowpack. The Cryosphere, 16, 5061–5083. https://doi.org/10.5194/tc-16-5061-2022.
63Scambos, T., Hulbe, C., & Fahnestock, M. (2003). Climate-Induced Ice Shelf Disintegration in the Antarctic Peninsula. In Antarctic Peninsula Climate Variability: Historical and Paleoenvironmental Perspectives (pp. 79-92). American Geophysical Union. https://doi.org/10.1029/AR079p0079
64Scambos, T. A., Berthier, E., Haran, T., Shuman, C. A., Cook, A. J., Ligtenberg, S. R. M., & Bohlander, J. (2014). Detailed ice loss pattern in the northern Antarctic Peninsula: widespread decline driven by ice front retreats. The Cryosphere, 8(6), 2135-2145. https://doi.org/10.5194/tc-8-2135-2014
65Seroussi, H., Nowicki, S., Payne, A. J., Goelzer, H., Lipscomb, W. H., Abe-Ouchi, A., Agosta, C., Albrecht, T., Asay-Davis, X., Barthel, A., Calov, R., Cullather, R., Dumas, C., Galton-Fenzi, B. K., Gladstone, R., Golledge, N. R., Gregory, J. M., Greve, R., Hattermann, T., Hoffman, M. J., Humbert, A., Huybrechts, P., Jourdain, N. C., Kleiner, T., Larour, E., Leguy, G. R., Lowry, D. P., Little, C. M., Morlighem, M., Pattyn, F., Pelle, T., Price, S. F., Quiquet, A., Reese, R., Schlegel, N.-J., Shepherd, A., Simon, E., Smith, R. S., Straneo, F., Sun, S., Trusel, L. D., Van Breedam, J., van de Wal, R. S. W., Winkelmann, R., Zhao, C., Zhang, T., & Zwinger, T. (2020). ISMIP6 Antarctica: A multi-model ensemble of the Antarctic ice sheet evolution over the 21st century. The Cryosphere, 14, 3033–3070. https://doi.org/10.5194/tc-14-3033-2020
66Tedesco, M., Doherty, S., Fettweis, X., Alexander, P., Jeyaratnam, J., & Stroeve, J. (2016). The darkening of the Greenland ice sheet: Trends, drivers, and projections (1981–2100). The Cryosphere, 10, 477-496. https://doi.org/10.5194/tc-10-477-2016
67Trusel, L., Frey, K., Das, S., et al. (2015). Divergent trajectories of Antarctic surface melt under two twenty-first-century climate scenarios. Nature Geoscience, 8, 927-932. https://doi.org/10.1038/ngeo2563
68van Wessem, J. M., van de Berg, W. J., Noël, B. P. Y., van Meijgaard, E., Amory, C., Birnbaum, G., Jakobs, C. L., Krüger, K., Lenaerts, J. T. M., Lhermitte, S., Ligtenberg, S. R. M., Medley, B., Reijmer, C. H., van Tricht, K., Trusel, L. D., van Ulft, L. H., Wouters, B., Wuite, J., & van den Broeke, M. R. (2018). Modelling the climate and surface mass balance of polar ice sheets using RACMO2 – Part 2: Antarctica (1979–2016). The Cryosphere, 12(4), 1479–1498. https://doi.org/10.5194/tc-12-1479-2018
69van Wessem, J.M., van den Broeke, M.R., Wouters, B., et al. (2023). Variable temperature thresholds of melt pond formation on Antarctic ice shelves. Nature Climate Change, 13, 161–166. https://doi.org/10.1038/s41558-022-01577-1
70Vaughan, D. G., Corr, H. F. J., Ferraccioli, F., Frearson, N., O'Hare, A., Mach, D., Holt, J. W., Blankenship, D. D., Morse, D. L., & Young, D. A. (2006). New boundary conditions for the West Antarctic ice sheet: Subglacial topography beneath Pine Island Glacier. Geophysical Research Letters, 33(9), L09501. https://doi.org/10.1029/2005GL025588.
71Wille, J. D., Favier, V., Dufour, A., et al. (2019). West Antarctic surface melt triggered by atmospheric rivers. Nature Geoscience, 12, 911-916. https://doi.org/10.1038/s41561-019-0460-1
Pour citer cet article
A propos de : Quentin GLAUDE
Centre Spatial de Liège
Climatologie et Topoclimatologie
ULiège
Quentin.Glaude@uliege.be
A propos de : Thomas DETHINNE
Unité de Géomatique
ULiège
tdethinne@uliege.be
A propos de : Clara LAMBIN
Climatologie et Topoclimatologie
ULiège
Clara.Lambin@uliege.be
A propos de : Xavier FETTWEIS
Climatologie et Topoclimatologie
ULiège
Xavier.Fettweis@uliege.be
