
Consumers’ attitudes and willingness to pay for chicken in Côte d’Ivoire
Résumé
Attitudes des consommateurs et leur consentement à payer pour du poulet en Côte d’Ivoire
Description du sujet. L'identification des caractéristiques des consommateurs liées à leurs préférences et à leurs attitudes à l'égard du poulet est fondamentale pour fournir des poulets qui auront du succès sur le marché.
Objectifs. Déterminer les attitudes des consommateurs et leur consentement à payer (CAP) pour différents types de poulets disponibles au Nord de la Côte d'Ivoire.
Méthode. Un total de 400 individus a été interrogé au hasard dans les 11 municipalités de la région du Poro par le biais d'entretiens en face-à-face. L'échantillon a été stratifié en fonction des estimations de population municipale afin d'assurer sa représentativité. Une analyse des correspondances multiples (ACM) et une classification hiérarchique ont été appliquées pour identifier les groupes de consommateurs, tandis que des tests du Chi-deux et des résidus de Pearson ont été utilisés pour leur caractérisation.
Résultats. L'étude a révélé que 85 % des personnes interrogées consommaient du poulet, notamment du poulet traditionnel, du poulet à croissance rapide et du poulet hybride. Des analyses de correspondances multiples et de grappes ont permis d'identifier quatre groupes de consommateurs en fonction de leurs préférences en matière de viande de poulet et de leur CAP pour des types spécifiques. Ces groupes varient en termes d'attributs organoleptiques et sanitaires du poulet, de quantité de viande, de disponibilité, de coût, de fréquence de consommation, de quantité consommée, d'habitudes alimentaires des consommateurs, de lieu de résidence, de taille du ménage et de revenu. Des facteurs tels que la taille du ménage, le revenu et les périodes festives ont influencé positivement la quantité de poulet consommée, tandis que le lieu de résidence a eu un impact sur le type et la fréquence de la consommation de poulet. La quantité de viande de poulet, sa disponibilité, ses qualités organoleptiques et sanitaires, les habitudes alimentaires des consommateurs et la taille du ménage sont des facteurs clés qui déterminent le CAP pour le poulet, quel qu'en soit le type.
Conclusions. Les caractéristiques du poulet que préfèrent les consommateurs variaient en fonction du type de poulet. La catégorisation des consommateurs en fonction de leurs préférences et de leur CAP ont mis en évidence la relation complexe entre les attitudes des consommateurs et les différents facteurs qui influencent les habitudes de consommation de poulet et le CAP. Ces résultats offrent des informations précieuses aux producteurs de volaille et aux décideurs politiques pour mieux aligner l’offre et la demande. Améliorer la disponibilité, l’accessibilité et la qualité des types de poulet préférés, tout en tenant compte des facteurs socio-économiques (taille des ménages, revenus et périodes festives), pourrait renforcer le succès sur le marché. De futures recherches pourraient explorer l’influence des tendances émergentes, telles que l’évolution des habitudes alimentaires ou l’essor du poulet importé, sur le comportement des consommateurs dans les régions concernées.
Abstract
Description of the subject. Identifying consumer characteristics related to their preferences and attitudes towards chicken is fundamental for supplying chickens that will be successful in the market.
Objectives. To determine consumer attitudes and willingness to pay (WTP) for different types of chickens available in the north of Côte d'Ivoire.
Method. A total of 400 individuals were randomly surveyed across the 11 municipalities of the Poro region, through face-to-face interviews. The sample was stratified based on municipal population estimates, ensuring representativeness. Multiple correspondence analysis (MCA) and hierarchical clustering were applied to identify consumer groups, while Chi-square tests and Pearson residuals were used for characterization.
Results. The study revealed that 85% of the surveyed people consumed chicken, including traditional, fast-growing, and hybrid types. Four consumer groups were identified based on their chicken preferences and WTP for specific types. These groups varied in terms of chicken organoleptic and sanitary attributes, meat quantity, availability, cost, consumption frequency, quantity consumed, consumers' eating habits, place of residence, household size, and income. Factors such as household size, income, and festive periods positively influenced chicken consumption quantity, while place of residence impacted type and frequency of chicken consumption. Chicken meat quantity, availability, organoleptic and sanitary qualities, consumers’ eating habits, and household size were key factors determining WTP for chicken, regardless of type.
Conclusions. The characteristics of chicken preferred by consumers varied depending on the type of chicken. Categorizing consumers based on their preferences and WTP highlighted the complex relationship between consumer attitudes and the different factors influencing chicken consumption patterns and WTP. These findings provide valuable insights for poultry producers and policymakers to better align supply and demand. Improving the availability, affordability, and quality of preferred chicken types, while considering socio-economic factors (household size, incomes, and festive periods), could enhance market success. Future research could explore how emerging trends, such as changing dietary habits or the rise of imported chicken, may influence consumer behavior in the concerned regions.
Received 15 April 2024, accepted 28 March 2025, available online 21 May 2025.
This article is distributed under the terms and conditions of the CC-BY License (http://creativecommons.org/licenses/by/4.0)
1. Introduction
1Global poultry production has seen a consistent rise over the years (Cadudal, 2017) with projections indicating continued growth in the future (OECD & FAO, 2023) including sub-Saharan African nations like Côte d'Ivoire (Shaw et al., 2019). Poultry meat offers affordability, freedom from religious restrictions and excellent nutritional value, making it a preferred choice for consumers (Deman, 2016).
2In the past, traditional chicken served as the primary local source for Ivorian consumers (Essoh, 2006). However, this scenario has evolved. Traditional chicken production, characterized by low productivity, could no longer satisfy the increasing demand. Consequently, policy initiatives have encouraged diversification in chicken production to achieve self-sufficiency, leading to the emergence of new chicken breeds and modern rearing systems (MIRAH, 2014). In assessing chicken production, it becomes crucial to consider whether it aligns with consumer requirements, as ensuring food security involves meeting both supply and demand while considering consumer preferences.
3Factors such as population growth, urbanization, rising incomes, and socio-cultural expectations contribute to diverse consumer behavior. Consequently, preferences for animal products can vary significantly between countries and within countries. While a lot of research has been carried out on consumer purchasing behavior in relation to poultry meat in developed countries, few studies have been carried out in developing countries, as reported by Jiang & Kassoh (2023). Additionally, most of these works in developed countries focus on the visual appearance of the poultry parts sold, the environment, ethics, and animal welfare, which are not priorities in developing countries. In Côte d'Ivoire, as in other sub-Saharan African and West African countries, meat consumption is low compared to the world average, and in the case of poultry, purchases mainly concern live chickens (Arnoldus et al., 2020; Erdaw, 2023).
4Previous studies conducted in Ghana, Benin, and Senegal by Bannor et al. (2022), Kulla et al. (2021) and Boimah & Weile (2021), respectively, have highlighted different consumer segments regarding chicken meat preferences and choices. These studies demonstrate the heterogeneity of chicken consumer preferences and the importance for players in the poultry industry to understand their consumers' needs. The study of chicken consumer profiles is particularly important because such studies highlight possible trends in consumption and provide the basic information to guide policy decisions in chicken production and its marketing strategies (Asante-Addo, 2020). In fact, marketing strategies designed for target groups will better meet consumers' desires than a marketing strategy designed for the average consumer (Ripoll et al., 2015).
5To our knowledge, although chicken is one of the most widely produced meats in Côte d'Ivoire, no study has been carried out on the segmentation of chicken consumers according to their preferences and consumption attitudes in this country. We have assumed that by studying consumer behavior and identifying consumer profiles and market segments, the chicken industry would be able to more successfully meet the needs of consumers.
6The aim of this study was to investigate consumer attitudes and willingness to pay (WTP) for the different types of broiler chickens available on the market and mostly sold alive in the north of Côte d'Ivoire. More specifically, this study hypothesized that the characteristics of broilers consumed by the population differ according to the type of chicken. It also assumed that the surveyed consumers can be grouped into different categories based on their food preferences for this meat, as well as other properties, including their willingness to pay for a specific type of broiler. Identifying the factors that influence consumer characteristics and attitudes towards broilers could guide commercial chicken production and place products on the marketplace.
2. Materials and methods
2.1. Study area
7The Poro region was chosen for the study. This region is situated in the northern part of Côte d'Ivoire (Figure 1). Its economy relies heavily on agriculture and animal husbandry. It is one of the few regions in Côte d'Ivoire with a wide variety of poultry farms, providing consumers with a range of options to suit their preferences. The Poro region comprises 11 municipalities or communes, including Korhogo, M’bengue, Sinematiali, Napieoledougou, Dikodougou, Komborodougou, Tioroniaradougou, Guiembe, Sirasso, Karakoro, and Niofoin.
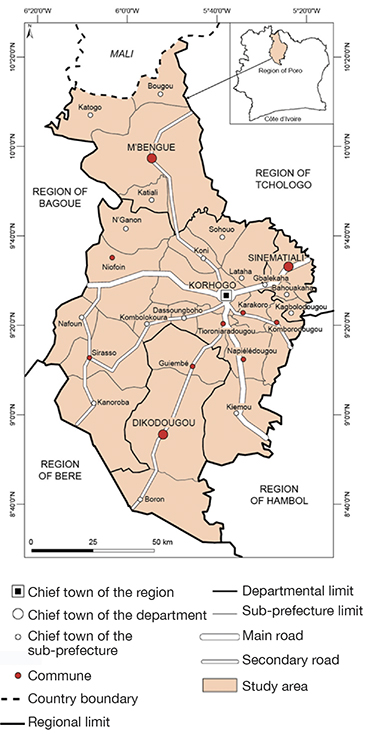
Figure 1. Map of the study area — Carte de la zone d’étude.
2.2. Chicken typology
8In Côte d'Ivoire, the poultry industry has undergone significant transformations due to governmental policies aimed at regulating imports and promoting local production. In 2005, the government imposed a new tax on imported poultry by-products, doubling the price per kilogram of these imported products. This policy designed to discourage imports and support local production, has led to substantial growth in the domestic poultry sector (Traoré, 2018). As a result, the market share of imported frozen chicken has declined to an insignificant level in Côte d’Ivoire (Traoré, 2018).
9Furthermore, the primary destination for imported poultry in Côte d'Ivoire has always been the capital, located in the southern part of the country (Essoh, 2006). Consequently, this study conducted in the North focused exclusively on locally produced chickens and traded mostly alive.
10Locally produced chickens can be categorized into five distinct types: traditional chicken (TC), fast-growing chicken (FGC), hybrid chicken (HC), reformed layer (RL) and cockerel chicken (CC). These classifications are based on their breeding methods, growth rates, and consumer perceptions (Koné & Danho, 2008).
11Traditional chicken (TC) also known as indigenous or village chicken, is raised using traditional free-range farming practices with minimal dietary supplementation. It is characterized by slow growth and is perceived as having firmer meat and a richer taste (Gnakari et al., 2007; N’Goran et al., 2016). However, due to its long production cycle, TC is not widely available on the market.
12Fast-growing chicken (FGC) commonly referred to as modern broiler chicken, is selectively bred for fast growth and high meat yield. It is typically raised in intensive farming systems with a controlled diet to optimize production (Koné & Danho, 2008). FGC is the most readily available chicken on the market.
13Hybrid chicken (HC) results from crossbreeding TC and FGC or modern slow-growing chicken. It aims to combine desirable characteristics of both, such as a moderate growth rate and improved meat quality (Gnakari et al., 2007). Its availability is similar to that of TC.
14Reformed layer (RL) refers to modern laying hen that has been used for egg production and is retired once its laying period ends (Koné et al., 2008). Reformed layer has a slower growth rate and shares similarities with TC in terms of their texture and flavor due to its longer life cycle. Its availability is inconsistent, as it is only sold after its productive life has ended.
15Cockerel chicken (CC) consists of male layer chicken raised for meat. Like RL, it exhibits slower growth compared to FGC but retains some characteristics of modern breeds (Koné et al., 2008). Its meat texture and flavor are generally closer to that of TC. However, CC is less available as it is often considered unnecessary in the poultry industry.
16Consumers can differentiate these chicken types based on attributes such as meat texture, firmness and flavor. Additionally, these categories vary in price and availability. All five types are primarily sold alive in open markets. Occasionally, they are available frozen, except for TC, which is exclusively sold alive (Essoh, 2006; Boka, 2009). FGC is also commonly sold as roasted chicken in restaurants.
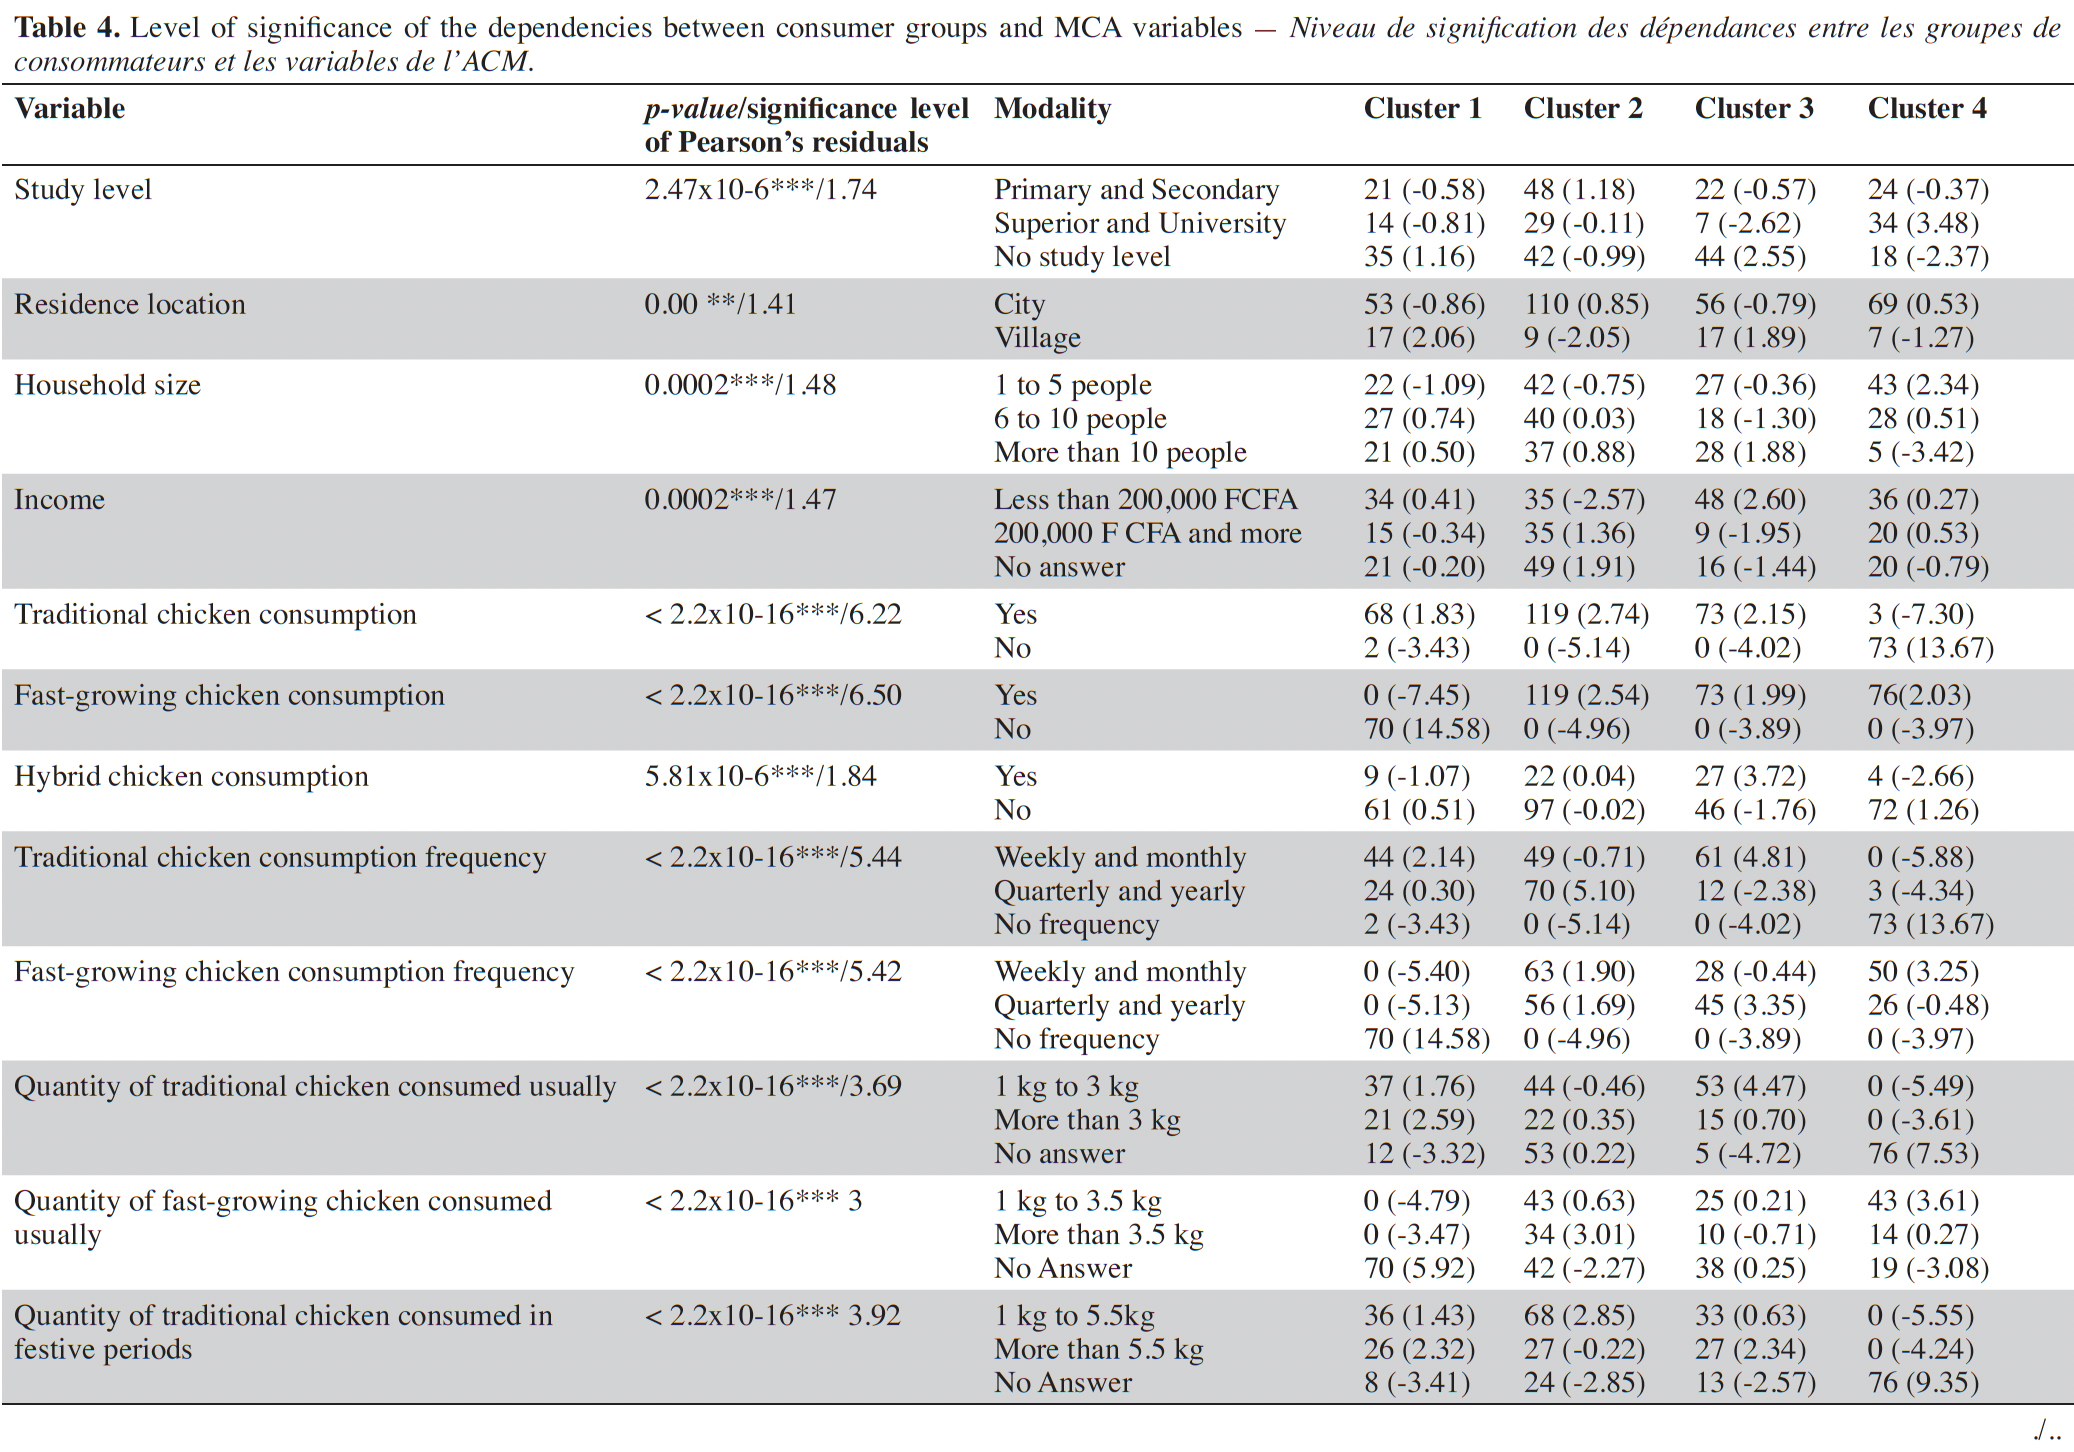
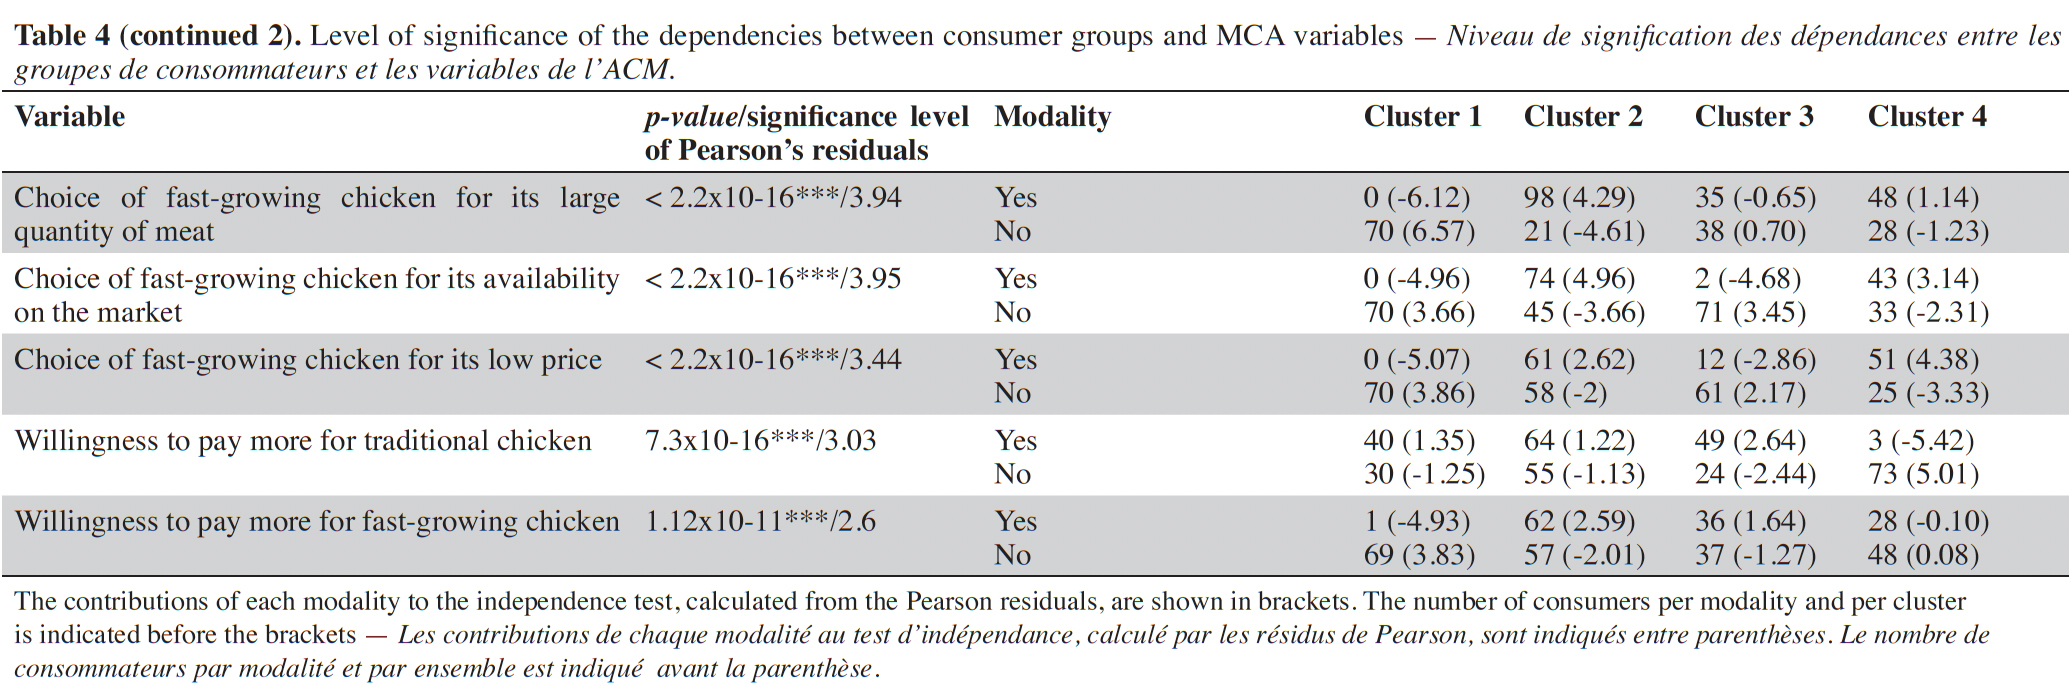
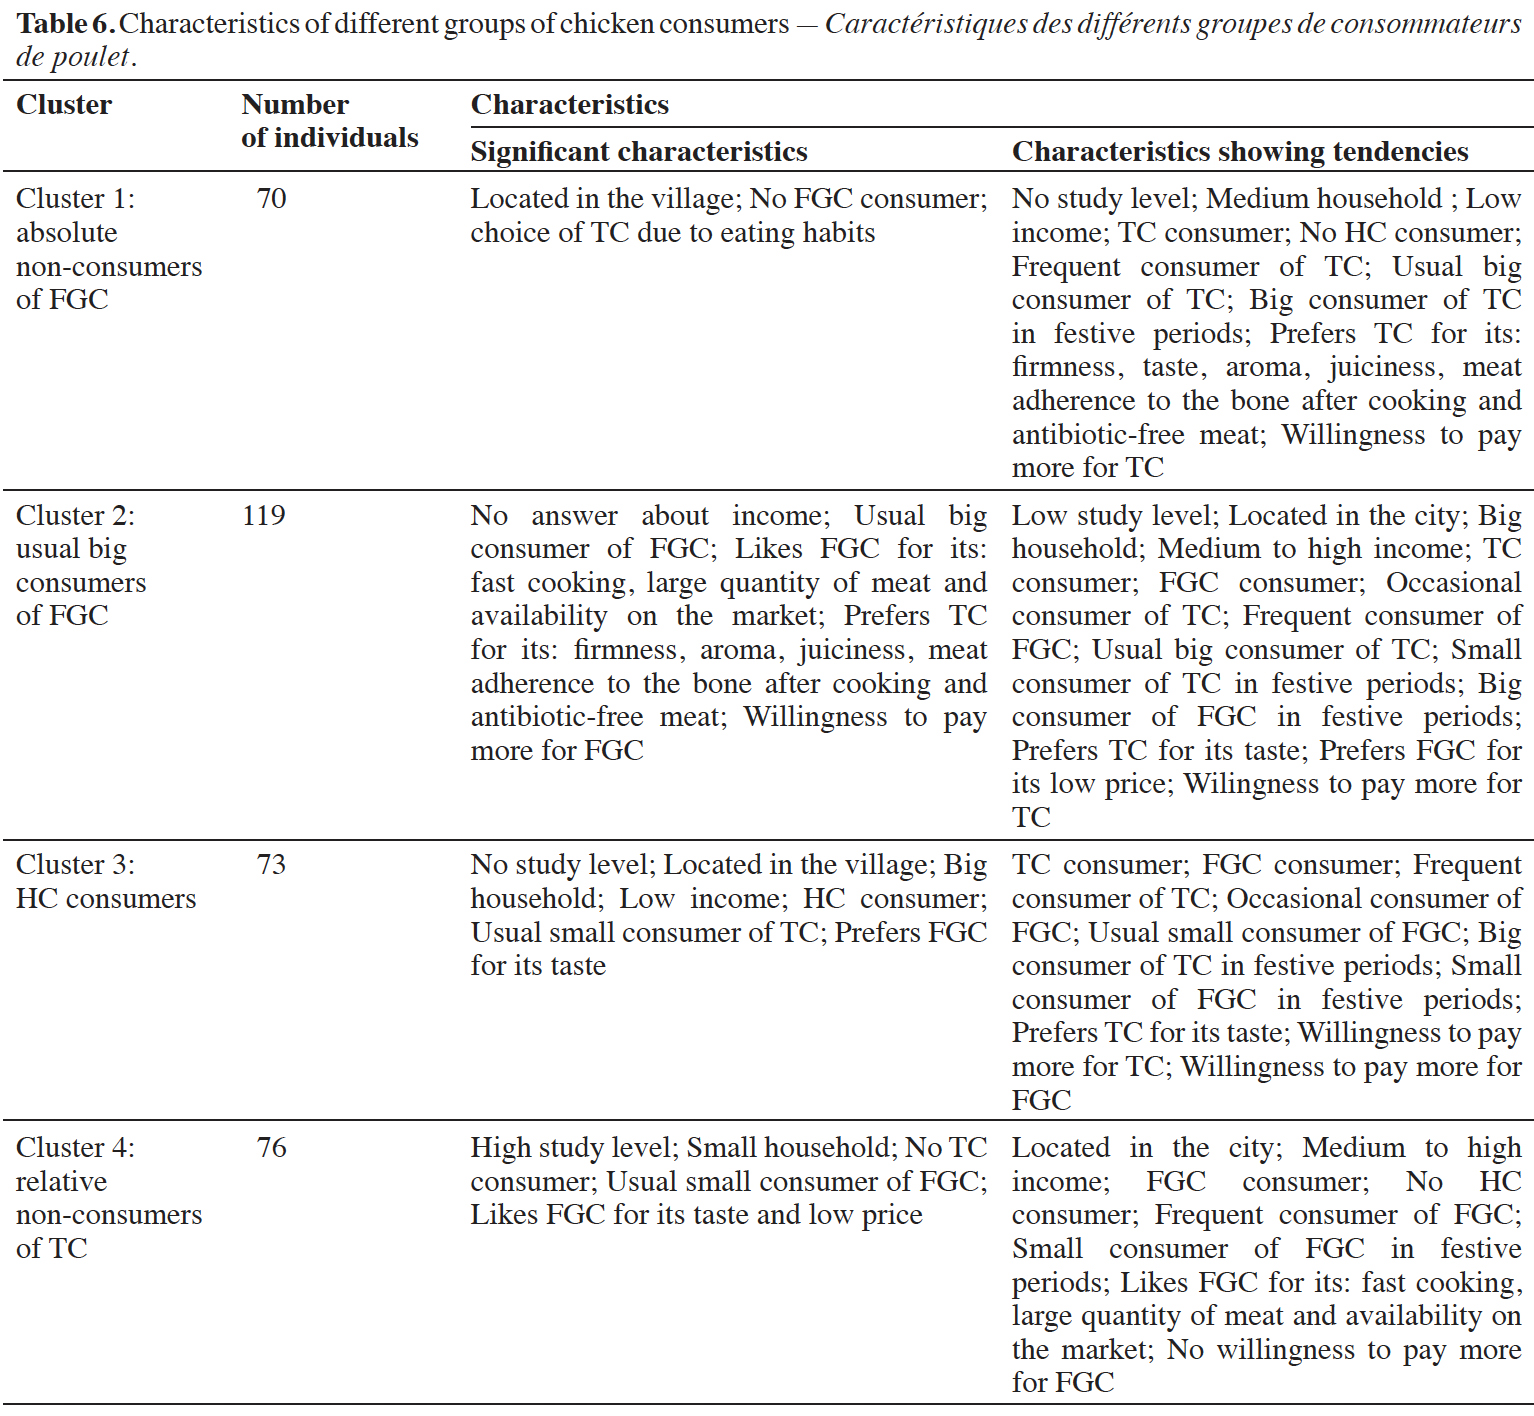
2.3. Survey and identification of chicken consumer groups
17The survey conducted from August 2020 to September 2020 covered the 11 municipalities of the Poro region. Data collection involved face-to-face interviews conducted in households, as well as gathering places such as markets and retail outlets. To ensure the reliability and clarity of the questions, a pre-test was conducted with a diverse sample of 15 consumers representing various ages, income levels, education levels, and places of residence. Following this pre-test, adjustments were made to the survey and questions. Subsequently, a random sample of 400 individuals was surveyed. The sample size was determined using the margin of error formula outlined by Durand (2009).
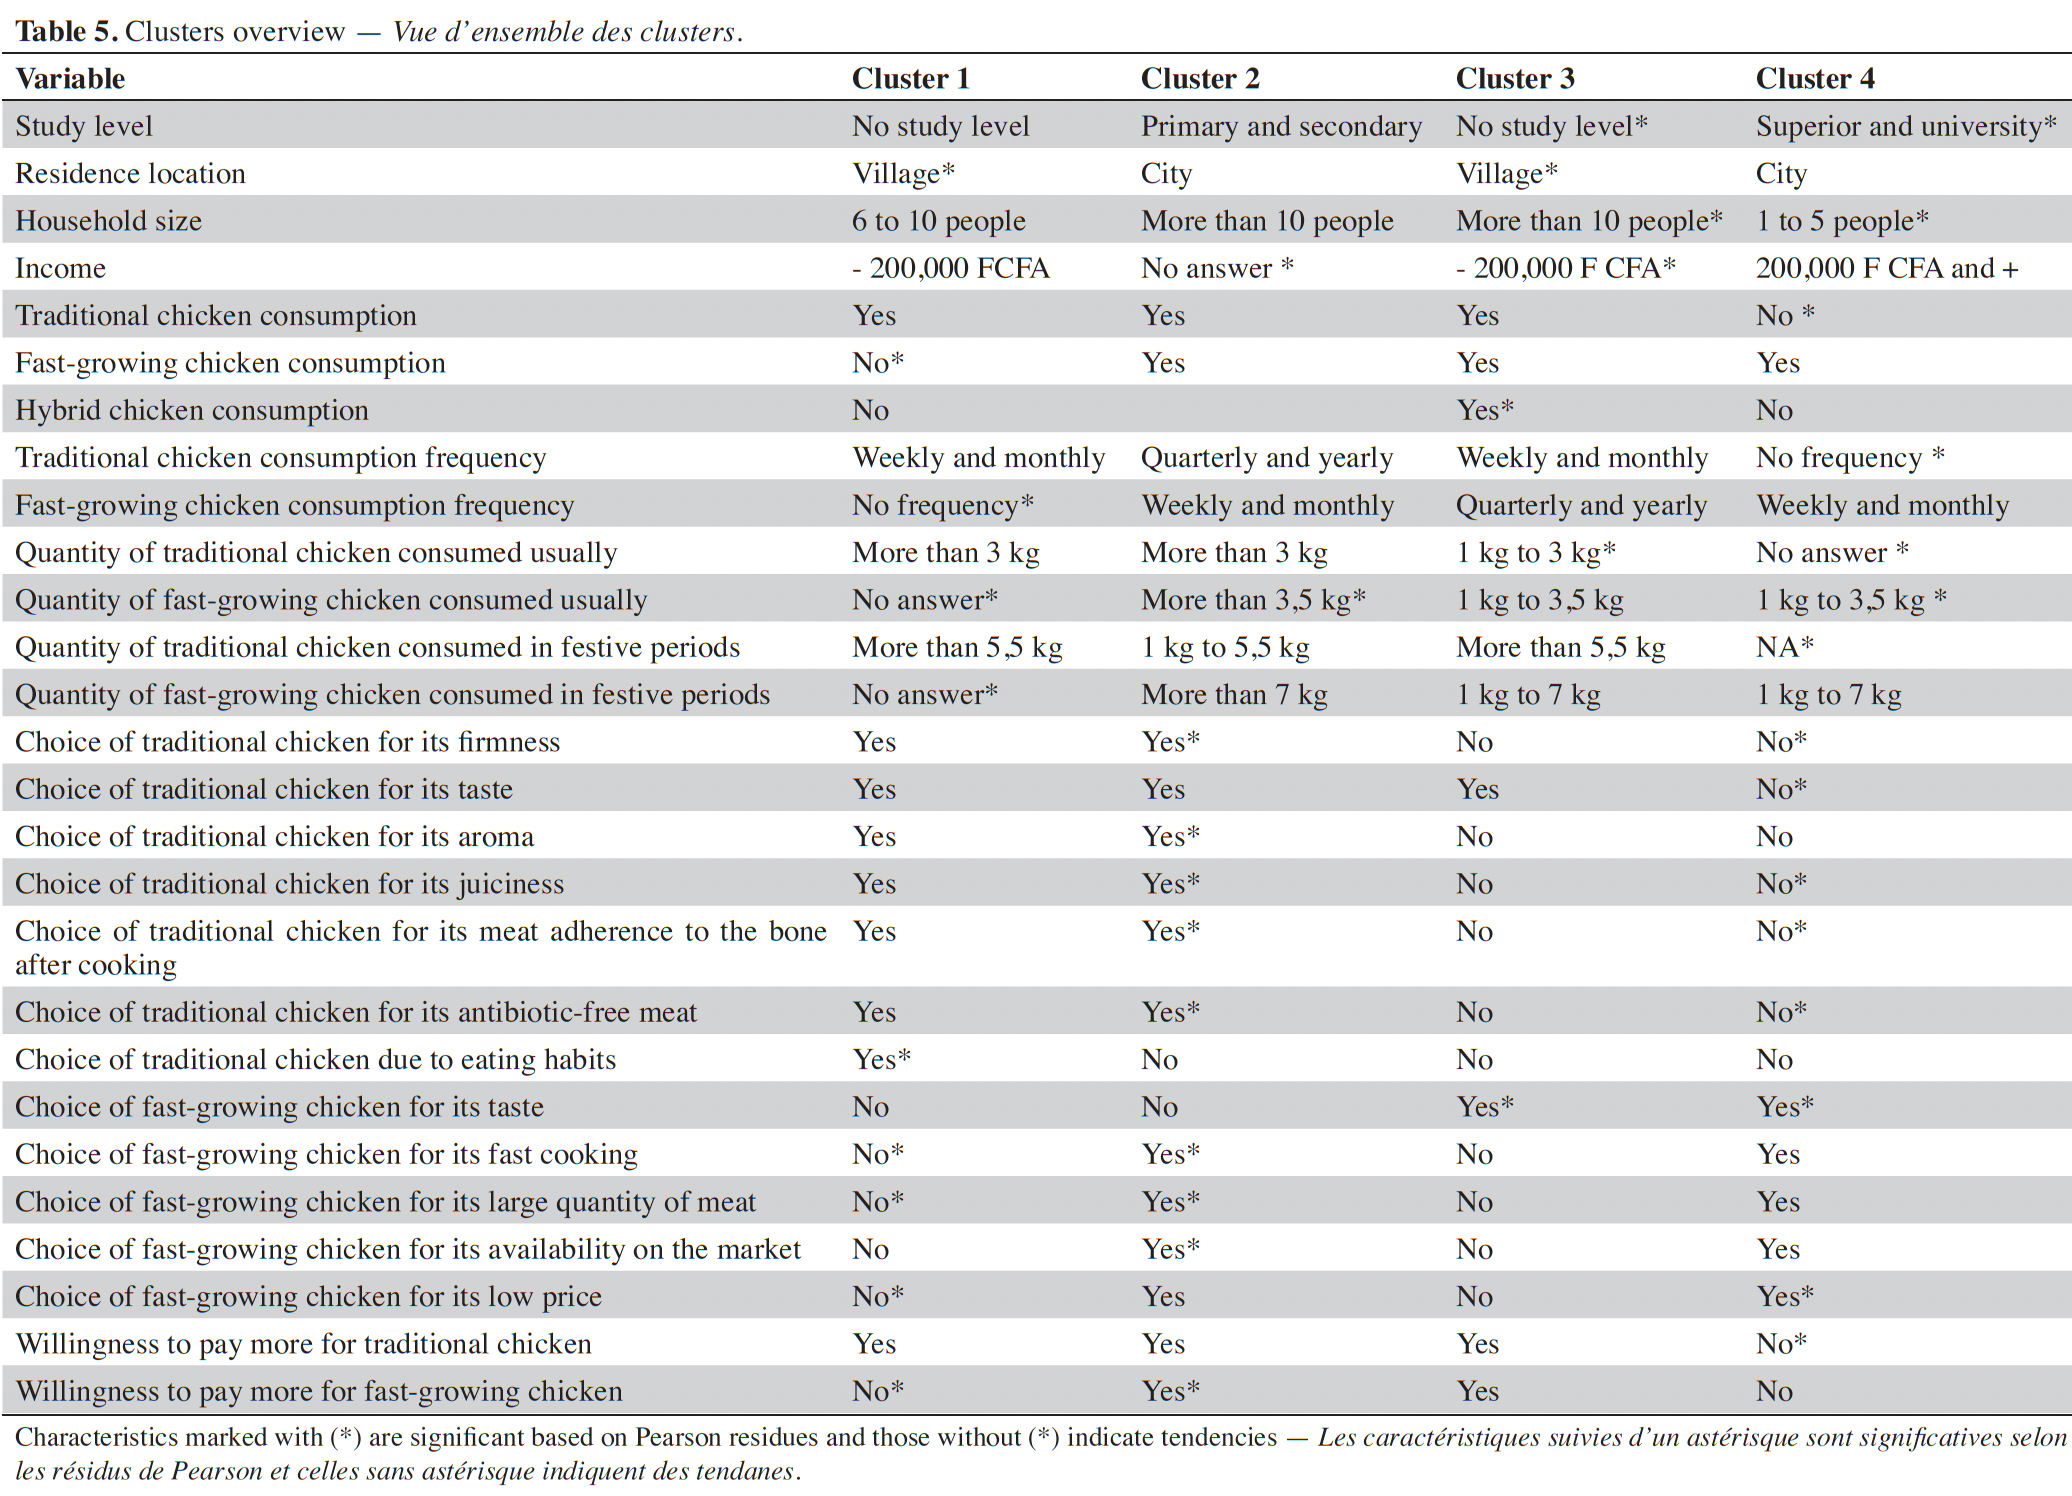
18To ensure representativeness, the sample was stratified based on the 2020 municipal population estimates provided by the Ivorian National Statistics Institute, derived from the 2014 General Population and Housing Census (INS-CI, 2016). All participants have been informed about the purpose of the research and how their data will be used.
19The questionnaire comprised 44 questions written in French, with responses yielding 78 categorical and 21 metric variables. Questions were categorized into several groups, beginning with the sociological profile of consumers, followed by inquiries about the type and quantity of chicken consumed, frequency of consumption, preferences, motivations, purchase price, willingness to pay a supplement, and the amount consumers were willing to pay. The majority of respondents were heads of households, given their central role in decisions related to chicken purchase and consumption. The choice of household-level consumption estimation over per capita measurement is supported by the specific cultural context in Côte d'Ivoire, where meals are generally shared within households. This makes it challenging to accurately determine individual consumption. Household-based estimation provides a more realistic representation of actual chicken consumption patterns and aligns with previous research on food consumption behaviors in African contexts.
20Descriptive statistics using an univariate approach were initially employed to provide an overview of the survey data. Subsequently, Multiple Correspondence Analysis (MCA) was conducted to explore relationships among the questions' modalities. Since MCA only handles categorical variables (Palm, 2007), quantitative variables were transformed into categorical variables by reorganizing their modalities into classes. Additionally, some categorical variables were modified by merging modalities to ensure a balance in the number of modalities per variable and respondents per modality. As recommended by Palm (2007), modalities with a low proportion of individuals were excluded before performing the MCA analysis, in order to avoid bias in the results. The use of MCA is justified by its ability to process categorical variables effectively, revealing underlying structures in consumer preferences and behaviors.
21To address the issue of principal inertia underestimation in MCA, the Benzecri method (Benzécri, 1979) was applied to correct the inertias, providing a more accurate representation of the information contained in each dimension. Hierarchical clustering based on the ward method was then applied to the individuals' MCA scores to segment consumers into distinct groups based on their consumption patterns. The number of groups was determined by considering the dendrogram's height post-clustering, ensuring that intra-group homogeneity was maximized while inter-group differences remained significant.
2.4. Characterization of consumer groups
22To characterize the obtained consumer groups, Chi-square (X2) tests were performed. These tests allowed to study the dependency between each group and the variables used in the MCA for their formation. The resulting p-values from these tests were utilized to indicate the significance level of these dependencies. Subsequently, the contribution of each combination of modalities to the observed dependency between a categorical variable and the various groups was assessed using Pearson residuals. Thus, positive residuals for modalities indicate a significantly higher number of individuals observed for these modalities than expected. Furthermore, a threshold for Pearson residuals was determined to identify modalities contributing significantly to the observed dependency. This threshold corresponded to the mean of the Pearson residuals. Contributions with absolute values surpassing this threshold were deemed to contribute significantly to the observed dependency. Those with absolute values below this threshold, albeit close to it, indicated tendencies.
23From the original survey dataset, we extracted the sub-database pertaining to chicken consumers for all statistical analyses. These analyses were conducted using R Studio software (version 4.0.3), except for the examination of chicken consumption frequency and consumer motivations for choosing chicken, which were performed utilizing Minitab software (version 21.1).
3. Results
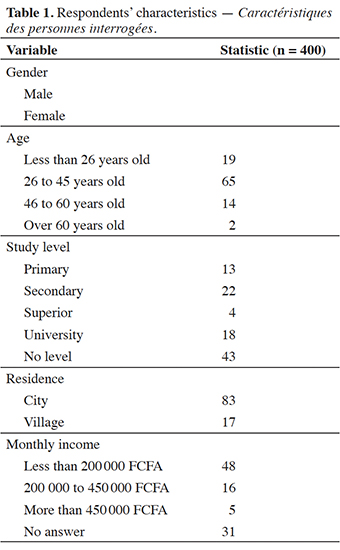
24Table 1 displays the characteristics of the individuals who participated in the survey. Predominantly, the respondents were male, aged between 26 and 45, with over 40% lacking formal training. The majority resides in urban areas characterized by lower income levels.
3.1. The main types of chicken, their consumption frequencies, and the consumer motivations behind choosing them
25Out of a total of 400 surveyed individuals, 338 respondents reported consuming chicken, representing a chicken consumption rate of 85%. The consumption of chicken is primarily categorized into three main types: traditional chicken (TC), fast-growing chicken (FGC), and hybrid chicken (HC) resulting from crossbreeding. However, TC and FGC were the most commonly consumed types, unlike HC (Table 2). Other chicken types, such as reformed layers and cockerels (i.e., male layers), were also consumed. However, due to their uncertain availability and consumption patterns, they were excluded from analysis. The survey results revealed that TC and FGC were consumed frequently (i.e., on a weekly and monthly basis) as well as occasionally (i.e., annually), whereas HC was primarily consumed occasionally (Table 2).
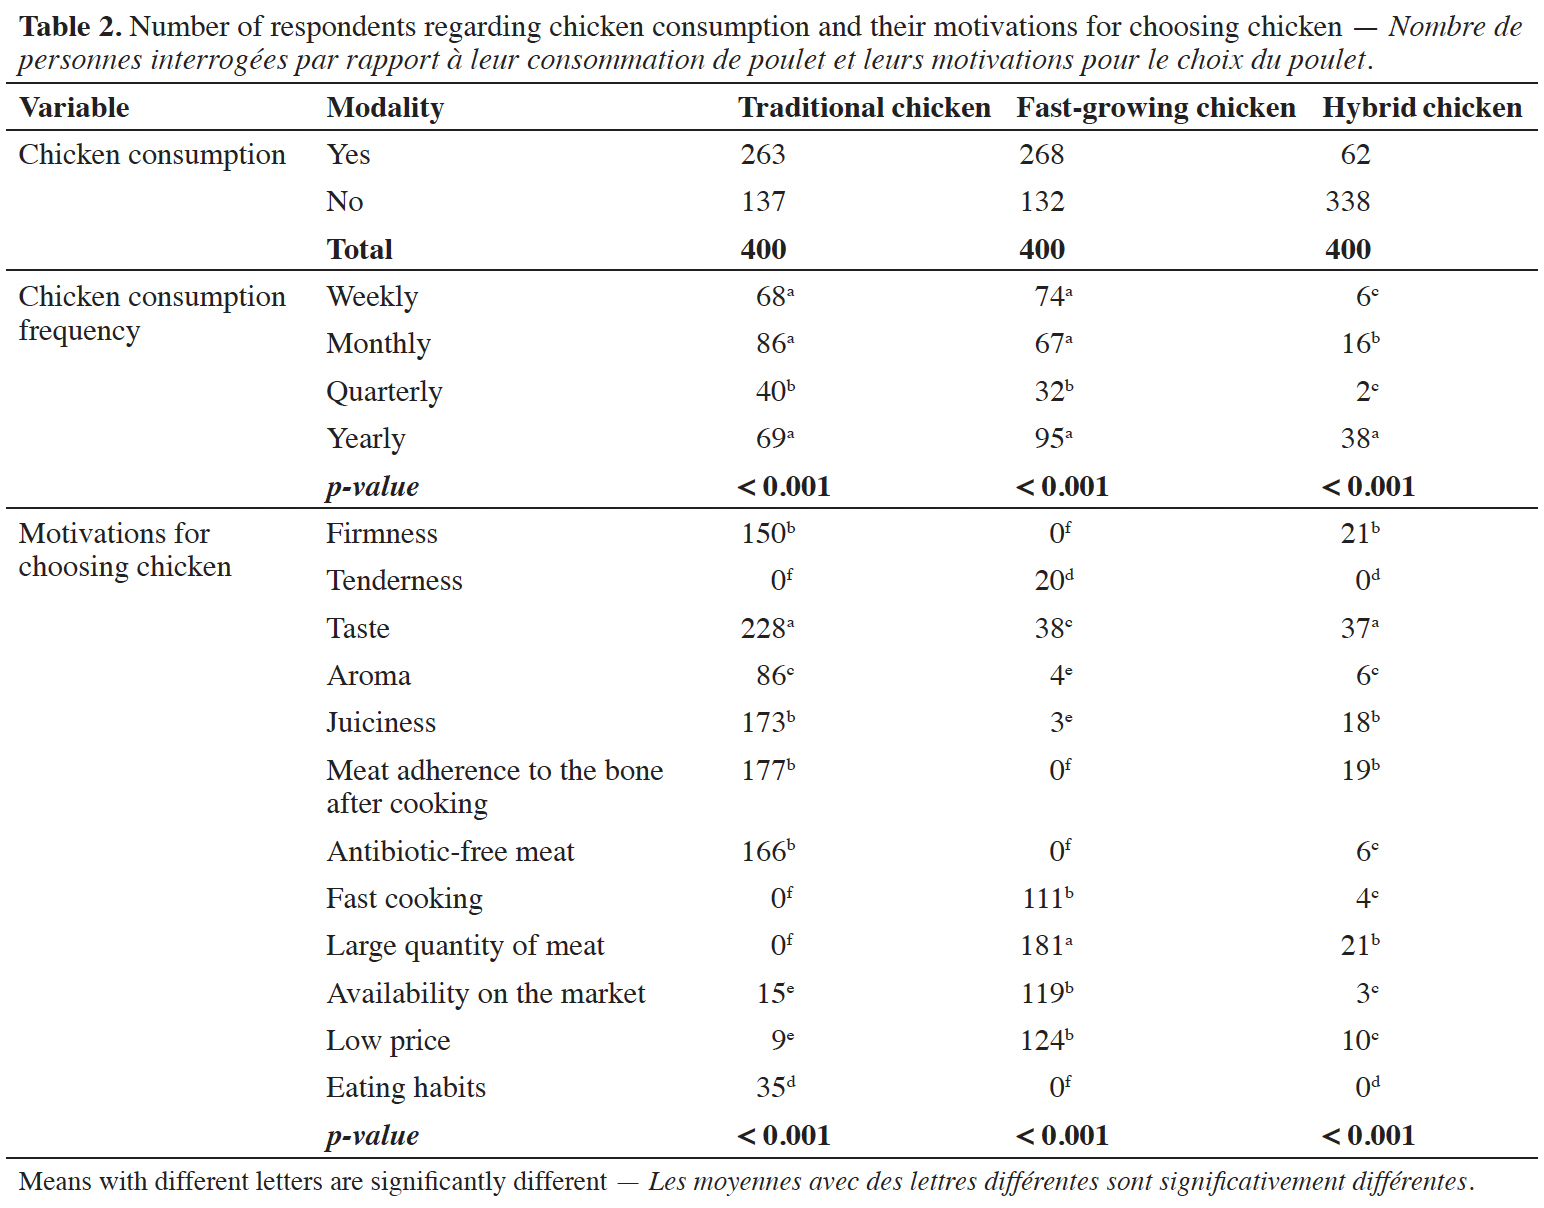
26It is worth noting that consumers' preferences for different types of chicken can be outlined by examining table 2. TC was favored primarily for its taste, firmness, juiciness, meat adherence to the bone after cooking, and the absence of antibiotics. Conversely, FGC was selected for its abundance of meat, quick cooking time, market availability and affordability. The choice of HC was driven by taste, firmness, juiciness, meat adherence to the bone after cooking and meat quantity.
3.2. Quantities of chicken meat consumed in households
27The consumption of chicken meat in households was categorized into two main types: chicken consumed usually and chicken consumed in festive periods. Chicken consumed usually refers to the average quantity of chicken meat consumed by households during regular meals, regardless of consumption frequency (e.g., weekly, monthly, quarterly, or yearly). This reflects the typical consumption pattern outside festive periods. Chicken consumed in festive periods refers to the average quantity of chicken meat consumed exclusively during festive occasions, such as religious celebrations, national holidays or family gatherings. Both consumption types were expressed as the average quantity consumed per purchase.
28There was no significant difference in mean chicken meat usually consumed across different types of chicken (p > 0.05). On average, households usually consumed 4 kg of FGC, 3.7 kg of HC, and 3.5 kg of TC meat (Figure 2a). However, significant variations were observed (p < 0.05) in chicken consumption during festive periods (Figure 2b). During these occasions, the average consumption of chicken meat rose to 7.5 kg for FGC, 5.9 kg for TC, and 5.6 kg for HC (Figure 2).
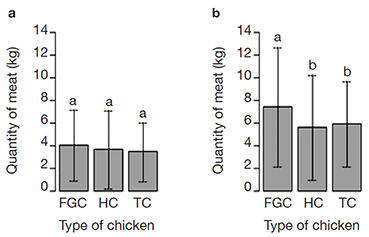
Figure 2. Chicken meat consumption in the household —Consommation de viande de poulet dans le ménage.
a. Chicken consumed usually — Poulet consommé habituellement; b. Chicken consumed in festive periods — Poulet consommé en périodes de fêtes.
3.3. Chicken market prices and supplements consumers are willing to pay
29There were significant differences (p < 0.05) observed in the mean prices per kg of chicken during the survey (Figure 3a). TC was the most expensive at 2,047 FCFA·kg-1, followed by HC at 1,882 FCFA·kg-1, and FGC, which was the cheapest at 1,143 FCFA·kg-1. Additionally, in response to the question about the maximum supplement consumers would pay, we also found significant differences (p < 0.05) among the three types of chicken (Figure 3b). Nonetheless, this supplement, expressed as a percentage of the value at the time of the study, remained consistent across all cases, approximately 30%.
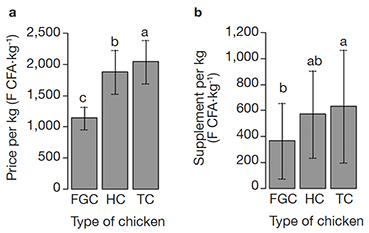
Figure 3. Price and supplement per kilogram by chicken — Prix et supplément au kilogramme par poulet.
a. Chicken prices on the market — Prix du poulet sur le marché; b. Willingness to pay more per type of chicken — Consentement à payer plus cher par type de poulet.
3.4. Multiple correspondence analysis
30Multiple Correspondence Analysis (MCA) was conducted on the data after excluding those related to HC due to their under-representation in the survey (Table 2), except for the variable on HC consumption. Therefore, 27 variables with a total of 63 modalities were used in the MCA. The frequencies of these modalities are presented in table 3.
31The first dimension of the MCA accounted for 18.93% of the principal inertia, while the second dimension represented 12.54% (Figure 4). After applying the Benzecrit method to correct these principal inertias, the values increased to 56.87% for dimension 1 and 23.31% for dimension 2. This indicates that collectively, these two dimensions explained over 80% of the information.
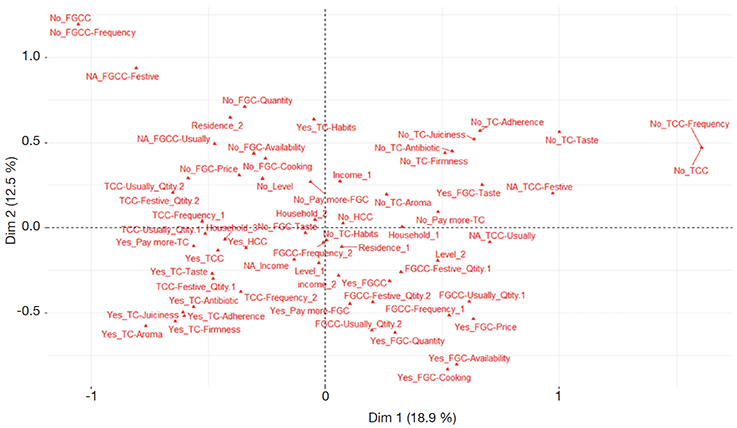
Figure 4. Representation of the modalities in the first factorial plane of the MCA — Représentation des modalités dans le premier plan factoriel de l’ACM.
Abbreviations — Abréviations: see table 3 — voir tableau 3.
32The modalities displayed in figure 4 were abbreviated for better readability. The definition of these modalities was detailed in table 3.
33This first dimension of the MCA revealed a positive correlation with the “no-responses” of variables related to TC consumption, and the “yes-responses” of variables related to FGC consumption. Conversely, this dimension displayed a negative correlation with the “no-responses” of variables concerning FGC consumption, and the “yes-responses” of variables concerning TC consumption.
34The second dimension contrasted the “no-responses” of variables related to FGC, HC, and TC consumption with the “yes-responses” of variables pertaining to the consumption of these three types of chickens. Affirmative responses obtained negative scores on the second axis of MCA.
35This implies that households that did not consume TC but consumed FGC are positioned to the right of Axis 1, while households that did not consume FGC but consumed TC are positioned to the left. Households consuming both TC and FGC are in an intermediate position on Axis 1. Households consuming at least TC and FGC are positioned below Axis 2.
3.5. Hierarchical clustering
36Hierarchical clustering based on the Ward method was used on the scores of individuals on the MCA dimensions to identify different chicken consumer profiles. The resulting dendrogram from this hierarchical classification was truncated at a height approximately equal to 6 (Figure 5). This truncation was determined based on the dendrogram's height, ensuring the formation of relatively homogeneous groups of chicken consumers that are distinct from each other.
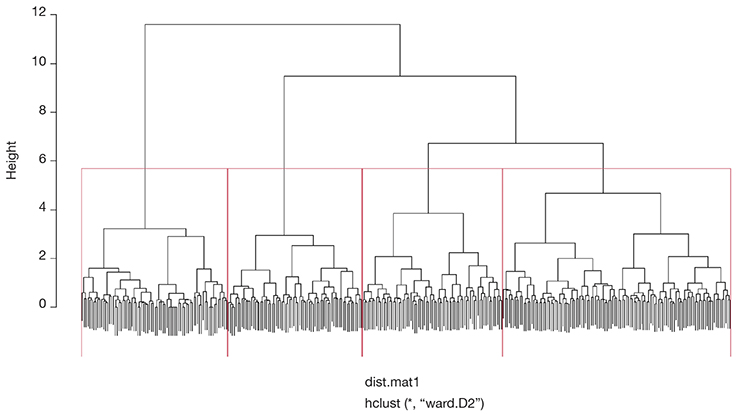
Figure 5. Dendrogram of clusters — Dendrogramme des clusters.
37Four groups of chicken consumers have been identified (Figure 6). It was observed that all the variables utilized in the MCA had significant p-values for these four groups (Table 4). The number of consumers was 70, 119, 73 and 76 for groups 1, 2, 3 and 4, respectively.
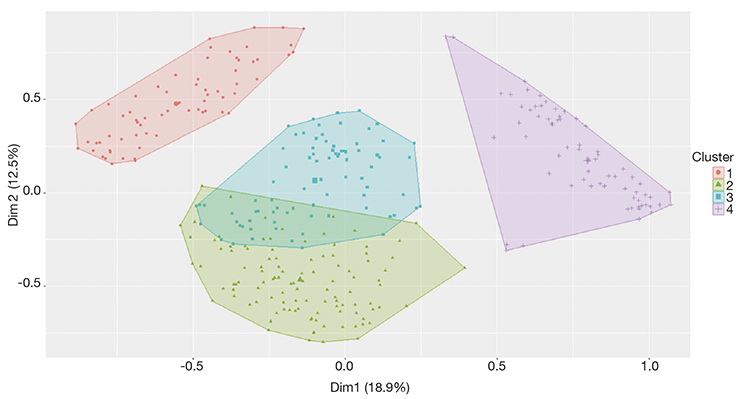
Figure 6. Representation of groups in the first factorial plane of MCA — Représentation des groupes dans le premier plan factoriel de l’ACM.
38Below, table 4 displays the results of the Chi-squared tests carried out between the four consumer groups and the 27 variables of the MCA.
39Table 5 provides an overview of the clusters based on the significance level of the MCA modalities for each cluster:
40– cluster 1 significantly consisted of individuals residing in the village who did not consume FGC and favored TC due to their eating habits;
41– cluster 2 was significantly distinguished by a lack of income information. Their consumption of FGC either matched or surpassed that of the average population. They appreciated FGC and TC for its main attributes, and they were willing to pay more for FGC;
42– cluster 3 significantly comprised individuals without formal education, living in rural areas with large households and low incomes, and exhibited a notable inclination towards consuming HC. This group typically consumed less TC than the average population and preferred FGC for its taste;
43– cluster 4 was significantly characterized by its high level of education and small household size. Individuals within this cluster did not consume TC and generally consumed less FGC than the average population. Their preference for FGC stemmed motivated by its taste and affordability. Consumers in this group mainly lived in city and also mentioned that they appreciated FGC for its availability in the market and its fast cooking time.
4. Discussion
44Studying consumers' food preferences plays a crucial role in establishing a sustainable food system (Chen & Antonelli, 2020). Neima et al. (2021) suggest that understanding consumer preferences can significantly influence strategies for developing poultry production to meet local demand and compete globally. To conduct such research effectively, the initial step involves identifying consumers' preferences regarding various attributes of chicken meat. Assessing consumer willingness to pay (WTP) can offer insights into how consumers value different meat attributes and facilitate analysis of product marketability (Van Loo et al., 2011). Additionally, investigating consumer attitudes toward product consumption and the underlying factors influencing these attitudes is essential for effective product marketing (Ripoll et al., 2015). Chen & Antonelli (2020) emphasize the importance of developing and validating questionnaires on food choices to gather valuable insights into decision-making factors. Furthermore, Worch et al. (2010) have shown that consumers can consistently describe products based on their inherent characteristics.
45The survey results showed that TC and FGC were commonly consumed both weekly and monthly, and occasionally on a yearly basis, while HC was mainly consumed occasionally (Table 2). These findings may be attributed to the greater popularity and familiarity of TC and FGC among consumers compared to HC. Historically, TC served as the sole local source of chicken in Côte d'Ivoire (Essoh, 2006), with widespread rearing across the country, particularly in the northern region (Koné & Danho, 2008). In recent years, the production of FGC has seen a surge across the nation (MIRAH, 2014). However, despite the potential of crossbred chicken production to enhance household food security by increasing both the quantity and quality of chicken meat, it faces various challenges that hinder its widespread success (Leroy et al., 2015; Fulla, 2022).
46As shown in table 2, consumer preferences for different types of chicken vary according to the type. This observation aligns with findings from previous studies. For instance, Gnakari et al. (2007) in Côte d’Ivoire and Teno (2009) in Senegal observed a preference for TC due to its organoleptic qualities, such as taste, firmness, and meat resistance. Kyarisiima et al. (2011) found in Uganda that consumers favored TC for its perceived taste, firmness, and absence of chemical contaminants like antibiotics or hormones. Research conducted in Ghana by Asante-Addo & Weible (2020a) and Kwadzo et al. (2013) highlighted price and availability as crucial factors influencing the choice of FGC among consumers. Additionally, Udomkun et al. (2018) found that in the Democratic Republic of Congo, low prices and large quantities were significant factors of satisfaction for meat consumers in general. Furthermore, Teno (2009) noted that Senegalese consumers appreciated the ease of cooking FGC.
47Moreover, some studies have emphasized the attributes of HC that attract consumers. Gnakari et al. (2007) noted in Côte d’Ivoire that the organoleptic qualities of HC meat closely resembled those of TC. Additionally, Dzungwe et al. (2022) in Togo demonstrated the positive impact of crossbreeding on the meat yield of resulting HC.
48The examination of chicken meat consumption in households revealed that there was no notable difference in the average chicken meat usually consumed among chicken types, whereas significant differences were detected in chicken consumption during festive occasions (Figure 2). These findings indicate that chicken consumption increases notably during festive periods compared to regular periods, particularly with a significant rise in FGC consumption. These observations are in line with those made by Teno (2009) who demonstrated that FGC meat was the most consumed during festive periods in Senegal. Moreover, other studies have emphasized the influence of religious festivals and holidays on household chicken consumption in Ethiopia and Uganda (Aklilu et al., 2007; Emuron et al., 2010).
49The results allowed us to notice significant differences in both the average prices and additional costs consumers are willing to allocate per chicken (Figure 3). The varying prices of chicken observed are undoubtedly linked to the principles of supply and demand in the market. Consequently, chickens that are less readily available for consumption and whose production does not meet consumer demand will be the most expensive on the market, as was the case here for TC. These observations corroborate those of Teno (2009) in Senegal, who noted both the high price of TC and the difficulty of finding it in the market. The importance that consumers attach to TC, and the fact that it is highly valued by them (Gnakari et al., 2007; Issa et al., 2012), could justify their willingness to pay more for this type of chicken (Asante-Addo & Weible, 2020b). For other authors, TC not only contributes to household food security (Koné & Danho, 2008; Ayssiwede et al., 2013; N’Goran et al., 2016), but also holds socio-cultural importance for the African population in general and the Ivorian northern population in particular (N’Goran et al., 2016).
50The modalities with significant Pearson residuals were the ones that most clearly distinguished the groups. Thus, we focused more on these modalities to better characterize the four groups of chicken consumers shown in figure 6.
51The first cluster (20.7% of chicken consumers) mainly comprised people located in the village who did not consume FGC. Their choice for TC was motivated by their eating habits (Table 5). This group could be categorized as “Absolute non-consumers of FGC”. Given that TC historically served as the primary local chicken source in Côte d'Ivoire (Essoh, 2006), we can hypothesize that consumers in this group have maintained their eating habits without any desire to change them. For these consumers, FGC would seem to be foreign chicken. This aligns with the findings of Asante-Addo & Weible (2020a) who identified ethnocentrism (i.e., the inclination of consumers to prioritize culturally linked eating habits) as a significant factor in the consistent consumption of TC in Ghana. Similarly, research by Bannor et al. (2022) on Ghanaian consumer preferences for indigenous chicken (i.e., traditional chicken), highlighted the presence of an ethnocentric consumer segment primarily residing in rural regions. For these consumers, consuming TC serves as a means of cultural preservation, a trend seemingly affirmed by our study results. The consumer profile of the first cluster reaffirms that dietary and cultural customs play pivotal roles in determining the choice of chicken type consumed in northern Côte d'Ivoire, echoing similar findings regarding food choices in Iran (Roudsari et al., 2017) and meat preferences in Nigeria (Alimi, 2013). Furthermore, the exclusive consumption of TC by this group could also be explained by the fact that many of these rural consumers are themselves TC farmers. As such, it would seem more convenient for them to use the products of their own poultry farming for self-consumption without the need to resort to external markets (N’Goran et al., 2016).
52The second cluster (35.2% of chicken consumers) was characterized by a lack of information about their income. Their consumption of FGC was either equivalent to or greater than the average population's consumption. They preferred FGC for its main attributes (i.e., fast cooking, ample meat quantity, and availability on the market), and they were willing to pay more for this type of chicken. Additionally, they appreciated TC for its main attributes (i.e., firmness, aroma, juiciness, meat adherence to the bone after cooking, and antibiotic-free meat) (Table 5). These consumers could be considered as “Usual big consumers of FGC”. Although they seemed to consume both FGC and TC, their preference leaned more towards FGC. This preference can be attributed to the accessibility and higher meat content of FGC compared to TC, which is lighter (Dyubele et al., 2010; Youssao et al., 2012) and less available on the market (Teno, 2009). This observation confirms past findings. For instance, Asante-Addo & Weible (2020a) pointed out that consumers' concerns about food safety reduced their regular consumption of TC, while the availability of FGC was an important factor driving its consumption in Ghana. Similarly, Donkor (2013) had shown in Ghana that the quantity of meat plays a decisive role in consumers' decision to purchase chicken.
53The third cluster (21.6% of chicken consumers) consisted of individuals with no formal education, residing in rural areas characterized by large households and low incomes. Members of this group particularly consumed HC. They typically consumed less TC than the average population and preferred FGC for its taste (Table 5). These consumers could be categorized as “HC consumers”. This typology of chicken consumer confirms that HC could serve as an alternative to enhance food and nutrition security for large households with low incomes in rural areas, as highlighted by Fulla (2022) in Ethiopia. The motivation behind this group's preference for HC could be attributed to the fact that although HC has a higher meat content compared to TC, its organoleptic quality seems close to that of TC (Gnakari et al., 2007).
54The fourth cluster (22.5% of chicken consumers) was characterized by a high level of education and small household size. Members of this group did not consume TC and typically consumed less FGC compared to the average population. They preferred FGC for its taste, affordability, availability and fast cooking time (Table 5). This group could be defined as “Relative non-consumers of TC”. Although research suggested that the price of chicken is the primary factor influencing consumers' decision-making regarding chicken purchases (Donkor, 2013; Asante-Addo & Weible, 2020a; Faqih et al., 2023), the affordability of FGC appears to be an additional incentive for these consumers rather than a sign of actual price sensitivity. Their purchasing decision is more likely driven by a combination of convenience and personal preference for FGC rather than a purely financial decision. Since these consumers only consumed FGC, it can be inferred that their appreciation of FGC’s taste reflected more their general perception of chicken flavor rather than a direct comparison with other types of chicken. Additionally, consumers in this group mainly lived in urban areas and they also highlighted the availability of FGC in markets and its quick cooking time as factors influencing their choice (Table 6). Their non-consumption of TC could therefore be linked to limited access to TC, which is more commonly raised in rural areas (Bett et al., 2012). Moreover, urban lifestyles habits prioritize time efficiency in food choices, reinforcing the preference for foods that require less cooking time (Jabs & Devine, 2006; Mohammad et al., 2023).
55Household size and income both appear to have an impact on the amount of chicken meat consumed by households, with a stronger trend for the former than for the latter. Indeed, consumer groups with medium to large household sizes (i.e., clusters 1 and 2) tended to be the usual big consumers of chicken (Table 6). Similarly, group 4, which had a small household, appeared to be usual small consumers of chicken, despite having a high income. However, group 3 also seemed to be small consumers of chicken, even though they had a large household; this is likely due to their low income. A similar relationship between income and the quantity of chicken consumed has been observed in Turkey by other authors (Yıldırım & Ceylan, 2008; Aral et al., 2013). However, Haq et al. (2020) emphasized that in Pakistan, food product consumption, including meat, generally increases with income regardless of family size, contradicting our findings. Furthermore, we did not observe any relationship between chicken consumption frequency and household size and income. This is consistent with the previous findings of Assis et al. (2015) in Malaysia.
56Our observations indicated that the consumers’ place of residence appeared to influence both the type of chicken they consume and the frequency of consumption. Specifically, groups located in the village (i.e., groups 1 and 3) tended to eat TC frequently and FGC occasionally, while those located in the city (i.e., groups 2 and 4) seemed to consume these chickens with a reverse pattern (Table 6). This trend may be attributed to the proximity of consumers to the type of chicken consumed and, therefore, to the availability of chicken. TC rearing, predominantly extensive, is more prevalent in rural areas, where families typically raise a variable number of local hens and roosters (Ayssiwede et al., 2013) for both self-consumption and sale (N’Goran et al., 2016). Consequently, these chickens are more readily accessible to rural families. Conversely, FGC are typically intensively raised, usually near urban centers (MIRAH, 2014). Supporting this, Bett et al. (2012) highlighted the importance of household location in understanding variations in meat consumption, including TC, among both rural and urban populations in Kenya.
57The reorganization of chicken consumption by households according to MCA requirements did not facilitate the specification of quantities consumed within each group. However, a general observation indicated that households tend to increase their chicken consumption during festive periods compared to their usual consumption (Table 5). This led to the conclusion that festive periods influence households' attitudes towards chicken consumption, particularly impacting the level of consumption. This conclusion was also reached by several authors, including Emuron et al. (2010), Milkias (2016), Issa et al. (2012) and in Uganda, Ethiopia, and sub-Saharan Africa in general.
58Consumers who were willing to pay (WTP) for chicken were those whose preferences were influenced by their eating habits, the abundance and availability of chicken meat, as well as its organoleptic and sanitary qualities, including taste, firmness, aroma, juiciness, and absence of antibiotics. Conversely, individuals whose primary motivation for consuming chicken was its low price were not inclined to invest more in the product (Table 6). This implies that consumers' eating habits, concerns regarding food safety, and the quality of chicken are significant factors that positively affect their willingness to pay for chicken, regardless of its type. Some of these observations align with previous research. For instance, Gangnat et al. (2018) found that consumers' WTP for poultry in Switzerland correlates positively with their purchasing patterns and familiarity with poultry products. Similarly, Bett et al. (2013) observed in Kenya that the organoleptic characteristics of chicken meat significantly influence consumers' WTP for chicken. Furthermore, Adeyonu et al. (2016) acknowledged that the availability of chicken positively impacts consumers' WTP for chicken in Nigeria.
59Household size appeared to positively influence consumers' WTP for chicken. Specifically, medium to large households were more inclined to pay more for either TC or FGC, or both. This observation may indicate a strong preference among medium and large households for chicken meat in general, making it one of the primary choices for animal protein sources in these larger family settings. However, our findings contradict those of Bett et al. (2013) and Erfanifar et al. (2020), who reported that household size negatively affects WTP for chicken in Kenya and Iran, respectively.
60Our research findings indicate that household income did not appear to have an impact on consumers' WTP for chicken (Table 6). However, previous studies conducted by Saha et al. (2022) in Bangladesh, Bett et al. (2013) in Kenya and Adeyonu et al. (2016) in Nigeria have demonstrated that income positively influences consumer WTP for chicken. The variance between our observations and those of these authors could potentially be attributed to a significant portion of consumers (31.4%) who did not specify their income during the survey (Table 3).
5. Conclusions
61In conclusion, approximately 85% of the surveyed individuals reported consuming chicken meat. However, the characteristics of the chickens preferred by the consumers varied depending on the type. Traditional chicken (TC) was valued for its taste, firmness, juiciness, meat adherence to the bone after cooking, and its antibiotic-free nature. Fast-growing chicken (FGC) was chosen for its abundant meat, quick cooking time, market availability, and affordability. Hybrid chicken (HC) consumption was driven by its taste, firmness, juiciness, meat adherence to the bone, and the abundance of meat. Consequently, consumers were WTP more for TC, followed by HC, and then FGC.
62The surveyed consumers were categorized into four groups based on their chicken preferences and WTP. Furthermore, it was evident that four main factors influenced consumer attitudes. Household size and income, along with festive periods, appeared to positively impact chicken consumption quantities, while the place of residence influenced the type of chicken consumed and its consumption frequency. Notably, the study revealed that chicken meat quantity, availability, organoleptic and sanitary qualities, consumer eating habits, and household size were key factors determining WTP for chicken, regardless of the type.
63Despite consumers' high appreciation for TC, some opted for FGC due to TC's unavailability and the convenience of FGC’s affordability and quick cooking time, which could potentially impede the future development of TC. These findings provide valuable insights for poultry producers and policymakers to better align supply with consumer demand. Enhancing the availability, affordability, and quality of preferred chicken types, while considering socio-economic factors such as household size, income, and festive periods, could improve market efficiency and consumer satisfaction. Additionally, future research could investigate the impact of emerging trends, such as changing dietary habits or the increasing of imported chicken on consumer behavior in the concerned regions.
Bibliographie
Adeyonu A., Oyawoye E., Fabiyi E. & Owolabi A., 2016. Factors influencing consumers’ Willingness to Pay for Nigeria processed chicken in Kwara State. Am. J. Exp. Agric., 10(5), 1-7, doi.org/10.9734/ajea/2016/22416
Aklilu H.A., Almekinders C.J.M., Udo H.M.J. & Van der Zijpp A.J., 2007. Village poultry consumption and marketing in relation to gender, religious festivals and market access. Trop. Anim. Health Prod., 39, 165-177, doi.org/10.1007/s11250-007-9002-8
Alimi R.S., 2013. An analysis of meat demand in Akungba-Akoko, Nigeria. Niger. J. Appl. Behav. Sci., 1, 96-104.
Aral Y. et al., 2013. Consumer preferences and consumption situation of chicken meat in Ankara province, Turkey. Turk. J. Vet. Anim. Sci., 37(5), 582-587, doi.org/10.3906/vet-1210-36
Arnoldus M. et al., 2020. Senegal value chain study: poultry. RVO Netherlands Enterprise Agency.
Asante-Addo C., 2020. Analysis of consumer attitudes, preferences, and demand for poultry meat in Ghana. PhD thesis: Georg-August-University Goettingen (Germany).
Asante-Addo C. & Weible D., 2020a. Imported versus domestic chicken consumption in Ghana: do attitudes and perceptions matter? J. Int. Food Agribus. Mark., 32(5), 503-526, doi.org/10.1080/08974438.2020.1751767
Asante-Addo C. & Weible D., 2020b. Is there hope for domestically produced poultry meat? A choice experiment of consumers in Ghana. Agribusiness, 36(2), 281-298, doi.org/10.1002/agr.21626
Assis K., Komilus C.F., Bonaventure B. & Mohd Shahrol Ridzal O., 2015. Consumption patterns of chicken, beef and mutton: a study among consumers in Kota Kinabalu, Sabah, Malaysia. Global J. Adv. Res., 2(1), 279-286.
Ayssiwede S.B. et al., 2013. Élevage des poulets traditionnels ou indigènes au Sénégal et en Afrique subsahariene : état des lieux et contraintes. Ann. Med. Vet., 157(2), 103-119.
Bannor R.K. et al., 2022. Consumer segmentation and preference for indigenous chicken products. J. Agribus. Dev. Emerging Econ., 12(1), 75-93, doi.org/10.1108/JADEE-08-2020-0162
Benzécri J.P.B., 1979. Sur le calcul des taux d’inertie dans l’analyse d’un questionnaire. In : Les cahiers de l’analyse des données. Tome 4, n° 3. Malakoff, France : Dunod Éditeur, 377-378.
Bett H.K., Musyoka M.P., Peters K.J. & Bokelmann W., 2012. Demand for meat in the rural and urban areas of Kenya: a focus on the indigenous chicken. Econ. Res. Int., 2012, 1-10, doi.org/10.1155/2012/401472
Bett H.K., Peters K.J., Nwankwo U.M. & Bokelmann W., 2013. Estimating consumer preferences and willingness to pay for the underutilised indigenous chicken products. Food Policy, 41, 218-225, doi.org/10.1016/j.foodpol.2013.05.012
Boimah M. & Weible D., 2021. Assessing protectionism and its impact from consumers’ perspective: the case of Senegal’s poultry import ban. World Food Policy, 7(1), 26-40, doi.org/10.1002/wfp2.12025
Boka E.E.J., 2009. Pratique des mesures de biosécurité dans les marchés de volailles vivantes en Côte d’Ivoire : cas du district d’Abidjan. Thèse de doctorat : Université Cheikh Anta Diop de Dakar (Sénégal).
Cadudal F., 2017. Analyse rétrospective de l’évolution du marché mondial des viandes de volailles et dynamiques émergentes. In : 12e Journées de la Recherche Avicole et Palmipèdes à Foie Gras, 5-6 avril 2012, Tours, France, 1-10.
Chen P. & Antonelli M., 2020. Conceptual models of food choice: influential factors related to foods, individual differences, and society. Foods, 9(12), 1-21, doi.org/10.3390/foods9121898
Deman C., 2016. Perspectives de marché et compétitivité des filières avicoles mondiales et européennes. In : 16è Journée des Productions porcines et avicoles, 30 novembre 2016, Espace Senghor, Gembloux, Belgique, 92-98.
Donkor J., 2013. Consumer choice analysis of imported and locally produced chicken products: evidence from Ghana. Eur. J. Bus. Manage., 5(32), 74-84.
Durand C., 2009. L’échantillon, combien d’unités doit-on prendre ? Notes de cours. Montréal, Canada : Université de Montréal.
Dyubele N.L., Muchenje V., Nkukwana T.T. & Chimonyo M., 2010. Consumer sensory characteristics of broiler and indigenous chicken meat: a South African example. Food Qual. Preference, 21(7), 815-819, doi.org/10.1016/j.foodqual.2010.04.005
Dzungwe J.T., Tozo K. & Chrysostome C., 2022. Growth performance, mortality, and carcass yield evaluation of pure and reciprocal crosses between Sasso and Wassache chickens. Trop. Anim. Health Prod., 54(5), 1-7, doi.org/10.1007/s11250-022-03272-x
Emuron N. et al., 2010. Factors influencing the trade of local chickens in Kampala city markets. Livest. Res. Rural Dev., 22(4), 1-14.
Erdaw M.M., 2023. Contribution, prospects and trends of livestock production in sub-Saharan Africa: a review. Int. J. Agric. Sustainability, 21(1), doi.org/10.1080/14735903.2023.2247776
Erfanifar S., Bakhshoodeh M. & Zibaei M., 2020. Valuing the quality of chicken meat from consumers’ viewpoint in Shiraz city of Iran. Agric. Econ. Dev., 28(1), 143-169.
Essoh A.F.E., 2006. Les importations de viandes de volaille et la filière avicole en Côte d’Ivoire de 1999 à 2003. Thèse de doctorat : Université Cheikh Anta Diop de Dakar (Sénégal).
Faqih A. et al., 2023. Analysis of consumer preferences in buying broiler chicken meat. Interdiscip. J. Humanity (INJURITY), 2(7), 592-602, doi.org/10.58631/injurity.v2i7.95
Fulla S.T., 2022. Review on potential and impact of chicken crossbreeding in developing countries. World Sci. News, 166(January), 28-42.
Gangnat I.D.M. et al., 2018. Swiss consumers’ willingness to pay and attitudes regarding dual-purpose poultry and eggs. Poult. Sci., 97(3), 1089-1098, doi.org/10.3382/ps/pex397
Gnakari D., Beugré Grah A.M. & Agbo Adouko E., 2007. Croissance corporelle et qualité organoleptique de la viande du poulet de chair et du poulet africain et leurs croisements en Côte d’Ivoire. Livest. Res. Rural Dev., 19(5).
Haq S. ul, Boz I., Shahbaz P. & Murtaza M.R., 2020. Rural families food intake behaviour in relation to livelihood diversification, income differences and family size. Int. J. Consum. Stud., 44(5), 481-498, doi.org/10.1111/ijcs.12580
INS-CI (Agence Nationale de la Statistique-Côte d’Ivoire), 2016. RGPH-2014 Résultats globaux, 1-12. Abidjan : INS, https://www.ins.ci/documents/rgph/ivoirien18plus.pdf, (24/04/2025).
Issa Y., Mopate L.Y. & Missohou A., 2012. Commercialisation et consommation de la volaille traditionnelle en Afrique subsaharienne. J. Anim. Plant Sci., 14(3), 1985-1995.
Jabs J. & Devine C.M., 2006. Time scarcity and food choices: an overview. Appetite, 47(2), 196-204, DOI:10.1016/j.appet.2006.02.014.
Jiang B. & Kassoh F.S., 2023. A comparative study of high-quality broiler purchase behavior between Chinese and Sierra Leonean consumers: the moderating role of uncertainty avoidance. Sustainability, 15(1), 457, doi.org/10.3390/su15010457
Koné S. & Danho T., 2008. Revue du secteur avicole. Côte d’Ivoire. Rome : FAO.
Kulla D. et al., 2021. The impact of chicken imports on the Beninese poultry industry. Berlin, Germany: Humboldt-Universität zu Berlin.
Kwadzo G., Dadzie F., Osei-Asare Y. & Kuwornu J.K.M., 2013. Consumer preference for broiler meat in Ghana: a conjoint analysis approach. Int. J. Mark. Stud., 5(2), 66-73, doi.org/10.5539/ijms.v5n2p66
Kyarisiima C.C. et al., 2011. Perceived tastes and preferences of chicken meat in Uganda. Livest. Res. Rural Dev., 23(11), http://www.lrrd.org/lrrd23/11/kyar23242.htm, (06/05/2025).
Leroy G. et al., 2015. Review: sustainability of crossbreeding in developing countries; definitely not like crossing a meadow... Animal, 10(2), 262-273, doi.org/10.1017/S175173111500213X
Milkias M., 2016. Chicken meat production, consumption and constraints in Ethiopia. Food Sci. Qual. Manage., 54, 1-12.
MIRAH (Ministère des Ressources Animales et Halieutiques), 2014. Plan stratégique de développement de l’élevage, de la pêche et de l’aquaculture en Côte d’Ivoire (PSDEPA 2014-2020). Abidjan : MIRAH, https://faolex.fao.org/docs/pdf/ivc146471.pdf, (06/05/2025).
Mohammad T., Yusop A.S. & Ahamad Azam N.A., 2023. Factors affecting urban consumers’ purchase decisions for ready-to-eat foods: a study in Pulau Pinang, Malaysia. Adv. Int. J. Bus. Entrepreneurship SMEs, 5(16), 99-119, doi.org/10.35631/aijbes.516010
N’Goran K.E. et al., 2016. Characteristics of village chicken production in farming system in Côte d’Ivoire : case of Korhogo area. Int. J. Environ. Agric. Res., 2(1), 78-85.
Neima H.A., Sirwan K. & Hameed K., 2021. Consumers choice and preference for chicken meat in Sulaymaniyah. In: Proceedings of the 4th International conference for agricultural and sustainability sciences, 4-5 October 2021, Babil, Iraq. IOP Conference Series: Earth and Environmental Science, Vol. 910.
OECD & FAO, 2023. OECD-FAO Agricultural Outlook 2023-2032. Paris: OCDE; Roma: FAO, doi.org/10.1787/a187ca6c-fr
Palm R., 2007. L’analyse des correspondances multiples : principes et application. Gembloux, Belgique : ULg-Gembloux Agro-Bio Tech, https://orbi.uliege.be/bitstream/2268/81751/1/AnalyseCorrespondances.pdf, (06/05/2025).
Ripoll G., Alberti P. & Panea B., 2015. Consumer segmentation based on food-related lifestyles and perception of chicken breast. Int. J. Poult. Sci., 14(5), 262-275, doi.org/10.3923/ijps.2015.262.275
Roudsari A.H. et al., 2017. Psycho-socio-cultural determinants of food choice: a qualitative study on adults in social and cultural context. Iran. J. Psychiatry, 12(4), 241-250.
Saha S.M. et al., 2022. Willingness to pay for safe chicken meat in Bangladesh: a contingent valuation approach. J. Food Qual., 2022, 1-12, doi.org/10.1155/2022/3262245
Shaw M., Nielson H. & Rose M., 2019. Poultry sector study. London: IMC Worldwide.
Teno G., 2009. Étude des déterminants de la consommation du poulet du pays : cas de la région de Dakar (Sénégal). Thèse de doctorat : Université Cheikh Anta Diop de Dakar (Sénégal).
Traoré B., 2018. Étude de la valeur nutritionnelle des produits et coproduits disponibles dans la région du Poro, au Nord de la Côte d’Ivoire en vue de proposer des formules alimentaires pour les volailles. Mémoire : Université de Liège - Gembloux Agro-Bio Tech (Belgique).
Udomkun P. et al., 2018. What are the key factors influencing consumers’ preference and willingness to pay for meat products in Eastern DRC? Food Sci. Nutr., 6(8), 2321-2336, doi.org/10.1002/fsn3.813
Van Loo E.J. et al., 2011. Consumers’ willingness to pay for organic chicken breast: evidence from choice experiment. Food Qual. Prefer., 22(7), 603-613, doi.org/10.1016/j.foodqual.2011.02.003
Worch T., Lê S. & Punter P., 2010. How reliable are the consumers? Comparison of sensory profiles from consumers and experts. Food Qual. Preference, 21(3), 309-318, doi.org/10.1016/j.foodqual.2009.06.001
Yıldırım I. & Ceylan M., 2008. Urban and rural households’ fresh chicken meat consumption behaviors in Turkey. Nutr. Food Sci., 38(2), 154-163, doi.org/10.1108/00346650810863037
Youssao I.A.K. et al., 2012. Comparison of growth performance, carcass characteristics and meat quality of Benin indigenous chickens and Label Rouge (T55SA51). Afr. J. Biotechnol., 11(89), 15569-15579, doi.org/10.5897/ajb11.1747
Para citar este artículo
