


- Accueil
- Volume 17 (2013)
- numéro 4
- Standardization of NIR microscopy spectra obtained from inter-laboratory studies by using a standardization cell


Visualisation(s): 4155 (36 ULiège)
Téléchargement(s): 259 (4 ULiège)

Standardization of NIR microscopy spectra obtained from inter-laboratory studies by using a standardization cell

Notes de la rédaction
Received on November 6, 2012; accepted on September 3, 2013
Résumé
Standardisation de spectres de microscopie proche infrarouge obtenus à partir des études inter-laboratoires et en utilisant une cellule de standardisation. Le microscope proche infrarouge (NIRM) est un instrument complet qui a démontré sa grande capacité à détecter les contaminants non pas par l’analyse d’un simple spectre, mais par l’analyse de centaines ou de milliers de spectres à partir de particules individuelles, tout en étant en même temps une technique non destructrice et facile à utiliser. Il a été utilisé pour la détection de viande et farine d’os (MBM) dans les aliments composés pour animaux dans le contexte de la crise européenne de l’encéphalopathie spongiforme bovine (BSE ; plus communément appelée « maladie de la vache folle »). Cette étude décrit, pour la première fois, une application de standardisation d’instruments NIRM utilisant une cellule de standardisation dans une étude interlaboratoire menée dans le cadre de la détermination qualitative des protéines animales dans les aliments composés pour animaux basés sur des spectres obtenus via huit instruments différents. La cellule de standardisation a été choisie pour sa capacité à produire une bonne adaptation optique des instruments et/ou à évaluer la performance d’un certain instrument.
Abstract
The near-infrared microscope (NIRM) is an instrument that has demonstrated its great ability to detect contaminants not by analyzing a single spectrum but rather by analyzing hundreds or thousands of spectra from individual particles, while at the same time being a non-destructive and easy-to-use technique. It has been used for the detection of meat-and-bone meal (MBM) in compound feeds within the context of the European bovine spongiform encephalopathy (BSE; commonly known as “mad cow disease”) crisis. This study describes, for the first time, an application of NIRM instrument standardization using a measurement cell in an inter-laboratory study conducted within the framework of a qualitative determination of animal proteins in compound feeds, based on spectra obtained with eight instruments. The standardization cell was assessed for its ability to produce good optical matching of the instruments and/or to evaluate instrument performance.
Table des matières
1. Introduction
1Near-infrared (NIR) spectroscopy has become one of the most important techniques used in the food and feed industry and the pharmaceutical industry, among other sectors, because of its many practical advantages (Bouveresse et al., 1998). A serious limitation, however, is that quite often two instruments do not produce the same results. These discrepancies can be caused by sampling errors, instability of the chemometric methods and differences between the instruments even if they are the same brand and model. In order to reduce these discrepancies and therefore meet the need to be able to use available information by transferring spectral datasets from one instrument to another (Dardenne, 2002), instrument standardization is necessary. The term “instrument standardization” relates to the set of mathematical and statistical methods used to transfer spectra obtained from a secondary (also called “slave”) instrument to a primary (also called “master”) instrument. Dardenne (2002) has shown the importance of instrument standardization where instrument responses are matched within a group or network. A global calibration for all the instruments was constructed to reduce inter-instrument differences. There is abundant scientific evidence supporting the possibility of cloning NIR instruments based on using the full wavelength range, as well as limited wavelength filter instruments (Shenk, 1991; Bouveresse et al., 1994; Shenk et al., 1995; Greensill et al., 2001; Park et al., 2001; Yoon et al., 2002; Fan et al., 2008). Various approaches have been developed for performing accurate calibration transfer (Bouveresse et al., 1996a; Fearn, 2001; Brown, 2009). These methods include the use of techniques for adjusting spectra from one instrument to make them match those from other instruments, techniques for adjusting calibrations to account for instrument differences, and the development of robust calibrations. Instrument standardization can also be achieved through spectral matching and the inclusion of spectra from different instruments in the calibration database. One of the most common techniques for instrument standardization is the piecewise direct standardization (PDS) technique (Wang et al., 1992). Seen as a direct transfer technique with a good performance, PDS is based on the hypothesis that the spectral information provided at a certain wavelength on the primary instrument is contained in a small spectral region within a few neighbouring wavelengths on the secondary instrument (Alamar et al., 2005). This technique has been successfully applied mainly among NIR instruments (Wang et al., 1993; Bouveresse et al., 1996b; Whelburg et al., 2002; Lei et al., 2010) and more recently among dispersive instruments and handheld spectrometers (Fernández Pierna et al., 2010). Most papers referenced here on the transfer problem focus on regression models. Analogous to the situation found in calibration, a discrimination model constructed from spectra measured on one instrument is often not valid for predicting spectra measured on a secondary instrument, although only a few studies have been done on this topic (Blackburn et al., 2002; Myles et al., 2006).
2There is a lack of information about near-infrared microscope (NIRM) instrument matching. NIRM has proved to be a powerful tool for detecting banned meat-and-bone meal (MBM) in compound feeds within the context of the European bovine spongiform encephalopathy (BSE; commonly known as mad cow disease) crisis (Stratfeed, 2001). An NIRM instrument enables MBM to be detected not by analysis of a single spectrum but rather by analyzing hundreds or thousands of spectra from individual particles. The instrument is a hyphenated technique whereby an NIR spectrometer is coupled with an optical microscope. It requires a low level of expertise and is a non-destructive method with an MBM detection limit lower than 0.1%. It also has a low level of false negatives, high repeatability and independence in terms of the feed matrix used.
3Under the Sixth Framework Programme (FP6) of the European SAFEED-PAP project, a validation study of the NIRM method for detecting the presence of animal tissue in feed was conducted. Its primary aim was to establish the performance characteristics of a previously proposed NIRM method (Baeten et al., 2005; Fumière et al., 2009) when used for detecting animal products in feedstuffs that had undergone sedimentation, or not, as applied within the European official control method. The method delivers qualitative results in terms of the presence or absence of animal particles in feed. The NIRM method differentiates animal from vegetable ingredients by evaluating NIR spectra obtained from individual particles in the sample and it is supported by appropriate decision rules for absorbance at specific wavelengths. Until recently, only one study had shown that the method and the related decision rules could be successfully transferred from one laboratory to two other independent laboratories that were not involved in the calibration process of the method (von Holst et al., 2008). This study showed very good agreement among the three laboratories, demonstrating the robustness of the method. This robustness is an important performance characteristic, especially when the method is used as an additional tool within the official control framework. The validation study results have been presented in another paper (Boix et al., 2012); here, we focus on the standardization efforts, which were crucial to the success of the validation study.
4This paper describes an application of NIRM instrument standardization using a proposed measurement cell prepared for future qualitative determination (or discrimination) of animal proteins in compound feeds. Eight laboratories were involved in this work, each with its own NIRM instrument (all from the same manufacturer, except for one). The first aim was to prove that all the instruments worked in the same way so that they could be used in a future validation study. The standardization cell used had been developed by the Walloon Agricultural Research Centre under the European Union (EU) Stratfeed project (Baeten et al., 2001; Stratfeed, 2001) and consists of a set of sealed and well-known feed materials used as a reference (i.e., pig meal, sheep meal, feather meal, soya meal, chicken meal, corn, fish meal, blood from pig and bovine meal; the last-mentioned material has been permanently banned in the EU). In addition, two holes were filled, one with polystyrene and the other with teflon. The standardization cell is similar to the standardization cells proposed by Shenk et al. (2008) to standardize classical NIR spectrometers. A sealed cell is recommended to prevent small moisture changes in the samples and changes in the surface.
5As a first step, all the laboratories were trained to scan the standardization cell using a detailed and well-defined protocol. The standardization cell was then analyzed by the laboratories and evaluated for its ability to produce good optical matching of the instruments and/or to evaluate instrument performance using PDS as the transfer method. Although the transfer of a discrimination model from one instrument to another was not the primary objective of the study, a model was constructed based on spectra from the primary instrument and was applied to the corrected spectra from the secondary instruments to check the performance of the standardization process.
2. Materials and methods
2.1. NIRM
6All the instruments used in this study consisted of an NIR spectrometer coupled with an optical microscope in which the lenses were adapted to NIR radiation. NIRM instruments allow spectra to be collected from extremely small sample areas (typically, 50 µm × 50 µm or less, depending on the instrument and the configuration). Most instruments included a camera and a viewing system that magnified the visible light image of the sample, allowing the user to visualize it and to position an infrared beam on the sample area of interest using a motorized stage. Using the microscope pointer, the infrared beam was focused on each point of interest and the NIR spectrum was collected (Baeten et al., 2002).
7Of the eight NIRM instruments used in the collaborative study, seven were auto image microscopes connected to a Fourier transform NIR spectrometer from PerkinElmer, but working with different spectral ranges. The eighth instrument was a Hyperion 2000 from Bruker with a tungsten source, CaF2 beamsplitter and InGaS detector.
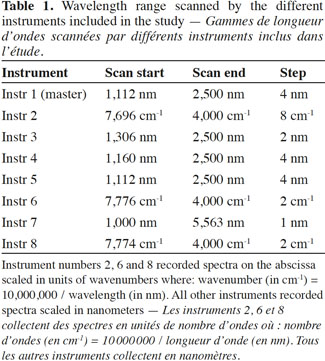
8Each of the eight instruments worked in a different way. The spectra were collected from the instruments across the ranges given in table 1, which are the original ranges for each instrument. Instrument numbers 2, 6 and 8 recorded spectra on the abscissa scaled in units of wavenumbers where: wavenumber (in cm-1) = 10,000,000 / wavelength (in nm). All the other instruments recorded spectra scaled in nanometers. A fixed step size in nanometers on conversion to cm-1 is not evenly spaced, leading to some uncertainty and imperfections in simple linear interpolation. The table shows that most of the instruments worked near the spectral region of 1,100-2,500 nm, between the visible and infrared regions, normally considered to encompass the NIR spectral region. This region is composed primarily of combination and overtone bands, mainly for the NH, CH and OH chemical groups.
2.2. Standardization cell
9In order to match the instruments, a standardization cell was designed with different kinds of feed materials (Figure 1).
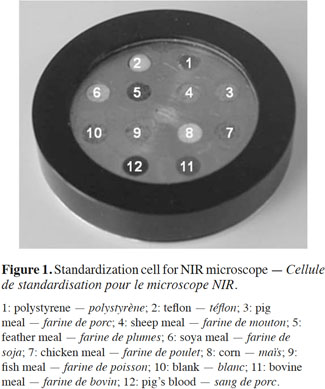
10This sealed standardization cell consisted of a set of well-known animal protein materials placed in holes made in the cell surface. The materials were of various animal origins (fish meal, poultry meat-and-bone meal [MBM], pork MBM, cattle MBM and sheep MBM) and included examples of various kinds of animal by-product particles (i.e., muscle, feathers or blood), as well as plant materials (soya and corn), as described in the literature (Baeten et al., 2004). The two holes, filled with polystyrene and Teflon, were used as reference surfaces.
2.3. Methodology
11A detailed analytical procedure was established in order to ensure that all the study participants worked in similar conditions. The procedure specified the parameters to be fixed in the instrument and the experimental conditions required for dealing with the standardization cell. The procedure was designed to be applicable to the detection of animal material in feed in entire samples (not sedimented), as well as in the sediment fraction obtained when applying the official European classical microscopic method (van Raamsdonk et al., 2007). In both cases, ingredients of animal origin were detected based on typical NIR spectral features. Animal material was detected by the NIR analysis of individual particles. Using a microscope, an NIR light was focused onto the surface of a particle and the NIR-reflected light from each individual particle in the sample was collected. Each particle selected was scanned 10 times and the NIR spectra collected were then averaged. In this way, for each material, 10 good quality spectra were acquired by each participant over 2 consecutive days (i.e., a total of 20 spectra for each material available).
12The analytical procedure included a background acquisition. This was done by placing a blank Spectralon™ disk on the sample holder of the microscope. The disk was then placed under the beam and the illumination set at 50% in order to provide a good visual image and zero reference. The measurement was taken in the reflectance mode as log 1/R (where log 1/R = log I0-log Ir) and the spectra were taken using the point-by-point mode. The aperture size was set at 50 µm x 50 µm; the scan range, as defined in the protocol, was 4,000-7,800 cm-1 with a resolution of 8 cm-1, although, as presented in table 1, some laboratories applied different scanning conditions. One hundred scans of the Spectralon™ background were made and then averaged.
3. Results and discussion
13This study involved carrying out a simple instrument-matching procedure in order to obtain almost identical spectra from all the instruments participating in the collaborative study. The proposed standardization cell was a key part of instrument standardization and was used to ensure good instrument matching and good library and calibration transfer under the most difficult circumstances. All the samples included in the standardization cell were measured by the eight instruments as described in the previous section and using the instrument specifications given in table 1. As the table shows, and because the samples were measured in different spectrometers, the wavelength values across the spectrum differed. The first step, therefore, was to restrict the wavelength range to 1,100-2,500 nm, which was the range of the primary instrument. The same procedure was applied to all the materials included in the standardization cell. Figure 2 gives the results for the chicken meal, showing the mean spectrum obtained from each instrument for the chicken meal sample included in the standardization cell (the line in bold represents the mean spectrum for the primary instrument).
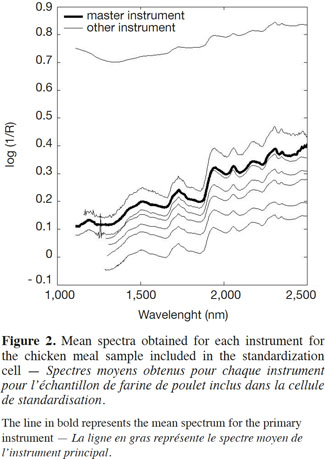
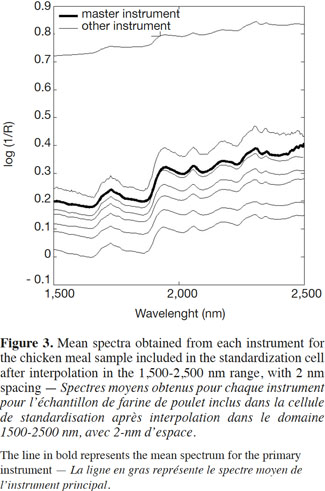
14Apart from the baseline scattering offset, in general there was very good agreement between the instruments over their respective NIR spectral ranges. One of the instruments presented an absorbance intensity that differed from the rest, whereas another instrument presented an important spike artefact around 1,250 nm. The second step, therefore, was to reduce the wavelength range in order to solve this problem. The third step consisted of an interpolation in the 1,500-2,500 nm range, with 2 nm spacing (Figure 3). This was done by a simple linear interpolation.
15After the interpolation had been performed, the PDS method was applied among the spectra from the primary instrument and the mean spectrum of all the other secondary instruments. This technique involved local multivariate models and was based on the hypothesis that the spectral information given at a certain wavelength on each spectrometer was contained in a small spectral region within a few neighboring wavelengths on the primary instrument. The PDS method was used to transfer the NIRM spectra from the instruments on which they were collected (secondary instruments) to the primary instrument. Figure 4 shows the mean spectrum of the chicken meal for all the instruments after the application of PDS.
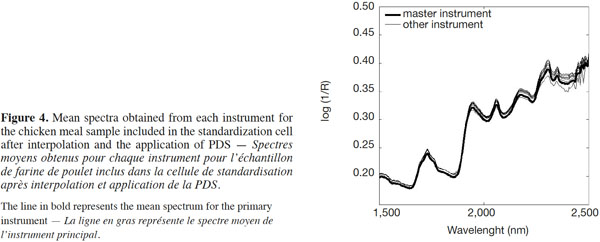
16The subsequent application of PDS seemed to eradicate the inadequacies observed on the ordinate log1/R axis seen in raw NIRM spectra (Figure 3) by repairing the scatter offset, adjusting any wavelength interpolation errors, sample placement geometry and the solid angle subtended by the source and/or detectors, and so on. Thus, PDS appeared to be a “catch-all” for curing numerous preparation, presentation, optical and instrumental defects that conspire to spoil and confound the interpretation of spectra.
17Figure 5 shows the reconstruction error (or mean square error) before and after the PDS method was applied. The continuous line corresponds to the reconstruction error between the mean spectra of chicken meal measured with the primary instrument and with the rest of the instruments after interpolation but before standardization; the dotted line shows the results after standardization.
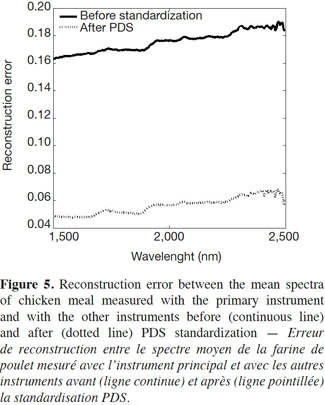
18As the figure shows, the transfer method used allowed the reconstruction error for the data sets to be reduced, indicating that the proposed methodology worked well.
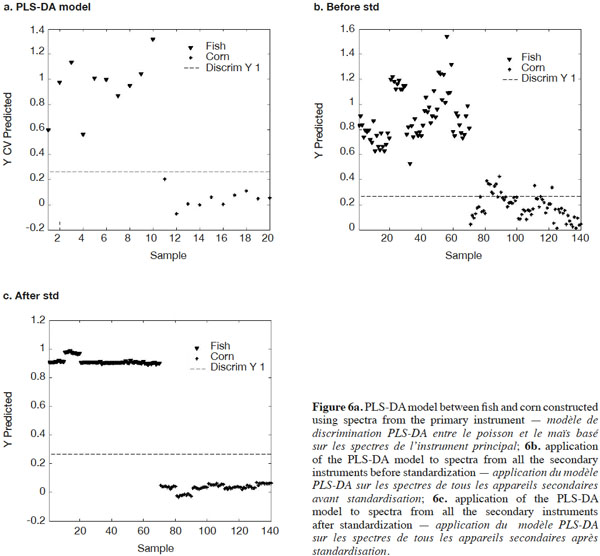
19Another way of illustrating standardization performance is to construct a model based on spectra from the primary instrument and apply it to the corrected spectra from the secondary instruments. For this exercise, data exclusively from this study were used. Initially, a simple Partial Least Squares Discriminant Analysis (PLS-DA) model between fish and corn was constructed using spectra from only the primary instrument (Figure 6a). This PLS-DA model was then applied to the fish and corn spectra from the seven secondary instruments together, before and after standardization with PDS (Figures 6b and 6c). Before standardization, the spectra of corn and fish meal were expected to be so different that visual inspection alone would easily discriminate between the two. The PLS-DA model, however, developed from the primary master instrument spectra alone, shown in figure 6a, demonstrated quite considerable scatter before applying PDS, even when discrimination was possible, except for one instrument. Figure 6b shows the same or even worse scatter before PDS among the seven secondary instruments. After standardization, as shown in figure 6c, there was excellent discrimination among the seven secondary instruments and the variability for each group was greatly reduced.
20Figure 7 shows a scatter score plot before and after standardization of the mean spectra of corn, fish, pig and soya samples from all instruments, demonstrating decreased variability for each product.
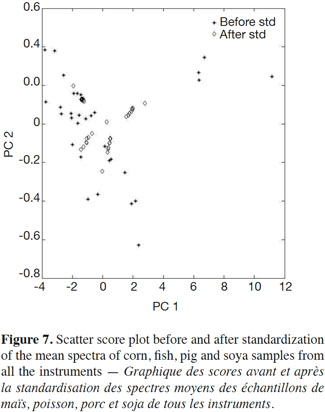
21These results indicate that PDS standardization tends to standardize the spectra rather than the instruments per se, which was confirmed by the results shown in figure 4.
22The performance of the standardization was also tested by using the proposed decision rules based on the visual observation of the spectra described by von Holst et al. (2008) to assess the animal origin of the samples. The results obtained by applying these rules are the basis of the validation study presented by Boix et al. (2012). This test proved that the process of standardizing the samples removed confounding differences from the spectra and made it easier to apply these rules, which are still valid.
4. Conclusion
23The specific objective of this paper was to demonstrate that, using simple mathematical procedures, spectral libraries that were almost identical could be obtained from different instruments. These libraries consisted of the same samples drawn from the same standardization cell using a well-defined protocol. Interpolation to match the eight wavelength intervals was effective. Applying PDS after interpolation showed that it is possible to transfer the spectra from different NIRM instruments, even with instruments of different configurations or types, to the primary instrument. This was demonstrated by looking at the standard deviation of the spectra across all wavelengths for each of the materials included in the standardization cell, by the reconstruction error before and after correction by PDS and by the use of a PLS discrimination model. The study also showed that the previously proposed decision rules based on visual observation of the spectra were still valid.
24The study demonstrated that the proposed protocol for analyzing animal proteins in feed using NIRM can be used in different laboratories, independent of location, device, analyst or software used to acquire spectra. It also showed that a calibration model based on a unique and larger dataset could be developed. The performance characteristics of the proposed methodology have been determined and validated using routine and blind samples via a collaborative study and published elsewhere (Boix et al., 2012).
25Acknowledgements
26We thank the European Commission, through the Sixth Framework Programme (FP6; [in the Integrating and Strengthening the European Research Area Specific Targeted Project], which is part of the SAFEED-PAP project [FOOD-CT-2006-036221] [http://safeedpap.feedsafety.org/]) for funding this work. The information contained in this paper reflect the authors’ views; the European Commission is not liable for any use of the information contained therein.
Bibliographie
Alamar M.C. et al., 2005. Calibration transfer between NIR diode array and FT-NIR spectrophotometers. In: Regnard J.L., ed. Information and technology for sustainable fruit and vegetable production FRUTIC 05. Montpellier, France: Agro Montpellier, 513-522.
Baeten V. & Dardenne P., 2001. The contribution of near infrared spectroscopy to the fight against the mad cow epidemic. NIRS News, 12(6), 12-13.
Baeten V. & Dardenne P., 2002. Spectroscopy: developments in instrumentation and analysis. Grasas Aceites, 53(1), 45-63.
Baeten V. et al., 2004. Analysis of the sediment fraction of feed by near-infrared microscopy (NIRM). In: Davies A.M.C. & Garrido-Varo A., eds. Near Infrared Spectroscopy: Proceedings of the 11th International Conference. Chichester, UK: NIR Publications, 663-666.
Baeten V. et al., 2005. Detection of banned meat and bone meal in feedingstuffs by near-infrared microscopy analysis. Anal. Bioanal. Chem., 382, 149-157.
Blackburn M., Ramos S. & Rohrback B., 2002. Transfer of calibration for classification problems. InfoMetrix, http://www.infometrix.com/apps/CAC2002_ClassifyTOC.pdf, (25/01/2012).
Boix A., Fernández Pierna J.A., von Holst C. & Baeten V., 2012. Validation of a near infrared microscopy method for the detection of animal products in feedingstuffs: results of a collaborative study. Food Addit. Contam. A, 29(1)2, 1872-1880.
Bouveresse E., Massart D.L. & Dardenne P., 1994. Calibration transfer across near-infrared spectrometric instruments using Shenk’s algorithm: effects of different standardisation samples. Anal. Chim. Acta, 297(3), 405-416.
Bouveresse E. & Massart D.L., 1996a. Standardization of near-infrared spectrometric instruments: a review. Vib. Spectrosc., 11, 3-15.
Bouveresse E. & Massart D.L., 1996b. Improvement of the piecewise direct standardization procedure for the transfer of NIR spectra for multivariate calibration. Chemom. Intell. Lab. Syst., 32, 201-213.
Bouveresse E., Casolino C. & de la Pezuela C., 1998. Application of standardisation methods to correct the spectral differences induced by a fibre optic probe used for the near-infrared analysis of pharmaceutical tablets. J. Pharm. Biomed. Anal., 18(1-2), 35-42.
Brown S.D., 2009. Transfer of multivariate calibration models. In: Kalivas J., Buydens L., Lavine B. & van Espen P., eds. Comprehensive chemometrics. Amsterdam, The Netherlands: Elsevier, 345-377.
Dardenne P., 2002. Standardization of near-infrared instruments, influence of the calibration methods and the size of the cloning set. In: Davies A.M.C. & Cho R.K., eds. Near Infrared Spectroscopy: Proceedings of the 10th International Conference. Chichester, UK: NIR Publications, 23-28.
Fan W., Liang Y., Yuan D. & Wang J., 2008. Calibration model transfer for near-infrared spectra based on canonical correlation analysis. Anal. Chim. Acta, 623, 22-29.
Fearn T., 2001. Standardisation and calibration transfer for near infrared instruments: a review. J. Near Infrared Spectrosc., 9, 229-244.
Fernández Pierna J.A. et al., 2010. Calibration transfer from dispersive instruments to handheld spectrometers. Appl. Spectrosc., 64(6), 644-648.
Fumière O. et al., 2009. Methods of detection, species identification and quantification of processed animal proteins in feedingstuffs. Biotechnol. Agron. Soc. Environ., 13, 59-70.
Greensill C.V., Wolfs P.J., Speigelman C.H. & Walsh K.B., 2001. Calibration transfer between PDA-based NIR spectrometers in the NIR assessment of melon soluble solids content. Appl. Spectrosc., 55, 647-653.
Lei D.Q., Hu C.Q., Feng Y.C. & Feng F., 2010. Feasibility of the extended application of near infrared universal quantitative models. Acta Pharmacol. Sin., 45(11), 1421-1426.
Myles A.J., Zimmerman T.A. & Brown S.D., 2006. Transfer of multivariate classification models between laboratory and process near-infrared spectrometers for the discrimination of green Arabica and Robusta coffee beans. Appl. Spectrosc., 60(10), 1198-1203.
Park K.S. et al., 2001. Near-infrared spectral data transfer using independent standardization samples: a case study on the trans-alkylation process. Chemom. Intell. Lab. Syst., 55, 53-65.
Shenk J., 1991. Standardizing NIR instruments. In: Biston R. & Bartiaux-Thill N., eds. Proceedings of the 3rd International Conference on Near-Infrared Spectroscopy. Gembloux, Belgium: Agricultural Research Centre Publishing, 649-654.
Shenk J.S. & Westerhaus M.O., 1995. Comparison of standardization techniques. In: Davis A.M.C. & Williams P., eds. Near Infrared Spectroscopy: The Future Waves, Proceedings of the 7th International Conference on Near Infrared Spectroscopy, 6-11 August 1995, Montreal, Canada. Montreal, Canada: NIR Publications, 112-115.
Shenk J.W. & Shenk J.S., 2008. White paper – Unity Scientific Standardization concept for NIR instrument product lines, http://www.unityscientific.com.au, (24/06/2012).
Stratfeed EC project, 2001. Strategies and methods to detect and quantify mammalian tissues in feedingstuffs, G6RD-2000-CT00414 (2001-2004).
van Raamsdonk L.W.D. et al., 2007. New developments in the detection and identification of processed animal proteins in feeds. Anim. Feed Sci. Technol., 133(1-2), 63-83.
von Holst C. et al., 2008. Transferability study of a near-infrared microscopic method for the detection of banned meat and bone meal in feedingstuffs. Anal. Bioanal. Chem., 392, 313-317.
Wang Y., Lysaght M.J. & Kowalski B.R., 1992. Improvement of multivariate calibration through instrument standardization. Anal. Chem., 64, 562-564.
Wang Y. & Kowalski B.R., 1993. Temperature-compensating calibration transfer for near-infrared filter instruments. Anal. Chem., 65, 1301-1303.
Whelburg C.M., Haaland D.M. & Melgaard D.K., 2002. A new hybrid algorithm for transferring multivariate quantitative calibrations of intra-vendor near-infrared spectrophotometer. Appl. Spectrosc., 56(7), 877-886 .
Yoon J., Lee B. & Han C., 2002. Calibration transfer of near-infrared spectra based on compression of wavelet coefficients. Chemom. Intell. Lab. Syst., 64, 1-14.
Pour citer cet article
A propos de : Juan Antonio Fernández Pierna
Walloon Agricultural Research Centre. Valorisation of Agricultural Products Department. Henseval Building. Chaussée de Namur, 24. B-5030 Gembloux (Belgium). E-mail: fernandez@cra.wallonie.be
A propos de : Ana Boix Sanfeliu
European Commission. Joint Research Centre. Institute for Reference Materials and Measurements. Retieseweg, 111. B-2440 Geel (Belgium).
A propos de : Boleslaw Slowikowski
European Commission. Joint Research Centre. Institute for Reference Materials and Measurements. Retieseweg, 111. B-2440 Geel (Belgium).
A propos de : Christoph von Holst
European Commission. Joint Research Centre. Institute for Reference Materials and Measurements. Retieseweg, 111. B-2440 Geel (Belgium).
A propos de : Oliver Maute
Bruker Optik GmbH. Rudolf-Plank-Str., 27. D-76275 Ettlingen (Germany).
A propos de : Lujia Han
China Agricultural University. College of Engineering. 100083 Beijing (China).
A propos de : Giuseppina Amato
Istituto Zooprofilattico Sperimentale PLVA, CReAA. National Reference Center for Surveillance and Monitoring of Animal Feed. Via Bologna, 148. I-10154 Torino (Italy).
A propos de : Begoña de la Roza Delgado
Regional Institute for Research and Agro-Food Development (SERIDA). Department of Animal Nutrition, Grasslands and Forages. Ctra. de Oviedo, s/n. E-33300 Villaviciosa, Asturias (Spain).
A propos de : Dolores Perez Marin
University of Córdoba. ETSIAM. Animal Production Department. Ctra. Madrid-Cádiz km 396. Campus Rabanales. E-14071 Córdoba (Spain).
A propos de : Gillian Lilley
Animal Health and Veterinary Laboratories Agency. Luddington Road. GB-Stratford-upon-Avon, Warwickshire CV37 9SJ (United Kingdom).
A propos de : Pierre Dardenne
Walloon Agricultural Research Centre. Valorisation of Agricultural Products Department. Henseval Building. Chaussée de Namur, 24. B-5030 Gembloux (Belgium).
A propos de : Vincent Baeten
Walloon Agricultural Research Centre. Valorisation of Agricultural Products Department. Henseval Building. Chaussée de Namur, 24. B-5030 Gembloux (Belgium).
