


- Home
- Volume 17 (2013)
- numéro 4
- Review: milk composition as management tool of sustainability


View(s): 5671 (51 ULiège)
Download(s): 333 (5 ULiège)

Review: milk composition as management tool of sustainability

Editor's Notes
Received on October 15, 2012; accepted on May 8, 2013
Résumé
Synthèse bibliographique : la composition laitière en tant qu’outil de management de la durabilité. L’objectif principal de cette synthèse bibliographique est l’étude de l’utilisation de la composition laitière en tant qu’outil de décision et de gestion. La composition laitière est relativement variable et de nombreux facteurs de variation sont répertoriés dans la littérature tels que le régime alimentaire, la sélection animale, la conduite du troupeau ou le statut sanitaire de l’animal. La composition laitière se révèle être un véritable miroir du statut métabolique de la vache laitière et de l’efficacité du système de gestion du troupeau. Cet article suggère donc l’utilisation pratique de la composition laitière en tant qu’outil d’aide à la décision, en vue d’améliorer la durabilité de la production laitière grâce au contrôle, au suivi et à la détection précoce de dysfonctionnements métaboliques ou de gestion du troupeau. Des valeurs limites sont disponibles en tant qu’exemple dans la littérature pour certains composés. Par ailleurs, l’utilisation de l’outil MIR facilitera (d’un aspect pratique et économique) l’application d’un tel outil sur le terrain. Enfin, les organismes chargés d’assister les éleveurs dans leurs décisions pourront alerter les producteurs laitiers en cas de risque de maladie leur permettant de traiter tout problème préventivement et d’améliorer ainsi leur production laitière d’un point de vue économique, écologique et animal (bien-être).
Abstract
The main objective of this paper is the use of milk composition data as a management tool. Milk composition, and in particular, milk fat content and fatty acid profiles may be significantly altered due to a variety of factors. These factors are reviewed in the literature; they include diet, animal (genetic) selection, management aspects and animal health. Changes in milk composition can be used as an indicator of the animal’s metabolic status or the efficiency of the feed management system. The advantages of using this kind of data as a management tool would be to allow the early detection of metabolic or management problems. The present review suggests that milk and, especially milk fat composition may be used as a sustainability management tool and as a monitoring and prevention tool for several pathologies or health disorders in dairy cattle. Further, due to the use of mid-infrared spectrometry (MIR) technology, these tools may be easily implemented in practice and are relatively cheap. In the field, milk labs or milk recording agencies would be able to alert farmers whenever threshold values for disease were reached, allowing them to improve their dairy production from an economic, ecological and animal (welfare) point of view.
Table of content
1. Introduction
1In the last two decades, the beef and dairy sectors have faced new challenges regarding sustainability issues. The current challenge is to improve the economical efficiency of dairy cows by improving productivity and lowering costs (e.g. feed, veterinary). Firstly, human consumption patterns of beef and dairy products have changed and, currently, besides being driven by price, consumers are basing their choices more often on health aspects of food. Thus, it is becoming increasingly important for dairy farmers to take into account these considerations and to adapt their milk production system to consumer and dairy industry needs. Fortunately, milk composition and, in particular, milk fat content and fatty acid (FA) profiles may be significantly altered through management interventions such as changes in diet (e.g. Grummer et al., 1991; Chilliard et al., 2000; Chilliard et al., 2001; Forsbäck et al., 2010), but also through animal (genetic) selection (Arnould et al., 2009a). The high elasticity of milk fat content offers the opportunity to respond to industry and consumer requirements.
2Secondly, efficient milk production requires dairy cows to experience gestation and parturition every year. Most of the metabolic diseases of dairy cows occur within the first weeks of lactation. Indeed, the cow’s high nutrient demand due to an increased mammary gland activity cannot always be met. The most economically relevant diseases in higher yielding cows are milk fever, ketosis (or acetonemia) and mastitis. Understanding the variation in milk composition can be useful for providing information about the health status of dairy cows. Indeed, modifications in the metabolic process, and changes in milk yield, fatty acids, protein fractions or mineral content can be used as indicators for the metabolic status of the cow (Fleischer et al., 2001; Mulligan et al., 2006). In this case, the efficiency of a cow health management system is determined by the ability to diagnose changes in animal health status at an early stage and the ability to develop preventive measures (Hamann et al., 1997). The earlier health problems are identified, the higher the chance of successful health management, with positive consequences for farm management, economical, ecological and animal welfare issues. Indeed, a more effective prevention system for common dairy diseases and the improvement of the health status of dairy cows would, indirectly, help to improve dairy farming from an economical and ecological point of view. Such a system would limit labor investment, medical treatment costs, and animal suffering (social aspects), and would also increase milk yield and milk quality, including the animal’s lifetime production. In addition, analysis of milk composition could provide some interesting information about the efficiency of the feed management system. Furthermore, feed management issues are highly related to the agricultural environmental footprint. Indeed, methane production, for instance, corresponds to a loss of productive energy in cows and is negatively correlated to feed conversion (Boichard et al., 2012).
3In practice, routine measurement of milk components during milk recording offers the potential for early detection of systemic and/or local alteration and, consequently, provides assistance for strategic and management decisions. Limiting negative influences on dairy cows is the key issue in achieving this objective. The majority of analytical techniques (e.g., gas chromatography, ELISA, or immuno-diffusion methods) used for measuring specific milk components in bovine milk are expensive and time consuming, and require skilled staff. Therefore, these methods are not feasible for making regular measurements relating to individual cows. This inconvenience can be solved by using mid-infrared (MIR) spectrometry. This technology is already used routinely by milk recording organizations to quantify, for instance, fat, protein and lactose content in milk samples. Several papers (Soyeurt et al., 2006, 2008a, 2008b, and 2011; Rutten et al., 2009) have shown the potential of MIR spectrometry for quantifying small fractions, such as fatty acids (Soyeurt et al., 2006 and 2011). Therefore, MIR spectrometry could be used to routinely quantify various milk components. Furthermore, computer-based systems could be very useful in interpreting differences between the observed and expected values of a milk component, which could be used as a guide for health management and preventive systems.
4Several milk components that can be predicted by MIR spectrometry could be used as indicators of the metabolic status of dairy cows. For instance, the milk fatty acid (FA) profile is a dynamic pattern influenced by several factors such as dietary composition, genetics, lactation stage, energy balance and animal status (e.g. parity, days in milk, health status) (Grummer, 1991; Palmquist et al., 1993; Beaulieu et al., 1995; Chilliard et al., 2001; Arnould et al., 2009a; Gross et al., 2011). Moreover, protein, fat, the fat:protein ratio, levels of acetone, etc. could be used as disease, feeding and environmental management indicators, and indirectly, as economical indicators, using observed deviations from normal concentrations and their trends of change (Hamann et al., 1997; Chilliard et al., 2009).
5The objective of this review is to determine the practical aspects of measuring milk composition and milk fat in order to propose an easy, cheap and useful sustainable management tool to help dairy farmers in their daily decisions.
2. Health management
2.1. Acetonemia and energy balance
6At the beginning of lactation, the dairy cow must cope with an important increase in energy demand by the mammary gland for milk production. This is achieved partly by increasing feed intake and partly by fat mobilization from the cow’s adipose tissue. However, excessive fat mobilization may induce an imbalance in hepatic carbohydrate and fat metabolism, characterized by elevated concentrations of ketone bodies (ß-hydroxybutyrate [BHBA], acetoacetate, and acetone), a state called hyperketonemia. Hyperketonemia, in its clinical manifestation (ketosis or acetonemia), has an economical effect through decreased milk production and a greater risk of periparturient diseases such as mastitis and left displaced abomasum (Enjalbert et al., 2001; Mulligan et al., 2006). Subclinical ketosis and negative energy balance are closely linked and numerous studies available on the relationship between modifications in milk composition and the metabolic status of dairy cows focus on the energy metabolism (Hamann et al., 1997). Ketone bodies are produced as by-products when FAs are used in energy metabolism in the liver and kidney. Consequently, subclinical ketosis frequently results from an over-long negative energy balance. Because of its importance in dairy cattle (some studies conclude that approximately 50% of all lactating cows develop subclinical ketosis in early lactation), numerous authors have reviewed this kind of metabolic disorder in dairy cattle (e.g. Hamann et al., 1997; Van Haelst et al., 2008; Gross et al., 2011; Van Der Drift et al., 2012).
7Even if there are no clinical signs of ketosis, milk composition may still be affected (Enjalbert et al., 2001). Current detection methods are based on the measurement of ketone bodies in body fluids (blood, urine or milk) (Van Haelst et al., 2008; Van Der Drift et al., 2012). As expected, both clinical and subclinical ketosis result in increased concentrations of ketone bodies in blood, tissues and milk. As blood sampling is not very convenient for farmers, analyzing milk composition would seem to be an interesting and more practical alternative. A few authors have reported studies comparing concentrations of ketone bodies in milk and blood (e.g. Van Haelst et al., 2008; Van Der Drift et al., 2012). In 2001, Enjalbert et al. observed high correlation coefficients between blood and milk acetone (0.96) and moderate correlation coefficients between blood and milk acetoacetate (0.74). The detection of milk acetone and BHBA could therefore be considered as a good predictor of ketosis in dairy cows. In some countries, such as The Netherlands, acetone and BHBA are already routinely analyzed by Fourier transform infrared spectrometry (FTIR) without any extra cost to the dairy farmer (Van Der Drift et al., 2012). Unfortunately, the number of false-positive test results restricts the usability of acetone and BHBA for reliable detection of acetonemia.
8The FA composition of milk could also be used to detect preclinical ketosis. Indeed, milk fat production is the main expenditure for milk production in dairy cows. Moreover, the milk fat profile has been shown to change markedly during the first weeks of production (from week 1 to week 12) and to remain unchanged thereafter (Gross et al., 2011). For all these reasons, and as mobilization of adipose tissue precedes the development of ketosis and incorporation of mobilized FAs into milk fat, changes in milk FA composition might be an early indicator of hyperketonemia (Van Haelst et al., 2008; Van Der Drift et al., 2012). To summarize, milk FAs can be derived from four major pathways: diet, the mammary gland (de novo synthesis), rumen (bacterial synthesis) and body fat mobilization (Stoop et al., 2009). Thus where a negative energy balance occurs, there may be several reasons underlying the changes in FA composition. Several studies (e.g. Van Haelst et al., 2008; Gross et al., 2011) have proposed relative increases in the proportions of omega-9 (or C18:1 cis9) and long chain fatty acids (LCFAs) as an interesting indicator of subclinical ketosis. Nutrient and energy deficiencies are compensated by mobilization of body fat reserves, predominantly of adipose tissue, associated with the release of FAs. Indeed, the major FAs released during fat mobilization are C16:0, C18:0 and C18:1 cis-9. Unfortunately, milk LCFAs may be largely influenced by diet. Correlations between energy balance and the proportion of C18:1 cis-9 have been shown to range from 0.77 (van Haelst et al., 2008) to 0.92 (Gross et al., 2011). These results confirm that a high proportion of LCFAs (especially if combined with lower medium chain fatty acid [MCFA] proportions) and, in particular, a high proportion of C18:1 cis-9 in milk fat can be considered as a good predictor of subclinical ketosis (Van Haelst et al., 2008).
9According to several authors (Hamann et al., 1997; Heuer et al., 1999; Mulligan et al., 2006), the ratio of milk fat/protein (FPratio) is a useful risk predictor for numerous pathologies observed in dairy cattle, such as negative energy balance, ketosis, displaced abomasums, lameness and mastitis. In 1999, Heuer et al. proposed threshold values for diagnosing health problems in a given dairy cow using analysis of its milk composition. Using these threshold values, Mulligan et al. (2006) established that milk containing an FPratio > than 1.4, a milk protein percentage lower than 2.9%, a milk fat percentage higher than 4.8% and a milk lactose value lower than 4.5% was an indicator for health problems in cows (Table 1). Toni et al. (2011) studied three large Italian dairy herds with 1,498 Holstein dairy cows, 35.8% of which were in first lactation. According to the data collected, the FPratio category with the lowest disease prevalence was between 1 and 1.5. On the other hand, cows presenting an FPratio < than 1 showed a higher risk of developing disease. However, it would seem to be important to use these threshold values carefully, as they would need to be adapted to the particular dairy cow population under study.
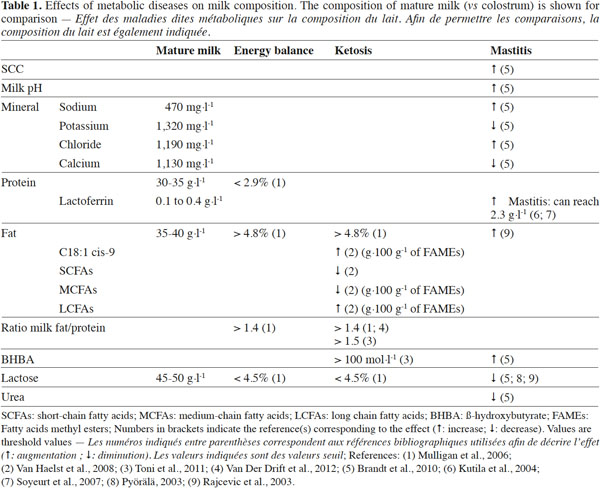
10In addition, many of these milk production traits (fat and protein content, acetone and BHBA concentration) can vary according to the breed, parity number, season, etc. As a result, some authors, such as Van Der Drift et al. (2012), proposed improvements that could be made in order to improve the reliability of acetonemia detection by including the following components in the final diagnostic model: fat content, fatty acid composition (SCFAs, MCFAs, LCFAs and C18:1 cis-9), protein content, FPratio, acetone concentration, BHBA concentration, and other relevant factors, such as parity and season.
2.2. Indicators of mammary inflammation
11In a well managed dairy herd, both clinical mastitis and subclinical mastitis should be efficiently detected (Pyörälä, 2003). Unfortunately, bacteriological sampling is not feasible as a routine test to identify subclinical mastitis. It is well known that mastitis affects the quality of milk, and several authors (e.g. Pyörälä, 2003; Brandt et al., 2010) have reported changes in the composition of milk obtained from cows with infection. Thus, these changes in milk composition could be used as indirect mammary inflammation indicators. The most important changes are: an increasing permeability of the mammary epithelium, leading to a leak of ions, proteins and enzymes from the blood into milk (Bannerman et al., 2003), the invasion of phagocyting cells into udder compartments (Pyörälä, 2003; Komine et al., 2006), and a decreasing production capacity of the mammary gland, resulting in reduced concentrations of certain milk components (Pyörälä, 2003). Besides a high somatic cell count (SCC), the most important changes in milk composition resulting from subclinical mastitis are an increase in free FA concentration; a reduction in casein combined with an increase in whey protein; a reduction in lactose concentration; changes in the concentration of minerals such as sodium, chloride, potassium, and calcium, and an increase in milk pH (Brandt et al., 2010).
12An increase in the somatic cell count (SCC) is the first indicator of inflammation. A high SCC found in the milk of healthy cows is essentially due to the presence of macrophages (66-88%), neutrophils (1-11%), epithelial cells and mononuclear cells (Pyörälä, 2003; Forsbäck et al., 2010). In the case of inflammation of the mammary gland, the proportion of neutrophils may increase by up to 90%. The SCC in milk has been commonly used as a mastitis indicator since the 1960s. In order to take into account SCC fluctuations in relation to a cow’s number of days in milk (DIM), different SCC thresholds have been proposed within a lactation. The proposed SCC threshold values for the Canadian Holstein population are: 500,000; 300,000; and 200,000 cells·ml-1 for the following DIM classes: 5 to 10, 11 to 30, and 31 to 305 DIM, respectively (Koeck et al., 2012). Bovine lactoferrin (LTF) is also moderately correlated with the SCC. Arnould et al. (2009b) estimated positive genetic and phenotypic correlations between LTF and the SCC (0.24 and 0.31, respectively; P < 0.0001). These values would seem to indicate that the LTF content in milk may increase proportionally to the SCC value. Bovine LTF is mainly present in milk and the protein shows important physiological and biological functions (such as antibacterial, antiviral, antifungal and antiparasitical characteristics). This multifunctional protein plays a key role in the health of the mammary gland. According to several authors (Seyfert et al., 1996; Wojdak-Maksymiec et al., 2006; Soyeurt et al., 2007; Arnould et al., 2009b), the LTF gene could be considered as a potential candidate gene for selection of mastitis resistance. Concentration of LTF in bovine milk increases significantly during mammary infections such as mastitis, and the degree of increase is related to the severity of the disease. The LTF concentration ranges from 0.1 g·l-1 (mature milk: 0.1 to 0.4 g·l-1) to 5 g·l-1 (colostrum: 1.5 to 5 g·l-1). Although LTF is present in low concentrations in the milk of healthy cows, LTF concentrations in milk may increase up to a level of 2.3 g·l-1 during clinical mastitis (Kutila et al., 2004; Soyeurt et al., 2007) (Table 1).
13A recent genetic study in Canadian Holsteins shows a genetic correlation of 0.69 between mastitis and the average somatic cell score (SCS) (Koeck et al., 2012). Other studies have estimated genetic correlations between mastitis and the SCC, ranging from 0.3 to 0.8, with an average of 0.6 (Heringstad et al., 2000). Thus, according to Koeck et al. (2012), even though mastitis and the SCS have a common genetic background, they may not be regarded as the same trait.
14Lactose values are also capable of displaying disorders in the secretory tissues. Indeed, udder infections cause the biosynthesis of lactose to decrease (Pyörälä, 2003; Rajcevic et al., 2003; Brandt et al., 2010; Forsbäck et al., 2010). In 2003, Rajcevic et al. obtained a correlation between SCC and lactose of -0.42. According to Pyörälä (2003), lactose may be a more reliable indicator of mammary gland disorders as compared to SCC. Lactose presents an interesting advantage as an indicator as its day-to-day variation is very low (0.9%) compared to the day-to-day variations in fat content (7.7%), milk yield (7.0%) and the SCC (2.0%) (Forsbäck et al., 2010). Thus, net observed decreases in lactose content are useful predictors of inflammation risk (Table 1).
15Mastitis also causes some changes in milk conductivity, due to damage in the mammary epithelium, thus altering the balance of specific minerals, such as potassium, sodium and chlorine ions. These minerals may thus be useful predictors for mastitis (van Hulzen et al., 2009; Brandt et al., 2010). Similar to the variation in lactose values, variations in the milk mineral concentration are obviously a response to udder inflammation, though these variations might, to some extent, also be related to other effects. By contrast, changes in milk fat and total protein content in milk are influenced by several other factors, including feed composition. Early detection of mastitis might be related to the correlation between different indicators, such as the SCC, lactose and protein.
2.3. Feeding and environmental management
16In the last few decades, numerous studies have dealt with the negative impact of dairy cattle on the environment. Nowadays, an ever increasing number of studies are focusing on environmental issues in agriculture, and more specifically, in animal production systems. In 2010, agriculture was believed to contribute about 10% to the total EU-25 emissions of greenhouse gases (GHG) (EUROSTAT, 2012; Schils et al., 2005) and about 6% to the total GHG emissions in the United States (EPA, 2013). Animals are considered to contribute about 36% to the total emission values (Weiske et al., 2006). Methane (CH4) and nitrous oxide (N2O) are considered to be the primary greenhouse gases emitted by agricultural activities (EPA, 2013). Among the various agricultural activities, most GHG production is, directly or indirectly, caused by animal production, particularly of ruminants. Indeed, the main sources of agriculture-related GHG emissions are enteric fermentation, rumination of cattle and sheep, handling of manure (CH4) and agricultural soil practices (N2O). Thus we can conclude that CH4 and N2O emissions are closely related to dairy production. Another important source of GHG is linked to the importation of feedstuffs, mostly protein-rich feeds (transport).
17Milk composition mainly depends on the quality of the feed, i.e. feed composition, energy and fiber content, etc. Milk urea content can be used as an indicator for dietary crude protein concentration (Kuterovac et al., 2005). In 2001, Godden et al. described the relationship between milk urea content and nutritional management, production, and economic variables in commercial dairy herds. There are three main sources of urea in milk: the final product of protein decomposition, the digestion of non-protein nitrogen (NPN), and the catabolism of amino acids in the mammary gland. Milk protein contains true-protein (95%) and NPN (5%). Milk urea contributes most to the NPN fraction (30-35% of the NPN: Bastin et al., 2009; Biswajit et al., 2011). According to Kuterovac et al. (2005) and Biswajit et al. (2011), average herd milk urea concentrations are positively related to the dietary crude protein and rumen (un)degradable protein. Biswajit et al. (2011) also showed that milk urea measurements determined by infrared test methodology provide a useful tool for monitoring the efficiency of nitrogen utilization in dairy cattle. Diets that are too rich in protein lead to higher feed costs, environmental pollution and fertility problems (Biswajit et al., 2011). On the other hand, a very low milk urea content could indicate protein deficiencies in the diet of dairy cattle, potentially leading to a loss of production. Target values for milk urea content used by farm advisors (Belgium, Walloon Region) are generally within a range between 200 and 400 mg·l-1 (Bastin et al., 2009). However, it still remains important to take into account certain characteristics of the cow, such as her stage of lactation, her parity number, etc. Consequently, monitoring milk urea content presents several economical and ecological benefits. Indeed, this tool could be useful in decreasing milk urea concentrations, in reducing the excretion of excess nitrogen into the environment, and consequently in lowering feed costs, while maintaining the cow’s level of milk yield (Kuterovac et al., 2005; Bastin et al., 2009; Biswajit et al., 2011).
18Boichard et al. (2012) looked at the relationship between feed management practices and the environmental footprint. In that study, feed costs were decreased through the use of alternative diet compositions, all while maintaining the herd’s milk yield at a constant level. This led to a decrease in the GHG emissions by the dairy cattle under study. This proves that the environmental concerns of consumers could be met by adapting herd management techniques, lowering the impact of dairy farming on GHG emission values and, indirectly, improving the economical sustainability of dairy production systems. In addition, despite the fact that GHG emissions currently have no direct value on the market, decreasing the agricultural environmental footprint becomes a major challenge for the future (Boichard et al., 2012) (e.g. increased importance of environmental policies, introduction of “emissions taxes” to be paid by farmers [Moraes et al., 2012]).
19Unfortunately, only a few studies have analyzed the relationship between milk composition and GHG production levels. Recent studies have shown that FA profiles may be used as indicators for the “environmental quality of milk” (e.g. Chilliard et al., 2009; Dijkstra et al., 2011). Fatty acid profiles thus represent a valuable tool for reducing methane emissions. The incentive for reducing methane emissions is two-fold. Firstly, a reduction in methane emissions leads to a decrease in the impact of GHG on the environment. Secondly, since methane production corresponds to a loss of productive energy by the dairy cow (Chilliard et al., 2009), there is great interest in providing indicators that will allow for a decrease in methane emission values. Various milk FAs show a moderate relationship with methane production in dairy cattle. According to the study of Chilliard et al. (2009), which was based on eight lactating multiparous Holstein cows, saturated FAs (SFAs) showed the highest positive correlation value with methane output (r = 0.87 to 0.91). Extremely high correlations were obtained for 8:0 to 16:0 (r = 0.94) and for the sum of C18-FA (r = -0.94). The relationship between milk FAs and methane output is easy to explain. As stated previously, milk FAs are derived from four major pathways: diet, the mammary gland, bacterial synthesis and body fat mobilization (Chilliard et al., 2009; Stoop et al., 2009). On the one hand, synthesis both of FAs and of methane, acetate, and butyrate presents a common biochemical pathway. On the other hand, dietary FAs, especially SCFAs, MCFAs, LCFAs, and poly-unsaturated FAs (PUFAs), present a negative impact on protozoa, cellulolytic bacteria, or archaea methanogene populations, and consequently, on methane production (Chilliard et al., 2009). In addition, in the FAs studies carried out by Chilliard et al. (2009), most FAs presented an interesting correlation with methane production levels (trans-16 18:1; cis-9, trans-13 18:2; trans-12 18:1; trans-13+14 18:1; trans-6+7+8 18:1; cis-15 18:1; and trans-11, cis-15 18:2). These FAs are known as biohydrogenation intermediates, and are indirectly linked to the dietary 18:3 content. This explains why diets showing high concentrations of PUFAs tend to decrease methane production.
2.4. Using milk components as multiple (health and environmental) indicators in dairy cattle management
20The main objective for using various milk components as management tools for promoting the sustainability of dairy production systems (health, feeding and environmental aspects) is to obtain valuable indicators for diseases and unbalanced diets, which might be helpful for preventing metabolic problems at an early stage. Table 1 shows normal concentrations of several milk components, such as their range of changes according to different diseases or metabolic disorders. However, the evidence from the authors cited shows that expression levels of disease can vary from one study to another. Some authors prefer to present normal levels and threshold values for disease, while others display these values as a ratio (pathological value divided by physiological value).
21As indicated previously, some milk components may present different day-to-day variations (e.g. lactose vs fat content) (Forsbäck et al., 2010). Fortunately, for the majority of metabolic disorders, at least two parameters may vary, thus allowing the setting up of a pre-diagnostic test. In practice, normal physiological variances would need to be determined for each parameter used (Hamann et al., 1997).
22In order to improve the interpretation of milk composition patterns, a reference system needs to be set up for easy interpretation of available data. Indeed, values presented in this review may only be valid for that given dairy cow population or herd and may not be used as reference values for different dairy herds or cow populations. Threshold values for disease must be used with caution. It is important to study each dairy cow population separately and to adapt the threshold values accordingly. Values given in this review would still need to be adapted and validated in the field. In addition, due to variations between individual cows, this kind of strategy needs to be applied on a herd level, not on the basis of individual cows. Finally, the measurement of milk composition is meant as both a monitoring and a prevention tool. In other words, this tool can never replace close monitoring of a herd by the farmer and appropriate veterinary care, but may be used as an efficient alert system for preventing health disorders in cows.
3. Conclusion
23Milk yield, milk and milk fat composition may be used for developing strategies for the prevention and monitoring of production dysfunctions in dairy cattle and for the improvement of the sustainability of dairy production systems. The threshold values for disease in cattle presented in this review were obtained from the current literature. These values are examples and should be used with caution. Nevertheless, the present review suggests that milk and milk fat composition may be used both as a sustainability management tool and as a monitoring and prevention tool for several pathologies and health disorders in dairy cattle. The FA profile of milk may also be used to predict methane production in dairy cattle; however, more data reflecting a wide range of diets will be required to confirm the usefulness of the prediction model. In addition, due to the use of MIR technology, these tools may be easily implemented in practice and are relatively cheap. Milk labs or milk recording agencies would be able to alert farmers whenever threshold values for disease were reached, representing a valuable tool for health and environmental management. Using such prevention tools could thus help to improve the sustainability of dairy farmers. Indeed, in addition to avoiding losses arising from clinical diseases (milk yield losses, veterinary costs, etc.), and unbalanced diets, the prevention of production dysfunctions would also improve the reproductive performance of dairy herds, their udder health, animal welfare aspects (consumer concerns), labor input (medical treatment of cows), environmental aspects (decrease in the use of drugs and decrease in GHG emissions), etc. In this way, the introduction of prevention tools would contribute to improvements in dairy production from an economical, ecological and animal welfare point of view.
24Acknowledgements
25The present project is supported by the National Research Fund, Luxembourg (AFR PHD-09-119-RE). Nicolas Gengler (Honorary Senior Research Associate) and Hélène Soyeurt (Post-Doctoral Researcher) acknowledge their support by the FNRS (National Fund for Scientific Research, Brussels, Belgium). Additional support of the FNRS was provided by grants F.4552.05, 2.4507.02 F (2), 2.4623.08, and B127.11.
Bibliographie
Arnould V. M.-R. & Soyeurt H., 2009a. Genetic variability of milk fatty acids. J. Appl. Genet., 50(1), 29-39.
Arnould V. M.-R. et al., 2009b. Genetic analysis of lactoferrin content in bovine milk. J. Dairy Sci., 92, 2151-2158.
Bastin C. et al., 2009. Modeling milk urea of Walloon dairy cows in management perspectives. J. Dairy Sci., 92, 3529-3540.
Bannerman D.D., Paape M.J., Hare W.R. & Sohn E.J., 2003. Increased levels of LPS-binding protein in bovine blood and milk following bacterial lipopolysaccharide challenge. J. Dairy Sci., 86, 3128-3137.
Beaulieu A.D. & Palmquist D.L., 1995. Differential effects of high fat diets on fatty acid composition in milk of Jersey and Holstein cows. J. Dairy Sci., 78, 1336-1344.
Biswajit R. et al., 2011. Evaluation of milk urea concentration as useful indicator for dairy herd management: a review. Asian J. Anim. Vet. Adv., 6(1), 1-19.
Boichard D. & Brochard M., 2012. New phenotypes for new breeding goals in dairy cattle. Animal, 6(4), 544-550.
Brandt M., Haeussermann A. & Hartung E., 2010. Invited review: technical solutions for analysis of milk constituents and abnormal milk. J. Dairy Sci., 93(2), 427-436.
Chilliard Y., Ferlay A., Mansbridge R.M. & Doreau M., 2000. Ruminant milk fat plasticity: nutritional control of saturated, polyunsaturated, trans and conjugated fatty acids. INRA Ann. Zootechnie, 49, 181-205.
Chilliard Y., Ferlay A. & Doreau M., 2001. Effect of different types of forages, animal fat or marine oils in cow’s diet on milk fat secretion and composition, especially conjugated linoleic (CLA) and polyunsaturated fatty acids. Livest. Prod. Sci., 70, 31-48.
Chilliard Y., Martin C., Rouel J. & Doreau M., 2009. Milk fatty acids in dairy cows fed whole crude linseed, extruded linseed, or linseed oil, and their relationship with methane output. J. Dairy Sci., 92, 5199-5211.
Dijkstra J. et al., 2011. Relationships between methane production and milk fatty acid profiles in dairy cattle. Anim. Feed Sci. Technol., 166, 590-595.
Enjalbert F., Nicot M.C., Bayourthe C. & Moncoulon R., 2001. Ketone bodies in milk and blood of dairy cows: relationship between concentrations and utilization for detection. J. Dairy Sci., 84, 583-589.
EPA, 2013. Inventory of U.S. greenhouse gas emissions and sinks: 1990–2011. EPA 430-R-08–005. Washington, DC, USA: U.S. Environmental Protection Agency, http://www.epa.gov/climatechange/Downloads/ghgemissions/US-GHG-Inventory-2013-Main-Text.pdf, (24/09/2013).
EUROSTAT, 2012. Climate change statistics. European Communities.
Fleischer P. et al., 2001. The relationship between milk yield and the incidence of some diseases in dairy cows. J. Dairy Sci., 84, 2025-2035.
Forsbäck L. et al., 2010. Day-to-day variation in milk yield and milk composition at the udder-quarter level. J. Dairy Sci., 93(8), 3569-3577.
Godden S.M. et al., 2001. Relationship between milk urea concentrations and nutritional management, production, and economic variables in Ontario dairy herds. J. Dairy Sci., 84, 1128-1139.
Gross J., van Dorland H.A., Bruckmaier R.M. & Schwarz F.J., 2011. Milk fatty acids profile related to energy balance in dairy cows. J. Dairy Res., 78, 479-488.
Grummer R.R., 1991. Effect of feed on the composition of milk fat. J. Dairy Sci., 74, 3244-3257.
Hamann J. & Krömker V., 1997. Potential of specific milk composition variables for cow health management. Livest. Prod. Sci., 48, 201-208.
Heringstad B., Klemetsdal G. & Ruane J., 2000. Selection for mastitis resistance in dairy cattle: a review with focus on the situation in the Nordic countries. Livest. Prod. Sci., 64, 95-106.
Heuer C., Schukken Y.H. & Dobbelaar P., 1999. Postpartum body condition score and results from the first test day milk as predictors of disease, fertility, yield, and culling in commercial herds. J. Dairy Sci., 82, 295-304.
Koeck A., Miglior F., Kelton D.F. & Schenkel S., 2012. Alternative somatic cell count to improve mastitis resistance in Canadian Holstein. J. Dairy Sci., 95, 432-439.
Komine Y. et al., 2006. A new diagnostic indicator using concanavalin A low-affinity lactoferrin levels in mammary gland secretion in mastitic drying cows. J. Vet. Med. Sci., 68(1), 59-63.
Kuterovac K. et al., 2005. Evaluation of nutritional status of dairy cows based on milk results. Ital. J. Anim. Sci., 4(3), 33-35.
Kutila T. et al., 2004. The efficacy of bovine lactoferrin in the treatment of cows with experimentally induced Escherichia coli mastitis. J. Vet. Pharmacol. Ther., 27, 197-202.
Moraes L.E., Wilen J.E., Robinson P.H. & Fadel J.G., 2012. A linear programming model to optimize diets in environmental policy scenarios. J. Dairy Sci., 95(3), 1267-1282.
Mulligan F.J., O’Grady L., Rice D.A. & Doherty M.L., 2006. A herd health approach to dairy cow nutrition and production diseases of the transition cow. Anim. Reprod. Sci., 96, 331-353.
Palmquist D.L., Beaulieu A.D. & Barbano D.M., 1993. Feed and animal factors influencing milk fat composition. J. Dairy Sci., 76, 1753-1771.
Pyörälä S., 2003. Indicators of inflammation in the diagnosis of mastitis. Vet. Res., 34, 565-578.
Rajcevic M., Potocnik K. & Levstek J., 2003. Correlations between somatic cells count and milk composition with regard to the season. Agric. Conspectus Sci., 68(3), 221-226.
Rutten M.J.M. et al., 2009. Predicting bovine milk fat composition using infrared spectroscopy based on milk samples collected in winter and summer. J. Dairy Sci., 92, 6202-6209.
Schils R.L.M., Verhagen A., Aarts H.F.M. & Sebek L.B.J., 2005. A farm level approach to define successful mitigation strategies for GHG emissions from ruminant livestock systems. Nutr. Cycling Agroecosyst., 71, 163-175.
Seyfert H.-M. et al., 1996. Defining candidate genes for mastitis resistance in cattle: the role of lactoferrin and lysozyme. J. Anim. Breed. Genet., 113, 269-276.
Soyeurt H. et al., 2006. Estimating fatty acid content in cow milk using mid-infrared spectrometry. J. Dairy Sci., 89, 3690-3695.
Soyeurt H. et al., 2007. Genetic variability of lactoferrin content estimated by mid-infrared spectrometry in bovine milk. J. Dairy Sci., 90(9), 4443-4450.
Soyeurt H. et al., 2008a. Variation of delta9-desaturase activity in dairy cattle. J. Dairy Sci., 91, 3211-3224.
Soyeurt H. et al., 2008b. Genetic parameters of saturated and monounsaturated fatty acid content and the ratio of saturated to unsaturated fatty acids in bovine milk. J. Dairy Sci., 91, 3611-3626.
Soyeurt H. et al., 2011. Feasibility of a Walloon genetic evaluation for milk fat composition. J. Dairy Sci., 93(E-suppl. 1), 744.
Stoop W.M., Bovenhuis H., Heck J.M.L. & van Arendonk J.A.M., 2009. Effect of lactation stage and energy status on milk fat composition of Holstein-Friesian cows. J. Dairy Sci., 92, 1469-1478.
Toni F. et al., 2011. Early lactation ratio of fat and protein percentage in milk is associated with health, milk production, and survival. J. Dairy Sci., 94, 1772-1783.
Van Der Drift S.G.A. et al., 2012. Routine detection of hyperketonemia in dairy cows using Fourier transform infrared spectrometry analysis of ß-hydroxybutyrate and acetone in milk in combination with test-day information. J. Dairy Sci., 95, 4886-4898.
Van Haelst Y.N.T., Beeckman A., Van Knegsel A.T.M. & Fievez V., 2008. Short communication: elevated concentrations of oleic acid and long-chain fatty acids in milk fat of multiparous subclinical ketotic cows. J. Dairy Sci., 91, 4683-4686.
Van Hulzen K.J.E., Sprong R.C., van der Meer R. & van Arendonk J.A.M., 2009. Genetic and nongenetic variation in concentration of selenium, calcium, potassium, zinc, magnesium, and phosphorus in milk of Dutch Holstein-Friesian cows. J. Dairy Sci., 92(11), 5754-5759.
Weiske A. et al., 2006. Mitigation of greenhouse gas emissions in European conventional and organic dairy farming. Agric. Ecosyst. Environ., 112, 221-232.
Wojdak-Maksymiec K., Kmiec M. & Ziemak J., 2006. Associations between bovine lactoferrin gene polymorphism and somatic cell count in milk. Vet. Med., 51, 14-20.
To cite this article
About: Valérie M.-R. Arnould
CONVIS s.c. Zone Artisanale et Commerciale, 4. L-9085 Ettelbruck (Luxembourg). E-mail: valerie.arnould@convis.lu – Univ. Liege - Gembloux Agro Bio-Tech. Animal Science Unit. Passage des Déportés, 2. B-5030 Gembloux (Belgium).
About: Romain Reding
CONVIS s.c. Zone Artisanale et Commerciale, 4. L-9085 Ettelbruck (Luxembourg).
About: Jeanne Bormann
Administration des Services Techniques de l’Agriculture (ASTA). L-1470 Luxembourg (Luxembourg).
About: Nicolas Gengler
Univ. Liege - Gembloux Agro Bio-Tech. Animal Science Unit. Passage des Déportés, 2. B-5030 Gembloux (Belgium).
About: Hélène Soyeurt
Univ. Liege - Gembloux Agro Bio-Tech. Animal Science Unit. Passage des Déportés, 2. B-5030 Gembloux (Belgium) – National Fund for Scientific Research (F.N.R.S.). Rue d’Egmont, 5. B-1000 Brussels (Belgium).
