


- Portada
- Volume 18 (2014)
- Numéro 3
- Discrimination of different processed animal proteins (PAPs) by FT-IR spectroscopy based on their fat characteristics


Vista(s): 2968 (34 ULiège)
Descargar(s): 184 (2 ULiège)

Discrimination of different processed animal proteins (PAPs) by FT-IR spectroscopy based on their fat characteristics

Notes de la rédaction
Received on September 3, 2013; accepted on May 30, 2014
Résumé
Discrimination des différentes protéines animales transformées (PAT) par spectroscopie FT-IR en fonction des caractéristiques de leur graisse. Cette étude a été entreprise pour explorer le potentiel de la technique FT-IR pour la discrimination des différentes espèces de protéines animales transformées (PAT) en fonction des caractéristiques de leur graisse. Un total de 47 échantillons d’origine fiable de PAT contenant de la farine de poisson, de la farine de viande et d’os (FVO) porcine, bovine, ovine et de volaille ont fait partie de la présente d’étude. Les résultats ont montré que les spectres FT-IR rendent bien compte de l’insaturation des acides gras pour les différentes espèces de PAT, en particulier au niveau des bandes de 3 006 cm-1 et 722 cm-1. Les résultats ont mis en évidence que la technique FT-IR est en mesure de différencier la graisse provenant de la farine de poisson, des FVO de ruminants ou de FVO de non-ruminants terrestres. La farine de poisson et les échantillons de FVO ruminants pouvaient être discriminés efficacement à la fois par la sensibilité et la spécificité qui étaient respectivement de 1,00 et 1,00. Pour les échantillons de FVO non-ruminants, la sensibilité et la spécificité étaient respectivement de 1,00 et 0,96. Toutefois, il était difficile de distinguer la FVO bovine de l’ovine et la FVO porcine de celle de volaille. Le résultat présente la méthode d’analyse FT-IR comme une étude préliminaire possible pour l’exploitation d’un moyen rapide et fiable pour l’identification de l’origine animale des PAT utilisées dans les aliments pour animaux.
Abstract
This study was undertaken to explore the potential of FT-IR technique for discriminating different species of processed animal proteins (PAPs) based on their fat characteristics. A total of 47 source-reliable PAPs samples containing fish meal, porcine, bovine, ovine and poultry meat and bone meal (MBM) were involved in the present study. The results obtained showed that the FT-IR differentiated quite well between the fat derived from different species of PAPs, especially at the bands of 3,006 cm-1 and 722 cm-1. Results provided evidence that FT-IR differentiated the fat derived from fish meal, terrestrial non-ruminant and ruminant MBM quite well. Fish meal and ruminant MBM samples could be discriminated effectively by both the sensitivity and specificity values which were 1.00 and 1.00, respectively. For non-ruminant MBM samples, the sensitivity and specificity were 1.00 and 0.96, respectively. However, it was hard to distinguish bovine MBM from ovine ones as well as porcine MBM from poultry ones. The result makes it possible to allow FT-IR analytical methodology as a preliminary study for the exploitation of a rapid and reliable way for the identification of the animal origin of PAPs used in feeding stuffs.
Tabla de contenidos
1. Introduction
1Banned processed animal proteins (PAPs) could be detected by various methods while light microscopy was the only official method before 2013 (Gizzi et al., 2004; Fumiere et al., 2009). However, it is hard to discriminate between species of terrestrial meat and bone meal (MBM) by light microscopy. Since 2013 polymerase chain reaction (PCR) is also an official method in Europe, and PCR has been introduced in order to perform species specific detection. Fat is one of the major components in PAPs, and the authenticity of fat is a very important quality criterion for PAPs. Studies on oil and fats (Safar et al., 1994; Baeten et al., 2000; Baeten et al., 2005; Yang et al., 2005) have shown that there are differences in fatty acid characteristics between different sources. This suggests that fat is a potential parameter for discriminating different species of lipid samples. However, determination of fat characteristics is traditionally a laborious and time-consuming process, typically using chromatographic methods.
2Combined with chemometric methods, Fourier transform mid-infrared (FT-IR) spectroscopy technique, as vibrational spectroscopy, is an efficient analytical technique to check on the authenticity of fats, due to its simplicity, rapidity, and ease of sample preparation. Existing literature indicates that FT-IR technique has been used for discriminant analysis of animal fat or feeding fats (Ozen et al., 2003; Bellorini et al., 2005; Gasperini et al., 2007). However, the discriminant analysis for a variety of PAPs samples, based on the specificity of their fats ingredients using FT-IR technique, was not reported. The objective of this study is to explore the potential for discriminating between species PAPs using FT-IR spectroscopic method based on their fat characteristics. In the present study, collected data of FT-IR spectra were treated by principal component analysis (PCA) in order to visualize the grouping of samples and partial least squares-discriminant analysis (PLS-DA) algorithm was used to evaluate the discrimination of the different PAPs.
2. Materials and methods
2.1. PAPs samples collection and preparation and fat extraction
3A total of 47 PAPs samples including 12 fish meal (FM) and 35 MBM samples (9 of poultry, 11 of porcine, 7 of bovine and 8 of ovine) were involved in this study. Among the 35 MBM samples, poultry and porcine MBM samples were obtained from industrial producers in eight provinces of China,bovine and ovine MBM samples were self made according to the method of Ockerman (Ockerman et al, 2000). Twelve FM samples were collected from National Feed Quality Control Center of China. In addition, 12 pure animal fat samples (3 of chicken fat, 3 of lard, 3 of beef tallow and 3 of mutton tallow) were collected from Chinese markets for composition analysis. All the PAPs samples were observed by classical microscopy according to Regulation (EC) 152/2009 for purity confirmation. The test samples were milled to pass a 1 mm screen, mixed at 12 rpm for 10 h using the REAX 20 (Heidolph, Germany) and fat specimens were then extracted using the SoxtecTM 2050 auto fat extraction system (FOSS, Denmark). Drying the fat specimens at 103 °C for 30 min in a convection oven after extraction is needed in order to make sure that there are no residues of solvents in the extracted fat. The relative standard deviation (RSD) of fat extraction step is 4.7%.
2.2. Fat characteristics analysis
4In the present study, 37 kinds of fatty acids were analyzed by the gas chromatography (GC) method. The analysis was carried out on a GC-2014C (Shimadzu, Japan) equipped with a flame ionization detector (FID). The sample was injected with a split/splitless injector at 225 ℃ and analyzed using helium as carrier gas, 1 µL injection volume, with an oven program of 100 ℃, heating 4 ℃·min-1 to 240 ℃ (35 min). The fatty acid analyses were done in duplicate, and expressed as the normalized percentage of each fatty acid in the total content of 37 kinds of fatty acids. The RSD of chromatographic step is 3.2%.
5Fatty acid methyl ester standards were purchased from Sigma-Aldrich Chemicals (Deisenhofen, Germany).
2.3. FT-IR analysis
6A Fourier transform instrument from Co. PerkinElmer (Spectrum400 FT-IR/FT-NIR, Seattle, USA) was used in the present study. For the FT-IR measurements, spectra were acquired using a deuterated triglycerine sulphate (DTGS) detector and an attenuated total reflectance mode (ATR) sample presentation instrument. The ATR was carefully cleaned with pure chloroform to eliminate the presence of fat residues between measurements and to ensure a clean crystal surface, so as to obtain the best possible sample spectra. The FT-IR spectra were collected from 4,000 to 400 cm-1 with a resolution of 4 cm-1 and a total of 32 co-added scans. Before each scan, a new reference air background spectrum was taken. Scanning was performed three times per sample. The average of the 3 spectra was recorded as log 1/R. The RSD of the FT-IR analysis is 4.1%.
2.4. Statistical analysis and multivariate evaluation
7Between-group concentration of each fatty acid (FA) was statistically compared using a one-way ANOVA by the SPSS 17.0 program (SPSS Inc., Chicago, IL, USA). Differences were considered statistically significant at p-values ≤ 0.05. PCA application and PLS-DA computations with internal cross-validation were performed by the Matlab version R2010b (The Mathworks, Inc., Natick, MA, USA). Values of sensitivity (percentage of target samples correctly classified), specificity (percentage of non-target samples correctly classified) and classification error (the average value of the mis-classified samples) were used to evaluate the performance of the discriminant models built.
3. Results and discussion
3.1. FT-IR spectral characteristics
8Figure 1 shows the FT-IR spectra of fats from bovine, ovine, poultry and porcine MBM and FM samples, and table 1 shows the GC results of fatty acid constitution. The fatty acid composition detected in this study correlates well with the experimental results reported before (Wood et al., 2003; Chin et al., 2009).
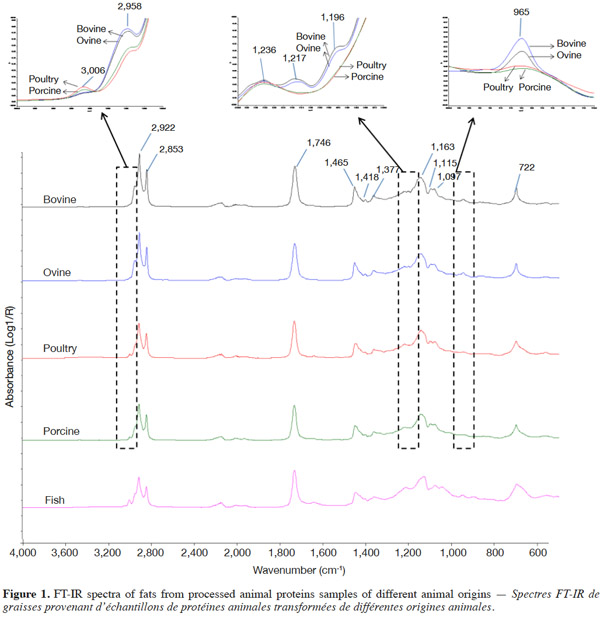
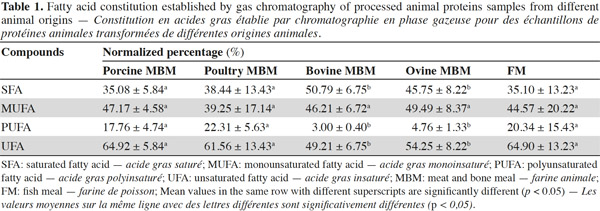
9It was suggested that distinguishing fish from the other species samples proved to be much easier. The bands at 3,006 cm-1 (located in the functional group region) and 722 cm-1 (located in the fingerprint region) are the most important when discriminating fish samples from the other tested species. As shown in figure 1, there was a higher band at 3,006 cm-1 and a larger area of band at 722 cm-1 in fish samples compared with the other tested species. As cited in table 2, a band at 3,006 cm-1 meanly represents the stretching of =C–H (cis-), and a band at 722 cm-1 meanly represents the rocking bending of -HC=CH- (cis-). These two bands characterize the vibrations of cis-unsaturated structures. This is a good match with the GC results of fatty acid constitution of different species of PAPs samples. The C18:1n9c contents of FM, porcine, poultry, bovine and ovine MBM were 4.66%, 3.10%, 1.28%, 0.30% and 0.70%, respectively, which showed that the C18:1n9c content of FM was statistically higher (p < 0.05) than the other tested species of samples.
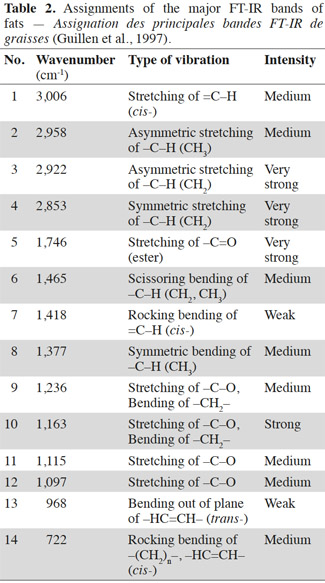
10It was hard to distinguish bovine samples from ovine ones by the spectra from observations which may be explained by a great similarity in their composition and porcine samples are similar to the poultry ones for the same reason. The GC results in table 1 indicate there were no significant differences (p > 0.05) between porcine and poultry samples in fatty acid constitution, similarly with the bovine and ovine samples. However, the spectra of ruminant (bovine and ovine) samples were obviously different from the spectra of terrestrial non-ruminant (porcine and poultry) samples. A band at 3,006 cm-1 (stretching of =C–H [cis-]) was distinctly observed in the spectra of porcine and poultry samples, while the band in the same location was weaker in spectra of bovine and ovine samples. The spectra of bovine and ovine samples have much higher bands at 2,958 cm-1 (asymmetric stretching of C–H) than the porcine and poultry ones. This can be explained by the difference of fatty acid constitution. The content of unsaturated fatty acid (UFA) in porcine and poultry samples was significantly (p < 0.05) higher than bovine and ovine samples, which possessed distinctly greater (p < 0.05) content of saturated fatty acid (SFA). In the fingerprint region, three bands at 1,217 cm-1, 1,196 cm-1 and 965 cm-1 were observed in the spectra of bovine and ovine samples, while the same bands were not observed in spectra of porcine and poultry samples. It is known that fat differs in composition, length and unsaturated degree of fatty acids as well as the position of the C=C bond in the chain. FT-IR spectra could well represent a fingerprint pattern unique to each fat and discrimination could then be conducted using regions specific to the C=C bond vibration and the intensities. Areas or heights of its band in this region might indicate the degree of unsaturation in fatty acids.
3.2. Discrimination based on FT-IR spectral characteristics
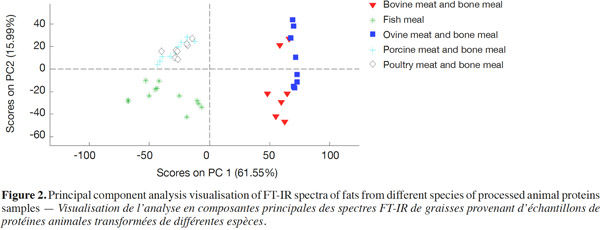
11Figure 2 displays the PCA visualization of FT-IR spectra of fats from different species of PAPs samples. The two PCs explain 61.55 and 15.99% of the total variance respectively. Result of PCA analysis illustrated fish, terrestrial non-ruminant and ruminant samples from three separate clusters, allowing us to identify their respective origins. This is in good match with the analysis of spectral characteristics.
12PLS-DA algorithm was then performed to evaluate the discrimination of different species of PAPs samples. Results of sensitivity, specificity and classification error are presented in the table 3.
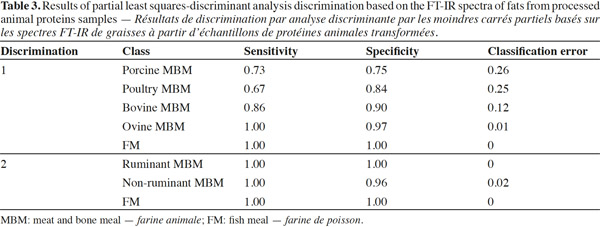
13Results showed that FT-IR could differentiate the fat derived from FM, terrestrial non-ruminant and ruminant MBM. Fish and ruminant MBM samples could be discriminated effectively while both the sensitivity and specificity values were 1.00. For non-ruminant samples, the sensitivity and the specificity were 1.00 and 0.96, respectively. The results show a clear separation of these three species of PAPs samples and the classification errors show a good discrimination of these groups. Existing literature indicates that FT-IR technique has been used for discriminant analysis of animal fat or feeding fats. It has been reported that it was possible to classify the species of pure fats originated (tallow, lard, chicken fat) by the IR ATR infrared technique (Bellorini et al., 2005).
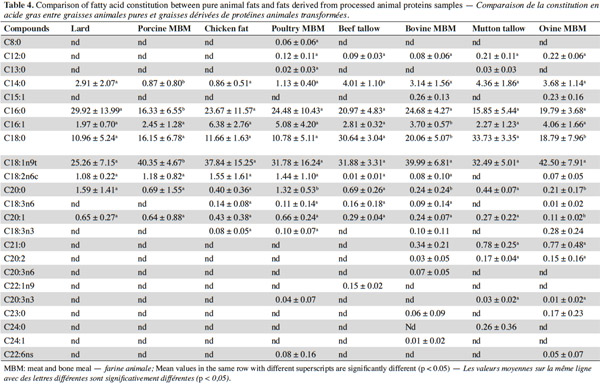
14Comparison was then carried out between pure animal fats and fats derived from PAPs, and the results revealed that some individual FA contents were statistically varied (p < 0.05) between them (Table 4). Results show there was significant difference for fatty acid composition of C14:0, C16:0 and C18:1n9t between lard and fats derived from porcine MBM samples (p < 0.05). A significant difference was found for fatty acid of C20:0 between chicken fat and fats derived from poultry MBM samples (p < 0.05), while C8:0, C12:0, C13:0, C20:3n3 and C22:6ns were not detected in chicken fat samples but found in poultry MBM. For beef tallow and bovine MBM samples, there was significant difference for fatty acid composition of C16:1, C18:0 and C20:0 (p < 0.05). The fatty acid composition of C15:1, C18:3n3, C21:0, C20:2, C20:3n6, C23:0, C24:1 detected in bovine MBM was not found in beef tallow samples in this study, while C22:1n9 detected in beef tallow was not found for bovine MBM samples. There were significant differences between mutton tallow and ovine MBM samples for fatty acid composition of C18:0, C20:0 and C20:1 (p < 0.05). The fatty acid composition of C15:1, C18:2n6c, C18:3n6, C18:3n3, C22:6ns and C23:0 detected in ovine MBM were not found in mutton tallow samples, while C13:0 and C24:0 was detected in mutton tallow but not in ovine MBM samples. This implies that the discrimination of different species of pure animal fats should be different with the discrimination of different species of PAPs, based on their extracted fat samples.
3.3. Discrimination based on concentration of fatty acids
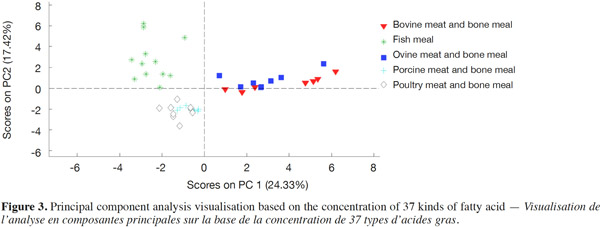
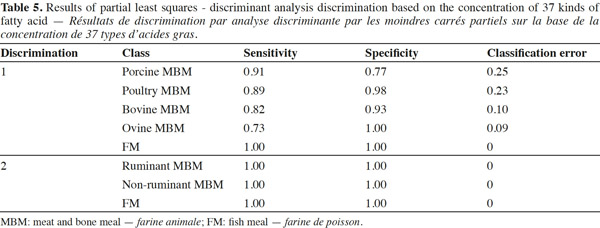
15Figure 3 displays the PCA visualization for tested samples based on the concentration of 37 kinds of fatty acid. Table 5 shows the PLS-DA discrimination results of different species of PAPs based on the concentration of 37 kinds of fatty acid. Three separate clusters could be observed for FM, ruminant (bovine and ovine), non-ruminant (porcine and poultry) MBM, while there was overlap between bovine and ovine, porcine and poultry MBM samples. PLS-DA results indicated that it was only possible to distinguish FM samples in the mixed data set with high sensitivity, specificity values of 1.00. Further analysis showed that the FM, ruminant and terrestrial non-ruminant MBM samples could well be classified according to the function of three separate groups of PLS-DA analysis. The sensitivity and specificity of discrimination for ruminant and terrestrial non-ruminant MBM samples were all 1.00. The GC results are in accordance with the PCA performed on the spectroscopic data and indicate that the discrimination observed with spectroscopic data is linked to the fatty acid profile of the samples.
4. Conclusion
16In this study, the ability of FT-IR spectroscopy for the discrimination of different PAPs with a focus of fat samples was investigated. The FT-IR spectra well represent the unsaturation of fatty acid constitutions for different species of PAPs. Application of PCA and PLS-DA has allowed for good classification of fats derived from FM, terrestrial non-ruminant and ruminant MBM, and the results show great potential of FT-IR to discriminate different species of PAPs. The result makes it possible to use this analytical methodology as a preliminary study for the exploitation of a rapid and reliable way to discriminate PAPs used in feeding stuffs. It will greatly complement the present standard method-light microscopy method. In further studies, mixtures of PAPs are needed to discriminate and then assess the ability of the technique used to facilitate feed authenticity studies.
17List of abbreviations
18ATR: attenuated total reflectance mode
19DTGS: deuterated triglycerine sulphate
20FA: fatty acid
21FID: flame ionization detector
22FM: fish meal
23FT-IR: Fourier transform mid-infrared
24GC: gas chromatography
25MBM: meat and bone meal
26MUFA: monounsaturated fatty acid
27PAPs: processed animal proteins
28PCR: polymerase chain reaction
29PLS-DA: partial least squares-discriminant
30PUFA: polyunsaturated fatty acid
31RSD: relative standard deviation
32SFA: saturated fatty acid
33UFA: unsaturated fatty acid
34Acknowledgements
35This work represents a part of the activity carried out within the Natural Science Foundation of China (Grant No. 31201827) and European Union Seventh Framework Programme (Grant No. KBBE-2010-2-4-03).
Bibliographie
Baeten V. & Aparicio R., 2000. Edible oils and fats authentication by Fourier transform Raman spectroscopy. Biotechnol. Agron. Soc. Environ., 4(4), 196-203.
Baeten V. et al., 2005. Detection of the presence of hazelnut oil in olive oil by FT-Raman and FT-MIR spectroscopy. J. Agric. Food Chem., 53(16), 6201-6206.
Bellorini S. et al., 2005. Discriminating animal fats and their origins: assessing the potentials of Fourier transform infrared spectroscopy, gas chromatography, immunoassay and polymerase chain reaction techniques. Anal. Bioanal. Chem., 382(4), 1073-1083.
Chin S.T., Che Man Y.B., Tan C.P. & Hashim D.M., 2009. Rapid profiling of animal-derived fatty acids using fast GC × GC coupled to Time-of-Flight mass spectrometry. J. Am. Oil. Chem. Soc., 86, 949-958.
Fumiere O. et al., 2009. Methods of detection, species identification and quantification of processed animal proteins in feeding stuffs. Biotechnol. Agron. Soc. Environ., 13, 59-70.
Gasperini G., Fusari E., Bella L.D. & Bondioli P., 2007. Classification of feeding fats by FT-IR spectroscopy. Eur. J. Lipid Sci. Technol., 109(7), 673-681.
Gizzi G.E. et al., 2004. Determination of processed animal proteins, including meat and bone meal, in animal feed. J. AOAC Int., 87(6), 1334-1341.
Guillen M.D. & Cabo N., 1997. Infrared spectroscopy in the study of edible oils and fats. J. Sci. Food Agric., 75(1), 1-11.
Ockerman H.W. & Hansen C.L., 2000. Animal by-product processing and utilization. 1st ed. Lancaster, PA, USA: Technomic Publications.
Ozen B.F., Weiss I. & Mauer L.J., 2003. Dietary supplement oil classification and detection of adulteration using Fourier transform infrared spectroscopy. J. Agric. Food Chem., 57, 5871-5876.
Safar M. et al., 1994. Characterization of edible oils, butters and margarines by Fourier-transform infrared-spectroscopy with attenuated total reflectance. J. Am. Oil Chem. Soc., 71(4), 371-377.
Wood J.D. et al., 2003. Effects of fatty acids on meat quality: a review. Meat Sci., 66, 21-23.
Yang H., Irudayaraj J. & Paradkar M.M., 2005. Discriminant analysis of edible oils and fats by FTIR, FT-NIR and FT-Raman spectroscopy. Food Chem., 93(1), 25-32.
