
Use of camera traps for wildlife studies. A review
Received on March 13, 2013; accepted on February 11, 2014
Résumé
Utilisation des pièges photographiques pour l’étude de la faune sauvage (synthèse bibliographique). Alors que les pressions anthropiques continuent de dégrader les habitats naturels, le besoin de suivre régulièrement les tendances des populations de grands vertébrés augmente. Les efforts de conservation doivent être de plus en plus ciblés mais les travaux de terrains nécessaires à la récolte de données sont souvent limités par le temps et le nombre de personnes disponibles. Les pièges photographiques apparaissent ainsi comme une méthode efficace pour assurer un échantillonnage continu et dans des zones difficilement accessibles. Nous illustrons ici la manière dont cet outil est utilisé pour une diversité de thèmes d’études de terrain tels que le comportement animal, le suivi de populations et les interactions faune-flore. En analysant les aspects techniques et matériels permettant d’assurer différents types de travaux d’écologie animale, nous mettons en évidence la nécessité de sélectionner du matériel et de mettre en place un protocole d’échantillonnage adapté à l’espèce et aux objectifs fixés de l’étude.
Abstract
As human threats continue to impact natural habitats, there is an increasing need to regularly monitor the trends in large vertebrate populations. Conservation efforts must be directed appropriately, but field work necessary for data collection is often limited by time and availability of people. Camera traps are used as an efficient method to insure continuous sampling and to work in difficult to access areas. In the present study, we illustrate how this instrument is serving a diverse field of studies, such as animal behavior, population monitoring and fauna-flora interaction. By looking at the material and technical aspects of various models of camera trap for implementation in different field studies in animal ecology, we highlight the need to choose appropriate camera trap models for the target species and to set up solid sampling protocols to successfully achieve study objectives.
1. Introduction
1The observed rapid decline in biodiversity, particularly among large vertebrates, throughout the world and the degradation of natural habitats hosting their populations are nowadays widely accepted as fact. It has therefore never been so important to understand how animal populations respond to modern threats and to document the functioning of ecosystems and intra-community interactions (Barrows et al., 2005) as to be able to implement appropriate management and conservation strategies. Regular updating of data on animal population density and on the degree of inter-species interactions is thus crucial to assess the spatio-temporal variations in populations and communities (Bouché et al., 2012). Camera traps are increasingly being used to study wildlife behavior and to conduct population estimations (Cutler et al., 1999; Long et al., 2008; O’Connell et al., 2011; Rovero et al., 2013). In the present study, we undertook a literature review on camera trapping studies, to present some technical aspects of commercially available camera models and provide an overview of sampling procedures and uses of camera trapping data.
2. Materials and methods
2We conducted a general literature review on camera trapping using the SciVerse Scopus® database and Google Scholar®. The list of scientific papers consulted is not exhaustive and we do not claim to document all the studies dealing with camera trapping. However, the list of documents consulted has enabled us to gain a good overview of the diversity of uses of camera traps over recent decades and of the main issues regarding sampling and data analysis. To conduct our study on the technical aspects of camera traps, we searched for camera trap brands sold and advertised on the Internet, as well as those used in recent scientific publications. We finally consulted TrailCamPro.com® (TrailCamPro.com, 2013) and Camera Traps cc®’s (Camera Traps cc, 2013) websites to retrieve technical information on the different models. Those two companies distribute together 18brands of camera traps, which, to our knowledge, include the vast majority of camera trap models on the market. We could get the price for 61 different models (15 brands).
3. Results and discussion
3.1. Diversity of uses of camera traps
3While remote photographies have been used for more than a century, as presented by O’Connell et al. (2011), the automated camera trap as it is now known came onto the market at the end of the 1980s. Savidge et al. (1988) used a film camera connected to an infrared transmitter, which was able to shoot a picture as soon as the beam was interrupted by an animal. The system was automatic; after a picture had been taken, the film was reloaded and the camera was ready to take more pictures. This technique was used to identify predators visiting bird nests. Some years later, Carthew et al. (1991) and Kucera et al. (1993) listed the advantages of the automated camera trap system for an array of different field applications such as the study of activity patterns, intra-community interactions and large carnivores populations.
4The first studies using camera traps for the purpose of large mammal conservation appeared in the 1990s and focused on the tiger, Panthera tigris (e.g., Griffiths, 1993; Karanth, 1995). Following the designation of P. tigris as endangered (Chundawat et al., 2011), one of the few “flagship” species listed on the IUCN red-list as early as 1986, these studies aimed at estimating home range span and population size. In this way, the use of camera traps to estimate population size greatly helped towards the conservation strategy for the species, and more generally, the monitoring of other threatened populations and communities. This use of camera traps was highlighted in a study on the activity patterns of mammal communities in Indonesian rain forests (van Schaik et al., 1996). The aforementioned early studies of the use of camera traps clearly illustrate the major advantages of using the technique, including being able to observe cryptic or elusive animals living in difficult to access habitats such as dense tropical forests. The use of camera traps has been revolutionary for studying the behavior of carnivores, as they are difficult to observe in their natural habitat due to their solitary nature. The technique has also been the subject of many other scientific papers since the beginning of the 21st century, revealing more about the ecology of rare, nocturnal animals, as well as those highly sensitive to the presence of humans or those living in large home ranges. A good example is the study of Moruzzi et al. (2002), which promotes the use of this technology for estimating carnivore distribution over large area and documenting species-specific habitat preferences.
5A large proportion of conservation projects aim at managing threatened species, which implies to monitor populations over time and space. Thus, the majority of studies using camera traps nowadays appear to deal with the estimation of population density (e.g., Kalle et al., 2011; Garrote et al., 2012; Oliveira-Santos et al., 2012) or simply with the presence of species in given areas (e.g., Gil-Sanchez et al., 2011; Gray et al., 2011; Liu et al., 2012). Population characteristics are, to a greater or lesser extent, related to habitat use behaviors and habitat selection. Camera traps are useful for monitoring these aspects as they allow the estimation of home range size (e.g., Gil-Sanchez et al., 2011).
6Some studies also deal with activity budget (e.g., van Schaik et al., 1996; Azlan et al., 2006; Gray et al., 2011; Oliveira-Santos et al., 2012) and a smaller number with more specific behaviors. For instance, Soley et al. (2011) reported the storing behavior of non-ripe fruits by a mustelideae, allowing the fruits to mature and to be consumed on future occasions; this is a specific behavior that is very hard to report without camera traps. Blake et al. (2010) studied the importance of salt licks for an animal community in a neotropical forest. Other studies have dealt with animal infant care (e.g., Charruau et al., 2012) or social interaction (Lopucki, 2007; Srbek-Araujo et al., 2012).
7Camera traps are also increasingly being used to study plant-animal interactions such as seed dispersal and predation (e.g., Babweteera et al., 2010; Nyiramana et al., 2011; Campos et al., 2012; Koike et al., 2012; Pender et al., 2013). Moreover, focal observations need to be conducted in the study of the seed dispersal capacity of a given plant species, to list the frugivore species interacting with the plants and to define the quantitative contribution of each species in the process of seed dispersal. Camera traps are revolutionary in this regard, as they allow the identification of diurnal, nocturnal, and shy species that would not be seen using other methods such as direct observation. This is exemplified by the study of Nyiramana et al. (2011), who discovered that a species of rodent, the forest giant pouched rat Cricetomys emini (Wroughton, 1910), was responsible for the secondary dispersal of large seeds in an Afro-tropical forest.
3.2. Various technical aspects
8More than a decade ago, Cutler et al. (1999) reviewed the advantages and disadvantages of using different film camera trapping equipment depending on the research objectives. Given the rapid advances in such technology, and the great variety of camera trap brands and digital models existing on the market nowadays, film cameras are competed. We present here the most important characteristics to take into account when choosing digital equipment. Characteristics such as trigger speed, detection zone, recovery time, night detection and battery consumption can vary greatly and have a significant impact on the types of data to be collected, such as the number of species detected and photographic rates (Hughson et al., 2010). Therefore, the choice of the most appropriate equipment is an important consideration.
9Trigger speed. Trigger speed is the time delay necessary for the camera to shoot a picture once an animal has interrupted the infrared beam within the camera’s detection zone. This delay can vary from between 0.197 seconds for the Reconyx HC500 model to 4.206 seconds for the Stealth Cam Rogue IR model. Given the relatively narrow field of view of most camera trap lenses (42 mm), a slow trigger speed does not allow the photographing of fast moving animals (Scheibe et al., 2008). Thus, depending on the study goals and the target animal species, this time delay could be a crucial characteristic to consider. For example, if a camera is set up at a random location for a wildlife survey (Pereira et al., 2012), fast moving animals are likely to pass in front of the camera trap without stopping. In this case, a very reactive camera (with a fast trigger speed) would be necessary so it could shoot pictures of the detected animal before it left the camera’s field of view. In their comparative study of motion-activated cameras for widlife investigation, Hughson et al. (2010) showed that some camera models (such as the fast Reconyx) can detect up to 86% more animal species. If the trigger speed is too slow, the camera may frame only a part of the animal or may even take empty pictures (pictures not showing what the beam has detected). Hughson et al. (2010) observed that, in comparison with other models, Leaf River cameras took the highest percentage of empty pictures. In the case of a camera installed in front of a bird nest, a bait, or a lure, visiting animals are more likely to stay longer (to either depredate the nest or interact with the bait) and to trigger more photographs (Garrote et al., 2012; Trolle et al., 2003) even if the camera has a relatively long time delay (low reactivity). Using lures to attract large carnivores can also allow a better identification of individuals (Gil-Sanchez et al., 2011). This risk of taking empty pictures does not only depend on the speed of the camera in taking a picture; the detection zone as well as the field of view are also primary criteria to consider.
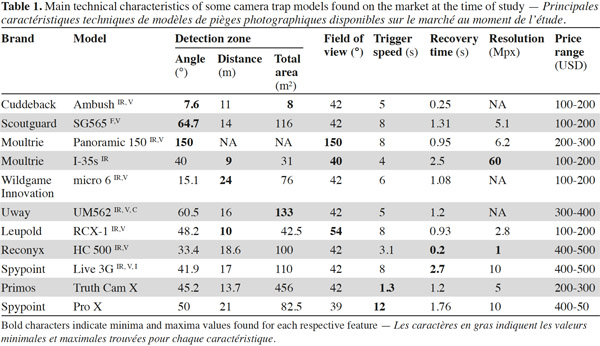
10The detection zone. The detection zone is the zone covered by the camera’s infrared beam in which movement can be detected. The zone varies in width and depth, depending on the model (Table 1). This criterion is probably the most important in determining detection rate (Rowcliffe et al., 2011) and therefore the number of pictures that will be taken in a given event.
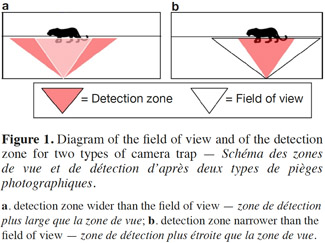
11The field of view. The field of view is the zone covered by the camera lens, and which appears on the pictures. The field of view is generally 42° but there are rare exceptions such as with the Leupold brand, which goes up to 54° (Table 1) and the Moultrie panoramic model, which covers an angle of 150°. The detection zone can vary greatly according to the brand and the model. We thus find models with a detection zone wider than the field of view (e.g. DLC Covert Extreme) and models with the detection zone narrower than the field of view (e.g. Cuddeback Ambush). Where the detection zone is wider than the field of view (Figure 1a), the advantage lies in being better able to capture fast moving animals. The limitation in this case is that the camera is also likely to take empty pictures when animals enter the detection zone (thus passing through the infrared beam and triggering the camera) but without making it into the field of view. Where the detection zone is narrower than the field of view (Figure 1b), the detection zone is centered relative to the field of view of the camera, and so the advantage can be seen in gaining well centered pictures. This can be very useful for the identification of large mammals. However, the limitation in this case is that relatively fewer pictures per visit can be shot, as animals are likely to occupy the field of view without crossing the detection zone. As presented in table 1, the detection zone can be described with a given width (angle) and a given distance from the camera at which it will detect an animal. The detection distance of a camera is an important aspect to consider when focusing on animal species of either large or small body mass. Larger animals will be more easily detected at further distances than smaller animals. However, speed of movement seems to be less correlated with detection distance (Rowcliffe et al., 2011).
12Recovery time. Recovery time is the amount of time necessary for the camera to prepare to shoot the next picture after the previous one has been recorded. Given the wide differences in recovery time for different models, this characteristic must be taken into account, as it can be a very important aspect for some study goals. The fastest camera can take a picture every 0.5 second (Reconyx HC 500 model) while the slowest needs up to 60 seconds before taking a new picture of an animal still occupying the detection zone (Moultrie I-35s model). A camera able to take numerous pictures within a few seconds is very useful when needing to record a complete sequence of a feeding behavior and to note the number of fruits manipulated (Seufert et al., 2010). Also, having different views of a species of carnivore can greatly help in the process of identifying individuals (Trolle et al., 2003). By contrast, when the aim is only to carry out a diversity census, and only one picture per species is needed, a slow recovery time will be less problematic (Lantschner et al., 2012).
13Nighttime pictures. Nighttime pictures are very useful, as a wide range of taxa exhibit exclusive nocturnal activity. Two methods exist for camera trap night photography: incandescent flash and infrared light. Incandescent flash allows color pictures to be taken, which are generally of better resolution and quality. In this method, the amount of light captured is greater than with infrared light, and this can be critical for individual animal identification with the use of tags or natural marks. The limitation of this method is that the flash has a strong risk of scaring the animal (Sequin et al., 2003; Wegge et al., 2004). The infrared method is much more discrete, and is consequently very useful. Indeed, infrared cameras are more widely used by wildlife researchers than incandescent flash (Meek et al., 2012). The infrared light emitted by a series of Light Emitting Diodes (LEDs), which allows the camera to take black-and-white pictures, is hardly visible, although the red light of the LEDs is slightly visible. The most discrete and best solution to avoid scaring wildlife is to use a camera with a “no-glow” infrared flash (e.g., Bushnel Trophy Cam Black, Covert Black 60, Reconyx Hyperfire SM750, etc.). These cameras basically function in the same way as normal infrared cameras, shooting black and white pictures, but using LEDs that emit no visible light at all.
14Battery consumption. Battery life can also be a crucial point to consider when preparing field work with camera traps, especially in remote areas. Several characteristics need to be taken into account, such as the level of energy consumption in monitoring mode (when the camera is on and ready to take pictures if it detects movement) and the level of energy consumption for day and nighttime picture processing. These variables can vary greatly depending on the available models and will then vary in suitability depending on the habitat, the faunal composition present in the habitat and accessibility of the camera for the changing of batteries. For example, in the case of an arid habitat with few nocturnal species, no diurnal animals species, and difficult access, it would be better to use a camera that requires little energy in monitoring mode (as battery replacement is not as frequent) and for nighttime picture taking (as only nocturnal pictures are taken). Thus, battery life will be maximized. By contrast, in the case of a study taking place in a habitat with a high level of diurnal activity, a model that uses as little energy as possible for the processing of daytime pictures would be preferred. To extend battery life, some brands (e.g., Reconyx, Scoutguard, Spypoint) also provide solar panels.
15Picture resolution. Picture resolution, expressed in megapixels (Mpx), can vary more than 10 fold between models. Some Primos models take pictures of relatively low resolution (1.3 Mpx), whereas the Spypoint Pro-X takes pictures up to 12 Mpx. The advantage of lower resolution images is that they are less heavy to store so more pictures can be saved on a given memory card but, as having less pixels, they tend to have less details and be less precise. Given the large storage capacity of memory cards nowadays, we would recommend to select for models with higher resolution pictures and especially when individual identification is needed. A more detailed and precise picture can surely help being more accurate when looking at differences in fur patterns and marks to differentiate between individuals. However, the number of pixels advertised by manufacturers must be considered cautiously because it is not the only factor affecting picture’s quality. Image sensor, the component housing the pixels, is also very important in determining picture quality. For a given sensor size, an increase in the number of pixels is automatically associated with a decrease in pixel size. Yet smaller pixels are less sensitive to light, produce more noise (unwanted signal) and have a narrower dynamic range (i.e. the range of light intensities being captured) (Nakamura, 2005). It is therefore possible that a camera with fewer pixels but a larger sensor can produce pictures of higher quality than a camera with more pixels packed into a smaller sensor. Unfortunately, information on sensor size is so far poorly documented by manufacturers and would need further investigation and comparison.
16Camera cost. At the time of writting, cameras traps cost from about USD 40 to 1,200, though more than half (54%) of the models compared in this study cost between USD 100 to 200. While the cheapest models can have an infrared flash (Hunter GSC35-20IR; Wildgame Innovations Red4), the most expensive ones can provide instant recovery time (Reconyx) and are able to transmit pictures to cell phones or email (Reconyx, Spypoint, Covert).
17In addition to these main characteristics, various additional options serving specific research needs deserve consideration, such as the programmable burst mode allowing a series of up to five pictures to be taken of the same trigger event. Some cameras also record video, with or without sound, which can be useful for reporting on behavior repertoires (Scheibe et al., 2008).
3.3. Sampling methods
18Individual behavior. Studies aiming to report on specific behaviors (feeding, reproduction, territoriality, social interaction, etc.) must direct sampling efforts to places of interests (e.g., salt licks uses: Blake et al., 2010; carcass scavenging: Bauer et al., 2005; specific habitat use: Sequin et al., 2003). To date, only few studies use camera traps data to study individual ranging behavior and estimate home range size (e.g., Gil Sanchez et al., 2011). Those often have to be completed with data collected using other protocols such as telemetry or indirect animal clues (feeding residuals, latrines, nests, etc.), which could explain the relatively small number of studies estimating home range size.
19Population level studies. Studies dealing with population monitoring usually need stronger sampling effort and more complex sampling design. To do so, camera traps are increasingly used as an alternative to other more traditional methods. However, Gompper et al. (2006) proved camera traps to be inefficient at detecting small canids, which were otherwise detected by scat surveys, DNA analysis and/or snowtracking. When comparing different methodologies for the census of population diversity and abundance, camera trapping appear to be the most appropriate method in difficult to access areas compared to line transect or animal track survey (Silveira et al., 2003). Using camera traps to estimating population density can involve complex sampling design and be subject to numerous biases. Firstly, it is important to consider the bias of disproportionally samples more easily accessible or more attractive places for wildlife where detection probability is increased (Foster et al., 2011). The typical procedure to characterize an animal population in a given habitat consists of setting up the sampling effort (camera traps) in a random or systematic way (Foster et al., 2011). As explained by Rowcliffe et al. (2013), cameras can be positioned in less or more attractive places to animals as long as those are proportionally sampled in regards to their relative occurrence in the studied ecosystem. Thus, using a grid and a random number generator, or following a stratified design allow ones to select positions where to install the cameras at random in regards to the animals (Rowcliffe et al., 2013). However, some researchers have set up their cameras in specific places where the targeted elusive species are likely to pass, hoping to maximize encounter rate (e.g., Sanderson, 2004; Weckel et al., 2006); some have even tried to lure animals with attractive smells or baits (e.g., Trolle et al., 2003; Garrote et al., 2012). Indeed, placing camera traps in a non-random way is not necessarily an issue as “it is the animal population within an area that is the subject of sampling by observation stations, not the area itself” as observed by Bengsen et al. (2011). Secondly, one needs to consider variations in detection probability due to the material used. The use of incandescent flash at night can easily spook the target animals and negatively influence future visitation rates in the vicinity of the camera (Sequin et al., 2003; Wegge et al., 2004). Thus, in the case of capture-recapture sampling or studies on habitat use of nocturnal species, it is preferable to avoid using camera models with an incandescent flash. In addition, it is important to make sure all set up cameras have sufficient battery life for a given sampling period. Due to spatial variations in animal community or to different camera models, the number of pictures taken can greatly vary between cameras and some can see their batteries getting empty much more rapidly than others do. Cameras running out of batteries possibly miss information (animals passing in the field of detection without being photographed) and lead to underestimated wildlife estimation. Apart from sampling bias, population estimates with low precision is a common issue when using camera traps data. Sampling design with low detection probability, due to a low number of camera traps, a short duration of a study or inadequate material can only permit to obtain low sample size, which itself limits our ability to obtain precise parameters and strongly affects the strength of population estimates (Foster et al., 2011). As a mean to increase sample size, setting up two cameras at a same station allows obtaining pictures of both flanks for marked animals and can facilitate the identification of individuals (Kalle et al., 2011; Negrões et al., 2012).
20Intra-community interactions. In the case of seed dispersal studies, the camera is often set up so that the visual field includes the fruits or seeds of interest to maximize the chances of photographing frugivores (Seufert et al., 2010; Nyiramana et al., 2011). Variables of interest here are frequency of visits and the relative contribution of different animal species to seed removal. From personal experience, two remaining limitations can, however, be identified. The first limitation occurs when the camera is positioned close to a fruit/seed sample so observers can easily quantify the number of items manipulated by animals. Here, the focal distance might be too close to being able to photograph all the animals visiting the area. The camera would then record a limited number of visiting species and individual animals. By contrast, the second limitation occurs when the camera is positioned to sample the widest area possible below a fruiting tree canopy, in order to systematically record all visiting animals. In this scenario, the focal distance might be too high to allow observers to see accurately the number of fruits/seeds manipulated. An alternative could be to set up two or more cameras at a same location to sample both the tree canopy’s shadow and a fruit sample on the floor. In the latter case, an alternative to evaluate species-specific contribution to seed removal could be to consider visit frequencies per species in the area. Additionally, seed removal rate can be indirectly assessed with an exclusion experiment (Culot et al., 2009).
21Data analysis. The identification of individual animals is generally made by natural fur marks, injuries, and coloration patterns (dots, bands). This identification is, however, always subjective and likely to vary according to the observer and thus likely to affect the precision of estimates. To diminish the risk of mistaken identification, different computer models are able to help matching pictures of marked individuals (Kelly, 2001; Mendoza et al., 2011). Such tools allow observers to improve their ability to recognize individual animals and to be more precise in making population density estimates.
22Individual identification is a crucial step in making population estimate. The spatially explicit capture-recapture technique is increasingly used for this purpose (e.g., Efford, 2011; Kalle et al., 2011; O’Brien et al., 2011). This technique assumes that animals are independently distributed in space and that they use defined home ranges. Thus, a model must be run, which considers, on the one hand, a population parameter (population density) and, on the other hand, a process of individual recognition. The detection process is itself driven by a mathematical function describing the probability of detecting an animal, which decreases as the center of a given home range gets further away from a camera trap (Kalle et al., 2011).
23Camera trap data are also used to generate abundance indices and get quick insight into population size. However, the power of such indices is limited compared to true estimates of population density for different reasons. Firstly, variations in indices cannot necessarily be attributed to true variations in population size. Indeed, to use and be able to compare such indices one needs to make the assumption that wildlife detectability is constant over time, space and between species, however, this is either not tested, nor true (Sollman et al., 2012). Secondly, those indices are rarely calibrated with the actual population and thus only give little information on the true dynamic of population size (Sollman et al., 2012). Moreover, a too low number of traps set up (replicas) does not allow the calculation of a confidence interval (variance) necessary to estimate the exactitude of indices (Azlan et al., 2006), though Bengsen et al. (2011) adapted a General Index Model able to account for variance when calculating population abundance indices.
24Camera traps data such as species detection/non-detection can also be used in occupancy model (e.g., MacKenzie et al., 2003; Long et al., 2011) to predict species occurrence and determine population dynamic parameters. Such models generate detection probability data and thus prevent the recording of false absence. This has very helpful implications for monitoring elusive species for which observations are scarce.
4. Conclusion
25Depending on the data to be collected, the target animal species and the type of ecosystem, it is essential to first choose the appropriate equipment to collect the data needed, as not all camera models will be suitable for a specific research objective. Given the increasing use of camera trapping by scientists, we believe that the available technologies should and will know improvements in the future. Higher image resolution resulting from larger sensor and more efficient infrared beam would allow a better identification of individuals, especially for marked nocturnal species. Even more discrete and faster cameras would prevent spooking animals and get more unblurred pictures. Next, the implementation of appropriate sampling protocols must be seriously considered. In a general way, we believe that homogenization of detection probability could improve the use of camera traps data by diminishing biases and allowing stronger inter-site and inter-species data comparison. This could be done:
26– at the camera scale, by using camera models having similar features (detection zone, field of view, trigger speed, etc.),
27– at the ecosystem scale by implementing standardized sampling scheme (number of cameras, spacing, and placement).
28Having a standard sampling protocol would also permit more solid use of statistical models and interpretation of results. The use of computer tools to improve the scientific value of pictures is increasingly common but all does still not agree basic assumption requirements. Future development of computer tools for population density, abundance and site occupancy estimates would need to rely on empirical validated results on individual habitat use behavior and population dynamics.
29Acknowledgements
30This study took place in the context of the BIOSERF project funded by the “Politique Scientifique Fédérale Belge” (BELSPO).
Bibliographie
Azlan J.M. & Sharma D.S.K., 2006. The diversity and activity patterns of wild felids in a secondary forest in Peninsular Malaysia. Oryx, 40, 36-41.
Babweteera F. & Brown N., 2010. Spatial patterns of tree recruitment in East African tropical forests that have lost their vertebrate seed dispersers. J. Trop. Ecol., 26(2), 193-203.
Barrows C.W. et al., 2005. A framework for monitoring multiple-species conservation plans. J. Wildl. Manage., 69(4), 1333-1345.
Bauer J.W., Logan K.A., Sweanor L.L. & Boyce W.M., 2005. Scavenging behaviour in puma. Southwestern Nat., 50(4), 466-471.
Bengsen A.J., Leung L.K.-P., Lapidge S.J. & Gordon I.J., 2011. Using a general index approach to camera-trap abundance indices. J. Wildl. Manage., 75(5), 1222-1227.
Blake J.G. et al., 2010. Use of mineral licks by white-bellied spider monkeys (Ateles belzebuth) and red howler monkeys (Alouatta seniculus) in Eastern Ecuador. Int. J. Primatol., 31(3), 471-483.
Bouché P., Lejeune P. & Vermeulen C., 2012. How to count elephants in West African savannahs? Synthesis and comparison of main gamecount methods. Biotechnol. Agron. Soc. Environ., 16(1), 77-91.
Camera Traps cc, 2013. http://www.cameratrap.co.za, (20/09/2013).
Campos R.C., Steiner J. & Zillikens A., 2012. Bird and mammal frugivores of Euterpe edulis at Santa Catarina island monitored by camera traps. Stud. Neotropical Fauna Environ., 47(2), 105-110.
Carthew S.M. & Slater E., 1991. Monitoring animal activity with automated photography. J. Wildl. Manage., 55, 689-692.
Charruau P. & Hénaut Y., 2012. Nest attendance and hatchling care in wild American crocodiles (Crocodylus acutus) in Quintana Roo, Mexico. Anim. Biol., 62(1), 29-51.
Chundawat R.S. et al., 2011. Panthera tigris. IUCN 2012, IUCN Red List of Threatened Species. Version 2012.2, http://www.iucnredlist.org, (15/11/2012).
Culot L., Huynen M.-C., Gérard P. & Heymann E.W., 2009. Short-term post-dispersal fate of seeds defecated by two small primate species (Saguinus mystax and Saguinus fuscicollis) in the Amazonian forest of Peru. J. Trop. Ecol., 25(3), 229-238.
Cutler T.L. & Swann D.E., 1999. Using remote photography in wildlife ecology: a review. Wildl. Soc. Bull., 27(3), 571-581.
Efford M.G., 2011. Estimation of population density by spatially explicit capture-recapture analysis of data from area searches. Ecology, 92(12), 2202-2207.
Foster R.J. & Harmsen B.J., 2011. A critique of density estimation from camera-trap data. J. Wildl. Manage., 76(2), 224-236.
Garrote G. et al., 2012. The effect of attractant lures in camera trapping: a case study of population estimates for the Iberian lynx (Lynx pardinus). Eur. J. Wildl. Res., 58(5), 881-884.
Gil-Sánchez J.M. et al., 2011. The use of camera trapping for estimating Iberian lynx (Lynx pardinus) home ranges. Eur. J. Wildl. Res., 57(6), 1203-1211.
Gompper M.E., Kays R.W. & Ray J.C., 2006. A comparison of noninvasive techniques to survey carnivore communities in northeastern North America. Wildl. Soc. Bull., 34, 1142-1151.
Gray T.N.E. & Phan C., 2011. Habitat preferences and activity patterns of the larger mammal community in Phnom Prich Wildlife Sanctuary, Cambodia. Raffles Bull. Zool., 59(2), 311-318.
Griffiths M., 1993. Population density of Sumatran tigers in Gunung Leuser National Park. Tiger Beat. Newsletter Tiger Species Survival Plan, 6(2), 17-18.
Hughson D.L., Darby N.W. & Dungan J.D., 2010. Comparison of motion-activated cameras for wildlife investigations. California Fish Game, 96(2), 101-109.
Kalle R., Ramesh T., Qureshi Q. & Sankar K., 2011. Density of tiger and leopard in a tropical deciduous forest of Mudumalai Tiger Reserve, southern India, as estimated using photographic capture-recapture sampling. Acta Theriologica, 56(4), 335-342.
Karanth K.U., 1995. Estimating tiger Panthera tigris populations from camera-trap data using capture–recapture models. Biol. Conserv., 71, 333-338.
Kelly M.J., 2001. Computer-aided photograph matching in studies using individual identification: an example from Serengeti cheetahs. J. Mammalogy, 82(2), 440-449.
Koike S. et al., 2012. Seed removal and survival in Asiatic black bear Ursus thibetanus faeces: effect of rodents as secondary seed dispersers. Wildl. Biol., 18(1), 24-34.
Kucera T.E. & Barrett R.H., 1993. In my experience: the Trailmaster® camera system for detecting wildlife. Wildl. Soc. Bull., 21(4), 505-508.
Lantschner M.V., Rusch V. & Hayes J.P., 2012. Habitat use by carnivores at different spatial scales in a plantation forest landscape in Patagonia, Argentina. For. Ecol. Manage., 269, 271-278.
Liu X. et al., 2012. Monitoring wildlife abundance and diversity with infra-red camera traps in Guanyinshan Nature Reserve of Shaanxi Province, China. Ecol. Indic., 33, 121-128.
Long R.A., MacKay P., Ray J. & Zielinski W., eds, 2008. Noninvasive survey methods for carnivores. Washington: Island Press.
Long R.A. et al., 2011. Predicting carnivore occurrence with noninvasive surveys and occupancy modeling. Landscape Ecol., 26, 327-340.
Łopucki R., 2007. Social relationships in a bank vole Clethrionomys glareolus (Schreber, 1780) population: video monitoring under field conditions. Polish J. Ecol., 55(3), 543-558.
MacKenzie D.I. et al., 2003. Estimating site occupancy, colonization, and local extinction when a species is detected imperfectly. Ecology, 84(8), 2200-2207.
Meek P.D. & Pittet A., 2012. User-based design specifications for the ultimate camera trap for wildlife research. Wildl. Res., 39(8), 649-660.
Mendoza E., Martineau P.R., Brenner E. & Dirzo R., 2011. A novel method to improve individual animal identification based on camera-trapping data. J. Wildl. Manage., 75(4), 973-979.
Moruzzi T.L. et al., 2002. Assessing remotely triggered cameras for surveying carnivore distribution. Wildl. Soc. Bull., 30(2), 380-386.
Nakamura J., ed., 2005. Image sensors and signal processing for digital still cameras. Boca Raton, FL, USA: CRC Press.
Negrões N. et al., 2012. One or two cameras per station? Monitoring jaguars and other mammals in the Amazon. Ecol. Res., 27, 638-648.
Nyiramana A., Mendoza I., Kaplin B.A. & Forget P.-M., 2011. Evidence for seed dispersal by rodents in tropical montane forest in Africa. Biotropica, 43(6), 654-657.
O'Brien T.G. & Kinnaird M.F., 2011. Density estimation of sympatric carnivores using spatially explicit capture-recapture methods and standard trapping grid. Ecol. Appl., 21(8), 2908-2916.
O'Connell A.F., Nichols J.D. & Karanth K.U., 2011. Camera traps in animal ecology: methods and analyses. Tokyo: Springer.
Oliveira-Santos L.G.R. et al., 2012. Abundance changes and activity flexibility of the oncilla, Leopardus tigrinus (Carnivora: Felidae), appear to reflect avoidance of conflict. Zoologia, 29(2), 115-120.
Pender R.J., Shiels A.B., Bialic-Murphy L. & Mosher S.M., 2013. Large-scale rodent control reduces pre- and post-dispersal seed predation of the endangered Hawaiian lobeliad, Cyanea superba subsp. superba (Campanulaceae). Biol. Invasion, 15(1), 213-223.
Pereira P. et al., 2012. Coexistence of carnivores in a heterogeneous landscape: habitat selection and ecological niches. Ecol. Res., 27(4), 745-753.
Rovero F., Zimmermann F., Berzi D. & Meek P., 2013. “Which camera trap type and how many do I need?” A review of camera features and study designs for a range of wildlife research applications. Hystrix Ital. J. Mammalogy, 24(2), 148-156.
Rowcliffe J.M. et al., 2011. Quantifying the sensitivity of camera traps: an adapted distance sampling approach. Methods Ecol. Evol., 2, 464-476.
Rowcliffe J.M., Kays R., Carbone C. & Jansen P.A., 2013. Clarifying assumptions behind the estimation of animal density from camera trap rates. J. Wildl. Manage., 77, 876.
Sanderson J.G., 2004. Camera phototraping monitoring protocol. The tropical ecology, assessment and monitoring (team) initiative, http://www.teamnetwork.org/files/protocols/terrestrial-vertebrate/archive/TEAMCameraTraps-PT-EN-2.0.pdf., (20/09/2013).
Savidge J.A. & Seibert T.F., 1988. An infrared trigger and camera to identify predators at artificial nests. J. Wildl. Manage., 52, 291-294.
Scheibe K.M. et al., 2008. Long-term automatic video recording as a tool for analysing the time patterns of utilisation of predefined locations by wild animals. Eur. J. Wildl. Res., 54(1), 53-59.
Sequin E.S., Jaeger M.M., Brussard P.F. & Barrett R.H., 2003. Wariness of coyotes to camera traps relative to social status and territory boundaries. Lincoln, NE, USA: University of Nebraska–Lincoln.
Seufert V., Linden B. & Fischer F., 2010. Revealing secondary seed removers: results from camera trapping. Afr. J. Ecol., 48(4), 914-922.
Silveira L., Jácomo A.T.A. & Diniz-Filho J.A.F., 2003. Camera trap, line transect census and track surveys: a comparative evaluation. Biol. Conserv., 114(3), 351-355.
Soley F.G. & Alvarado-Díaz I., 2011. Prospective thinking in a mustelid? Eira barbara (Carnivora) cache unripe fruits to consume them once ripened. Naturwissenschaften, 98(8), 693-698.
Sollmann R., Mohamed A., Samejima H. & Willting A., 2012. Risky business or simple solution – Relative abundance indices from camera-trapping. Biol. Conserv., 159, 405-412.
Srbek-Araujo A.C., Silveira L.F. & Chiarello A.G., 2012. The red-billed curassow (Crax blumenbachii): social organization, and daily activity patterns. Wilson J. Ornithol., 124(2), 321-327.
TrailCamPro.com, 2013. http://www.trailcampro.com, (20/09/2013).
Trolle M. & Kéry M., 2003. Estimation of ocelot density in the pantanal using capture-recapture analysis of camera-trapping data. J. Mammalogy, 84(2), 607-614.
van Schaik C.P. & Griffiths M., 1996. Activity periods of Indonesian rainforest mammals. Biotropica, 28(1), 105-112.
Weckel M., Giuliano W. & Silver S., 2006. Jaguar (Panthera onca) feeding ecology: distribution of predator and prey through time and space. J. Zool., 270, 25-30.
Wegge P., Pokheral C.Pd. & Jnawali S.R., 2004. Effects of trapping effort and trap shyness on estimates of tiger abundance from camera trap studies. Anim. Conserv., 7(3), 251-256.