


- Accueil
- Volume 19 (2015)
- Numéro 1
- Assessing variability of literature based methane indicator traits in a large dairy cow population


Visualisation(s): 2520 (193 ULiège)
Téléchargement(s): 142 (1 ULiège)

Assessing variability of literature based methane indicator traits in a large dairy cow population

Notes de la rédaction
Received on January 23, 2014; accepted on November 5, 2014
Résumé
Appréciation de la variabilité d'indicateurs méthane issus de la littérature et appliqués sur une large population de vaches laitières
Description du sujet. La production laitière est reconnue comme une des sources majeures d’émissions de méthane (CH4). Le recours à un programme de sélection spécifique pourrait être une bonne méthode pour optimiser les émissions de méthane par les vaches laitières. Le développement d’un tel programme nécessiterait un nombre important d’enregistrements relatifs aux émissions de méthane. Malheureusement, aucune méthode pratique et bon marché n’existe actuellement pour créer une telle base de données. Cependant, quatre indicateurs CH4 basés sur les quantités en acides gras dans la matière grasse laitière ont été recensés dans la littérature.
Objectifs. L’objectif de cette étude est d’utiliser ces indicateurs de la littérature afin d’apprécier la variabilité des émissions de méthane éructées par les vaches laitières.
Méthode. Ces indicateurs utilisent les quantités en acides gras obtenues par chromatographie en phase gazeuse. Comme ce type de données n’est pas disponible pour toute la population laitière, un échantillon de 602 analyses chromatographiques a été créé dans cette étude afin de développer une équation de calibrage permettant de prédire les quantités de méthane émises à partir du spectre moyen infrarouge (MIR) du lait qui est disponible pour toutes les vaches étudiées. Ensuite, l’équation de calibrage ainsi obtenue a été appliquée sur 604 028 données spectrales enregistrées entre 2007 et 2011 auprès de 70 872 vaches au cours de leurs trois premières lactations afin de prédire les quantités de méthane émises. Les paramètres génétiques de ces nouveaux indicateurs méthane prédits par MIR ont également été estimés en utilisant un modèle animal de type jour de test avec régressions aléatoires.
Résultats. Ces quantités prédites par MIR variaient selon une gamme attendue s’étalant entre 350 ± 40 et 449 ± 65 g par jour. L’émission prédite moyenne de CH4 en g par jour augmentait au début de la lactation, atteignait sa plus haute concentration au pic de lactation et ensuite diminuait jusqu’à la fin de la lactation. Les héritabilités journalières moyennes variaient entre 0,29-0,35 ; 0,26-0,40 et 0,22-0,37 pour les différents indicateurs méthane étudiés au cours des trois premières lactations. Les plus grandes différences entre les valeurs d’élevage estimées pour des taureaux ayant des filles en production émettant le plus et le moins de méthane étaient de 24,18 ; 29,33 et 27,77 kg par lactation pour les trois premières lactations. Des corrélations faiblement négatives ont été observées entre les indicateurs CH4 et la quantité de lait. À l’inverse, des corrélations positives ont été estimées entre ces mêmes indicateurs et les taux en matières grasses et en protéines.
Conclusions. Cette étude montre la possibilité de prédire des indicateurs méthane issus de la littérature et utilisant les concentrations en acides gras dans la matière grasse laitière à partir de la spectrométrie MIR. De plus, cette étude suggère également à partir des paramètres génétiques obtenus l’existence d’une variabilité phénotypique et génétique des quantités de méthane éructées par les vaches laitières Holstein.
Abstract
Description of the subject. Dairy production is identified as a major source of methane (CH4) emissions. Selective breeding represents one method for mitigating CH4 emissions but practical and cheap ways to measure this trait are not currently available. In the present study, four CH4 indicator traits based on milk fatty acid (FA) contents were referenced from the literature.
Objectives. The aim of the study was to use these literature CH4 indicators for assessing the variability of methane emissions emitted by dairy cows.
Method. Literature CH4 indicator traits were originally defined based on the measurements of FA content by gas chromatography. However, these measurements were not available for all the available cows in our studied population. A sample of 602 gas chromatographic analyses was therefore used to develop a calibration equation for predicting the literature CH4 indicators based on milk mid-infrared (MIR) spectra. This spectral information was available for all the studied cows. Then, in a second step, in order to predict the literature CH4 indicator traits, the developed MIR prediction equations were applied to the 604,028 recorded spectral data collected between 2007 and 2011 for 70,872 cows in their first three lactations. Genetic parameters for these traits were then estimated using single trait test-day random regression animal models.
Results. The predicted MIR literature CH4 estimates were in the expected range from 350 ± 40 to 449 ± 65 g per day. The averaged predicted MIR CH4 emission (g per day) increased from the beginning of lactation, reached the highest level at the peak of lactation and then decreased towards the end of lactation. The average daily heritability values were 0.29-0.35, 0.26-0.40, and 0.22-0.37 for the different studied CH4 indicators for the first three lactations, respectively. The largest differences between the estimated breeding values of sires that had daughters in production eructing the highest and the lowest CH4 content was 24.18, 29.33 and 27.77 kg per lactation for the first three parities. Low negative correlations were observed between CH4 indicator traits and milk yield. Positive genetic correlations were estimated between CH4 indicator traits and milk fat and protein content.
Conclusions. This study showed the feasibility of using MIR spectrometry results to predict fatty acid derived CH4 indicator traits developed in the literature. Moreover, the estimated genetic parameters of these traits suggested a potential phenotypic and genetic variability of the daily quantity of CH4 eructed by Holstein dairy cows.
Table des matières
1. Introduction
1Livestock production is considered as one of the key sources of greenhouse gas emissions, the main gas produced being methane (CH4). Globally, livestock produces about 80 million tons of enteric CH4 annually (Beauchemin et al., 2008). Enteric CH4 fermentation by ruminants accounts for about 32% of total non-CO2 emissions from agriculture. Methane is 21 times more potent than CO2 in its greenhouse effect; therefore, the reduction of CH4 would make an important contribution for decreasing the impact of greenhouse emissions (Smith et al., 2007). Furthermore, CH4 emissions from ruminants account for 2% to 12% of gross energy loss from feed, depending on the type of diet (Johnson et al., 1995). Therefore the mitigation of CH4 emissions from livestock has two advantages: a decrease in its environmental impact and an increase in energy efficiency.
2There are currently several methods available for obtaining CH4 emission data on a small scale. It is widely acknowledged that the most accurate measurement of CH4 emissions can be obtained from the calorimetry method using respiration chambers. However, the cost, the handling of lactating dairy cows and the CH4 measurement time, limit the number of animals that can be measured, which reduces the usefulness of this method in large populations. The measurement of sulfur hexafluoride gas (SF6) (Johnson et al., 1994) is an alternative method for obtaining CH4 emission data, which can be used because of its relatively low cost and its ability to keep the animal in a more natural environment (i.e. grazing). However, obtaining an accurate direct measurement of CH4, using this method is complex and the recording of such data is also unfeasible on a medium to large scale. Other methods are under scrutiny but all depend on the acquisition of extra data from outside the current data acquisition strategies used in the usual recording systems of animal production.
3The most used method of data acquisition in dairy cattle is through performance recording. Consequently, some studies have focused on the creation of indicator traits indirectly related to the CH4 emissions, based on milk composition which is or could be routinely measured through milk recording. A particularly promising group of components, in this regard, are fatty acids (FA). The use of FA traits seems to be biologically relevant for predicting CH4. Indeed, CH4 output from ruminants is directly linked to microbial digestion in the rumen. The fermentation process of feed carbohydrates leads to the production of hydrogen (H2) and the methanogenesis is an essential pathway to expel this H2 (Moss et al., 2000). The synthesis of acetate (C2) and beta-hydroxybutyrate (C4) produces H2 that is then converted to CH4, while propionate (C3) synthesis consumes H2 (Demeyer et al., 1975). The de novo synthesis of milk FA in the mammary gland uses mostly C2 (85% of de novo synthesized FA) but also C4 (10 to 15%), and a limited amount of C3 to make short chain FA (C4, C6, and C8), nearly all medium chain FA (C10, C12, and C14), and approximately 60% of C16 (Chilliard et al., 2000; Couvreur et al., 2007). Based on this indirect link, equations using gas chromatographic FA measurements (GCFA) to predict CH4 emissions have been derived (e.g., Chilliard et al., 2009; Dijkstra et al., 2011). Unfortunately, gas chromatographic method is not adapted for large scale use in dairy cow population especially due to its cost.
4Recent research showed the feasibility of predicting FA using MIR spectrometry (e.g., Soyeurt et al., 2011). Therefore, the aims of the current study were :
5– to develop MIR equations to predict fatty acid derived CH4 indicator traits developed in the literature directly from MIR spectrometry and to apply those equations on the spectral data recorded for the Walloon Holstein population;
6– to estimate the phenotypic and genetic parameters of these indicator traits and their relationship with milk production traits in order to evaluate indirectly the CH4 emission of Holstein dairy cows.
2. Materials and methods
2.1. Computation of CH4 indicator traits
7Several different CH4 indicator traits derived from FA are given in the literature. The indicators defined by Chilliard et al. (2009) and Dijkstra et al. (2011) are well known and already used in several studies. Only CH4 indicator traits described by Chilliard et al. (2009) were investigated in the current study. The CH4 indicator trait defined by Dijkstra et al. (2011) was not considered in this study because its formula was developed from less abundant milk FA and the dry matter intake (DMI), which were not available. Methane indicators defined by Chilliard et al. (2009) are based on major milk FA or class of major milk FA, and the accuracy of MIR prediction of these FA was known to be very high (0.87 to 0.94) (Soyeurt et al., 2011). As the MIR spectrometry is used by nearly all milk recording organizations, adapted milk MIR spectra prediction equations for FA could be used to derive potentially informative CH4 indicator traits. In this context, two options are possible:
8– using the MIR equations for FA developed by Soyeurt et al. (2011), then computing the CH4 indicators by using these MIR FA predictions;
9– computing reference values for CH4 indicator traits using the gas chromatographic FA database used by Soyeurt et al. (2011) and then using these reference values for CH4 indicators with associated MIR data to obtain direct MIR equations for these CH4 indicators.
10The second proposal was preferred in this study for two reasons. First, one of the indicator traits was based on a sum of different FA, and using individual estimates would have led to an accumulation of prediction errors for this CH4 indicator. Also, by re-computing the calibrations for all traits, the obtained equations were comparable and adapted to the range of variation in the reference data.
11The calibration dataset used to develop the MIR calibration equations for the CH4 indicator traits contained 602 Walloon milk samples and their corresponding gas chromatographic FA profile and MIR spectra (i.e., those samples included in the calibration dataset used by Soyeurt et al., 2011). The sampling procedure was explained in detail by Soyeurt et al. (2011).
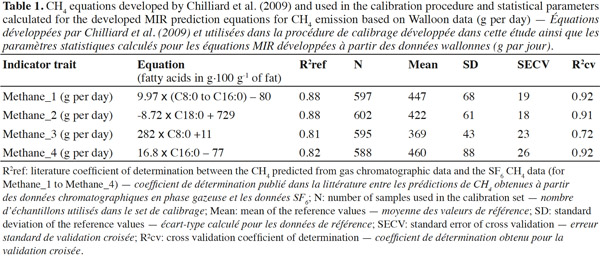
12The reference values for the CH4 indicator traits (called hereafter Methane_1 to Methane_4) were computed from the FA contents measured by gas chromatography by using the equations published by Chilliard et al. (2009) (Table 1). The equations developed by Chilliard et al. (2009) predicted the CH4 emission in g per day. The coefficient of determination reported in literature by Chilliard et al. (2009) for these four indicators (R2ref) varied between 0.81 (i.e., Methane_3) and 0.88 (Methane_1 and Methane_2). From the reference CH4 data and their corresponding milk MIR spectra, partial least squares regressions were used to develop four CH4 indicator trait equations after applying a first derivative pre-treatment on the recorded spectral data. A t-outlier test was performed to delete potential outliers during the calibration process. This process explained why the number of samples used for each developed equation was slightly different. The robustness of the developed MIR equations was assessed by cross-validation using 50 groups. The cross-validation coefficient of determination (R²cv) and the cross-validation standard error (SECV) were calculated.
2.2. Milk samples and predictions of CH4 indicator traits
13Milk samples were collected from Holstein cows belonging to 1,207 herds between January 2007 and October 2011 through the Walloon milk recording managed by the Walloon Breeding Association (Ciney, Belgium). All samples were analyzed using a Milkoscan FT6000 spectrometer (Foss, Hillerød, Denmark) by the milk laboratory “Comité du Lait” (Battice, Belgium) to quantify the contents of protein and fat and to record the spectral raw data.
14The CH4 prediction equations developed by Chilliard et al. (2009) and adapted for MIR spectra in this study were applied to the recorded MIR spectral data to predict MIR literature indicators of the quantity of the eructed CH4. The dataset contained 262,759; 203,092; and 138,117 records collected from 53,481; 41,419; and 28,978 first, second, and third parity Holstein cows, respectively. All of these records were observed between 5 and 365 days in milk (DIM). The pedigree data was extracted from the pedigree used for the regular Walloon genetic evaluation for milk production traits.
2.3. Estimation of genetic parameters
15Single trait test-day random regression animal models were used to model the variability of the studied traits:
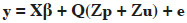
16where y was the vector of observations for each trait (Methane_1 to Methane_4, milk yield, fat and protein contents), β was the vector of fixed effects (herd x test day, DIM (24 classes; 15 days each starting from day 6 to day 365), and age at calving (9 classes: 21 to 28 months, 29 to 32 months, and 33 months and more for first lactation; 31 to 44 months, 44 to 48 months, and 49 months and more for second lactation and 41 to 57 months, 57 to 60 months, and 60 months and more for third lactation); p was the vector of permanent environmental random effects, u was the vector of additive genetic effects; Q was the matrix containing the coefficients of 2nd order Legendre polynomials; e was the vector of residuals; X and Z were incidence matrices assigning observations to effects.
17Variance components were estimated using the average information REML method (AI-REML, Misztal, 2011). Average daily heritability (h2) was the averaged h2 estimated separately for each DIM between 5 and 305 DIM as the ratio of the genetic variance at the considered DIM to the total variance. The breeding values were estimated (EBV) using a BLUP approach. Approximate daily genetic correlations were computed between traits using the following method. First, daily breeding values (EBVd) for each DIM between 5 and 305 and for cows with records were calculated as following:
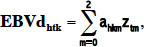
18where EBVdhtk was the daily breeding value of cow k, for trait h, for each DIM t between 5 and 305; ahkm was the random regression coefficient for the additive genetic effects; ztmwas the covariate for Legendre polynomials associated with DIM t; and zt0 = 1.0, zt1 = 3.00.5x, zt2 = 5.00.5(1.5x2 – 0.5), where x = 2[(t – 5)/300] – 1.
19Second, daily genetic correlations between two traits were estimated as correlations between EBVd values of the two traits of interest for each DIM between 5 and 305. Finally, average daily correlations were defined as the average correlations across the entire lactation.
3. Results and discussion
3.1. Development of MIR predictions for CH4 indicator traits
20After applying the equations of Chilliard et al. (2009) on the gas chromatographic FA data included in the calibration set (i.e., 602 samples), the mean and SD obtained for the reference values for Methane_1 to Methane_4 were within the range of estimated CH4 emission values published by Chilliard et al. (2009) (Table 1). The values for Methane_3 tended to be lower than the values for the other three indicators.
21The robustness of the MIR equation developed to predict the literature CH4 indicator traits can be assessed by R2cv (Table 1). For all traits except Methane_3, R²cv was at least 0.91. Based on the obtained results, Methane_1 and Methane_2 seem to be the most relevant MIR traits because they had the highest R²ref (as reported by Chilliard et al., 2009) and high R²cv were obtained. Moreover, Methane_2 and Methane_1 had also the lowest SECV (18.42 and 19.30 g of CH4 per day, respectively). This suggests that Methane_1 and Methane_2 were theoretically the best CH4 indicators. In addition to this, the FA used in Methane_3 and Methane_4 were also a subset of those used for Methane_1.
3.2. MIR indicators of CH4 eructed by Walloon Holstein cows
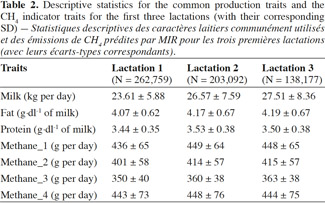
22Descriptive statistics for the common production traits and the developed MIR CH4 indicator traits for the first three lactations of studied Walloon Holstein cows are shown in table 2. By taking into account all CH4 indicators, the MIR CH4 predictions ranged from 350 g to 443 g per day in the first lactation which corresponds to 128 to 162 kg of CH4 per year.
23For the second lactation, the CH4 MIR prediction was 360 g to 449 g per day. The value was almost similar for the third lactation (Table 2). MIR predicted values stayed within the range observed from the reference values (Table 1) in terms of means and standard deviations. For all studied MIR traits, a larger amount of CH4 was estimated for the second lactation compared to the first lactation. However, this trend was almost flat from the second to the third lactation. Even if Mohammed et al. (2011) suggested an overestimation of CH4 production obtained from the equations of Chillliard et al. (2009), the obtained MIR CH4 predictions were within the range of the published CH4 emissions. Except for Methane_3, the MIR based predictions of CH4 in our study were in agreement with the daily CH4 emissions (429 ± 128 g per day) measured in Holstein cows in Belgium (Dehareng et al., 2012), as well as the CH4 quantity measured from the group where these equations were derived (418.1 g per day, Martin et al. [2008]). Similarly, predictions were on par with CH4 emission measured through the SF6 method from other authors like Heimeier et al. (2010), and also measured from the respiration chambers (van Zijderveld et al., 2011).
24The estimated MIR CH4 indicators increased until the peak of lactation, which occurred during the second or third month of lactation, and then decreased (Figure 1a). This pattern could be explained by the evolution of milk production within the lactation; an increase in milk production requires more energy and therefore led to increased CH4 emission per day, albeit a low amount (Capper et al., 2009). Similarly the DMI increases as the lactation progresses. Also, DMI is one of the primary drivers for CH4 emission (Hegarty et al., 2007). However, at the beginning of the lactation, energy required to produce milk is also obtained by mobilizing body reserves (Banos et al., 2010), which could explain the delay in the peak of the CH4 indicators compared to the peak in milk production.
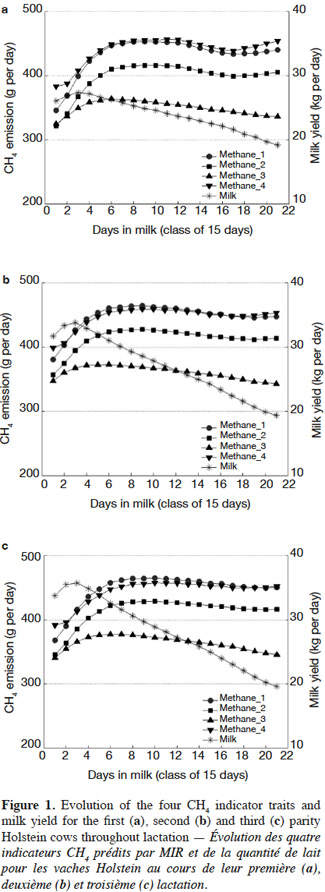
25The difference in MIR CH4 predictions between the beginning and their peak during lactation was around 50-60 g per day. A similar observation was obtained by IPCC (2006) and Garnsworthy et al. (2012). The evolution pattern of the CH4 emission for the second and third lactations was similar to the one observed for the first lactation but the overall level of estimated MIR CH4 predictions was slightly higher (1-2%) (Figures 1b and 1c). It can be attributed mostly to the increase in milk production, DMI and body weight gains (Grainger et al., 2008; Garnsworthy et al., 2012). Despite their very simple nature, the evolution of the MIR based CH4 indicator traits were in line with expectations.
3.3. Heritability
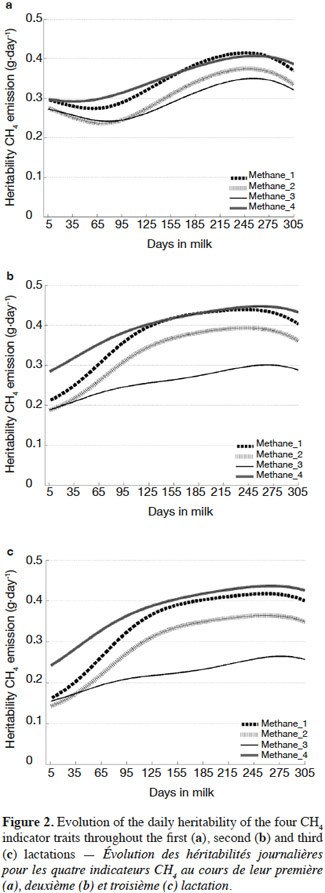
26Average daily heritability for the four MIR CH4 indicator traits ranged between 0.29 and 0.35 for the first lactation, 0.26 to 0.40 for the second lactation, and 0.22 to 0.37 for the third lactation. For Methane_1, which seems to be the most relevant indicator, the average daily heritabilities were 0.35 (± 0.01), 0.38 (± 0.01), and 0.34 (± 0.01) for the first three lactations, respectively. The estimated heritability suggested a potential transmission of the capacity of dairy cows for emitting high or low quantity of CH4 from generation to generation. However, this CH4 indicator trait was basically derived from the saturated FA which has reported heritability values around 0.40 (Bastin et al., 2011); therefore, the values observed for daily heritabilities in this study were expected. Previously reported heritability for the predicted CH4 production in Holstein cow was 0.12 (Cassandro et al., 2010) and 0.35 (de Haas et al., 2011). In the study by Cassandro et al. (2010), the CH4 production was calculated using predicted DMI for dairy cattle; de Hass et al. (2011) predicted CH4 emission as 6% of gross energy intake corrected for the energy content of milk. Another study which estimated heritability of enteric CH4 emission measured by Fourier transform infrared gas analyzer obtained a heritability of 0.21 (Lassen et al., 2012). The difference of heritability between different methods was presumably due to a prediction of CH4 obtained from very different methodology. However, the tendency found by these previous authors and the current results are in line to suggest a potential genetic variability of the quantity of CH4 eructed by dairy cows per day.
27The DIM heritabilities ranged from 0.29 to 0.41 for Methane_1, from 0.26 to 0.37 for Methane_2, from 0.24 to 0.35 for Methane_3, from 0.29 to 0.41 for Methane_4 in first lactation. The DIM heritability values from all CH4 indicator traits increased from mid-lactation until late lactation and then decreased slightly until the end of the lactation for all studied lactations (Figure 2). This could be explained by the negative energy balance of a cow at the beginning of the lactation which involves a mobilization of lipids from adipose tissue. The energy is therefore partly obtained from metabolic processes which are controlled by different genetic processes. At later lactation stages, the cow is in positive energy balance; therefore, the energy comes mainly from the ingested food (Friggens et al., 2007) which, given the results obtained here, seems to be captured well by the studied CH4 indicator traits. Another explanation could be the increase of DMI during the mid and later lactation. Indeed, the CH4 emission is positively correlated with DMI (Grainger et al., 2008), which is partially controlled by genetic process (Berry et al., 2007). Finally, the shape of the heritability curves is also a function of the model used. The objective of this research was not to study the optimal model for the studied traits. Previous studies for yield traits (e.g., Gengler et al., 2005) showed the potential importance of herd-specific lactation curves and the differences in partitioning of phenotypic variances across the lactation according to types of herds. Differences among herds in their feeding management are expected; therefore, future research will need to address this issue.
3.4. Phenotypic and approximate genetic correlations
28The phenotypic correlations and the approximate genetic correlations calculated between the MIR CH4 indicator traits and the common production traits are presented in table 3 for the first lactation.
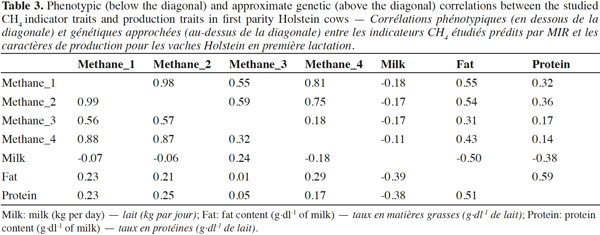
29Both phenotypic and approximate genetic correlations were positive among all studied MIR CH4 indicators. Correlations between Methane_1 and Methane_2 were close to the unity indicating that they basically describe the same trait and lower correlations were observed with other CH4 MIR traits but the correlations always stayed positive.
30The phenotypic correlations for the MIR CH4 traits with milk yield were nearly zero (-0.18 to -.06) except for Methane_3 which was positive (0.24), indicating again that this trait behaved differently. IPCC model indicates a linear relationship between milk yield and CH4 emission due to fact that milk yield and feed intake as predictor of CH4 emissions in this model. However, other complex model like life cycle assessment model indicates lack of linear relationship (Sonesson et al., 2009). Wall et al. (2010) mentioned cows with higher genetic merit for milk production produced less CH4·kg-1 of milk on different diets possibly due to their low maintenance requirement and their higher feed efficiency suggesting a curvilinear relationship between these traits. Madsen et al. (2010) found a slight positive correlation between milk production and the ratio CH4:CO2 (i.e., proxy to the CH4 emission).
31The observed phenotypic correlations were positive between MIR CH4 indicators and fat content (0.31-0.54) and protein content (0.14-0.38). This suggests a higher CH4 emission if the milk is rich in protein and/or fat. This could be partly explained by the fact that more energy is required to produce higher content of fat and protein (NRC, 2001). Grainger et al. (2010) found a reduction of CH4 emission for dairy cows fed with a supplemented whole cottonseed meal with no change in fat content but a small decrease in protein content. However, except that, there is no direct evidence in the literature that an increase in fat and protein content proportionately increases the CH4 daily content (g·day-1).
32The approximate genetic correlations between the studied MIR CH4 traits and milk yield were low and negative (-0.11 to -0.18), but positive with the fat content (0.31 to 0.55) and protein content (0.14 to 0.36; table 3). Therefore, selecting for increased milk production can slightly decrease the CH4 emissions as suggested previously by Wall et al. (2010).
33EBVs for all studied CH4 indicator traits were estimated for cows with MIR CH4 predictions and for sires that had daughters with MIR CH4 predictions. Given the heritability values and as expected, substantial differences of EBVs between animals were observed. For instance, the lowest EBV of sire for Methane_1 cumulated at 305 days was -11.12 kg and the highest was 13.06 kg. The range between EBVs of Methane_1 was 24.18 kg for the first lactation, 29.33 kg for the second lactation and 27.77 kg for the third lactation. Similarly, the lowest EBV for cow for Methane_1 was -14.46 kg and the highest was 14.87 kg. The range was equal to 30.36 kg for the first parity cows, 35.93 kg for the second parity cows, and 32.92 kg for the third parity cows. The EBV for extreme animals of all MIR CH4 traits was higher in the second lactation compared to the first one and slightly lower in the third lactation (data not shown). The Pearson correlations of EBV ranged from 0.77 to 0.80 between first and second lactation, from 0.68 to 0.72 between first and third lactation and from 0.75 to 0.81 between second and third lactation. The relatively strong rank correlation suggested that the rankings of animal were consistent between lactations.
34Lower EBV for sires were observed for all MIR CH4 indicator traits compared to the ones calculated for the cows with MIR records as expected. Commonly used dairy sires are intensively selected for production traits. Given the estimated approximate genetic correlations, selecting for milk yield only should reduce slightly MIR CH4 indicator traits which is in line with expectations that animals with high genetic merit for yield are more efficient. However, selection is more on milk solids than on milk yield alone, and therefore the relationship between methane emissions and production traits is complicated and additional studies are required.
4. Conclusions
35In conclusion, this study showed the potential to predict CH4 indicator traits from MIR spectral data based on methane indicator traits published in the literature and therefore, its potential use to screen a large dairy cow population. The obtained results showed also the existence of large phenotypic and genetic variability of these MIR CH4 indicator traits suggesting a potential phenotypic and genetic variability of CH4 content eructed by dairy cows.
Acknowledgements
36This research received financial support from GreenHouseMilk, a Marie Curie initial training network, funded by the European Commission FP-7 and this paper does not necessarily reflect the view of this institution. Authors are grateful to University of Liege (SEGI facility) for the use of NIC3 supercomputer. The authors also acknowledge the support by the Walloon Breeding Association (Ciney, Belgium), Walloon Agricultural Research Center (Gembloux, Belgium) and Comité du Lait (Battice, Belgium).
Bibliographie
Banos G. & Coffey M. P., 2010. Genetic association between body energy measured throughout lactation and fertility in dairy cattle. Animal, 4, 189-199.
Bastin C., Gengler N. & Soyeurt H., 2011. Phenotypic and genetic variability of production traits and milk fatty acid contents across days in milk for Walloon Holstein first-parity cows. J. Dairy Sci., 94, 4152-4163.
Beauchemin K.A., Kreuzer M., O'Mara F. & McAllister T.A., 2008. Nutritional management for enteric methane abatement: a review. Austr. J. Exp. Agric., 48, 21-27.
Berry D.P. et al., 2007. Genetics of grass dry matter intake, energy balance, and digestibility in grazing Irish dairy cows. J. Dairy Sci., 90, 4835-4845.
Capper J.L., Cady R.A. & Bauman D.E., 2009. The environmental impact of dairy production: 1944 compared with 2007. J. Anim. Sci., 87, 2160-2167.
Cassandro M., Cecchinato A., Battagin M. & Penasa M., 2010. Genetic parameters of methane production in Holstein Friesian cows. In: Proceeding of the 9th World Congress on Genetics Applied to Livestock Production (WCGALP), 1-6 August 2010, Leipzig, Germany.
Chilliard Y., Ferlay A., Mansbridge R.M. & Doreau M., 2000. Ruminant milk fat plasticity: nutritional control of saturated, polyunsaturated, trans and conjugated fatty acids. Ann. Zootech., 49, 181-205.
Chilliard Y., Martin C., Rouel J. & Doreau M., 2009. Milk fatty acids in dairy cows fed whole crude linseed, extruded linseed, or linseed oil, and their relationship with methane output. J. Dairy Sci., 92, 5199-5211.
Couvreur S. et al., 2007. Composition of milk fat from cows selected for milk fat globule size and offered either fresh pasture or a corn silage-based diet. J. Dairy Sci., 90, 392-403.
de Haas Y. et al., 2011. Genetic parameters for predicted methane production and potential for reducing enteric emissions through genomic selection. J. Dairy Sci., 94, 6122-6134.
Dehareng F. et al., 2012. Potential use of milk mid-infrared spectra to predict individual methane emission of dairy cows. Animal, 6, 1694-1701.
Demeyer D.I. & van Nevel C.J., 1975. Methanogenesis, an integrated part of carbohydrate fermentation and its control. In: McDonald I.W. & Warner A.C.I., eds. Digestion and metabolism in the ruminant. Armidale, Australia: University of New England, 366-382.
Dijkstra J. et al., 2011. Relationships between methane production and milk fatty acid profiles in dairy cattle. Anim. Feed Sci. Tech., 166-167, 590-595.
Friggens N.C. & Badsberg J.H., 2007. The effect of breed and parity on curves of body condition during lactation estimated using a nonlinear function. Animal, 1, 565-574.
Garnsworthy P.C., Craigon J., Hernandez-Medrano J.H. & Saunders N., 2012. Variation among individual dairy cows in methane measurements made on farm during milking. J. Dairy Sci., 95, 3181-3189.
Gengler N., Wiggans G.R. & Gillon A., 2005. Adjustment for heterogeneous covariance due to herd milk yield by transformation of test-day random regressions. J. Dairy Sci., 88, 2981-2990.
Grainger C. et al., 2008. Use of monensin controlled-release capsules to reduce methane emissions and improve milk production of dairy cows offered pasture supplemented with grain. J. Dairy Sci., 91, 1159-1165.
Grainger C. et al., 2010. Supplementation with whole cottonseed causes long-term reduction of methane emissions from lactating dairy cows offered a forage and cereal grain diet. J. Dairy Sci., 93, 2612-2619.
Hegarty R.S., Goopy J.P., Herd R.M. & McCorkell B., 2007. Cattle selected for lower residual feed intake have reduced daily methane production. J. Anim. Sci., 85, 1479-1486.
Heimeier D. et al., 2010. Genetic basis for methane emission in the dairy cow. In: Proceedings of the 4th International Conference on Greenhouse Gases and Animal Agriculture, Banff, Canada, 95-96.
IPCC (Intergovernmental Panel on Climate Change), 2006. 2006 IPCC guidelines for national greenhouse gas inventories. Hayama, Japan: Institute for Global Environmental Strategies (IGES).
Johnson K. et al., 1994. Measurement of methane emissions from ruminant livestock using a sulfur hexafluoride tracer technique. Environ. Sci. Tech., 28, 359-362.
Johnson K.A. & Johnson D.E., 1995. Methane emissions from cattle. J. Anim. Sci., 73, 2483-2492.
Lassen J., Madsen J. & Løvendahl P., 2012. Heritability estimates for methane emission in Holstein cows using breath measurements. In: Abstracts of the 63rd Annual Meeting of EAAP, 21-31 August 2012, Bratislava, Slovakia. Wageningen, The Netherlands: Wageningen Academic Publishers, 86.
Madsen J. et al., 2010. Methane and carbon dioxide ratio in excreted air for quantification of methane production in ruminants. Livest. Sci., 129, 223-227.
Martin C. et al., 2008. Methane output and diet digestibility in response to feeding dairy cows crude linseed, extruded linseed, or linseed oil. J. Anim. Sci., 86, 2642-2650.
Misztal I., 2011. BLUPF90 family of programs, http://nce.ads.uga.edu/wiki/doku.php? id=application_programs, (02/10/2011).
Mohammed R., McGinn S.M. & Beauchemin K.A., 2011. Prediction of enteric methane output from milk fatty acid concentrations and rumen fermentation parameters in dairy cows fed sunflower, flax, or canola seeds. J. Dairy Sci., 94, 6057-6068.
Moss A.R., Jouany J.P. & Newbold J., 2000. Methane production by ruminants: its contribution to global warming. Ann. Zootech., 49, 231-253.
NRC (National Research Council), 2001. Nutrient requirements of dairy cattle. 7th revised ed. Washington: National Academic Press, 19.
Smith et al., 2007. Agriculture. In: Metz B. et al., eds. Contribution of working group III to the 4th assessment report of the Intergovernmental Panel on Climate Change. Cambridge, UK: Cambridge University Press, 499-540.
Sonesson U., Cederberg C. & Berglund M., 2009. Greenhouse gas emissions in milk production. Decision support for climate certification, http://www.klimatmarkningen.se/wp-content/uploads/2009/12/2009-3-milk.pdf, (15/05/13).
Soyeurt H. et al., 2011. Mid-infrared prediction of bovine milk fatty acids across multiple breeds, production systems and countries. J. Dairy Sci., 94, 1657-1667.
van Zijderveld S.M. et al., 2011. Dietary inclusion of diallyl disulfide, yucca powder, calcium fumarate, an extruded linseed product, or medium-chain fatty acids does not affect methane production in lactating dairy cows. J. Dairy Sci., 94, 3094-3104.
Wall E., Simm G. & Moran D., 2010. Developing breeding schemes to assist mitigation of greenhouse gas emissions. Animal, 4, 366-376.
