


- Accueil
- Volume 20 (2016)
- Numéro 1
- Frequently recorded sensor data may correctly provide health status of cows if data are handled carefully and errors are filtered away


Visualisation(s): 2212 (46 ULiège)
Téléchargement(s): 377 (4 ULiège)

Frequently recorded sensor data may correctly provide health status of cows if data are handled carefully and errors are filtered away

Notes de la rédaction
Received on February 17, 2015; accepted on November 12, 2015
Résumé
Les données collectées de manière répétée par des capteurs peuvent fournir des informations correctes sur le statut sanitaire des vaches uniquement si ces données sont traitées avec rigueur et que les erreurs sont filtrées
Description du sujet. La mise en place d’outils d’aide à la décision basés sur des capteurs placés au sein des fermes laitières commerciales dépend fortement de la fiabilité du système. Les problèmes liés aux capteurs engendrent du bruit et des données incomplètes, limitant donc leur utilisation. De plus, il est nécessaire que les résultats soient présentés de manière simple et utile. Ces questions sont illustrées sur base d’un capteur et d’un système d’aide à la décision liés à la détection des mammites.
Objectifs. Cette étude a pour objectif de fournir et d’évaluer un système modulaire applicable à tout le système, depuis le capteur jusqu’à l’outil d’aide à la décision.
Méthode. Le cas particulier des mammites a été choisi sur base de son importance économique, de son impact sur le bien-être des vaches laitières et parce que nous avons travaillé avec un capteur commercial de mammites. Les problèmes avec les capteurs qui engendrent du bruit et des données incomplètes sont décrits et l’importance d’une série de modules de filtres et de contrôles a été démontrée afin d’avoir des systèmes fonctionnels à des fins de gestion de troupeau. Finalement, une méthode fiable doit être utilisée pour interpréter et présenter les données aux utilisateurs finaux afin qu’elles soient faciles à appréhender.
Résultats. Filtrer et pré-ajuster les données brutes est important dans la conception d’algorithmes robustes et fiables pour une utilisation quotidienne. La redéfinition des caractères est nécessaire, permettant de passer de quelques groupes traditionnels à une définition continue jusqu’à des actions orientées par classe de statut sanitaire. Aussi, pour ce cas particulier se focalisant sur les mammites, l’affectation aux groupes « irrémédiablement malades » peut être utile afin d’attirer l’attention sur les nouveaux cas de mammite aigüe.
Conclusions. L’utilisation combinée de filtres, de routines de correction et de modèles de séries temporelles menant à des catégories orientées par rapport à l’action à prendre est nécessaire afin de fournir des outils d’aide à la décision simple et robuste. Les systèmes peuvent être fortement améliorés en ouvrant la porte au transfert de données entre des groupes d’utilisateurs et aux bases de données communes, aussi à des fins de sélection génétique.
Abstract
Description of the subject. The implementation of sensor based decision support in commercial dairy herds is highly dependent on having reliable systems. Problems with sensors give missing and noisy data hampering their use. Also, the presentation of results needs to be in a form which is simple and useful. These issues were addressed using a mastitis sensor and decision support as example.
Objectives. This study aims at providing and evaluating a modular system applicable to the pipeline from sensor to decision support.
Method. The case of mastitis was chosen as it is of economic importance and also affects welfare of cows, and because we have worked with a commercial sensor. The problems with sensors causing missing data and noise are described and a range of filtering and monitoring modules are shown to be important to make systems functional for herd management purposes. On top of this a solid method needs to be used to interpret and present data to end users, in terms of easy to read categories.
Results. Filtering and pre-adjustments of raw data are important in making algorithms robust and reliable for daily use. Re-definition of traits is needed going from traditional few groups to continuous definitions, and then to new action oriented health classes. Also, for this case focusing on mastitis, assignment to “permanently sick” groups can be helpful in keeping focus on new acute cases.
Conclusions. The combined use of filtering, fix-up routines and time series models leading into action oriented categories is needed to provide simple and robust decision support. The systems may be vastly improved by opening for transmission of data between user groups and to common databases – also with a few to use data in genetic selection.
Table des matières
1. Introduction
1In recent years, a large number of cow-gadgets with sensors has become available to dairy farmers to facilitate the management of large herds. A number of sensors are commercially available whilst others are in prototype state and mainly used for research purposes. For example, sensors for measuring milk yield (milk meters) are found in many herds whilst more complex and expensive sensor systems like the HerdNavigator (Lattec I/S, Hillrød, Denmark) for detection of cows in heat, with mastitis or ketosis are found in only a few farms. Scientific papers have covered an array of sensors to measure indicator traits. For example, Brandt et al. (2010) reviewed the most important sensor techniques for monitoring milk quality, feeding management and reproduction. Also, equipment for monitoring animal welfare indicators has attracted attention (e.g. Rushen et al., 2012), and for feed efficiency methane emission has been suggested as indicator trait (Pickering et al., 2013).
2Common for all sensor systems is that they consist of the sensor itself and some algorithms for transforming the raw data before presenting it to the dairy manager. The success and uptake of the systems depend strongly on how well the complete system works, and how reliable its predictions are. Much emphasis has been on the validation of alerts produced by a sensor system (e.g. Hogeveen et al., 2010) – is a cow in fact sick when the sensor system says so? However, few studies seem to question the sensor itself – does it actually work? Are measurements accurate? Does the sensor produce a steady stream of data or does it break down all the time? These are some of the questions that need answers, and they may be important steps in developing sophisticated algorithms for transforming data into information useful for the herd managers. Rutten et al. (2013) used four key points to describe the degree to which a sensor system informs the dairy manager: Level I, Technique (sensor and any algorithm for producing sensor data); Level II, Data interpretation (detection algorithm); Level III, Integration of information (decision support and monitoring); and Level IV, Decision making (farmer or autonomous). These levels defined by Rutten et al. (2013) are used in the remainder of this document. Additionally, two other potentially interesting levels not mentioned by Rutten et al. (2013) are used: Level 0 which validates the sensor itself, and Level V which exchanges data to and with sharing databases.
3The aims of this paper are:
4– to demonstrate potential problems at Level 0 and ways to fix them;
5– to demonstrate potential utilization of raw sensor data (Level I to IV);
6– for Level V, to discuss joint use of data to the benefit of users and maybe also producers of sensor based systems.
7For these purposes we used data from the online cell count sensor (OCC; DeLaval International AB, Tumba, Sweden). This sensor can be installed in automatic milking systems (AMS) and is used for monitoring cow udder health. An algorithm for mastitis detection using the OCC sensor has been developed (Sørensen et al., 2016). The examples provided in this paper are extracts from this work – the problems we encountered and how we solved them. Finally, we will discuss future potentials for the OCC sensor systems which may be applied to other types of sensor systems.
2. Materials and methods
2.1. The OCC sensor
8The sensor is designed for installation in VMS milking robots (Voluntary Milking System, DeLaval International AB, Tumba, Sweden). It is an online sensor which implies measurements from a composite milk sample collected during milking of a cow. The OCC sensor uses the same techniques for measuring the somatic cell count (SCC) as the DeLaval Cell Counter (DCC; DeLaval International AB, Tumba, Sweden). A small milk sample is mixed with a coloring agent and the stained somatic cells are then optically measured, and using a simple calibration expressed as SCC to be used in the management software. Somatic cell count measured with the DCC is highly correlated (i.e. no significant difference) with fluorescence based cell counting using CombiFoss equipment (Foss Electric, Hillerød, Denmark) currently accepted as gold standard for measuring SCC (e.g. Ruegg et al., 2005). High SCC values are indicators of intra-mammary infection (mastitis) usually caused by pathogens invading the mammary gland (e.g. Harmon, 1994). Thus, the OCC sensor system is used for automatic monitoring of udder health, but in the initial version it does not produce any alerts or decision support, but only a timeline with SCC.
2.2. Architecture of the OCC sensor and decision support system
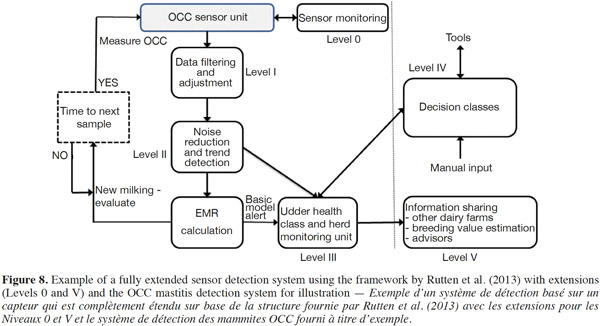
9We built a new algorithm for the OCC mastitis detection system based on several modules (Figure 1) that are described below. The “sensor monitoring”-module checks the sensor itself; if it is running properly and if data are recorded. It is not part of the work by Sørensen et al. (2016) but should preferably be part of any sensor system and coupled with a simple alert system for system failure. A “data filter and adjustment”-module ensures that new, raw OCC measurements are valid and fit for further processing. The core function uses an exponential smoothing algorithm for reduction of data noise and detection of any data trends, i.e. increase in SCC values which could indicate mastitis. The OCC levels and OCC trends are estimated, which are then combined and transformed into a continuous [0;1]-scale in the “elevated mastitis risk (EMR)”-module, where values close to zero indicate no risk of mastitis and values close to one indicate high risk of mastitis. From the EMR value, a basic alert is initially created using a simple threshold (not displayed).
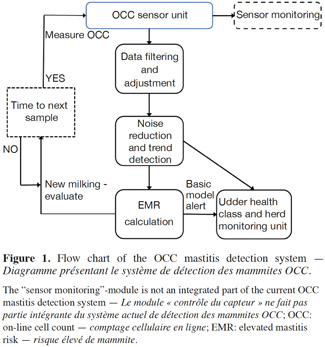
10In the case of mastitis, a basic model alert system may cause multiple alerts over time for individual cows, especially if cows are suffering from persistent intra-mammary inflammations (IMI). The dairy manager may consider such alerts to be false and may then lose confidence in the system. Thus, an additional module ‘udder health and herd monitoring unit’ can be added to the OCC detection system where all cows in the herd are dynamically assigned to one of six health classes (Sørensen et al., 2016). Cows likely to suffer from “persistent IMI” are characterized by increased variation among the OCC measurements and this is used to assign cows to this specific health class. The remaining health classes are “acute” (high risk of mastitis coupled with first alert in a series of alerts), for subsequent alerts cows are assigned to the “sick” class. The “less healthy” class contains cows with intermediate risk of mastitis, the “almost healthy” class contains cows with low risk of mastitis, and finally the “healthy” class contains cows with no risk of mastitis.
11Finally, the system includes a feedback module (“Time to next sample”; not used for the examples presented in this paper) which determines when to collect the next milk sample for OCC measurement from each cow. By default a cow is sampled at every milking, but sampling can be reduced to request an OCC measurement every 24 or 36 h. Time between measurements is reduced if EMR values are above a set threshold. Reduced sampling intensity reduces liquid use and running expenses.
12The aforementioned forms the content of the advanced OCC mastitis detection system. In the following we will describe the modules in more details and additional modules to aid decision support and information sharing. This will include results obtained during the building and validation process.
3. Results and discussion
3.1. Sensor monitoring (Level 0)
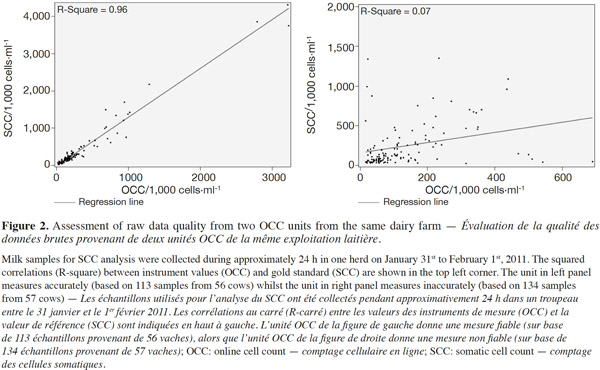
13The first step for evaluating any sensor system is to periodically monitor how well the sensor measures. It may not be possible to integrate this in the monitoring system because the calculation of measuring accuracy requires a suitable gold standard. In the case of OCC sensor, it should measure SCC on a level comparable to a gold standard, which in our case is lab-based SCC using flow cytometry (CombiFoss, Foss Electric, Hillerød, Denmark) as is used in the national milk recording scheme.
14When properly adjusted and maintained the OCC sensor measures SCC accurately (Figure 2 left panel). But in figure 2 (right panel) an OCC sensor from the same farm is providing inaccurate measurements. This fault will remain unnoticed if the dairy manager has no means for comparison because the sensor still produces data, but of unreliable quality. In the case of the OCC detection system it is possible to construct an on-farm system for periodical monitoring of measuring accuracy if milk recording schemes are employed and online data extraction from milk recording databases is made available. However, for other detection systems, for example automatic lameness detection in dairy cattle (e.g. Thorup et al., 2015), this is not possible because visual inspection of the cow is necessary to assess system output.
15Another problem is occasional breakdowns of sensor systems where, in the case of the OCC sensor, no or faulty data are produced resulting in either a missing or zero value, the latter indicating measurement error. Common reasons in the case of the OCC sensor are empty staining fluid container or full waste bin, but also clogging of tubes and broken camera cause breakdowns. Data flow can be monitored simply by calculating the proportion of requested milkings with OCC measurements. This can be coupled with an alert system if for example the proportion falls below 90%. Overall, a proportion of 86.1% was calculated in the study by Sørensen et al. (2016) based on 595,927 milkings from six herds. Similar systems can be incorporated in most sensor systems by simply calculating the ratio of actual measurements to expected measurements.
3.2. Filtering and adjustment of raw data (Level I)
16Our interpretation of the framework described by Rutten et al. (2013) is that Level I output is the raw data produced by the sensor. However, the aim of any sensor system is to extract important trends in data from measurement noise. Using the OCC sensor for demonstration this involves removal of wrongly measurements not recognized by the sensor itself. Also standardization of values are necessary where cows are measured by two different sensors; this could be the case where cows have access to more than one AMS unit each containing an OCC sensor unit. We chose to place this initial data filtering at Level I.
17The OCC values for a cow (Figure 3) clearly show a large variation along time when raw data are used. With this kind of data, the dairy manager could rely on a SCC threshold of 200,000 cells·ml-1 for identification of cows with mastitis (Dohoo et al., 1991). This kind of information level is inadequate if he should check this cow every time a measurement exceeds the detection threshold.
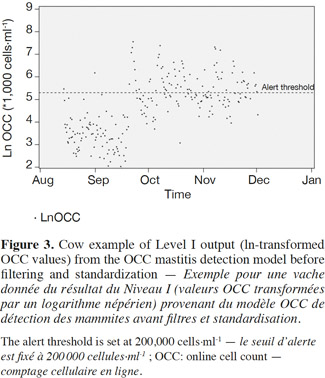
18The aim was to develop an algorithm that could detect a clear signal among a lot of noise either caused by instrument or cow variation. The algorithm was to run after each milking, so the first step was to check each new OCC measurement for validity. Further processing was abandoned if the raw OCC value was missing or zero, the latter indicating a measurement error. Otherwise the raw OCC value was accepted and ln-transformed. Subsequently data were filtered to remove other unwanted values, for example to avoid false positive alerts caused by momentarily very low OCC measurements. This problem can be illustrated by three subsequent OCC measurements where the first is 150,000 cells·ml-1, the second is 4,000 cells·ml-1, and the third is 130,000 cells·ml-1. The very low second measurement may be enough to cause an alert at the third measurement, if it is accepted for further processing because of the sudden increase. Thus, new measurements were only accepted if ln OCC < 6.00 and ln OCC > smoothed OCC – 2.00. The smoothed OCC value is described in section 3.3.
19Also, the sensor units may have some drift over time between service and re-calibration. For cows that had access to different sensor units, measurements needed to be standardized in order to minimize bias and noise caused by sensors. Standardization was achieved using first, a slow acting (little weight on new data single exponential smoother) (Hyndman et al., 2008) at sensor level and then using the difference between the smoothed OCC (see section 3.3.) value and a set default mean of ln OCC = 4.00 (chosen arbitrarily to reflect a healthy cow) to adjust the observed OCC value. The output from this module is a standardized OCC value; this changes the mean of the OCC values but does not affect variation.
3.3. Cow-level noise reduction and trend detection (Level II)
20The next module acts on data as a time series analyzer at cow level, using a double exponential smoothing (Hyndman et al., 2008) algorithm accounting for non-equidistance between measurements. This step had two functions:
21– it reduces data variation considerably (noise reduction);
22– it captures any trend exhibited by the data.
23The output from this step was two variables termed OCC_level and OCC_trend. Jointly, these two values produced the forecasted values (smoothed OCC) that were used as another filter (see section 3.2.) to check for extremely low values. Exponential smoothing algorithms have wide application and may be used for trend detection in any sensor output measuring artifacts of traits prone to continuous change, for example in estrus detection using activity data (Ahmed et al., 2015).
24Accounting for periods without data. Shorter or longer periods without any data caused by sensor breakdowns can result in false alerts due to sudden shifts in data levels before and after such a period. The double smoothing algorithm needed to account for this. The smoothing algorithm is primed using standard SCC lactation curves enabling start of the algorithm at any time point during lactation. This feature was also used to work across periods without any data by slowly approaching the priming values by 5% increase or decline per milking. If the priming value was reached, this was equal to restarting the algorithm. Similarly, a “burn-in” routine was included at start of new lactations for quick stabilization of the smoothing series meaning that weight on new data was increased.
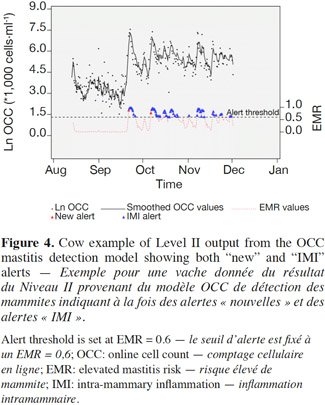
25Calculating EMR values and setting basic alerts. The OCC_level and OCC_trend were latent mastitis indicator variables that were combined and converted into a single continuous [0;1]-scale variable, EMR (Højsgaard et al., 2010). The EMR value eliminates the traditional thinking of dividing mastitis cases into clinical or subclinical cases; instead the degree of mastitis is quantified. Running the OCC mastitis detection model at Level II will produce some basic mastitis alerts, “new” and “IMI” alerts (output from “EMR”-module), based on the EMR values.
26In figure 4, Level II output from the OCC mastitis detection model is illustrated. The smoothed OCC values (solid line) represent the sum of OCC_level and OCC_trend and show the noise reduction, i.e. less variance, compared to the raw OCC measurements. Around September 20 a large and rapid increase in OCC level is observed resulting in a “new” alert at September 20 and indicating presence of IMI. Unfortunately, this cow was not treated and multiple IMI alerts were observed throughout the rest of the shown time period indicating that the cow may suffer from persistent IMI. As with Level I (raw OCC data), the dairy manager will also have to check this cow too often using Level II information.
3.4. Evalution of sensor system performance
27According to Rutten et al. (2013), Level II output is used for evaluation of the sensor system, typically done by calculation of sensitivity (Se), the proportion of events (i.e. mastitis cases) correctly identified by the sensor system, and specificity (Sp), the proportion of non events (i.e. healthy cows) correctly identified as such. A Se of 0.89 was found for the OCC detection model when IMI alert was used and veterinary treatments of mastitis were used a gold standard for mastitis (Sørensen et al., 2016) whereas when new alerts were used, Se dropped to 0.43. The difference can be explained by the time of new alerts in relation to any treatment. New alerts may in some cases be seen several days or even weeks before the cow is treated, whereas if the cow is “sick” with IMI at the time of treatment the alert is much more likely to coincide with the time of treatment. A specificity of 0.99 was found for the OCC detection system (Sørensen et al., 2016). This shows that validation of sensor systems should be interpreted with care. This was emphasized by the result presented by Rutten et al. (2013) where Se and Sp of different mastitis detection systems varied from 0.05 to 1.00 and 0.18 to 0.99, respectively. Some of this variation is caused by use of different sensors and algorithms for creation of alerts but also different gold standards for mastitis and different methods for relating alerts and events have been used.
3.5. Dynamic assigning to “udder health classes” (Level III)
28Level III output from sensor systems enables output for decision support (Rutten et al., 2013). In the case of mastitis this could be information to support a decision whether or not to treat or cull a cow. For other sensor systems this could, for example, be an alert for a cow in heat followed by a probability that the cow is in fact in heat, i.e. strength of sensor signal (e.g. O’Connell et al., 2011). Applying the “udder health and herd monitoring unit” changes the output type from the OCC mastitis detection system considerably. Instead of a basic alert system, “new” and “IMI” alerts, the cow is now assigned to a specific udder health class (Figure 5) where further action may depend on the assigned health class. Assignment of cows to an udder health class is mainly based on the EMR values but also the smoothed OCC values and OCC variance are used. Cows in the “acute mastitis” class only contain cows with “new” alerts, and cows in the “sick” class are determined by IMI alerts. Cows in the “less healthy” and “almost healthy” classes are determined by EMR values, where 0.20 > EMR > 0.60 and 0.04 > EMR ≥ 0.20 for “less healthy” and “almost healthy”, respectively. Cows in the “healthy” class are required to have EMR values ≤ 0.04. Additionally, they were required to have smoothed OCC values below 50,000 cells·ml-1 to avoid cows with higher but stable OCC values to be considered as healthy. Assignment of cows to the “persistent IMI” class is explained below. Cows were assigned to each health class in sequence to avoid cows being placed in more than one health class. Parity or breed was not taken into account mainly because OCC values have a minimal effect on EMR values compared to OCC variation.
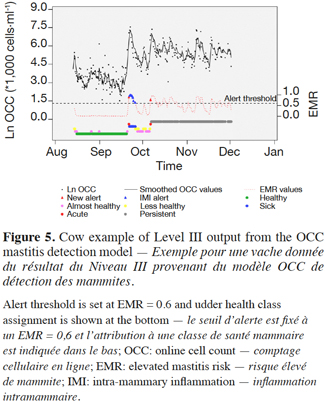
29Using the same cow as before to illustrate health class assignment (Figure 5), the only udder health class which requires the dairy manager to check the cow is the “acute mastitis”-class (red color); the cow is assigned to this class twice along the trajectory which brings the number of daily alerts down to a manageable low number, (avg. 0.8 per 60 cows; Sørensen et al., pers. comm.). Around a case of possible acute mastitis (September 20), a cow typically switch between several health classes, either because it is getting sicker (dark blue color = “sick”, “less healthy” = yellow color, and “almost healthy” = light blue color) or because of an ongoing recovery phase.
30Level III sensor systems may also include integration of other data sources to improve detection for example when two different sensors capture different aspects of a trait (e.g. O’Connell et al., 2011). A disadvantage of the current OCC mastitis detection system is that only the cow is pointed out as having mastitis, not the specific quarter(s). Electric conductivity (EC) at quarter level is measured continuously in most brands of AMS. On itself EC is not highly reliable for mastitis detection (e.g. Norberg et al., 2004) as not all mastitis cases affect EC level. However, when comparing EC between different quarters it may be possible to identify a quarter which separates from the rest. Thus, EC could add valuable information to the OCC detection system.
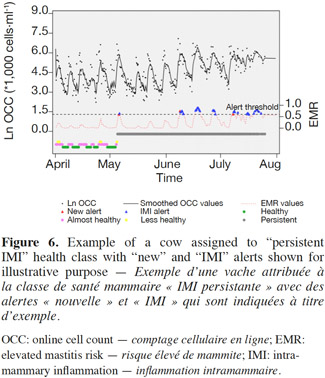
31Approximately two weeks after the first “acute mastitis” alert this cow is assigned to the “persistent IMI” class, sometimes termed chronic mastitis. If not accounted for, this udder health class can be problematic in any mastitis detection system causing multiple alerts over time as seen in section 3.3. A typical pathogen causing mastitis is Staphylococcus aureus which is characterized by its invasion of mammary epithelial cells and repetitive shedding cycle (Sears et al., 1990) which are likely to be reflected in fluctuating SCC patterns over time. This characteristic was used to develop an algorithm for detection of “persistent IMI” for the OCC mastitis detection model. A slow-moving, single exponential smoothing algorithm was applied at cow level and a moving OCC variance was derived from this. If a cow then exceeded a fixed variance threshold for at least 10 d and had smoothed OCC value> 100,000 cells·ml-1, it was assigned to the “persistent IMI” class overriding any “new” or “IMI” alerts. A good example of a cow suffering from persistent IMI and expressing a clear fluctuating smoothed OCC pattern is shown in figure 6.
3.6. Herd level monitoring tool – the managers’ overview (Level III)
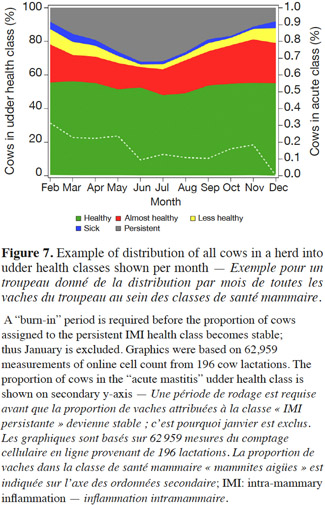
32Besides providing a clearer picture of the udder health of a single cow over time, the udder health class assignment also allows the dairy manager to monitor the entire herd because all cows are assigned to a health class. Figure 7 shows an example of herd dynamics of grouping of cows into health classes. In this case a season effect is evident with more cows being assigned to the persistent IMI class during the summer months. Also, it should be noted that the proportion of cows in the persistent IMI class is very low in the beginning of the period, which is likely an artefact caused by the aforementioned burn-in period. This type of information can be used to measure the effect of initiatives to improve the overall udder health of the herd.
3.7. Further development of sensor based modular decision support systems (Levels IV and V)
33We have used the OCC mastitis sensor system to demonstrate the importance of the correct level of information provided to the users of a sensor system. The raw data stream (Level I) is inadequate to provide the user with enough information to make the correct decision. Raw data need to be filtered and sifted through an algorithm (Level II) for generation of useful information, and time series methods can be efficient in doing so. However one should remember to evaluate the sensor itself (Level 0) and the quality of the data it produces. And finally, results need to be presented in a useful still simple form, such as health classes (Level III).
34The International Committee for Animal Recording (ICAR) establishes rules and guidelines for identifying animals, registration of pedigrees, and recording of animal performance and evaluation (www.ICAR.org). Currently, the ICAR Test Center performs tests for approval of recording devices focused on milk volume and samples. May we suggest that sensor based systems undergo similar test for approval and have their performance documented.
35The OCC mastitis detection model uses a simple estimation approach, double exponential smoothing to treat data, resulting in a basic alert system. More complex algorithms have been used to treat data in the case of mastitis detection (e.g. Chagunda et al., 2006) but in our case a simple approach produces similarly good results, Se = 0.89 and Sp = 0.99 (Sørensen et al., 2016) compared to Se = 0.82 and Sp = 0.99 (Chagunda et al., 2006) using a similar gold standard and validation procedure. As demonstrated in the present, information at Level III is needed in our case to give the dairy manager adequate and reliable information about what to do with a certain cow. Again we use a simple approach without additional information. The results rely on the dairy manager to make the correct decision. Rutten et al. (2013) suggest that Level III also contains a decision support model which makes suggestions about what to do with a cow. In our case this would require additional information and some predetermined parameters such as previous mastitis history, milk yield, number of milking quarters, number of future new cows entering the herd, economic parameters, etc. This could be achieved by using the OCC mastitis detection model output to feed the SimHerd program for strategic decision making (Østergaard et al., 2005).
36Figure 8 shows a complete sensor system including Levels 0 to V using the OCC mastitis detection system for demonstration. To our knowledge no current systems include module at Levels IV to V so the following is ideas that could be beneficial for dairy farmers and others using sensor systems.
37Level IV, the actual decision making (Rutten et al., 2013) about what to do with a cow may be more problematic to implement in relation to mastitis detection with human intervention. However, some autonomous decisions can be made by the mastitis sensor system by providing feedback to the AMS units. For example, milk from cows with persistent IMI could be diverted for calf feed or milk from cows with acute mastitis could be discarded. For other systems, for example for heat and lameness detection, cows could automatically be diverted to holding pens for further checking by the dairy manager when detection thresholds are exceeded. Final decisions about treatment, insemination, etc. are made by the dairy manager and could be aided as explained above.
38The final level, Level V, to be described in this study relates to information sharing between sensor system and other systems on or off the farm. A lot of data are collected by sensors which continuously monitor a trait. Currently, on-farm sensor data are stored at the farm but if collected via the internet or by milk recording personnel it can be utilized by other sources, for example for breeding value estimation. Trials are currently taking place in Denmark to utilize AMS data, for example for estimation of breeding values for milking speed (Fogh et al., 2012). Other examples, where the use of extracted continuously monitored data for breeding value estimation could be interesting, include fertility, lameness, udder health, and udder confirmation.
39Also, sensor data may via advisors be shared by farmer networks related to specific topic, e.g. udder health. Reports based on such data may be beneficial in discussion related to improvement and monitoring of herd udder health.
40Finally, manufacturers of the sensor systems may benefit from online access to data produced by the sensors for continuous monitoring of sensor performance. The advantage is to detect and capture problems as early as possible and thereby improve the overall performance of the sensor. This step takes the sensor system back to the Level 0 stage.
4. Conclusions
41A number of sensor systems are manufactured. However, they are only of value to decision support for farmers if the presented data are processed and presented in an understandable way and that data are reliable and robust. To facilitate this the combined used of filtering, fix-up routines and time series models leading into action oriented categories is needed. The systems may be vastly improved by opening for transmission of data between user groups and to common databases – also with a few to use data in genetic selection. A more general approval testing of sensor systems using an agreed set of criteria would also be helpful to farmers considering alternatives for possible investments.
42Abbreviations
43AMS: automatic milking system
44DCC: DeLaval Cell Counter
45EC: electric conductivity
46EMR: elevated mastitis risk
47IMI: intra-mammary inflammation
48OCC: online cell count
49SCC: somatic cell count
50VMS : voluntary milking system
Bibliographie
Ahmed I. et al., 2015. Estrus traits derived from activity measurements are heritable and closely related to the time from calving to first insemination. J. Dairy Sci., 98, 3470-3477.
Brandt M., Haeussermann A. & Hartung E., 2010. Technical solution for analysis of milk constituents and abnormal milk. J. Dairy Sci., 93, 427-436.
Chagunda M.G.G., Friggens N.C., Rasmussen M.D. & Larsen T., 2006. A model for detection of individual cow mastitis based on an indicator measured in milk. J. Dairy Sci., 89, 2980-2998.
Dohoo I.R. & Leslie K.E., 1991. Evaluation of changes in somatic cell count as indicators of new intramammary infections. Prev. Vet. Med., 10, 225-237.
Fogh A., Lauritsen U. & Aamand G.P., 2012. Use of data from electronic milk meters and perspectives in use of other objective measures. In: Proceedings of the 38th ICAR Biennial Session, 28 May-1 June 2012, Cork, Ireland. Roma: ICAR.
Harmon R.J., 1994. Physiology of mastitis and factors affecting somatic cell counts. J. Dairy Sci., 77, 2103-2112.
Hogeveen H., Kamphuis C., Steeneveld W. & Mollenhorst H., 2010. Sensors and clinical mastitis – the quest for the perfect alert. Sensors, 10, 7991-8009.
Højsgaard S. & Friggens N.C., 2010. Quantifying degree of mastitis from common trends in a panel of indicators for mastitis in dairy cows. J. Dairy Sci., 93, 582-592.
Hyndman R.J., Koehler A.B., Ord J.K. & Snyder R.D., 2008. Forecasting with exponential smoothing. Berlin: Springer-Verlag.
Norberg E. et al., 2004. Electrical conductivity of milk: ability to predict mastitis status. J. Dairy Sci., 87, 1099-1107.
O’Connell J. et al., 2011. Combining cattle activity and progesterone measurements using hidden semi-Markov models. J. Agric. Biol. Environ. Stat., 16, 1-16.
Østergaard S. et al., 2005. A stochastic model simulating pathogen-specific mastitis control in a dairy herd. J. Dairy Sci., 88, 4243-4257.
Pickering N.K. et al., 2013. Consensus methods for breeding low methane emitting animals. Animal Selection, Genetics & Genomics Network White Paper, http://www.asggn.org/publications,listing,95,mpwg, (12.03.2015).
Ruegg P.L., Hulland C. & Reith B., 2005. Performance of the direct cell counter used on milk samples obtained from fresh cows. In: Proceedings of the 44th National Mastitis Council Annual Meeting, 01.16-19.2005, Orlando, FL, USA. Madison, WI, USA: National Mastitis Council, 291-292.
Rushen J., Chapinal N. & de Passillé A.M., 2012. Automated monitoring of behavioural-based animal welfare indicators. Anim. Welfare, 21, 339-350.
Rutten C.J., Velthuis A.G.J., Steeneveld W. & Hogeveen H., 2013. Sensors to support health management on dairy farms. J. Dairy Sci., 96, 1928-1952.
Sears P.M. et al., 1990. Shedding pattern of Staphylococcus aureus from bovine intramammary infections. J. Dairy Sci., 73, 2785-2789.
Sørensen L.P., Bjerring M. & Løvendahl P., 2016. Monitoring individual cow udder health in automated milking systems using online somatic cell counts. J. Dairy Sci., 99, 608-620.
Thorup V.M. et al., 2015. Lameness detection via leg-mounted accelerometers on dairy cows on four commercial farms. Animal, 9(10), 1704-1712.
