


- Accueil
- Volume 21 (2017)
- Numéro 4
- Cow milk coagulation: process description, variation factors and evaluation methodologies. A review


Visualisation(s): 44746 (122 ULiège)
Téléchargement(s): 2622 (20 ULiège)

Cow milk coagulation: process description, variation factors and evaluation methodologies. A review

Notes de la rédaction
Received on December 9, 2015; accepted on May 5, 2017 ; available online 8 August 2017.
This article is distributed under the terms and conditions of the CC-BY License (http://creativecommons.org/licenses/by/4.0)
Résumé
Coagulation du lait : description du processus, facteurs de variation et évaluation des méthodologies (synthèse bibliographique)
Introduction. Pour les producteurs laitiers qui souhaitent transformer leur lait, l’aptitude à la coagulation du lait est un paramètre important. Elle permet en effet de transformer le lait en fromage. Dès lors, il convient de bien comprendre son processus et les techniques pour la mesurer afin d’obtenir le meilleur rendement de transformation. L’objectif de cette revue bibliographique est de décrire le procédé de coagulation du lait, les facteurs qui l’influencent et les méthodes pour mesurer la coagulation du lait au niveau du laboratoire.
Littérature. Le processus de transformation du lait en fromage implique trois étapes : la coagulation, l’égouttage et le raffinage. La coagulation utilisant la présure est l’étape clé. Elle dépend de nombreux facteurs (pH, teneur en calcium, température, etc.). Certains laits ne coagulent jamais. Pour mesurer l’aptitude du lait à la coagulation, le Formagraph, le Computerized Renneting Meter (CRM) et l’Optigraph furent développés (méthodes de référence). Ils fournissent différents paramètres sur les capacités du lait à coaguler. Des équations ont également été développées grâce à la spectrométrie infrarouge afin de prédire les paramètres obtenus par les méthodes de référence.
Conclusions. Bien que le mécanisme de coagulation du lait soit connu, la problématique des laits non coagulants persiste toujours et représente un réel challenge en termes de rendement. L’utilisation de l’infrarouge est une alternative plus rapide aux méthodes de référence pour mesurer les propriétés de coagulation du lait. Toutefois, les équations de prédiction doivent encore être améliorées.
Abstract
Introduction. For dairy producers who want to transform their milk, the ability of milk to coagulate is an important parameter. It makes it possible to transform milk into cheese. Therefore, it is necessary to understand the coagulation process and the techniques to measure it in order to achieve the best transformation performance. The objective of this review is to describe the milk coagulation process, the factors influencing it and the methods for measuring the coagulation of milk at lab level.
Literature. The processing of milk into cheese involves three steps: coagulation, dewatering and refining. Coagulation is a key step which involves the use of rennet and depends on several parameters (pH, calcium content, temperature, etc.). Some milks never coagulate. To measure the coagulation ability of milk and identify different parameters in milk coagulation properties, the Formagraph, the computerized renneting meter and the Optigraph have been developed (reference methods). Equations have been developed using infrared spectrometry to predict the parameters obtained by the reference methods.
Conclusions. The milk coagulation mechanism is known. However, the issue of non-coagulating milk persists and represents a real challenge in terms of yield. The use of infrared is a faster alternative to reference methods that measure the coagulation properties of milk, but still requires an improvement in prediction equations.
Table des matières
1. Introduction
1Many agricultural products are perishable. A constant human concern has been to increase shelf-life of food (FAO, 1987). Since the European dairy crisis in 2009, the increase in volatility of milk prices and the abolition of milk quotas in 2015, many farmers have wanted to diversify and offer products derived from milk in order to increase its added value and gain access to economically attractive commercialization systems such as farm gate sale and local commercialization. Products commonly sold at the farm are yogurt, butter and cheese. Milk coagulation is a key step in making cheese, as milk that does not coagulate cannot be transformed; if it cannot be transformed, derivative products cannot be produced and the added value is nil. Mixing milk with low (or poor) coagulation properties with milk with good (or even excellent) coagulation properties affects the quality and performance of the final products. For example, the incorporation of milk with poor coagulation ability with milk with good coagulation ability negatively affects the properties of the mixture in a nonlinear manner, similar to a titration. The incorporation of just 25% of non-coagulating milk adversely affects the overall coagulation properties (Frederiksen et al., 2011) and the farmer’s financial gains.
2Moreover, the trend in dairy production can be described as a reduction in the number of dairy farms on the one hand, and an increase in herd sizes and lactational yield per cow on the other. For example, in the Walloon Region between 1990 and 2012, the number of dairy farmers fell (- 68%), but there were increases in mean herd size per farm (+ 67%), milk yield (+ 63%) and milk production per farm (+ 252%) (La Spina, 2016). In this situation, herd managers spend less time in contact with animals (Brandt et al., 2010). New tools are needed to help farmers manage their constantly evolving farms. Determination of animals’ phenotypes has become a very important field of research and can be used to develop these new tools. The phenotype of an animal can be described as the interaction between its genetics and its environment. In this case, the phenotype can be considered as the milk’s coagulation ability, fat content, etc. Methods that routinely and accurately measure and predict animal phenotypes are being developed rapidly (De Marchi et al., 2014). Mid-infrared spectroscopy has been proposed as a potential tool to measure the milk coagulation properties at the population level.
3Milk coagulation properties (MCPs) have been extensively studied (Pretto et al., 2011). They are very important because they influence cheese-making ability, cheese yield and cheese quality (Jõudu et al., 2008). It is known that milk that aggregates and forms a firm curd soon after the addition of the clotting enzyme is expected to produce a higher cheese yield (Ikonen et al., 2004; Cipolat-Gotet et al., 2012). The quality and amount of cheese obtained (per volume of milk and per gram of protein in milk) are also key factors from an economic point of view (Wedholm et al., 2006). In some cases (e.g. in Parmigiano-Reggiano cheese production), MCPs have therefore been taken into account in payment systems based on milk quality for several years (Pretto et al., 2013).
4The objective of this review is to make an inventory of the factors that influence the ability of milk to clot and the techniques for measuring them in the laboratory. The database used is Scopus. This review is divided into four parts. The first part describes the milk coagulation process, the second deals with the factors influencing the coagulation of milk, the third is about the determination of milk coagulation properties and the fourth describes the use of infrared spectroscopy to predict the ability of milk to coagulate.
2. Description of the milk coagulation process
5The process of transforming milk into cheese consists of three main steps: coagulation, dewatering and refining. Milk coagulation is a key step that is mainly affected by the protein composition of milk and that strongly influences the efficiency of cheese production. For good cheesemaking, milk must have good reactivity with rennet, provide a firm curd and have good synaeresis ability (allow plenty of whey to be expelled when the curd is contracted) (De Marchi et al., 2007; Cipolat-Gotet et al., 2012). During the processing of milk into cheese, the fat and casein are concentrated, while the other components of milk, mainly water, are removed with the whey (Fox & Mc Sweeney, 2004; Walstra et al., 2006). Vignola (2002) defined milk coagulation as the destabilization of the casein micelles, which flocculate and aggregate to form a gel enclosing the soluble milk components. It can be caused by acidification, by the action of an enzyme or by a combination of the two.
6Acid coagulation precipitates caseins at their isoelectric point. It may result from biological acidification using enzymes that progressively convert lactose into lactic acid, or from chemical acidification (injection of carbon dioxide, addition of glucono-δ-lactone, etc.). Whatever the process, the acidification results in a drop in the degree of dissociation of the acidic groups of calcium phosphocaseinate. The H+ ions released by acidification gradually neutralize the electronegative charges: electrostatic repulsion decreases with H+ environmental enrichment and then disappears. At room temperature, micelles begin to aggregate at pH 5.2. When the isoelectric pH of casein is reached (pH 4.6), there is total flocculation. If acidification occurs in milk at rest, a continuous structure is formed that occupies all the original milk volume (gel or clot); if the milk is in motion, a precipitate emerges bathing in the dispersing phase. Acid coagulation is strongly dependent on temperature. Increasing the milk temperature above +5 °C allows flocculation to occur at decreasing values of acidity. In contrast, for milk temperatures below +5 °C, flocculation is no longer possible by the acid method; the milk viscosity increases and it is impossible to obtain a true gel. The curd obtained by this method is inelastic and brittle, with very limited and very slow strengthening; its porosity is good and it presents high permeability but its ability to drain is limited (FAO, 1987; Lucey & Singh, 1998; Jeantet et al., 2008).
7Enzymatic coagulation transforms liquid milk into gel by the action of proteolytic enzymes. Calf rennet is the coagulant traditionally used for coagulation of milk. The term “rennet” is given to the coagulant extracted from the abomasum of young ruminants slaughtered before weaning. It contains two active fractions: chymosin (95% of the enzyme activity) and pepsin. The extraction of the rennet is carried out by the maceration of the abomasum, which is sliced up and left in a saline solution for several days at pH 5.0–5.5. The maceration liquor is clarified with alum and then filtered. Chymosin hydrolyses casein, and has a dual activity: high activity of the κ-casein located in the periphery of the casein micelles, and thus causes micelle destabilization during the coagulation phase, and it has a slight global proteolysis activity on the various casein fractions, which mainly occurs during cheese ripening. The proteolytic activity of rennet is strongly influenced by environmental factors that affect both the state of the substrate and its environment. The optimum pH for the coagulant activity of rennet on milk is about 5.5. The optimum temperature for rennet activity is 40–42 °C; below 20 °C, the activity is slight and above 65 °C it is totally inactive. The concentration of Ca++ ions influences rennet activity. More precisely, it is the ratio of calcium to nitrogen that is important; normal milk clotting occurs at a ratio of 0.23 and “slow” clotting occurs at a ratio of 0.20. Temperature variations experienced by the milk before adding rennet also modify its coagulation properties. Cooling the milk leads to the solubilisation of casein. The stability of the micelles is thereby increased, and it follows that the action of rennet is inhibited. In the case of heating, if the heat treatment is moderate (≤ 60 °C), the saline balances change, insoluble phosphate colloidal forms increase, and the size of the micelles increases. A decrease in stability follows, promoting the action of rennet (FAO, 1987; Dejmek & Walstra, 1993; Fox & Mc Sweeney, 2004).
8Furthermore, although rennet is used most often, other coagulants are available from animal, vegetable or microbial sources. Trypsin and chymotrypsin of animal origin are used less because they lead to significant changes in manufacturing methods and in the quality of finished products. Swine pepsin is a protease with a more acidic character than chymosin. Its activity is good in an acid environment, but decreases sharply above pH 6.3. At the pH of fresh milk, coagulation does not occur. Bovine pepsin appears very similar to rennet for clotting and its activity is less pH-dependent than porcine pepsin. Chicken pepsin also may be used. Coagulant preparations can also be obtained by the maceration of various organs of plants (e.g. cleavers, artichoke, thistle, fig, papaya, pineapple). However, the resulting coagulant activity is highly variable, as it is heavily influenced by the state of maturity of the plant and by the conditions of collection and storage. Therefore, the use of these protease coagulants is limited to local areas of production. Even some moulds can be used for the coagulation process, for example Endothia parasitica, Mucor pusillus, and Mucor miehei (FAO, 1987; Fox & Mc Sweeney, 1997; Broome & Limsowtin, 1998).
9Generally, coagulation is divided into two steps: the enzymatic phase in which the κ-casein is degraded by chymosin, and the non-enzymatic phase that corresponds to the formation of a gel through the aggregation of degraded micelles. These two phases differ in nature but are not fully separated in time (Frederiksen et al., 2011). During the enzymatic phase, chymosin causes the hydrolysis of the C-terminal part of the κ-casein, destabilizing the micelles. This hydrolysis produces para-κ-casein (the N-terminal part of κ-casein), which remains attached to the micelles and glycomacropeptide (the C-terminal portion) that will be released into the surrounding liquid. Since the glycomacropeptide is highly charged, the electrostatic potential of the casein micelles strongly decreases, weakening the electrostatic repulsions between the micelles. Its hydrolysis also removes the second factor in the stability of casein: steric repulsion due to the hydration layer. These para-casein molecules lack stabilizing elements and will aggregate in the second phase of coagulation (Walstra et al., 2006). When a sufficient reduction of the repulsive forces (electrostatic, steric and water) at the origin of the colloidal stability is reached, near or contiguous micelles begin to aggregate. These conditions are achieved for a degree of hydrolysis of the κ-casein of about 80% at pH 6.6 (Croguennec et al., 2008). Destabilized micelles will form a three-dimensional network called coagulum, or gel, which traps whey and fat globules. This gel is unstable, and following the contraction of the micelles, it expels the liquid phase out of the curd. This phenomenon, called synaeresis, separates the curd, containing casein and fat, from the whey, containing lactose, minerals and soluble proteins (Vignola, 2002).
3. Factors influencing the coagulation process
10All aspects of the production of curd (enzymatic coagulation, curd firmness, synaeresis) are influenced by the composition of the milk and particularly by the concentrations of casein, calcium and the pH (Fox & Mc Sweeney, 2004).
11Milk composition has a significant effect on the yield and composition of the cheese product. The quantities of casein and fat are one of the main factors influencing the coagulation of milk and its performance. The proportion of fat in relation to casein determines the amount of fat that is found in the dry matter of the cheese product. This ratio also affects the synaeresis and therefore the water content of the final product (Walstra et al., 2006). The casein content of the milk also has an effect on the rate of firming; the gel increases with the concentration of casein. However, the setting time of the curd increases only slightly with the casein content (Vignola, 2002). The size of casein micelles impacts milk coagulation: small micelles will lead to firmer curds (Glantz et al., 2010).
12In addition to the total concentration of the caseins, milk coagulation properties (MCPs) are also influenced by genetic polymorphisms of lactoproteins. Many genetic variants have been identified for each of the milk proteins and relationships between them and coagulation have been demonstrated. Many studies show that variant B of κ-casein promotes coagulation (Nuyts-Petit et al., 1997; Walsh et al., 1998; Patil et al., 2003), while variant E has a negative effect on coagulation (Ikonen et al., 1999a; Ikonen et al., 1999b; Caroli et al., 2000; Wedholm et al., 2006). However, these articles do not specify whether the detected relationship between the genotypes of the proteins and the MCPs was due to different structural properties for each protein variant or a change in the protein composition (Bonfatti et al., 2010). The genotype of κ-casein influences both the casein content in milk and the κ-casein proportion compared with other caseins (Wedholm et al., 2006; Heck et al., 2009). Besides the effect of the κ-casein genotype, the protein composition of the milk is also influenced by the genotype of the β-lactoglobulin and β-casein (Heck et al., 2009): variant B of β-lactoglobulin is less strongly expressed than variant A, which results in a greater concentration of casein (Mayer et al., 1997; Hallen et al., 2008) and improved coagulation properties (Caroli et al., 2009). Variant B of β-casein also has more favorable qualities for good coagulation and the shortest clotting time of all identified variants (Buchberger & Dovč, 2000).
13Milk pH affects the clotting time, rate of firming into gel and maximum firmness. Coagulation is faster, the gel is stronger and the firmness is higher when the pH is in the range of 6.0–6.7 (Remeuf et al., 1991). However, according to Croguennec et al. (2008), the optimum pH for the action of rennet is about 5.1–5.5, and its activity increases with decreasing pH. The importance of titratable acidity for all phases of coagulation should be noted. These phases include the rate of aggregation of the para-casein micelles and the reactivity of rennet. In addition, titratable acidity also influences the rate of synaeresis and determines if the milk is suitable for cheese processing (De Marchi et al., 2009). Titratable acidity, determined in fresh milk, measures the buffering power of milk constituents, but also the lactic acid content resulting from the activity of bacteria that have developed during milk collection and transport. Titratable acidity is expressed in Dornic degrees (°D). The number of Dornic degrees equals the number of tenths of millilitres of sodium hydroxide solution at a concentration 0.111 N, which is required to neutralise 10 ml of milk. A Dornic degree corresponds to 0.01% lactic acid. The titratable acidity of normal milk is between 16 and 18 °D, that of mastitic milk or late lactation is less than 15 °D while that of milk at the beginning of a lactation is between 19 and 20 °D. When titratable acidity is greater than 20 °D, technological problems arise: titratable acidity of milk between 20 and 22 °D may induce coagulation during sterilization and if the titratable acidity is greater than 22 °D, coagulation can be induced during pasteurization (Colinet et al., 2013).
14The calcium content affects the coagulation time and the firmness of the gel. When the ratio of calcium/(phosphate+citrate) of the aqueous phase increases, the velocity of the coagulation increases. In addition, a fairly strong correlation has been observed between the gel strength and the calcium content (Remeuf et al., 1991).
15The temperature also has an effect on milk clotting (Vignola, 2002). Below 10 °C the enzyme is still active but gelation does not occur. Between 10 and 20 °C, coagulation is slow. Between 30 and 42 °C, clotting is gradual. Above 42 °C, coagulation begins to decrease and it stops completely at 55 °C. The effect of temperature on the enzymatic phase is relatively slight and is connected to the coefficient diffusion of the enzyme to its site of action (Walstra et al., 2006). Moreover, the cooling of the milk for a few days before its transformation also affects gelation. This is because at low temperatures, the colloidal calcium phosphate dissolves, causing disruption of the micelles. These effects are partially reversible after the milk has been returned to renneting temperature (Croguennec et al., 2008).
16Somatic cell count (SCC) is another factor affecting milk coagulation properties (Vallas et al., 2010). It has been observed that improved MCPs are associated with lower SCC. According to Politis & Ng-Kwai-Hang (1988), milk with elevated SCC may be unable to incorporate protein into the curd. They also showed that levels of SCC were negatively correlated with protein, fat and total solids in cheese.
3.1. The problem of non-coagulating milk
17Non-coagulating milk is defined as a milk sample that does not clot within 30 min after rennet addition. These milks are not suitable for the production of cheese. The mixture of milk with lower coagulation properties with milk with good properties affects the properties of the entire milk batch non-linearly, similar to a titration curve. The incorporation of just 25% of non-coagulating milk has a clear adverse effect on overall coagulation properties (Frederiksen et al., 2011). The non-coagulation of milk seems to be a fairly common event. A study with Finnish Ayrshire cows showed that 30% of cows produced non-coagulating milk at least once during lactation, and roughly 10% of all samples were non-coagulating (Tyrisevä et al., 2004). Moreover, Frederiksen et al. (2011) showed that 4% of Holstein-Friesian cows produced non-coagulating milk. The exact cause of this problem has not been determined accurately yet, although the composition of individual milk samples associated with poor coagulation properties has been widely studied (Jensen et al., 2012).
18Ikonen et al. (1999a) suggest that non-coagulating milk may be partly defined by the genotype. In addition to genetic factors, there are also environmental factors that affect coagulation. The production of non-coagulating milk is more pronounced in primiparous cows, during mid-lactation (Ikonen et al., 1999a) and at peak lactation (Tyrisevä et al., 2004). Milk with a low protein and fat content is thus at greater risk of non coagulation (Tyrisevä et al., 2004). In addition, poor coagulation has been related to the low content of mineral salts such as calcium, magnesium and inorganic phosphorus (Jensen et al., 2012). Frederiksen et al. (2011) demonstrated that glycomacropeptide was formed after addition of rennet in both coagulating and non-coagulating milks. This demonstrates that it is not the enzymatic phase that is responsible for the overall inability to clot.
4. Determination of milk coagulation properties (MCPs)
19MCPs have received considerable attention in the dairy industry, mainly because the amount of milk used for cheese production is growing worldwide (Chessa et al., 2014). Several studies have confirmed that the analysis of MCPs gives relevant information for cheese production, yield and quality at the laboratory level and at the industry level (Bittante et al., 2012; Bonfatti et al., 2014).
20MCPs can be measured by several instruments. The most common approach to the analysis of MCPs is lactodynamography. This technique controls the viscosity of the milk samples, kept at a fixed temperature, after the addition of rennet. Although dynamic rheometry is often used in research laboratories, mechanical instruments such as the Formagraph (Foss Electric, Hillerød, Denmark) or its new version Formoptic (improvement by Chr. Hansen, Hørsholm, Denmark and ENILBio, Poligny) and the Computerized Renneting Meter (CRM; Polo Trade, Monselice, Italy), and an optical instrument (Optigraphe, Ysabaert, Frépillon, France) have also been developed to allow simultaneous evaluation of several samples of milk and have been widely used (Bittante et al., 2012; Chessa et al., 2014).
21Formagraph analysis, the most frequently used method, consists of registering the behavior of small-loop pendulums immersed in linearly oscillating cuvettes containing rennet-added milk maintained at a fixed temperature. Before gel formation, the pendulums do not move, but as gel formation begins, the increase in viscosity causes synchronous motion of the pendulums. The registration of such movements is translated into two outputs: a typical fork-shaped diagram and the measures of MCP parameters (Figure 1; Chessa et al., 2014). For the Formoptic, an optical sensor measures the pendulum movement and converts this information into voltages. These measures are computerized, and a specific software program recreates the coagulation diagram. Curd firmness is proportionate to voltage. The CRM measurement principle is based on control of a pendulum swing produced by an electromagnetic field. A detector reads magnetic field differences produced by milk coagulation, which reduces the pendulum swing amplitude. A cycle lasts 30 min.
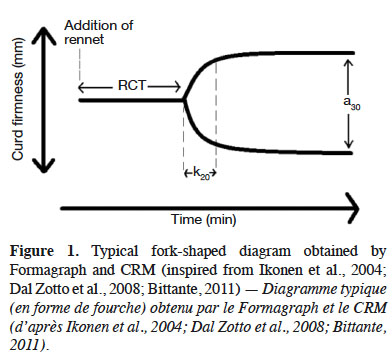
22Formagraph and CRM give three single parameters that are considered to be useful MCPs:
23– rennet coagulation time (RCT), obtained by measuring the interval from time zero (the moment of addition of rennet to milk) to the moment at which the baseline starts to expand;
24– the time to curd firmness (CF) of 20 mm (k20), which is the interval between the onset of gel formation (RCT) and the time at which the width of oscillation becomes 20 mm;
25– CF 30 min after addition of enzyme (a30), which corresponds to the width of the curve 30 min after the addition of rennet (Bittante et al., 2012; Chessa et al., 2014).
26The desired characteristics for cheese processing are rapid aggregation (low RCT) and the rapid formation of a firm curd after the addition of the enzyme (low k20 and high a30) (Ikonen et al., 1999a). According to these criteria, the milk is classified as optimal, suboptimal, deficient or non-coagulant (Bittante et al., 2012). Other parameters, less common, can also be measured: curd firmness after RCT, curd firmness after two times RCT, and curd organization speed.
27These three common MCPs are characterized by high variability. There are three major sources of variation related to the instrument:
28– instrument type and setup (operating temperature, the amount and form of enzyme added to milk);
29– pre-treatment of milk samples (including the time interval since sampling, the use of preservatives, storage conditions, preheating, addition of starter and its dilution, pH adjustment, and addition of calcium);
30– milk quality (e.g., chemical composition, physical properties, microbiome, contaminants), which is generally the target of MCP analysis (Dal Zotto et al., 2008; Bittante, 2011; Bittante et al., 2012).
31Moreover, the existence of weakly coagulating or non-coagulating samples is an important challenge for the statistical treatment of results for these samples, because it means that one or more parameters cannot be measured. These samples must then be removed from the statistical data or must be treated as binary data. In both cases, information is lost (Ikonen et al., 2004; Tyrisevä et al., 2004; Cecchinato & Carnier, 2011).
32Measurements made with the Optigraph are not based on a rheological method but on an optical signal in the near infrared. During a coagulation test, the light emitted through the milk gradually weakens because of changes in the micellar structure of casein. The Optigraph calculates the coagulation parameters (coagulation time, curd firmness, speed of aggregation) by means of particular feature points extracted from optical information acquired in real time. The duration of a cycle is defined by the user (Optigraph User’s Manual; Kübarsepp et al., 2005a).
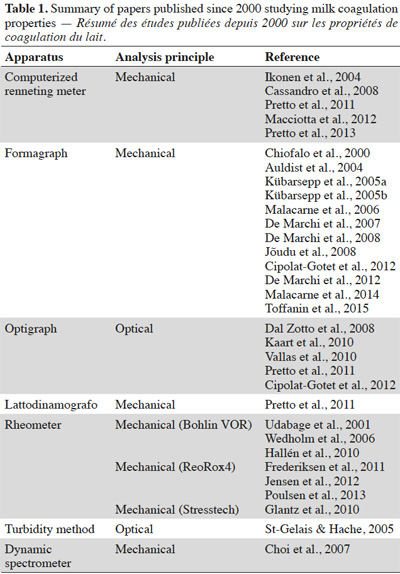
33Table 1 lists papers (published since 2000) studying MCPs together with the analysis method used.
4.1. Comparison of reference methods
34Kübarsepp et al. (2005a) compared the use of the Formagraph and Optigraph systems to determine the coagulation properties of milk. Eighty-one samples were collected from Estonian Holstein, Red-and-White Holstein, Estonian Red and Estonian Native cows. The sampled cows represented different lactations and stages of lactation (1–5 parity and 8–478 days after calving). The samples were preserved and analyzed the next day. They found a strong correlation (r = 0.95) between the rennet coagulation properties of milk measured with the Formagraph and the Optigraph. The best approximation of curd firmness, determined by the Optigraph, gives a quadratic function that allows a comparison of curd firmness measured by both the Formagraph and the Optigraph techniques (r = 0.96).
35Pretto et al. (2011) compared Lattodinamografo, CRM and Optigraph parameters. Individual milk samples (four subsamples per cow) were collected from 165 Holstein-Friesian dairy cows. These samples were combined with preservative. After collection, samples were stored in portable refrigerators and sent to different labs. For the CRM and Lattodinamografo techniques, standard rennet was used (80% chymosine and 20% pepsin), which was diluted in distilled water. For the Optigraph, a microbial coagulant was diluted in distilled water. Strong positive linear relationships were found between RCT values measured with the different methodologies (correlation coefficients ranged from 0.88 to 0.91). The a30 values measured with the different methodologies were less closely related than the RCT. The strongest correlation was found between a30 values measured by CRM and Lattodinamografo (r = 0.79), whereas the correlations of a30 measured by Optigraph and those measured by CRM and Lattodinamografo were moderate (r = 0.53 and r = 0.66 respectively). There are three main factors that could cause a difference in the values of the MCP traits: the first is the different equipment used in each laboratory, the second is the difference in coagulant activity in the milk to induce coagulation, and the third is the type of coagulant used.
36Cipolat-Gotet et al. (2012) were interested in the three milk coagulation parameters (RCT, k20 and a30) and their correlation between the Formagraph and Optigraph. Nine hundred and thirteen Brown Swiss cows from 63 herds located in Trento Province (Italy) were sampled. Two milk subsamples per cow were collected and no preservative was used. All samples were processed within 20 h after collection. Formagraph and Optigraph RCT showed the highest correlation (r = 0.82), followed by a30 (r = 0.69) and k20 (r = 0.49). These results were determined from linear regressions. They also looked for quadratic relationships between the data obtained using the Formagraph and Optigraph, but any incremental improvement in the coefficient of determination was trivial.
5. Infrared spectroscopy to determine coagulation properties
37Spectroscopy focuses on the interaction of a product with photons whose frequencies lie in a region of the electromagnetic spectrum. The photons can be absorbed, transmitted or reflected by a product. The electromagnetic spectrum includes regions corresponding to specific frequencies and used by various spectroscopy techniques (e.g. X-rays, ultraviolet, visible, near-infrared, mid-infrared, Raman, microwave and TeraHertz). Different spectroscopy techniques involve specific electromagnetic radiation wavelengths and allow different types of interactions with the material to be analyzed. From high to low energy, there are radiations that induce ionization or core electronic transitions in atoms (X-rays), electronic transitions (UV and visible), molecular vibrations (near infrared, mid infrared and Raman), rotational motions (microwave) and nuclear spin transitions (radio waves) (Baeten et al., 2014).
38The basis of the spectroscopy instrument takes into account the incident angle i and angles which result from contact with the product. When IR radiation enters at an incident angle i in contact with a food product, part of it is reflected at the same angle in the same plan (i’). A larger part enters the food and undergoes refraction at a smaller angle r, in the same plane as the incident angle, depending on the incident angle and refraction index of the food product. Part of the radiation will be absorbed by the product, whereas the refraction phenomenon will continue for other photons that are transmitted (t) or internally reflected (r’) (Baeten & Dardenne, 2002; Baeten et al., 2014).
39Reflection mode (measurement of the part of the radiation that is absorbed in terms of the ratio between reflected and incident radiation [r/i]) is usually used for analyzing opaque or highly absorbent products. For transparent or semi-transparent food products, transmission mode (measurement of the part of the radiation that is absorbed in terms of the ratio between transmitted and incident radiation [t/i]) is preferred. Transflection mode (measurement of the part of the radiation that is absorbed through the sample, reflected on an inert surface on the back side of the sample and passed a second time through the sample [r’]) is used for liquid samples (Manley et al., 2008; Baeten et al., 2014).
40The properties of electromagnetic radiation that are characteristic of molecular vibrational spectroscopy can be explained by classical theory, which states that electromagnetic radiation is a wave, and quantum theory, which states that electromagnetic radiation is a stream of energetic particles (Baeten & Dardenne, 2002; Baeten et al., 2014).
41Dal Zotto et al. (2008) investigated the possibility of predicting the RCT and a30 from the mid-infrared (MIR) spectra using appropriate algorithms. The influence of time of conservation and the use of preservatives were taken into account. Even so, the accuracy of the predictions was unsatisfactory, as demonstrated by the cross-validation determination coefficients, which ranged from 0.29 to 0.73. De Marchi et al. (2009) used data sets from mathematical pre-treatment spectra, but these performed no better than Dal Zotto et al. (2008). Prediction of the pH and titratable acidity of the milk were also assessed in this study, obtaining accuracy similar to those for MCPs.
42More recently, De Marchi et al. (2013) have developed new MIR prediction equations. The estimated parameters include RCT, k20, a30, but also a60, curd firmness 60 min after pressure addition, since monitoring coagulation beyond the usual 31 min can limit the number of non-coagulating milk samples and thus facilitate the analysis of the results. The precision obtained is moderately satisfactory, with cross-validation determination coefficients ranging from 0.40 to 0.76 for a60 and RCT respectively. Although the accuracy of the predicted values is moderate, MIR spectroscopy could serve as a quality indicator of the MCPs of a population as long as the accuracy of the method is improved.
43Penasa et al. (2014) compared three cattle breeds (Holstein-Friesian, Brown Swiss [BS] and Simmental) in mixed dairy herds for predicted MCPs using the prediction equation developed by De Marchi et al. (2013). Milk from BS cows coagulated 1.90 and 1.10 min earlier and exhibited curd that was 6.00 and 3.20 mm firmer than milk from Holstein-Friesian and Simmental cows respectively. These results were similar to previous studies (Tyrisevä et al., 2004; Dal Zotto et al., 2008; De Marchi et al., 2009).
44Visentin et al. (2015) compared seven different Irish cattle at different stage of lactation and parities and developed MIR prediction equations. The estimated parameters were RCT, k20, a30 and a60. The cross-validation determination coefficients were 0.61, 0.59, 0.50 and 0.26 for RCT, k20, a30 and a60 respectively. These results are lower than those obtained by De Marchi et al. (2013).
45Toffanin et al. (2015) studied variations in the levels of calcium, phosphorus, and titratable acidity in bovine milk and their relationship with milk quality and coagulation properties defined by Formagraph, and investigated the effectiveness of MIR spectroscopy in predicting milk calcium, phosphorus and titratable acidity levels using different statistical approaches. They showed that these three parameters were positively correlated with a30 (0.29, 0.17 and 0.44, respectively) and that calcium and titratable acidity were negatively correlated with RCT (-0.11 and -0.25, respectively). The prediction models developed for calcium, phosphorus and titratable acidity gave good results, with correlation coefficients of cross-validation of 0.75, 0.85 and 0.86 respectively. These results were better than those reported by De Marchi et al. (2009) and similar to those reported by Soyeurt et al. (2009) and Colinet et al. (2013).
46Penasa et al. (2015) assessed reproducibility and repeatability of MCPs predicted by MIR using the prediction equation developed by De Marchi et al. (2013) and a Formagraph. They showed that MCPs predicted by MIR were similarly reproducible, with an average estimate of 70%. Coefficients of repeatability for MCPs predicted by MIR were greater than 90%, and they were slightly lower than those obtained for MCPs measured by Formagraph.
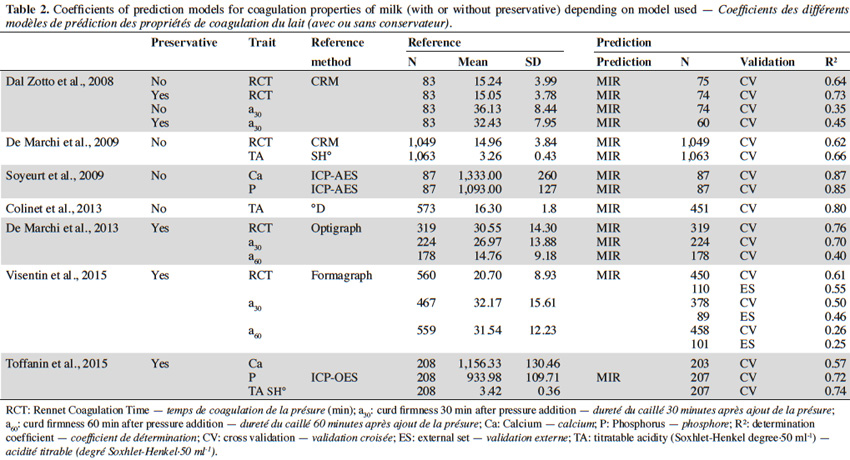
47Table 2 summarizes the different (cross-) validation determination coefficients of the different MIR prediction equations.
6. Conclusions
48As explained, numerous studies of MCPs have been conducted. As already claimed by Pretto et al. (2011), there is a need for a standard MCP analysis in order to be able to compare results from different laboratories. In the present review, the two methods of milk coagulation were described: acid coagulation and enzymatic coagulation (including the different types of enzymes that may be used). Some important factors that influence milk coagulation are the composition of the milk, the milk pH and the temperature. The problem of non-coagulating milk has been studied along with different methods to measure milk clotting. One of these methods, MIR, was discussed and it was shown that it could be an interesting tool to determine the ability of milk to coagulate. Predicting the ability of milk to clot is a critical issue that still needs reliable data and requires further improvement.
List of abbreviations
49CF: curd firmness
50CRM: computerized renneting meter
51MCPs: milk coagulation properties
52MIR: mid-infrared
53RCT: rennet coagulation time
54SCC: somatic cell count
Bibliographie
Auldist M.J. et al., 2004. A comparison of the composition, coagulation characteristics and cheesemaking capacity of milk from Friesian and Jersey dairy cows. J. Dairy Res., 71(1), 51-57.
Baeten V. & Dardenne P., 2002. Spectroscopy: developments in instrumentation and analysis. Grasas Aceites, 53(1), 45-63.
Baeten V. et al., 2014. Vibrational spectroscopy methods for the rapid control of agro-food products. In: Nollet L.M.L. & Toldrá F., eds. Handbook of food analyses. 3rd ed. Boca Raton, FL, USA: CRC Press.
Bittante G., 2011. Modeling rennet coagulation time and curd firmness of milk. J. Dairy Sci., 94(12), 5821-5832.
Bittante G., Penasa M. & Cecchinato A., 2012. Invited review: genetics and modeling of milk coagulation properties. J. Dairy Sci., 95(12), 6843-6870.
Bonfatti V. et al., 2010. Effects of β-κ-casein (CSN2-CSN3) haplotypes, β-lactoglobulin (BLG) genotypes, and detailed protein composition on coagulation properties of individual milk of Simmental cows. J. Dairy Sci., 93(8), 3809-3817.
Bonfatti V., Tuzzato M., Chiarot G. & Carnier P., 2014. Variation in milk coagulation properties does not affect cheese yield and composition of model cheese. Int. Dairy J., 39(1), 139-145.
Brandt M., Haeussermann A. & Hartung E., 2010. Invited review: technical solutions for analysis of milk constituents and abnormal milk. J. Dairy Sci., 93(2), 427-436.
Broome M.C. & Limsowtin G.K.Y., 1998. Milk coagulants. Aust. J. Dairy Technol., 53(3), 188-190.
Buchberger J. & Dovč P., 2000. Lactoprotein genetic variants in cattle and cheese making ability. Food Technol. Biotechnol., 38(2), 91-98.
Caroli A. et al., 2000. Effect of k-casein E allele on clotting aptitude of Italian Friesian milk. Zootec. Nutr. Anim., 26(3), 127-130.
Caroli A.M., Chessa S. & Erhardt G.J., 2009. Invited review: Milk protein polymorphisms in cattle: Effect on animal breeding and human nutrition. J. Dairy Sci., 92(11), 5335-5352.
Cassandro M. et al., 2008. Genetic parameters of milk coagulation properties and their relationships with milk yield and quality traits in Italian Holstein cows. J. Dairy Sci., 94(8), 4205-4213.
Cecchinato A. & Carnier P., 2011. Statistical models for the analysis of coagulation traits using coagulating and noncoagulating milk information. J. Dairy Sci., 94(8), 4214-4219.
Chessa S. et al., 2014. Selection for milk coagulation properties predicted by Fourier transform infrared spectroscopy in the Italian Holstein-Friesian breed. J. Dairy Sci., 97(7), 1-10.
Chiofalo V. et al., 2000. Chemical composition and coagulation properties of Modicana and Holstein cows’ milk. Ann. Zootech., 49(6), 497-503.
Choi J., Horne D.S. & Lucey J.A., 2007. Effect of insoluble calcium concentration on rennet coagulation properties of milk. J. Dairy Sci., 90(6), 2612-2623.
Cipolat-Gotet C. et al., 2012. Comparison between mechanical and near-infrared methods for assessing coagulation properties of bovine milk. J. Dairy Sci., 95(11), 6806-6819.
Colinet F.G. et al., 2013. Étude de la variabilité des aptitudes à la transformation laitière en Région wallonne basée sur l’utilisation de la spectrométrie infrarouge. In : 18e Carrefour des Productions animales, Nouvelles approches pour une optimisation de nos élevages laitiers, 20 février 2013, Espace Senghor, Université de Liège – Gembloux Agro-Bio Tech, Gembloux, Belgique. Gembloux, Belgique : Centre wallon de Recherches agronomiques, 86-92.
Croguennec T., Jeantet R. & Gérard B., 2008. Fondements physicochimiques de la technologie laitière. Paris : Lavoisier.
Dal Zotto R. et al., 2008. Reproducibility and repeatability of measures of milk coagulation properties and predictive ability of mid-infrared reflectance spectroscopy. J. Dairy Sci., 91(10), 4103-4112.
De Marchi M., Dal Zotto R., Cassandro M. & Bittante G., 2007. Milk coagulation ability of five dairy cattle breeds. J. Dairy Sci., 90(8), 3986-3992.
De Marchi M. et al., 2008. Effect of Holstein Friesian and Brown Swiss breeds on quality of milk and cheese. J. Dairy Sci., 91(10), 4092-4102.
De Marchi M. et al., 2009. Prediction of coagulation properties, titratable acidity, and pH of bovine milk using mid-infrared spectroscopy. J. Dairy Sci., 92(1), 423-432.
De Marchi M., Tiezzi F., Toffanin V. & Cassandro M., 2012. Infrared Spectroscopy (FTMIR) for genetic purposes, herd management and dairy profitability. In: Proceedings of the 38th International Committee for Animal Recording (ICAR) Meeting, 28 May 2012, Rochestown Hotel, Cork, Ireland. Roma: ICAR.
De Marchi M., Toffanin V., Cassandro M. & Penasa M., 2013. Prediction of coagulating and noncoagulating milk samples using mid-infrared spectroscopy. J. Dairy Sci., 96(7), 4707-4715.
De Marchi M., Toffanin V., Cassandro M. & Penasa M., 2014. Mid-infrared spectroscopy as phenotyping tool for milk traits. J. Dairy Sci., 97(3), 1171-1186.
Dejmek P. & Walstra P., 1993. The syneresis of rennet-coagulated curd. In: Fox P.F., ed. Cheese: chemistry, physics and microbiology. London: Chapman & Hall.
FAO, 1987. La fromagerie et les variétés de fromages du bassin méditerranéen, http://www.fao.org/docrep/004/X6551F/X6551F01.htm, (16/09/2015).
Fox P.F. & Mc Sweeney P.L.H., 1997. Rennets: their role in milk coagulation and cheese ripening. In: Law B.A., ed. Microbiology and biochemistry of cheese and fermented milk. London: Chapman & Hall, 1-49.
Fox P.F. & Mc Sweeney P.L.H., 2004. Cheese: chemistry, physics and microbiology. Vol. 1. General aspects. London: Elsevier Academic Press.
Frederiksen P.D. et al., 2011. Composition and effect of blending of noncoagulating, poorly coagulating, and well-coagulating bovine milk from individual Danish Holstein cows. J. Dairy Sci., 94(10), 4787-4799.
Glantz M. et al., 2010. Importance of casein micelle size and milk composition for milk gelation. J. Dairy Sci., 93(4), 1444-1451.
Hallén E., Wedholm A., Andrén A. & Lundén A., 2008. Effect of β-casein, κ-casein and β-lactoglobulin genotypes on concentration of milk protein variants. J. Anim. Breed. Genet., 125, 119-129.
Hallén E. et al., 2010. Composition of poorly and non-coagulating bovine milk and effect of calcium addition. J. Dairy Res., 77(4), 398-403.
Heck J.M.L. et al., 2009. Effects of milk protein variants on the protein composition of bovine milk. J. Dairy Sci., 92(3), 1192-1202.
Ikonen T. et al., 1999a. Genetic parameters for the milk coagulation properties and prevalence of noncoagulating milk in Finnish dairy cows. J. Dairy Sci., 82(1), 205-214.
Ikonen T., Ojala M. & Ruottinen O., 1999b. Associations between milk protein polymorphism and first lactation milk production traits in finnish ayrshire cows. J. Dairy Sci., 82(5), 1026-1033.
Ikonen T. et al., 2004. Genetic and phenotypic correlations between milk coagulation properties, milk production traits, somatic cell count, casein content, and pH of milk. J. Dairy Sci., 87(2),458-467
Jeantet R. et al., 2008. Les produits laitiers. Paris : Lavoisier.
Jensen H.B. et al., 2012. Distinct composition of bovine milk from Jersey and Holstein-Friesian cows with good, poor, or noncoagulation properties as reflected in protein genetic variants and isoforms. J. Dairy Sci., 95(12), 6905-6917.
Jõudu I. et al., 2008. The effect of milk protein contents on the rennet coagulation properties of milk from individual dairy cows. Int. Dairy J., 18, 964-967.
Kaart T. et al., 2010. Associations between milk quality traits and coagulation properties and fertility in Estonian Holstein heifers and first lactation cows. In: Proceedings of the 9th World congress on genetics applied to livestock production, August 1-6, 2010, Congress Center Leipzig, Leipzig, Germany.
Kübarsepp I., Henno M., Kärt O. & Tupasela T., 2005a. A comparison of the methods for determination of the rennet coagulation properties of milk. Acta Agric. Scand. Sect. A, 55(4), 145-148.
Kübarsepp I., Henno M., Viinalass H. & Sabre D., 2005b. Effect of κ-casein and β-lactoglobulin genotypes on the milk rennet coagulation properties. Agron. Res., 3(1), 55-64.
La Spina S., 2016. Pistes d’avenir pour le secteur laitier wallon. Jambes, Belgique : Nature & Progrès.
Lucey J.A. & Singh H., 1998. Formation and physical properties of acid milk gels: a review. Food Res. Int., 30(7), 529-542.
Macciotta N.P.P., Cecchinato A., Mele M. & Bittante G., 2012. Use of multivariate factor analysis to define new indicator variables for milk composition and coagulation properties in Brown Swiss cows. J. Dairy Sci., 95(12), 7346-7354.
Malacarne M. et al., 2006. Composition, coagulation properties and Parmigiano-Reggiano cheese yield of Italian Brown and Italian Friesian herd milks. J. Dairy Res., 73(2), 171-177.
Malacarne M. et al., 2014. Influence of micellar calcium and phosphorus on rennet coagulation properties of cows milk. J. Dairy Res., 81(2), 129-136.
Manley M., Downey G. & Baeten V., 2008. Spectroscopic technique: Nearinfrared (NIR) Spectroscopy. In: Da-Wen Sun, ed. Modern techniques for food authentication. USA: Elsevier, 65-116.
Mayer H.K., Ortner M., Tschager E. & Ginzinger W., 1997. Composite milk protein phenotypes in relation to composition and cheesemaking properties of milk. Int. Dairy J., 7(5), 305-310.
Nuyts-Petit V., Delacroix-Buchet A. & Vassal L., 1997. Influence de trois haplotypes des caséines αs1, β et κ fréquents en race bovine normande sur la composition du lait et l'aptitude à la fabrication fromagère. Lait, 77(5), 625-639.
Patil M.R., Borkhatriya V.N., Boghra V.R. & Sharma R.S., 2003. Effect of bovine milk κ-casein genetic polymorphs on curd characteristics during cheddar cheese manufacture. J. Food Sci. Technol., 40(6), 582-586.
Penasa M. et al., 2014. A comparison of the predicted coagulation characteristics and composition of milk from multi-breed herds of Holstein-Friesian, Brown Swiss and Simmental cows. Int. Dairy J., 35(1), 6-10.
Penasa M. et al., 2015. Reproducibility and repeatability of milk coagulation properties predicted by mid-infrared spectroscopy. Int. Dairy J., 47, 1-5.
Politis I. & Ng-Kwai-Hang K.F., 1988. Effects of somatic cell count and milk composition on cheese composition and cheese making efficiency. J. Dairy Sci., 71(7), 1711-1719.
Poulsen N.A. et al., 2013. The occurrence of noncoagulating milk and the association of bovine milk coagulation properties with genetic variants of the caseins in 3 Scandinavian dairy breeds. J. Dairy Sci., 96(8), 4830-4842.
Pretto D. et al., 2011. Relationships between milk coagulation property traits analyzed with different methodologies. J. Dairy Sci., 94(9), 4336-4346.
Pretto D., De Marchi M., Penasa M. & Cassandro M., 2013. Effect of milk composition and coagulation traits on Grana Padano cheese yield under field conditions. J. Dairy Res., 80(1), 1-5.
Remeuf F. et al., 1991. Relations entre les caractères physico-chimiques des laits et leur aptitude fromagère. Lait, 71(4), 397-421.
Soyeurt H. et al., 2009. Potential estimation of major mineral contents in cow milk using mid-infrared spectrometry. J. Dairy Sci., 92(6), 2444-2454.
St-Gelais D. & Hache S., 2005. Effect of β-casein concentration in cheese milk on rennet coagulation properties, cheese composition and cheese ripening. Food Res. Int., 38(5), 523-531.
Toffanin V., De Marchi M., Lopez-Villalobos N. & Cassandro M., 2015. Effectiveness of mid-infrared spectroscopy for prediction of the contents of calcium and phosphorus, and titratable acidity of milk and their relationship with milk quality and coagulation properties. Int. Dairy J., 41, 68-73.
Tyrisevä A.M., Vahlsten T., Ruottinen O. & Ojala M., 2004. Non coagulation of milk in Finnish Ayrshire and Holstein-Friesian cows and effect of herds on milk coagulation ability. J. Dairy Sci., 87(11), 3958-3966.
Udabage P., McKinnon I.R. & Augustin M.A., 2001. Effects of mineral salts and calcium chelating agents on the gelation of renneted skim milk. J. Dairy Sci., 84(7), 1569-1575.
Vallas M. et al., 2010. Genetic parameters for milk coagulation properties in Estonian Holstein cows. J. Dairy Sci., 93(8), 3789-3796.
Vignola C.L., ed., 2002. Science et technologie du lait : transformation du lait. Montréal, Canada : Presses internationales Polytechnique.
Visentin G. et al., 2015. Prediction of bovine milk technological traits from mid-infrared spectroscopy analysis in dairy cows. J. Dairy Sci., 98(9), 6620-6629.
Walsh C.D. et al., 1998. Influence of κ-casein genetic variant on rennet gel microstructure, Cheddar cheesemaking properties and casein micelle size. Int. Dairy J., 8(8), 707-714.
Walstra P., Wouters J.T. & Geurts T.J., 2006. Dairy science and technology. Boca Raton, FL, USA: Taylor & Francis Group.
Wedholm A. et al., 2006. Effect of protein composition on the cheese-making properties of milk from individual dairy cows. J. Dairy Sci., 89(9), 3296-3305.
