


- Portada
- Volume 23 (2019)
- Numéro 2
- Assessing sustainability of different forms of farm organization: adaptation of IDEA method to rubber family farms in Thailand


Vista(s): 5119 (56 ULiège)
Descargar(s): 623 (10 ULiège)

Assessing sustainability of different forms of farm organization: adaptation of IDEA method to rubber family farms in Thailand

Notes de la rédaction
Received 4 June 2018; accepted 22 November 2018; available online 10 January 2019
This article is distributed under the terms and conditions of the CC-BY License (http://creativecommons.org/licenses/by/4.0)
Résumé
Évaluation de la durabilité de différentes formes d’organisation de l’agriculture : adaptation de la méthode IDEA à l’hévéaculture familiale en Thaïlande
Description du sujet. Les préoccupations croissantes concernant la durabilité des systèmes agricoles ont conduit au développement de nombreux outils pour l’évaluer.
Objectifs. L’objectif principal de cette étude était d’évaluer et comparer la durabilité de différentes formes d’organisation de l’agriculture familiale. Un deuxième objectif était de tester la pertinence de la méthode IDEA (Indicateurs de Durabilité des Exploitations Agricoles) pour comparer des exploitations familiales à base de plantes pérennes en zone tropicale.
Méthode. À partir d’entretiens individuels conduits avec 25 planteurs d’hévéa représentant trois types d’exploitations agricoles (typologie basée sur le travail mobilisé pour les activités agricoles), des pourcentages de durabilité ont été calculés sur trois échelles et 10 composantes.
Résultats. L’échelle socio-territoriale était le point faible des exploitations hévéicoles. À l’inverse, l’échelle économique était le point fort pour toutes les exploitations. L’échelle agro-écologique est celle qui discriminait le mieux les trois types d’exploitations, suivie par l’échelle socio-territoriale. L’échelle économique n’était pas discriminante. De plus, les seules composantes présentant des différences entre les trois types d’exploitation étaient la diversité des productions et l’efficience des exploitations.
Conclusions. Les trois types d’exploitation représentant des formes contrastées d’organisation de la production agricole ne sont finalement pas apparus très différents en termes de durabilité. Les exploitations familiales patronales avec la famille seulement impliquée dans la gestion seraient les moins durables. Pourtant, les exploitations patronales occupent une place croissante dans l’agriculture en Thaïlande. Si ces résultats sont confirmés à plus grande échelle, cela représente un problème pour la durabilité de l’hévéaculture en Thaïlande qui demanderait une intervention du gouvernement.
Abstract
Description of the subject. With increasing concerns on the sustainability of agricultural systems, many tools have been developed to assess farm sustainability.
Objectives. The main objective of this study was to assess and compare the sustainability of different forms of family farm organization. A second objective was to test the relevance of the IDEA method (Indicateurs de Durabilité des Exploitations Agricoles or Farm Sustainability Indicators) to compare tree-crop-based family farms in tropical areas.
Method. Percentages of sustainability were calculated based on individual interviews conducted with 25 rubber farmers representing three different types of farm (typology based on the labor used for farming activities), using three scales and 10 components.
Results. The socio-territorial scale was the weak point of the rubber farms. In contrast, the economic scale was relatively the best asset on all farms. The factor that most differentiated the three types of farm was the agro-ecological scale followed by the socio-territorial scale. The economic scale did not discriminate. Moreover, only the diversity of production and efficiency components showed a notable difference between the different types of farm.
Conclusions. Overall, the three types of farm with contrasting forms of farm organization were not much different in terms of sustainability performance. Family business farms with managerial family labor appeared to be the least sustainable. Thus, as family business farms are becoming more and more important in Thai agriculture, if these results are confirmed on a broader scale, this represents an issue for the sustainability of the Thai rubber sector that would require government intervention.
Tabla de contenidos
1. Introduction
1Sustainable agriculture is a major issue particularly in a rapid changing world (Tilman et al., 2002). Therefore, numerous studies have been conducted to assess the sustainability of agricultural systems. Sustainability is a way of development that “meets the needs of the present without compromising the ability of future generations to meet their own needs” (Brundtland, 1987, p. 43). Landais (1998) noted that from the perspective of sustainability, a farm cannot be assessed based only on its technico-economic performance. Social and environmental issues also matter. He also suggested that in the future, sustainability would probably represent a major driver of agricultural development. In line with these statements, several tools have been developed to assess the sustainability of agricultural systems that can be categorized according to the intended level of application (farm, sector or regional level) and the intended end-users (farmers or policy makers) (Van Passel & Meul, 2012).
2Agriculture is characterized by different forms of farm organization ranging from entrepreneurial to family agriculture (Bosc et al., 2015a). However, family agriculture is by far the main form of production in the world (Graeub et al., 2016; Lowder et al., 2016) although it is characterized by diversity (Bosc et al., 2015b). The common features of family farming are:
3– the organic and structural relationship between the productive assets and family patrimony;
4– the predominance of family labor for the management and field operations (FAO, 2014; Bélières et al., 2015).
5In Thailand, 48% of the population live in rural areas (World Bank, 2016) and approximately 30% of the Thai labor force works in the agricultural sector (NSO, 2017). Small family farms represent the main source of agricultural production (NSO, 2014). Rubber is a major economic crop in the country and since 1991, Thailand has been the top natural rubber producer and exporter, supplying more than one-third of total world production (IRSG, 2017). Around 90% of the rubber plantations belong to smallholders owning less than 8 ha, with an average of 2 ha (RRIT, 20131 cited by Somboonsuke & Wettayaprasit, 2013). Even for larger landholdings, family agriculture remains the dominant model (Chambon et al., 2018).
6Based on the classification proposed by Bélières et al. (2015), we identified three types of rubber family farms in Thailand (own unpublished work). The first type is a family farm (FF), characterized by the use of family members as a unique workforce, with perhaps some temporary employees. The second type is a family business farm, which employs and pays at least one permanent worker who is not part of the household but the family workforce is still involved in agricultural tasks; such farms are hereafter called family business farms with family labor (FBF with FL). The last type is a family business farm, which employs and pays at least one permanent worker outside the household and the family workforce is only involved in the management and organization of the farm and not in any agricultural tasks; such farms are hereafter called family business farms with managerial family labor (FBF with MFL).
7Whatever the type, Thai rubber farmers have to face global changes (socio-economic evolution, climatic variations). These global changes challenge both their resilience (the tendency of a socio-economical system [SES] affected by change to remain within a stability domain, while continually changing and adapting yet remaining within critical thresholds) and their adaptability (the capacity of a SES to adjust its responses to changing external drivers and internal processes). This allows for development within the current stability domain, along the current trajectory (Folke et al., 2010). A recent study showed that the three types of rubber farm defined above have adopted different strategies of adaptation to face the important rubber price decrease since 2011 (Nicod, 2017). However, no study has been conducted to compare the sustainability of different forms of farm organization. In this context, the main objective of the current study was to assess and compare the sustainability of different types of rubber family farms based on labor use as a means of representing different forms of farm organization. The comparison of farms with similar farming systems seems to be more relevant than comparing farms with different farming systems (Barbier & Lopez-Ridaura, 2010). A second objective was to test the relevance of the IDEA method (Indicateurs de Durabilité des Exploitations Agricoles or Farm Sustainability Indicators) to compare tree-crop-based family farms in tropical areas. The comparison of the sustainability of the different forms of agriculture and the identification of the possible strengths and weaknesses of each type of farm from a sustainable point of view provides knowledge for policy makers to design more sustainable agricultural development.
2. Materials and methods
2.1. IDEA method (Farm Sustainability Indicators)
8Although the definition of sustainable development from the Brundtland Report is now generally accepted, its application in agricultural operations still raises many scientific questions. Since the United Nations Rio Conference in 1992, the European Union has been working to integrate the concept of sustainable development into its policies including the agricultural sector. However, these political objectives raise the issue of devising new indicators to evaluate the degree of sustainability of an agricultural production system. In this context, in 2003, a French multi-disciplinary research team elaborated the IDEA method (Vilain, 2000).
9The literature on agriculture sustainability assessment methods identifies two types of indicator-based conceptual frameworks: those based on sustainable agriculture objectives, and those based on a systemic approach focusing on the properties of sustainability as applied to agriculture. The IDEA method makes use of the former. In the case of an objective-based approach or a goal-oriented conceptual approach, sustainable agriculture is defined by the goals it aims to achieve. Viewing sustainability in this way is connected to both the societal issues faced by farmers and farming in general, and the internal goals which farmers aim to achieve. The IDEA method is structured around three sustainability scales. The agro-ecological sustainability scale measures the ability of the system to produce at the lowest ecological cost. The socio-territorial sustainability scale aims at characterizing the insertion of the farm in its territory and its society. It allows measuring the quality of life of the farmers and the market and non-market services provided for territory and society. The economic sustainability scale measures the economic performance of the system beyond short term and cyclical hazards (Zahm et al., 2008).
10Each scale is subdivided into three or four components, making 10 components in total, which are further divided into indicators resulting in a grand total of 42 indicators (Table 1).
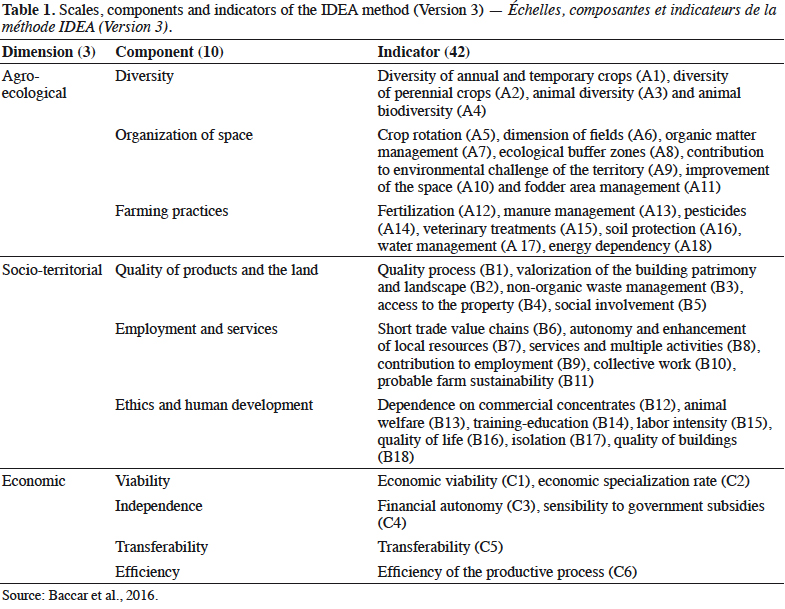
11The components consider all aspects of the farm to assess its sustainability while trying to cover all the dimensions of its functioning and development. Consequently, all production (including rubber, fruits, annual crops), all land (including cultivated plots, water catchment, unused areas) and all on-farm and off-farm activities are appraised.
12Each farm is scored on each indicator (using a standard methodology), consisting of a number of sustainability points. The scores of all indicators are summed to get the grades for each component and then for each scale. In this paper, the scales or component sustainability were compared with grades standardized to a 100-point total and so were called “sustainability percentages”. A grade of 100 would represent an ideal sustainable farm according to the vision of sustainability of the IDEA method.
13Sustainability assessment tools such as IDEA consider the content for its relevance to sustainability that is guided by the requirements claimed by a given society at the time when the method is elaborated. The tool was conceived by a multidisciplinary team who provided standard methods of measurement. However, “a diagnosis of farm is always linked to the point of view and to the referential of the person who does it” (Bonneviale et al., 1989). This is also true when assessing farm sustainability using the IDEA method. Indeed, even if the assessment is quantitative with indicators calculated according to a common rule, some of them relate to personal observations (from both the farmer for the indicators assessed each individual’s own auto-evaluation and the person conducting the assessment) and qualitative interpretation. Consequently, there is some subjectivity in the assessment. However, basic agreements are established within a group of users to make those interpretations uniform.
14Sustainability is built into society at some point in history. It is hard to assess because sustainability depends on many elements, difficult to quantify. The IDEA method is an innovative tool to assess sustainability. It was selected for this study because it allows an assessment of sustainability at the whole farm level which was the point of reference for this study and because it covers with equal weighting the three dimensions of sustainability. Nonetheless, it would be irrelevant to say whether a farm was sustainable or not. The sustainability of a farm can be assessed based on its scores and, in doing so, this points out its strengths and weaknesses with regard to the different scales and components. Comparing the scores for different farms, such a method can only conclude whether there is a difference (or not) in the level of sustainability between the studied farms or groups of farms, and then to try to understand why.
15Since its early development, this method has been continuously improved. For the current study, the third version of IDEA was used, which was modified based on common feedback from studies conducted in Southeast Asia, Latin America and the USA. Some adaptations were made in order to apply the components outside the European context for which the method was first developed.
2.2. Study area and sampling
16The study was conducted in Rayong province in Central-Eastern Thailand. This region is one of the historical rubber-growing areas, where farmers started to grow rubber at the turn of the 20th century. Rayong has the largest rubber area in the Central-East, with almost 100,000 ha planted (OAE, 2017). The climate of the province is very suitable for some types of fruit such as durian, longan and mangosteen which are well known for their good quality in this region. Therefore, different types of fruit are common on rubber farms.
17Due to time constraints, the researchers selected farmers from a sample of 106 farmers interviewed in Rayong in 2014, whose farms had already been classified based on their labor (Chambon et al., 2017). In 2014, the farmers were contacted through a government organization in charge of rubber extension. This sampling method might explain why most of the farmers interviewed in the current study belong to a rubber association.
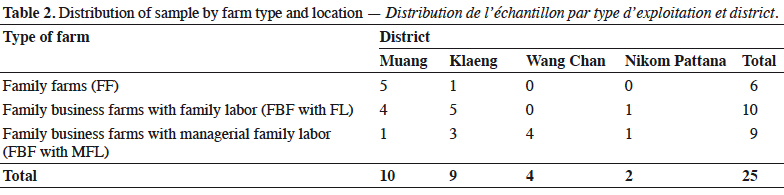
18In total, 25 farmers were interviewed, distributed over four districts. Two criteria were used to select the farmers: the type of farm based on labor and the geographical location of the farm (district). The objective was to balance the different types of farm in the four districts to avoid possible bias linked to relationships between close farms. However, this was difficult to achieve due to farmers’ availability at the time of the survey, and finally, farms of the same type were often grouped by location (Table 2).
2.3. Data collection and data analysis
19Data were collected using individual interviews with the head of the farm and sometimes together with another family member. Several heads of farms were women. The interviewee was the owner of most (or all) of the land considered in the interview.
20A questionnaire was used to get the information to fill the IDEA grid on three scales: agro-ecological, socio-territorial and economic. Additional questions were used to gain a better understanding of the farmers’ situation and the broad scale changes in the area as these could affect the sustainability of the farms. The IDEA grid listing all the indicators was stored as an Excel file (Version 2010; Microsoft Corp.; Redmond, WA, USA). Based on the data collected from the farmers, a score was given to each indicator, by comparing the farm value for the indicator with regional or national references, standards and norms. For example, depending on the context, a farmer’s income was compared with a regional minimum wage or with the livelihood needs of the family. The scores of all the indicators of a component were added giving the score for the component and the score for each scale was obtained by adding the score for each of its components. The value of one indicator could not exceed the maximum; thus, it was not possible to gain a high score for a specific component with only one “good” indicator; we searched for a certain equilibrium on the farm and tried to evaluate farmers who were making an effort in all farm components assessed. The maximum value of an indicator was decided by the method’s designers based on a ranking of what was considered to be more important in agriculture in the studied area or in the country. In the same way, the score for the components had a maximum value defined to ensure that each of the components had the same weight in the standardized scale. Details on the method and score calculations can be found in Zahm et al. (2008) and free, on-line Excel file (in French) is available at https://idea.chlorofil.fr/utilisation/outils-dapplication.html and can be used to do all the calculations. The farmer’s values for all the indicators were entered and then the on-line tool was used to compare these with the reference values and the scores were calculated. By aggregation and taking into account the maximum possible scores for each indicator and component, farm performance was calculated for each component and each scale. The results were displayed using radar charts or histograms.
21Only rubber farmers were selected for the interview, but all the agricultural activities on their farms were considered such as annual crops or fruit trees.
22Different types of farm were compared using the mean for each scale or component calculated for each type of farm. The variability of the means of each type of farm was then calculated for the different scales or components. Variance analysis (ANOVA) was followed by Newman-Keuls tests to determine if there were any significant differences among the means of the different groups studied. The statistical significance was set at α = 5%.
23Hypotheses for the ANOVA analysis were validated:
24– all the observations made in the field were assumed to be random and independent of the selection of the farmers interviewed, as explained above;
25– the three populations studied (different farms types based on labor usage described earlier) had sustainability means for the three scales that followed a normal distribution (verified by the normal probability plot of Henry);
26– the homoscedasticity (equality of variances) was always verified using Bartlett test.
3. Results
27To evaluate the differences of sustainability between the three types of farm, a “zoom-in movement” was adopted, from the scales down to the components. It was followed by a qualitative analysis of the strengths and weaknesses of the three types of farm.
3.1. Comparison of the performance of the farms on the three scales of sustainability
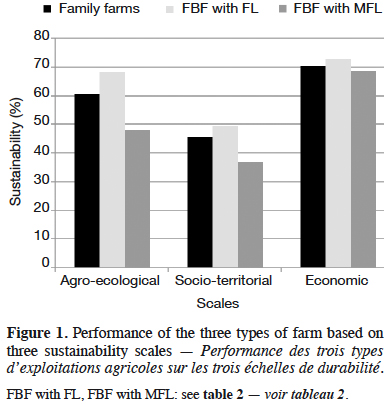
28In Rayong province, the socio-territorial scale was clearly the weakness of the rubber farms (Figure 1). One reason could be that there were not any local flows of use of local resources between farmers or with other stakeholders. Indeed, the use of local organic fertilizer was very limited (not much animal production in the area) and there was no self-energy production or use of renewable energy. In addition, most rubber and fruit products were exported from the province. There were no collective activities that could energize local interactions and few cultural traditions were maintained. Finally, there was no initiative to valorize the specific quality of the products (labels, certifications), especially for fruit, despite it being known as good quality. In contrast, the economic scale was relatively the best asset on all farms. A very wide range of family income was observed, and all families had sufficient resources to live comfortably. This could be explained by the fact that rubber and fruit are cash crops with relative low input needs; furthermore, most of the farms had a diversified income.
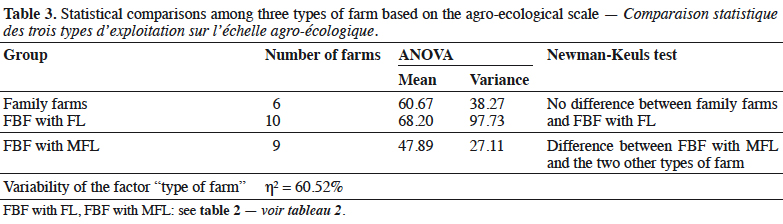
29The variability of the factor “type of farm” had an influence of 60.52% on the agro-ecological scale. This scale had the highest variability factor, which indicated that it differentiated the most among the three types of farm. On this scale, farms fell in two categories according to the Newman-Keuls test:
30– family business farms with managerial family labor (FBF with MFL);
31– family farms (FF) and family business farms with family labor (FBF with FL).
32The mean of the agro-ecological score was lower (but not significantly different) for the FBF with MFL than for the two other types of farm (Table 3).
33The FBF with MFL had lower crop diversity than the other types of farm (see the components comparison below). The FBF with MFL often grew only rubber trees, so there were no annual crops (such as vegetables for self-consumption) or fruit to sell on the local market. Since they had non-farm income, they did not need to diversify their agricultural income. In addition, they did not try to encourage their workers to utilize more agro-ecological practices such as focused pesticide treatment or good natural resources management (energy saving, water management, soil protection). Besides, they did not try to improve spatial organization such as by incorporating ecological buffer zones.
34The variability of the factor “type of farm” had an influence of 23.59% on the socio-territorial scale. This variability factor was around three times lower than for the agro-ecological scale, which indicated that differentiation for socio-territorial scale was less important.
35At this scale, the Newman-Keuls test identified the following differences:
36– the FBF with MFL and the FBF with FL were different;
37– the FF were similar to the two other types of farm.
38The mean of the socio-territorial score was lower for the FBF with MFL than for the two other types of farm with a significant difference between the FBF with FL but not with the FF (Table 4).
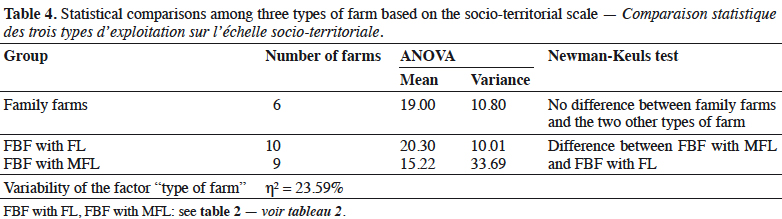
39By definition, family labor in the FBF with MFL did not work in the field. This could explain the lowest socio-territorial score for this type of farm. Indeed, the owners were less involved in farming than in their off-farm activities. For instance, they seemed less concerned with the farmers’ networks, such as the rubber organizations. They generally did not attend training sessions and did not open the farm for consumer visits. The FBF with MFL had a lower social implication score than the other types of farm. However, because they needed workers, they contributed well to employment.
40The variability of the factor “type of farm” had an influence of only 3.58% on the economic scale. This variability factor was very low. Comparison of the F factor to its critical value confirmed that there were no significant differences based on this scale (Table 5).
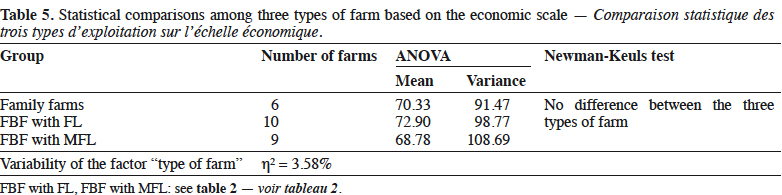
41The economic sustainability was quite similar for all the three types of farm. Indeed, even though they did not always have the same quality of life and wealth, none of the farms seemed to have been experiencing economic difficulties. This was probably because most farmers had incomes from sources other than rubber production. In addition, the independence of the farm (diversity of products sold, diversity of clients, off-farm income) did not depend on the type of farm.
3.2. Sustainability components analysis
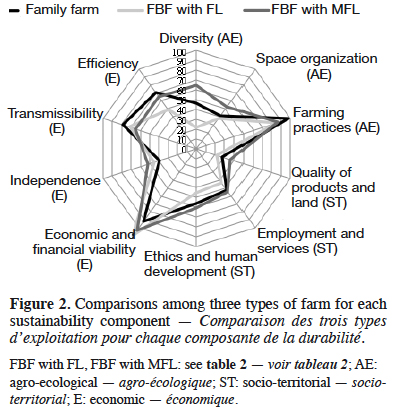
42The star plot diagram was adapted to present the strengths and weaknesses of the farms for each component and to compare the different forms of farm organization. All components were quantified based on the percentage of sustainability.
43The shape of the star plot was quite homogenous for the three types of farm (Figure 2), indicating that the three types of farm had similar levels of performance for the components of sustainability. This could be explained by the fact that:
44– all the farms had a rubber crop in common and were in the same area (same climate, same input and output market); thus they shared the same environment and a similar global organization;
45– the farmers usually had the same agricultural and social practices since they had obtained their rubber cropping knowledge through the same kind of training organized locally by the rubber associations or just through discussions among farmers.
46Only the diversity of agricultural production and efficiency components showed any notable difference among the different types of farm.
47A comparison test was done based on the diversity component. The variability of the factor “type of farm” had an influence of 50.35% on the diversity component. This variability factor was close to the variability factor of the agro-ecological scale (60.52%), which was quite important.
48For this component, the farms fell in two categories according to the Newman-Keuls test:
49– the FBF with MFL;
50– the FF and FBF with FL.
51The mean of the diversity score was lower for the FBF with MFL than for the two other kinds of farm with no significant difference between them (Table 6).
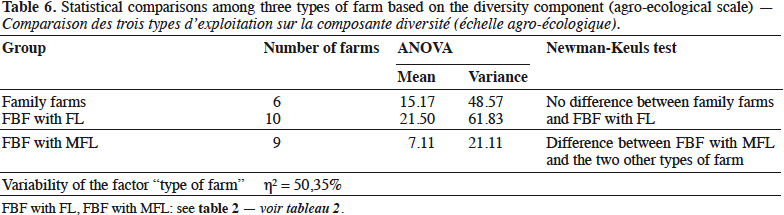
52The score reached almost 62% for the FBF with FL while the score was no more than 21% for the FBF with MFL. This gap might have been due to the fact that for most farms classified as FBF with MFL, farming was just one activity among others. Consequently, they considered farming as one source of income among others and probably not the main one; they did not really try to benefit from growing several crops but rather focused on a single crop that was easily managed using hired labor.
53The statistical analysis on efficiency (the second component) considering differences among the farms revealed that homoscedasticity of the variances was not verified, which meant that the differences of the variances intra-group were too high to compare the differences among groups.
3.3. Strengths and weaknesses of rubber farms
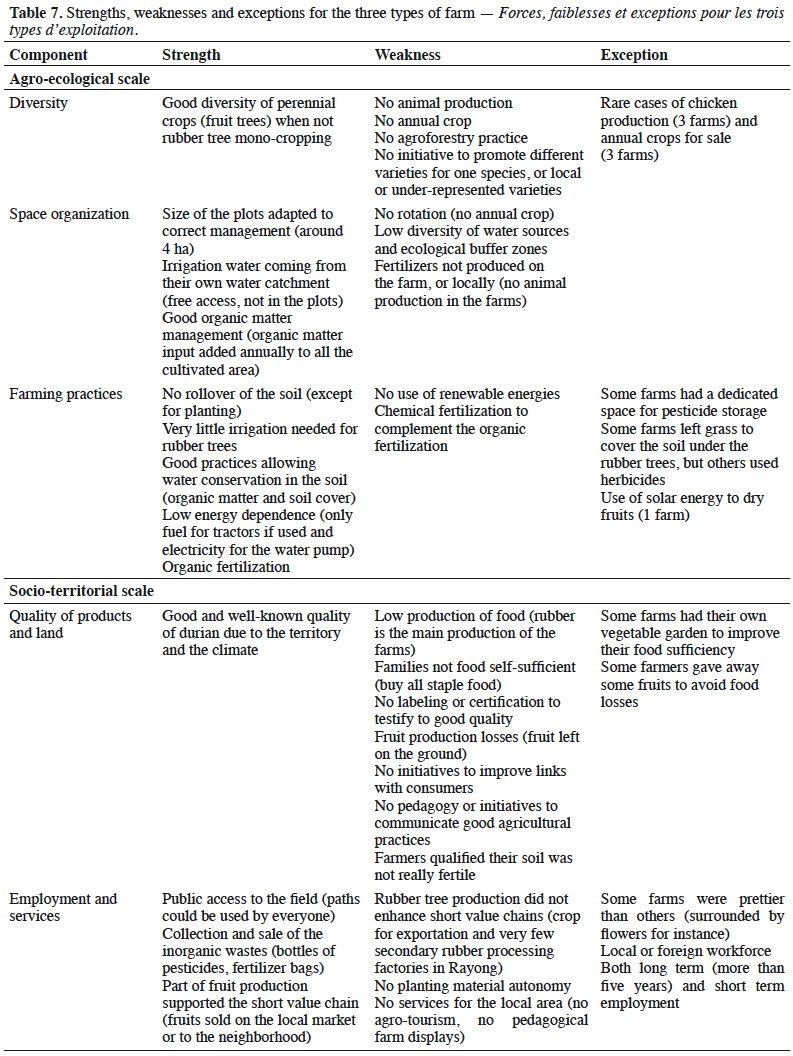
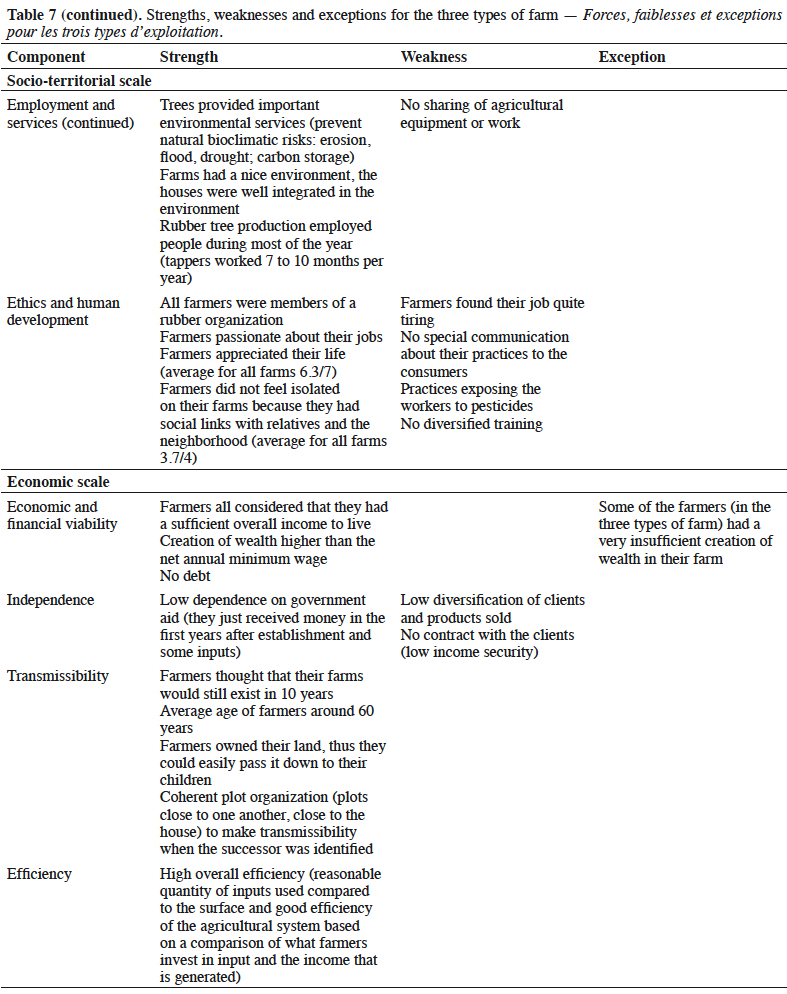
54The strengths and weaknesses were identified for the 10 components on all farms and also were deduced from the general trends from the results of the interviews; however, sometimes there were exceptions, though these never exceeded three cases per statement (Table 7).
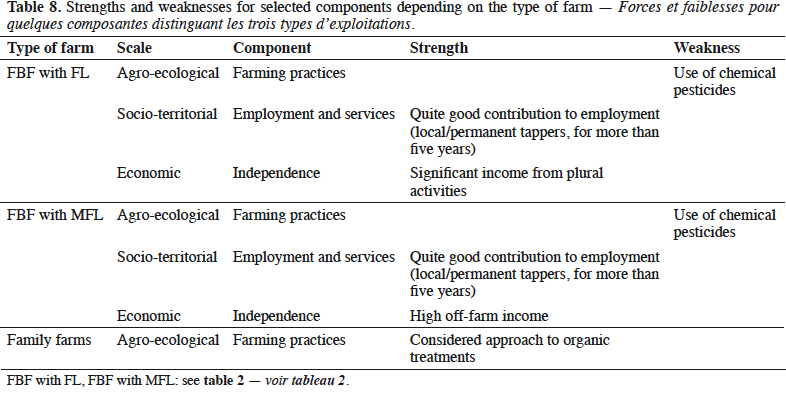
55Then, the main strengths and weaknesses deduced from the general trends were identified for the three types of farm (Table 8). The main strength for the family farm was the adoption of carefully considered organic treatment. However, for family business farms, the main strengths were the good contribution to employment as well as important and high income from plural activities for the FBF with FL and the FBF with MFL, respectively. For both types of FBF, the weakness was the use of chemical pesticides. However, overall, the strengths and weaknesses were quite similar for the three types of farm.
4. Discussion
4.1. Comparison of different forms of family farm organization
56With the increasing concern on the sustainability of agriculture, numerous studies have been conducted to assess farm sustainability. Many studies adopted a comparative approach developed at different levels, for instance: comparison of ecological and non-ecological farms (Fernandes & Woodhouse, 2008), comparison of sheep farming systems with different degrees of intensification (Ripoll-Bosch et al., 2012) or comparison of farming systems in different regions (Dantsis et al., 2010). Other authors compared different types of smallholder livestock farms characterized by their labor use (Gayatri et al., 2016). Different methods were used, notably the IDEA method to assess the sustainability of dairy farms (M’Hamdi et al., 2009) or to compare farms with different farming systems (Baccar et al., 2016). The present study compared the forms of family farm organization (based on labor use) which have in common the cultivation of a perennial cash crop (rubber), using IDEA method. This was a quite new level for this method.
57The results showed that the agro-ecological scale, which was tightly linked to the diversity component, was the most discriminating for the types of farm. The socio-territorial scale also differentiated among the three farm types, but to a lesser extent. This result was different from what was observed in a previous work comparing farming systems where the socio-territorial dimension did not depend on the farm type but rather on several parameters related to the personality of the farmer and the farmer’s preferences (Baccar et al., 2016).
58In the present study, the least sustainable type of farm from the agro-ecological and socio-territorial points of view were family business farms with managerial family labor (characterized by limited diversity of agricultural production and low social involvement), even if they did contribute to local employment. However, all three types of farm were weak in the socio-territorial dimension of sustainability which was also the case for dairy farms in another study but for different reasons (M’Hamdi et al., 2009).
59In addition, the results showed that there was no difference between the three types of farm on the economic scale which was different from M’Hamdi et al. (2009) who found that the economic scale presented important variability among the dairy farms. However, efficiency (one component of the economic scale which evaluates the gross efficiency of the agricultural system and the adequate quantity of inputs) was one of the components with the widest gap in the star plot diagram. This apparent paradox in the results could be explained by:
60– the lack of economic information which could lead to a homogenization of the grades of economic scale for the three types of farms as the owners of the FBF with MFL might not always know how much input their employees really applied, even if the owners paid for fertilizer and this would create a bias;
61– the fact that, for that component, the IDEA grid was not well suited to assess the overall efficiency of the farms in this context with important intra-group variability.
4.2. Methodological adaptations to fit perennial cash crops in tropical countries
62In addition to assessing the sustainability of the different forms of rubber family farms, this work tested the relevance of the IDEA method for comparing tree-crop-based family farms in tropical areas.
63The purpose of the method was to compare the sustainability of farms in any context. However, this raised some difficulties when comparing farms within the same context. Indeed, here, the grades of each component or scale were very close for each type of farm, making differentiation among the farm types difficult. This could be improved by modifying the IDEA grid to use more specific grading indicators adapted to the context of rubber cultivation in a specific region. Another study adopting this approach would be much more specific and might show greater differences among the farms. However, this would require conducting two kinds of interviews in the same area: one to adapt the grid and the other to collect the data. Such study would require an important work in the field for data collection and in office for data analysis.
64The changes that could make the evaluation more specific would be:
65– component “farming practices”: adapt the quantity of inputs applied on a per hectare basis for fertilizers (differentiating organic from chemical fertilizers) and pesticides;
66– component “ethics and human development”: compare their training experiences and the implications within the associations;
67– indicator “economic viability”: modify the first item to distribute a wider range of economic data;
68– component “efficiency”: establish the average yield and quantity of inputs applied per hectare for rubber production, as a means of comparing the efficiency of the farms (which is difficult since many farmers do not really know their exact production nor the quantities of inputs used).
69Lastly, IDEA is based on the concept of sustainability as defined from a European or even a French perspective. As such, this may not completely match with sustainability as viewed by national governments in tropical countries such as Thailand. The adaptation of the IDEA method needs to take this into consideration.
4.3. Limitations
70This work has identified several limitations. First, some information required to fill the assessment grid was quite precise and some farmers did not really know how to answer some questions. All quantitative data such as rubber yield, the quantities of inputs or economic data were quite hard to obtain. This was a problem encountered during all fieldwork conducted with the rubber farmers. By chatting a bit more, it was possible to draw out information to use, but many estimates were still only approximate. Another limitation of the study was the small sample size with its uneven distribution over the three types of farm. It would be useful to conduct a study on a larger scale and in other rubber-producing regions to confirm and possibly refine the results of the present study. In addition, the method was developed as a tool for discussion with the farmers, as a diagnosis or decision-making tool or both that should be useful for the farmers. Indeed, one of the objectives of the method is to sensitize farmers to sustainability and to encourage them think about their practices (Briquet et al., 2001). Unfortunately, due to time constraints, no feedback on the results was given to the farmers. This should be a part of future activities to raise farmer awareness on sustainable agriculture. Finally, the IDEA method is interesting because it considers all three pillars of sustainability and allows an assessment at the farm level focusing on farming systems. It considers different forms of off-farm income but their level, or at least their share in total household income is difficult to estimate. Thus, a method allowing for better assessment of the sustainability at the household level (activity system) would be relevant. Indeed, most rubber-based households in Rayong (and elsewhere in Thailand) have diversified their sources of income into non-farm activities (according to our own unpublished work). In fact, there is only a limited number of farms household relying predominantly on agriculture in Thailand (Podhisita, 2017).
4.4. Toward more sustainable family rubber farms
71The socio-territorial scale which appeared as the weakest point on all the rubber farms was surprising and interesting. Either it indicated that in this sustainability assessment, the method did not allow the identification of the social link in the specific context studied (indicators not well adapted), or that there are serious failures in the links, exchanges, local flux (notably for more autonomy), links between the people, links to the territory and to production, among others. Nowadays, it is difficult to imagine agro-ecology transitions that are not driven or supported by local groups. Different actions could be implemented to improve the socio-territorial sustainability of the farms. For instance, there is no specific labeling to guarantee the quality of the agricultural products due to their origin or the process. Some farmers had better practices than others, but the better ones could not be differentiated in the market because there is no certification process. The development of suitable labeling would encourage the farmers to improve their practices (both sustainable and organic practices) for both fruit and rubber cropping and thus improve the conservation of their environment. It would also allow selling at a better price, where there is a market premium for this kind of product. The absence of a local flow of resources and information as well as the limited local exchange deserve further research. Even though rubber farms contributed to employment, it was clear that the Thai workforce prefers to work in sectors other than rubber production, which offered a better wage (at least at the time the study was conducted). The lack of labor to work in rubber plantations is an important issue for Thailand as it has been the case for a long time in the agricultural sector (Poapongsakorn et al., 1998). In this context, the challenge is to increase labor productivity in rubber plantations to make the wages for rubber harvesting jobs more competitive with alternative work. Some techniques exist to increase labor productivity (Sanoi et al., 2017), but they have not yet been adopted by the farmers, and their farm use could be encouraged.
72Another point to highlight is the variability in agro-ecological performance of the three types of farm, with lower performance on family business farms with managerial family labor. As mentioned earlier, these farms have no incentive to limit practices having potentially negative impacts on the environment and probably also on the health of their laborers. Since there is an increasing trend toward this type of farm, this is another serious issue that requires thought on how to manipulate the appropriate levers to correct these negative points; otherwise the multiplicative effect may result in serious repercussions.
5. Conclusions
73The IDEA method allowed the assessment of the sustainability of three types of rubber family farm characterized using different labor use. Sustainability is a key notion for both resilience and mitigation to face major changes such as climatic variation, land use change and socio-economical evolution. Even if the three types of farm studied did represent the different forms of farm organization, overall, they were not much different in terms of sustainability performance. The main difference was found in the agro-ecological scale and this appeared to be strongly linked to low diversification of agricultural production by the family business farms with managerial family labor that resulted in these farms having the lowest performance. However, this low diversification of agricultural production was compensated by off-farm income. Indeed, our own unpublished work showed that off-farm income generated by the FBF with MFL was much higher than the two other types of farm. From the present study, farms that appeared to be the least sustainable were family business farms with managerial family labor and family business farms are predicted to become more and more important in agriculture (Podhisita, 2017). If confirmed on a broader scale, this represents an issue for the sustainability of the Thai rubber sector and could require government intervention to re-enforce professional links, to create and encourage local exchanges, fluxes and collective projects in order to improve the socio-territorial sustainability of the farms; and to encourage and accompany environmental-friendly on-farm diversification for all types of farm, including family business farms with managerial family labor in order to improve the agro-ecological performance on rubber farms.
74Acknowledgements
75This study was supported and funded by the French National Research Agency (ANR) under the HEVEADAPT project. We thank all the interviewees for their patience and kindness during the interviews.
Bibliographie
Baccar M. et al., 2016. Assessing family farm sustainability using the IDEA method in the Saïs plain (Morocco). In: The 12th European International Farming System Association (IFSA) Symposium, Social and technological transformation of farming systems: diverging and converging pathways, 12-16 July 2016, Harper Adams University, Newport (UK).
Barbier J.M. & Lopez-Ridaura S., 2010. Évaluation de la durabilité des systèmes de production agricoles : limites des démarches normatives et voies d’amélioration. In : Coudel É. et al. Actes du colloque ISDA, Innovation et développement durable dans l'agriculture et l'agroalimentaire, 28 juin - 1 juillet 2010, Le Corum, Montpellier, France. Montpellier, France : CIRAD-INRA-SupAgro.
Bélières J.F. et al., 2015. Family farming around the world. Definition, contributions and public policies. Paris: AFD, CIRAD.
Bonneviale J.R., Jussiau R. & Marshall E., 1989. Approche globale de l’exploitation agricole. Comprendre le fonctionnement de l’exploitation agricole : une méthode pour la formation et le développement. Dijon, France : INRAP.
Bosc P.M. et al., 2015a. Defining, characterizing and measuring family farming models. In: Sourisseau J.M., ed. Family farming and the worlds to come. Versailles, France: Éditions Quæ, 37-55.
Bosc P.M. et al., eds, 2015b. Diversité des agricultures familiales. Exister, se transformer, devenir. Versailles, France : Éditions Quæ.
Briquel V. et al., 2001. La méthode IDEA (indicateurs de durabilité des exploitations agricoles) : une démarche pédagogique. Ingénieries, 25, 29-39.
Brundtland G.H., 1987. Report of the world commission on environment and development: our common future. Oxford, UK: Oxford University Press.
Chambon B., Dao X.L, Tongkaemkaew U. & Gay F., 2017. What determine smallholders' fertilization practices during the mature period of rubber plantations in Thailand? Exp. Agric., 54(6), 824-841.
Chambon B., Bosc P.M., Promkhambut A. & Duangta K., 2018. Entrepreunarial and family business farms in Thailand: who took advantage of the rubber boom? J. Asian Rural Stud., 2(2), 173-195.
Dantsis T. et al., 2010. A methodological approach to assess and compare the sustainability level of agricultural plant production systems. Ecol. Indic., 10, 256-263.
FAO, 2014. What is family farming? The international year of family farming. Roma: FAO.
Fernandes L.A. & Woodhouse P.J., 2008. Family farm sustainability in southern Brazil: an application of agri-environmental indicators. Ecol. Econ., 66, 243-257.
Folke C. et al., 2010. Resilience thinking: integrating resilience, adaptability and transformability. Ecol. Soc., 15(4), 20.
Gayatri S., Gasso-tortajada V. & Vaarst M., 2016. Assessing sustainability of smallholder beef cattle farming in Indonesia: a case study using the FAO SAFA framework. J. Sustainable Dev., 9(3), 236-247.
Graeub B.E. et al., 2016. The state of family farms in the world. World Dev., 87, 1-15,
IRSG (International Rubber Study Group), 2017. Rubber statistical bulletin. Singapore: IRSG.
Landais E., 1998. Agriculture durable : les fondements d'un nouveau contrat social ? Courrier Environ., 33, 5-22.
Lowder S.K., Skoet J. & Raney T., 2016. The number, size, and distribution of farms, smallholder farms and family farms worldwide. World Dev., 87, 16-26.
M’Hamdi N., Aloulou R., Hedhly M. & Ben Hamouda M., 2009. Évaluation de la durabilité des exploitations laitières tunisiennes par la méthode IDEA. Biotechnol. Agron. Soc. Environ., 13(2), 221-228.
NSO (National Statistical Office), 2014. 2013 Agricultural census. Whole country. Statistical Forecasting Bureau, http:// www.nso.go.th, (2/04/2018).
NSO (National Statistical Office), 2017. Summary of labor force survey in Thailand: May 2017, http://www.nso.go.th/sites/2014en/Lists/NewsUpdate/Attachments/35/sumary%20laborMay60Eng%20(1).pdf, (2/04/2018).
Nicod T., 2017. Étude sur les stratégies d’adaptation des petits planteurs d’hévéa thaïlandais, face à la chute du prix du caoutchouc naturel. Mémoire de fin d’études : ISTOM, Angers (France).
OAE (Office of Agricultural Economics), 2017. Office of Agricultural Economics, http://www.oae.go.th/, (2/04/2018).
Poapongsakorn N., Ruhs M. & Tangjitwisuth S., 1998. Problems and outlook of agriculture in Thailand. TDRI Q. Rev., 13(2), 3-14.
Podhisita C., 2017. Household dynamics, the capitalist economy, and agricultural change in rural Thailand. Southeast Asian Stud., 6(2), 247-273.
Ripoll-Bosch R. et al., 2012. An integrated sustainability assessment of Mediterranean sheep farms with different degrees of intensification. Agric. Syst., 105, 46-56.
Sainoi T., Sdoodee S., Lacote R. & Gohet E., 2017. Low frequency tapping systems applied to young-tapped trees of Hevea brasiliensis (Willd. ex A. Juss.) Müll. Arg. in Southern Thailand. Agric. Nat. Resour., 51(4), 268-272.
Somboonsuke B. & Wettayaprasit P., 2013. Agricultural system of natural para rubber smallholding sector in Thailand: system, technology, organization, economy, and policy implication. Hat Yai, Thailand: Prince of Songkla University.
Tilman D. et al., 2002. Agricultural sustainability and intensive production practices. Nature, 418, 671-677.
Van Passel S. & Meul M., 2012. Multilevel and multi-user sustainability assessment of farming systems. Environ. Impact Assess. Rev., 32, 170-180.
Vilain L., 2000. La méthode IDEA. Guide d’utilisation. Dijon, France : Éducagri éditions.
World Bank, 2016. Rural population (% of total population), https://data.worldbank.org/indicator/SP.RUR.TOTL.ZS?view=chart, (3/04/2018).
Zahm F. et al., 2008. Assessing farm sustainability with the IDEA method – from the concept of agriculture sustainability to case studies on farms. Sustainable Dev., 16, 271-281.
Notes
1 RRIT (Rubber Research Institute of Thailand), 2013. Thailand rubber statistics (annual report). Bangkok: Ministry of Agriculture.
