


- Accueil
- Volume 25 (2021)
- Numéro 1
- Is it possible to predict milk processing into butter using infrared spectroscopy?


Visualisation(s): 3639 (41 ULiège)
Téléchargement(s): 123 (3 ULiège)

Is it possible to predict milk processing into butter using infrared spectroscopy?

Document(s) associé(s)
Version PDF originaleNotes de la rédaction
Received 6 February 2020, accepted 3 February 2021, available online 17 February 2021
This article is distributed under the terms and conditions of the CC-BY License (http://creativecommons.org/licenses/by/4.0)
Résumé
Étude de l’aptitude à la transformation du lait en beurre par des techniques de spectroscopie infrarouge
Description du sujet. Étant donné le faible prix actuel du lait, bon nombre de producteurs ont opté pour la transformation de leur lait en produits à plus haute valeur ajoutée, dont le beurre. Cependant, tous les laits n’ont pas la même aptitude à la transformation en beurre. Il serait donc intéressant de pouvoir prédire l’aptitude à la transformation du lait.
Objectifs. Le but de cet article était d’étudier l’aptitude à la transformation du lait en beurre au moyen de la spectroscopie infrarouge.
Méthode. Un protocole normalisé pour la fabrication de beurre a été développé. Des échantillons de lait (n = 110), collectés entre 2013 et 2016, ont été analysés par spectroscopie dans les proche et moyen infrarouges (315 spectres). Les échantillons de beurre ont aussi été analysés dans les infrarouges proche et visible (220 spectres). La composition des produits a ensuite été évaluée grâce à des équations de prédiction validées. Des analyses en composantes principales ont été réalisées pour décrire les échantillons.
Résultats. Les propriétés des beurres semblaient être influencées par les saisons et l’alimentation. La teneur en eau et les paramètres de couleurs ont pu être prédits sur base des spectres infrarouges du beurre.
Conclusions. Il a été possible de relier certaines caractéristiques des beurres aux propriétés des laits. Cependant, il n’a pas été possible de prédire les caractéristiques des beurres sur base des spectres des laits dans le proche infrarouge. Il pourrait être intéressant de tenter de telles prédictions à partir de spectres du lait dans le moyen infrarouge.
Abstract
Description of the subject. Given the current low price of milk, a lot of producers have decided to process their milk into products with a higher added-value, including butter. However, all milks are not suitable to be transformed into butter. It would thus be useful to be able to predict milk processing properties.
Objectives. The aim of this paper was to study the ability of milk to be processed into butter using infrared spectrophotometry.
Method. A normalized protocol for the production of butter was developed. Milk samples (n = 110) collected between 2013 and 2016 were analyzed by near and medium infrared spectrometry (315 spectra). Butter samples were also analyzed by visible-near infrared spectrometry (220 spectra). Composition of the products was subsequently assessed using validated prediction equations. Principal components analyses were performed to discriminate samples.
Results. Butter properties seemed to be influenced by seasons and feedings. Water content and color parameters could be predicted on the basis of butter infrared spectra.
Conclusions. It was possible to correlate butter characteristics with milk properties. However, it was not possible to predict butter characteristics on the basis of milk near infrared spectra. It could be interesting to try predictions from milk medium infrared spectra.
Table des matières
1. Introduction
1Milk is not always consumed as such. Indeed, milk can be transformed into various dairy products, including cheese, milk powder and butter (Holroyd, 2013). Butter is a one of the oldest dairy products worldwide (El-Hajjaji et al., 2019). Butter must be composed of at least 80% of milk fat, and of less than 16% of water (Codex Alimentarius, 2018). Conventional methods for analyzing the chemical composition of butter are slow, expensive, and require highly qualified workers (Hermida et al., 2001; Dvorak et al., 2016). Spectroscopic techniques are now widely used in the field of food control. They are often associated with chemometrics, defined by Massart et al. (1997) as a chemical discipline using mathematical and statistical methods to provide maximum chemical information by analyzing chemical data. Infrared (IR) spectrometry is widely used to predict the major components of milk and dairy products (Hermida et al., 2001; Fagan et al., 2009; Abbas et al., 2012; Baeten et al., 2014). Near-infrared (NIR) and mid-infrared (MIR) spectroscopies are useful tools for quality control in the food industry (Karoui & De Baerdemaeker, 2007). Those are indeed faster than conventional methods, and require little or no sample pre-treatments (Hermida et al., 2001).
2The dairy sector has faced a lot of changes since 1984, when milk quotas were established by the European Union (EU) in order to limit milk surplus. As a result, the total number of dairy farmers has dramatically decreased, falling from 47,000 in 1984 to 7,000 in 2018 in Belgium (Confédération belge de l’Industrie laitière, 2019). Nevertheless, in March 2015, EU removed milk quotas. This evolution led to an increase in milk production and hence to a decrease in milk prices. In Belgium, 6,995 dairy farms are currently identified, with a milk production of around 4 billion liters per year (Confédération belge de l’Industrie Laitière, 2019). An alternative for some farmers is to transform milk into dairy products with a higher added-value (Agence wallonne pour la Promotion d’une Agriculture de Qualité, 2021). This enables farmers to answer the price decrease by diversifying their sources of income and by favoring local food networks. More than 480 Walloon farmers and 260 Flemish farmers currently transform their milk into butter, yoghurts and cheeses (La Spina, 2016). For the year 2018, butter production in Belgium was 103.5 million kg, including industrial and artisanal butter (Confédération belge de l’Industrie laitière, 2019). Annual data related to artisanal butter manufacture are not available.
3On-farm transformation is not so easy. It requires technical qualification, as well as time and a thorough feasibility study (La Spina, 2016). It is known that milk processing depends on several factors, including animal age, lactation number and stage, season, diet composition, milk chemical composition and breed (Dal Zotto et al., 2008). In this context, it would be useful for farmers to predict when milk would not be suitable for butter manufacture. The development of easy and fast methods to analyze dairy products would also be of interest. The aim of this paper was to evaluate the processing of Walloon milk into butter, in order to identify the influence of milk properties on the processing and on the final butter characteristics using IR spectrometry techniques.
2. Materials and methods
2.1. Milk samples
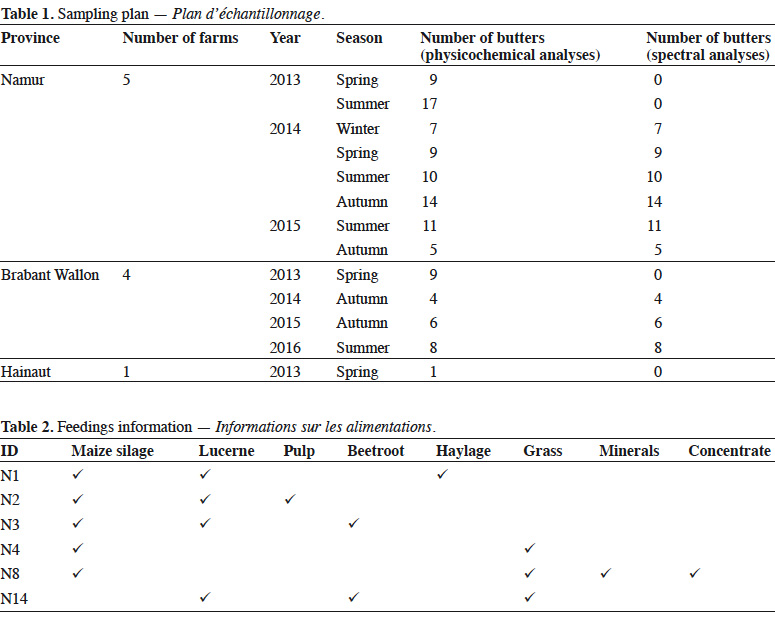
4A total of 110 milk samples were collected from 10 farms in three Belgian provinces, namely Namur, Brabant Wallon and Hainaut, between 2013 and 2016 (Table 1). The entire milk given by one cow during one milking was collected for 107 of these samples. The three remaining samples were taken from milk tank. Different breeds were considered, namely (a) Holstein (n = 89), (b) Jersey (n = 12), (c) Holstein x Jersey (Kiwi, n = 6), (e) Brown Swiss (n = 1), (f) dual purpose Belgian Blue (n = 1) and (g) Kiwi x Maine Anjou (n = 1). Milk was collected separately during morning (65 samples) and evening (42 samples) milkings. Information about feedings is presented in table 2. Milk was transported to the laboratory within 3 h in a 34 l plastic drum with screw lid closure (CurTec, Rijen, Netherlands) and directly transformed into butter.
2.2. Milk analyses
5Before butter manufacture, each milk sample was characterized. Milk pH was measured using pH meter 340i (WTW, Weilheim, Germany) with electrode LoT406-M6-DXK-S7/25 (Mettler Toledo, Colombus, OH, USA). Dornic acidity was analyzed in duplicate: 10 ml of milk were titrated by NaOH (0.111 M) in the presence of phenolphthalein. Dornic acidity was expressed in tenths of NaOH milliliters. The day of sampling, an aliquot of milk was mixed with 75 µL of a blend of Bronopol and methylene blue at the laboratory for further IR analyses. NIR spectra of milk were also obtained using FT-NIR spectrometer MPA (Bruker Optics, Ettlingen, Germany). Milk samples were transferred to the Comité du Lait (Battice, Belgium) for MIR analyses, using MIR MilkoScan FT6000 (FOSS, HillerØd, Denmark). Mean analysis period was seven 7. On the basis of MIR spectra, the Comité du Lait laboratory provided the total nitrogen content and prediction equations, developed by Soyeurt et al. (2009; 2011), were used to determine milk composition. Predicted components included: minerals (Na, Ca, P, Mg) and fat (saturated fat, SFA; mono-unsaturated fatty acids, MUFA; poly-unsaturated fatty acids, PUFA; short-chain fatty acids, SCFA; medium-chain fatty acids, MCFA; long-chain fatty acids, LCFA).
2.3. Butter manufacture
6Each milk sample was used to manufacture butter in duplicate, following the process described in figure 1. Milk was heated to 39 °C and skimmed using cream separator Model 125 (Elecrem, Fresnes, France). Cream collected from a milk sample was divided in order to manufacture two butter batches. Creams were heated to 82 °C before being directly dipped into iced water, in order to quickly drop the temperature to 25 °C. Creams were then seeded with Flora Danica MSP (CHR Hansen, HØrsholm, Denmark) at a rate of 375.10-3 kg·kg-1. After 6 h of maturation in a water bath at 25 °C, creams were transferred at 4 °C for 12 h. Churning was performed using Artisan 5KSM150 food processor (KitchenAid, Brenton Harbor, Michigan, USA). Churning was carried out with a wire whip at speeds 6 and 8 for 2 min at each speed, and finally at speed 10 until the appearance of butter grains. Buttermilk was removed using a culinary sieve (fine mesh, hole of 1 mm²), and butter grains were washed with cold water until complete removal of buttermilk. Butter grains were mixed with the flat beater at speed 1 for 1 min. Any buttermilk surplus was removed using the sieve and the butter was mixed a second time with the flat beater at speed 1 for 1 min, before shaping.
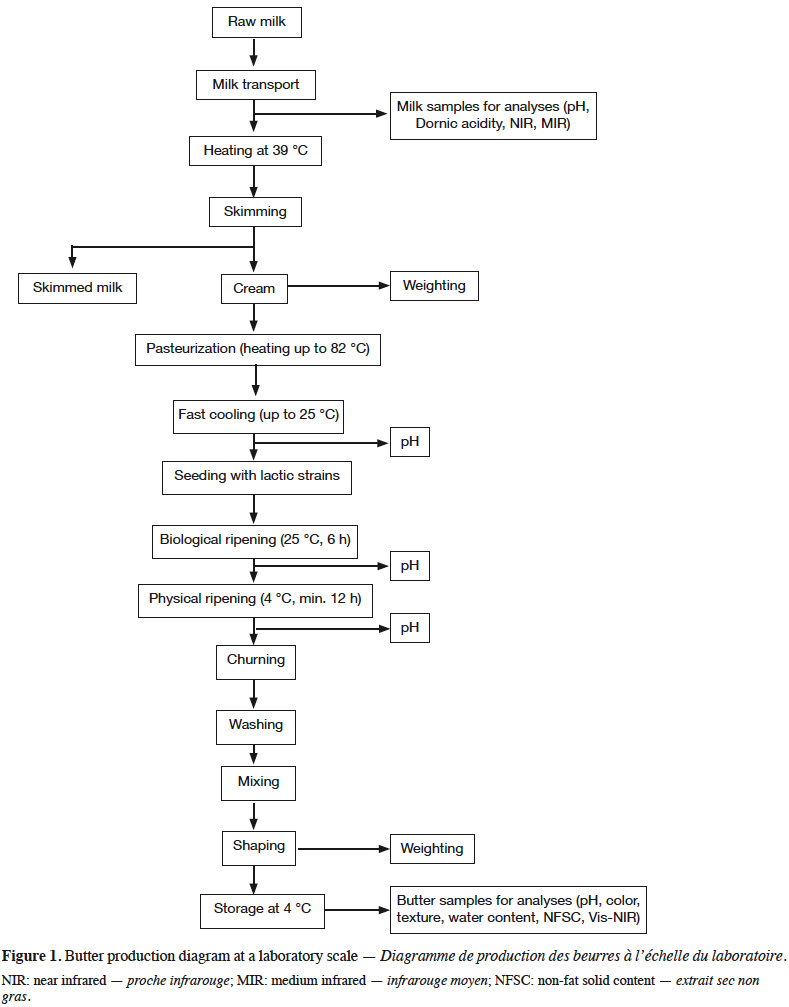
7Various parameters were measured during butter manufacture. After biological ripening and after physical ripening, pH was measured using pH meter 340i (WTW, Weilheim, Germany) with electrode LoT406-M6-DXK-S7/25 (Mettler Toledo, Colombus, OH, USA). The skimming yield was also calculated.
2.4. Butter analyses
8Analyses were performed on the two butter batches produced from each milk sample and averages and standard deviations were calculated. Firstly, all samples were weighted. Butter yields from milk and from cream were determined. Butter pH was measured using the same pH meter as previously mentioned, but with electrode LoT406-M6-DXK-S7/25, suitable for the analysis of semi-solid samples (Mettler Toledo, Colombus, OH, United States). Water content (WC) and non-fat solid content (NFSC) were determined following NF EN ISO 3727 December 1995 (V 04-392) (AFNOR, 1995). Butterfat (BF) was calculated by subtracting the water content and NFSC to 100% (BF = 100 – WC – NFSC). Butter color was evaluated using Miniscan XE 45/0-L spectrophotometer (Hunterlab, Reston, VA, USA), calibrated with black and white tiles. Three parameters were obtained, namely (a) L*; lightness ranging from 0 for a total absorption (black color) to 100 for a total reflection (white color), (b) a*; ranging from green (negative) to red (positive) and (c) b*; ranging from blue (negative) to yellow (positive).
9Butter hardness was evaluated using TA-XT2 texture analyzer (Stable Micro Systems, Surrey, England), the apparatus and samples being placed in a refrigerated room at 13 °C (for at least 4 h) in order to determine the resistance of butter to a penetration force. A conical probe (10 mm of diameter) penetrated the butter to a depth of 18 mm at a rate of 0.2 mm·min-1. The penetration force was read at 5, 10 and 18 mm of depth.
10A butter aliquot was removed and frozen for further visible NIR (Vis-NIR) analysis. Before being analyzed, frozen samples were placed in the refrigerator at 13 °C for at least 12 h. Samples were then placed in small ring cups (10 mm of thickness) and analyzed with a XDS Rapid Content™ Analyzer Vis-NIR spectrometer (400-2,500 nm) (FOSS, HillerØd, Denmark). The duplicate spectra were averaged and used for subsequent chemometric analyses.
2.5. Statistical analysis and chemometrics
11All statistical analyses were performed using The Unscrambler X v10.3 software (CAMO Software AS, Oslo, Norway). First of all, descriptive statistics were calculated to evaluate the butter manufacture: for each parameter/property during manufacture, a coefficient of variation was calculated from results measured on the two butter batches produced from the same milk sample.
12Principal component analyses (PCA) were performed to look for relations between butter characteristics (Vis-NIR spectra and physicochemical data) and data gathered on milk samples. Mean Vis-NIR spectra were smoothed and normalized, and their first derivatives were calculated using the Savitzky-Golay filter. The first derivatives were used to perform PCA. Pearson correlation coefficients were also calculated.
13Prediction equations were built. Partial least squares (PLS) regression allowed to correlate the butter physicochemical characteristics with Vis-NIR butter spectra. Models were validated using an internal cross-validation, named leave-one-out milk. All analyses were performed on the first derivative of IR spectra. Several parameters were considered to evaluate the quality of the model, namely the coefficient of cross-validation (R²CV), the root-mean-square error of cross-validation (RMSECV), and the ratio of performance to deviation (RPD), defined as the ratio between the standard deviation of the calibration set and the standard error of cross-validation (Colinet et al., 2013).
3. Results
3.1. Characterisation of milk samples
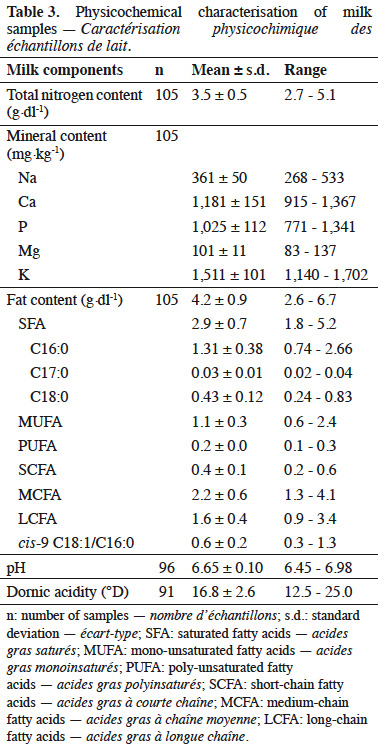
14The chemical composition of milk samples is presented in table 3. The complete composition is not shown. Mean pH of the milk was 6.65 (± 0.10) and mean Dornic acidity was 16.8 (± 2.6) °D.
3.2. Quality of manufactured butter
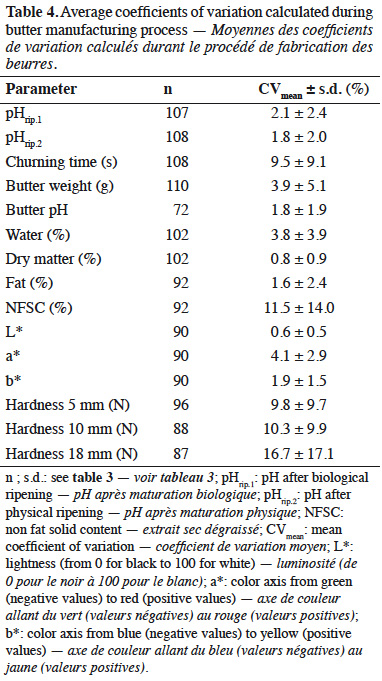
15Averages of coefficients of variation are presented in table 4. Coefficients of variation were calculated for each parameter based on both butters manufactured from each milk sample. Most coefficients of variation were lower than 10%.
3.3. Characterisation of butters
16The parameters measured during butter production are presented in table 5. The average pH of cream was 6.69 (± 0.10). The pH was also measured after biological ripening (pHrip.1) and after physical ripening (pHrip.2). These values were 5.34 ± 0.53 and 5.23 ± 0.55, respectively. The mean churning time was 578 (± 460) s. The skimming yield, defined as the amount of cream obtained from a given amount of milk (expressed in %), was 11.1 (± 2.4)%. The butter yields were expressed compared to cream amount (butter yieldcream) or to milk (butter yieldmilk). The mean butter yieldcream was 38.0 (± 11.9)%, and the mean butter yieldmilk was 4.1 (± 1.2)%.
17When possible correlations involving the butter yieldmilk were considered, a statistically significant linear correlation was obtained with the fat content (0.68). A positive correlation was also found with saturated fatty acids (0.63), and more specifically with fatty acids C16 (0.62), C17 (0.67), and C18 (0.62).
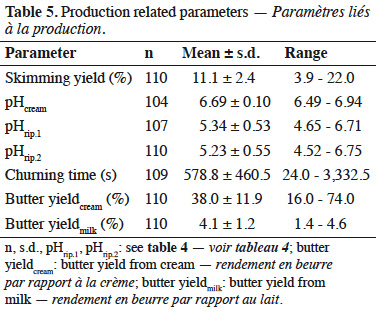
18The best linear correlation for churning time was found with the cream fat content (-0.87). A good linear correlation was also obtained with fatty acid C18 in milk (-0.64). The churning time was negatively correlated with the fat content and all the fat compounds in milk (fatty acids, PUFA, MUFA, SCFA, MCFA and LCF). In this study, pH of the cream was not significantly correlated with churning time.
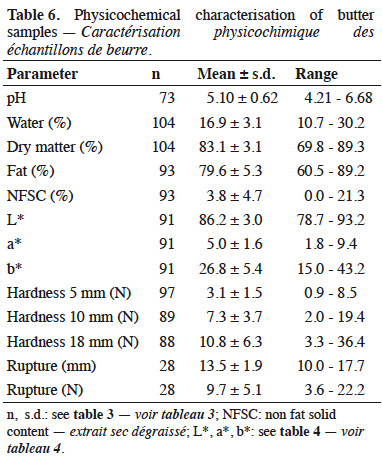
19The physicochemical characterization of butters is presented in table 6. Average results for fat content, water content and NFSC were respectively 79.6 ± 5.3%, 16.9 ± 3.1% and 3.8 ± 4.7%. Among samples, 54% had water content higher than 16% and 34% had NSFC higher than 2%. In terms of hardness, some samples broke during the penetration test. In such cases, the distance and the force of rupture were observed. Mean pH of butter was 5.10 (± 0.62).
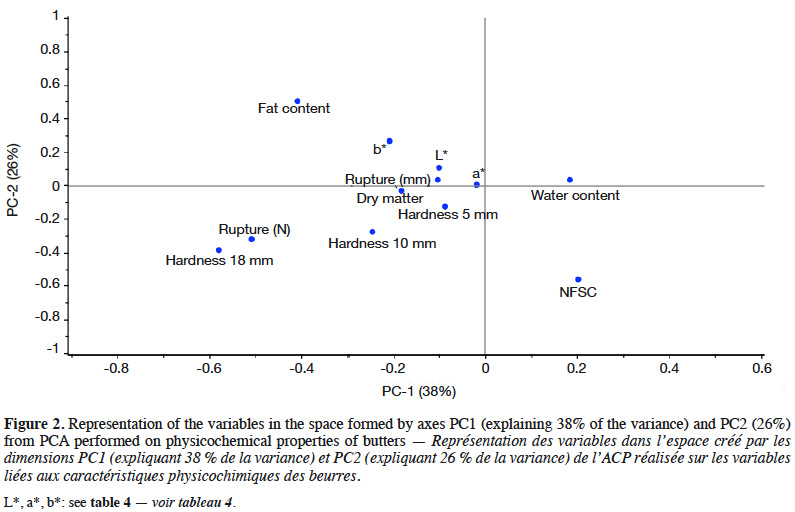
20Correlations were studied. The pH of butter was directly linked to the pH of cream during ripening (0.90 with pHrip.1 and 0.95 with pHrip.2). Hardness at 5 mm was correlated with hardness at 10 mm (0.96) and at 18 mm (0.59). Hardness was negatively correlated to the spreadability index (cis 9 C18:1/C16) and to the PUFA content expressed as a percentage of fat. A negative correlation between the NFSC and the butter fat content (-0.82) was found, as expected. The fat content of cream was positively correlated with several fat compounds from milk. The best correlations were found with the C16 and C17 content of milk (0.79 and 0.77). The overall physicochemical results were studied by performing a PCA. The loadings graph for PC1-PC2 is presented in figure 2. The first two principal components (PCs) explained 64% of the total data variability. The best correlated properties with these two axes were fat and water content, NSFC and hardness at 18 mm.
21PCA graphs with sample grouping are not shown. Butter samples were grouped by milkings, years, feedings, breeds and seasons. The milking time seemed to have no influence on the sample distribution. No clear tendency could be found.
3.4. IR analyses
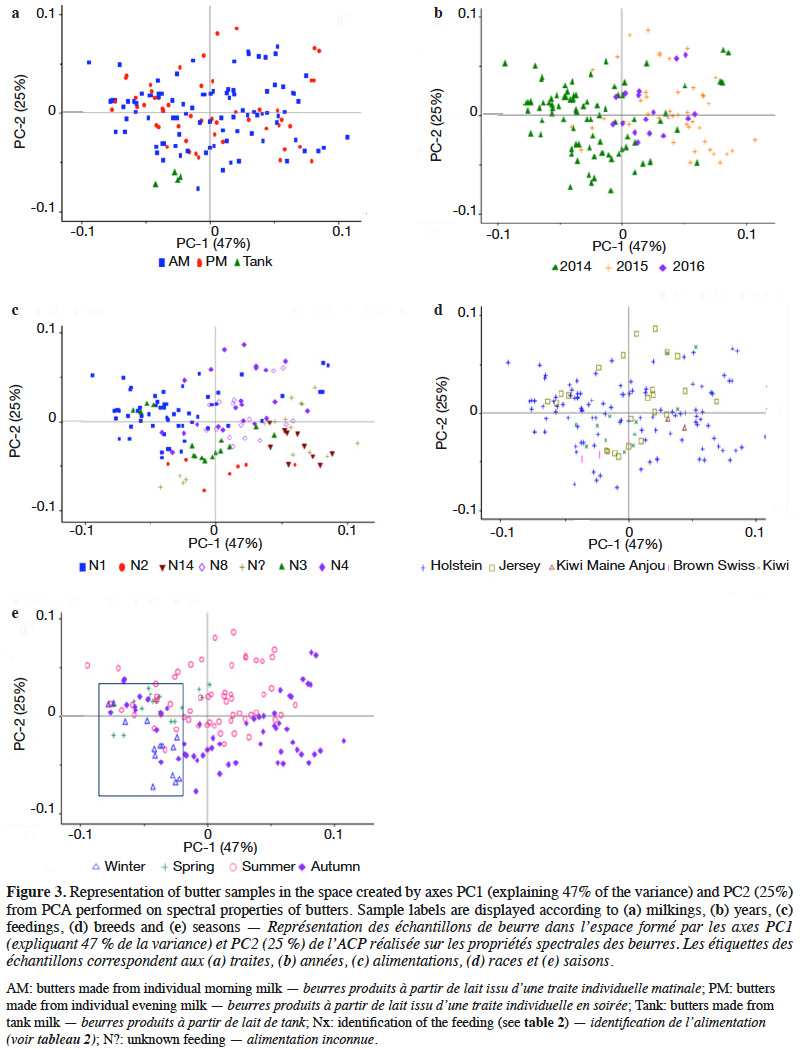
22A PCA was performed to interpret the data. Graphs are presented in figure 3, with PC1-PC2. The first two PCs explained 72% of the total data variability. Butter samples were grouped by milkings (morning or evening) (a), years (b), feedings (c), breeds (d) and seasons (e). As observed in connection with physicochemical properties, the milking time seemed to have no influence on the sample distribution. No significant differences were observed between butter made from morning milk and butter made from evening milk. The same observation also applied to the breed effect. The year seemed to influence the sample distribution, as well as feedings. Season also had an impact on the sample distribution. Two clusters were observed, uniting winter and spring in one group, and summer and autumn in another group.
23PLS regressions were performed on spectral data (Vis-NIR butter spectra) in order to predict some butter characteristics. A leave-one-out (milk) cross-validation was used. The best predicted parameters were water content (RPD = 2.53), L* (RPD = 2.06), a* (RPD = 2.85) and b* (RPD = 2.64), as RPD is considered as a way of assessing relative predictive performance (Holroyd, 2013).
24The same approach was used to try to predict butter properties thanks to NIR spectra of milks. Results are not shown, prediction quality being poor.
4. Discussion
25Milk composition predicted from MIR spectra is consistent with the literature (Brochu et al., 1984; Amiot et al., 2002; Mahaut et al., 2003). Normal protein and fat contents for bovine milk are 2.9-5.0% and 2.4-5.5%, respectively (Amiot et al., 2002). Results presented in this paper are in agreement with normal pH for fresh healthy milk, i.e. 6.6-6.8 (Amiot et al., 2002). Healthy milk also has titratable acidity comprised between 15 and 18 °D, as it was the case for the present milk samples (Mahaut et al., 2003). Variability was observed between milk samples, which is not surprising provided that milks from different breeds were analyzed, namely Holstein, Jersey, Kiwi, Brown Swiss, dual purpose Belgian Blue and Kiwi x Maine Anjou, and that variations in milk composition are observed between breeds (Carroll et al., 2006).
26Provided that butter manufacture required addition of lactic starters, an expected pH decrease was observed during ripening because of lactic acid production (Boutonnier, 2007). Final pH of butter was 5.10 ± 0.62. In comparison, mean pH of samples analyzed during a recent study on raw milk butter from 20 Belgian farms was 5.12 ± 0.47 (El-Hajjaji et al., 2020). To evaluate butter manufacturing process, coefficients of variation were calculated. In general, mean coefficients of variation were quite low, i.e. < 10%. However, a higher variability was observed for churning time, NFSC and hardness.
27Churning time was indeed highly variable; some samples being churned very rapidly while others were churned more slowly, as observed by Bobe et al. (2003; 2007). According to available literature, churning time depends on a lot of factors, including fat composition of cream, pH of buttermilk, size of fat globules, cream viscosity and temperature (Brochu et al., 1984; Bobe et al., 2007; Funahashi & Horiuchi, 2008).
28Butter yields from milk and cream were 4.10 ± 1.20% and 38.0 ± 11.9%, respectively. All measured yields were consistent with those found in the literature (Jeantet et al., 2008). Butter yieldmilk was positively correlated with fatty acids C16, C17 and C18. Fatty acids C16 and C18 are abundant in milk fat (22-35% and 9-14% of total milk fatty acids respectively) and consequently in butter (Jensen, 2002; MacGibbon & Taylor, 2006). However, the correlation with C17 was more surprising as it is a minor milk fatty acid (< 1% of total milk fatty acids) (Chilliard et al., 2009).
29Concerning churning time, a negative correlation was observed with cream fat content, milk fat content and all the fat compounds in milk (fatty acids, PUFA, MUFA, SCFA, MCFA and LCFA). It is known that a high fat content in the cream facilitates churning (Keogh, 2006).
30On average, the manufactured butters did not comply with regulatory requirements, which stipulate the following characteristics: (a) at least 80% of milk fat content, (b) less than 16% of water content and less than 2% of NFSC (Codex Alimentarius, 2011). It is known that several factors influence water content of butter (Funahashi & Horiuchi, 2008). In this study, it could be the milk composition, the fat content of the cream or buttermilk draining.
31Correlation between butter hardness and milk PUFA content, as well as with the spreadability index, is known, as observed by Couvreur et al. (2006) and Hurtaud & Peyraud (2007).
32The pH of butters was directly linked to the pH of cream during ripening (0.90 with pHrip.1 and 0.95 with pHrip.2). The fat content of cream was positively correlated with several fat compounds from milk. The best correlations were found with the C16 and C17 content of milk (0.79 and 0.77). As already said, this correlation with C17 content is surprising, as it is a minor milk constituent. Consequently the C17 content influence should be more investigated in future experiments.
33Regarding PCA, season seemed to be a discriminating factor. Gori et al. (2012) also found that seasons could be discriminating. Heussen et al. (2007) observed a seasonal effect on NIR spectra of butters. It was also clear that feedings, farms and seasons were linked and formed a set of factors influencing sample properties (and hence sample distribution on graphs). In this study, year seemed to influence the sample distribution. This could be due to the original database, which was not ideally balanced from year to year (see Table 1).
34With PLS regressions, some parameters were predicted (water content, L*, a* and b*). Vis-NIR spectra could therefore be a good tool for predicting some butter characteristics, as RPD is higher than 2 for some properties. Hermida et al. (2001) also used NIR spectroscopy to predict water content, fat and NFSC of butters and showed that this technique is suitable for analyzing butter.
5. Conclusions
35The goal of this paper was to provide new insights into the prediction of the ability of milk to be transformed into butter according to regulatory requirements, using spectrophotometry techniques. It was observed that no significant correlations exist between butter quality and qualitative aspects associated to milk, including milking time and breeds. The only significant correlations identified were linked to seasons and feedings. Vis-NIR spectra could possibly allow the prediction of some butter properties, such as color or water content, allowing to avoid more time-consuming methods to determine butter characteristics. A future prospect should be to develop new prediction equations in order to predict butter constituents from butter Vis-NIR spectra. Collected milk samples showed great variability in terms of physicochemical properties and composition, but milk NIR spectra could not be considered as a powerful tool to predict butter characteristics, as no new interesting correlations between butter and milk composition were identified during this study. It could be interesting to focus on cream properties and to look for potential correlations between creams and butter in order to be able to predict butter manufacture. An interesting perspective could be to explore the ability of milk MIR spectra to be used for this purpose. Another idea would be to perform the same study on butters manufactured using a pilot-scale churn.
Acknowledgements
36The authors acknowledge the financial support granted by the Ministry of Agriculture of the Walloon Region of Belgium (Service Public de Wallonie, Direction Générale Opérationnelle Agriculture, Ressources Naturelles et Environnement, research project D31-1340). The authors also wish to thank the Comité du lait milk laboratory in Battice (Belgium) for providing spectral data, the farmers for their contribution and the technical staff of the Walloon Agricultural Research Centre and Gembloux Agro-Bio Tech.
Bibliographie
Abbas O., Dardenne P. & Baeten V., 2012. Near-infrared, mid-infrared, and raman spectroscopy. In: Picó Y., ed. Chemical analysis of food: techniques and applications. Amsterdam: Elsevier, 59-90.
AFNOR, 1995. NF EN ISO 3727 Décembre 1995. Beurre – Détermination des teneurs en eau, matière sèche non grasse et en matière grasse sur la même prise d’essai (méthode de référence). La Plaine Saint-Denis, France : AFNOR.
Agence wallonne pour la Promotion d'une Agriculture de Qualité, 2021. Informations générales sur les produits laitiers dérivés wallons, https://www.apaqw.be/fr/informations-generales-sur-les-produits-laitiers-derives-wallons, (11/02/2021).
Amiot J. et al., 2002. Composition, propriétés physicochimiques, valeur nutritive, qualité technologique et techniques d’analyse du lait. In : Vignola C.L., ed. Science et technologie du lait. Transformation du lait. Québec, Canada: Presses Internationales Polytechniques, 1-73.
Baeten V. et al., 2014. Vibrational spectroscopy methods for the rapid control of agro-food products. In: Nollet L.M.L., ed. Handbook of food analyses. 3rd ed. Boca Raton, FL, USA: CRC Press, 591-622.
Bobe G. et al., 2003. Texture of butter from cows with different milk fatty acid compositions. J. Dairy Sci., 86, 3122-3127, doi.org/10.3168/jds.S0022-0302(03)73913-7
Bobe G. et al., 2007. Butter composition and texture from cows with different milk fatty acid compositions fed fish oil or roasted soybeans. J. Dairy Sci., 90, 2596-2603, doi.org/10.3168/jds.2006-875.
Boutonnier J.L., 2007. Matière grasse laitière – Crème et beurre standard. Techn. Ing., F 6321, 1-16.
Brochu E. et al., 1984. Science et technologie du lait : principes et applications. Québec, Canada : La Fondation de Technologie laitière du Québec.
Carroll S.M. et al., 2006. Milk composition of Holstein, Jersey, and Brown Swiss cows in response to increasing levels of dietary fat. Anim. Feed Sci. Technol., 90, 451-473, doi.org/10.1016/j.anifeedsci.2006.06.019
Chilliard Y., Martin C., Rouel J. & Doreau M., 2009. Milk fatty acids in dairy cows fed whole crude linseed, extruded linseed, or linseed oil, and their relationship with methane output. J. Dairy Sci., 92, 5199-5211, doi.org/10.3168/jds.2009-2375
Codex Alimentarius, 2011. Lait et produits laitiers. 2è éd., http://www.fao.org/3/a-i2085f.pdf, (06/02/20).
Codex Alimentarius, 2018. CXS 279-1971 Norme pour le beurre, http://www.fao.org/fao-who-codexalimentarius/sh-proxy/fr/?lnk=1&url=https%253A%252F%252Fworkspace.fao.org%252Fsites%252Fcodex%252FStandards%252FCXS%2B279-1971%252FCXS_279f.pdf, (8/2/2021).
Colinet F. et al., 2013. Potentiel d’utilisation de la spectrométrie moyen infrarouge pour prédire le rendement fromager du lait et étudier sa variabilité génétique. In : 20è Rencontres Recherches Ruminants, 4-5 décembre 2013, Institut de l’Élevage, Paris. Paris : INRA, 153-156.
Confédération belge de l'Industrie laitière, 2019. Rapport annuel 2019, https://bcz-cbl.be/media/382772/2019_jaarverslag_bcz_fr.pdf, (11/02/2021).
Couvreur S. et al., 2006. The linear relationship between the proportion of fresh grass in the cow diet, milk fatty acid composition, and butter properties. J. Dairy Sci., 89, 1956-1969, doi.org/10.3168/jds.S0022-0302(06)72263-9
Dal Zotto R. et al., 2008. Reproducibility and repeatability of measures of milk coagulation properties and predictive ability of mid-infrared reflectance spectroscopy. J. Dairy Sci., 91, 4103-4112, doi.org/10.3168/jds.2007-0772
Dvorak L., Luzova T. & Sustova K., 2016. Comparison of butter quality parameters available on the Czech market with the use of FT NIR technology. Mljekarstvo, 66, 73-80, doi.org/10.15567/mljekarstvo.2016.0108
El-Hajjaji S. et al., 2019. Overview of the local production process of raw milk butter in Wallonia (Belgium). Int. J. Dairy Technol., 72, 466-471, doi.org/10.1111/1471-0307.12608
El-Hajjaji S. et al., 2020. Assessment of growth and survival of Listeria monocytogenes in raw milk butter by durability tests. Int. J. Food Microbiol., 321, 108541, doi.org/10.1016/j.ijfoodmicro.2020.108541
Fagan C.C., O’Donnell C.P., Rudzik L. & Wüst E., 2009. Milk and dairy products. In: Sun D.W., ed. Infrared spectroscopy for food quality analysis and control. Amsterdam: Elsevier.
Funahashi H. & Horiuchi J., 2008. Characteristics of the churning process in continuous butter manufacture and modelling using an artificial neural network. Int. Dairy J., 18, 323-328.
Gori A. et al., 2012. A rapid method to discriminate season of production and feeding regimen of butters based on infrared spectroscopy and artificial neural networks. J. Food Eng., 109, 525-530, doi.org/10.1016/j.jfoodeng.2011.10.029
Hermida M., Gonzalez J.M., Sanchez M. & Rodriguez-Otero J.L., 2001. Moisture, solids-non-fat and fat analysis in butter by near infrared spectroscopy. Int. Dairy J., 11, 93-98, doi.org/10.1016/S0958-6946(01)00039-5.
Heussen P.C.M., Janssen H.G., Samwel I.B.M. & van Duynhoven J.P.M., 2007. The use of multivariate modelling of near infra-red spectra to predict the butter fat content of spreads. Anal. Chim. Acta, 595, 176-181, doi.org/10.1016/j.aca.2007.01.048
Holroyd S.E., 2013. Review: the use of near infrared spectroscopy on milk and milk products. J. Near Infrared Spectrosc., 21, 311-322, doi.org/10.1255%2Fjnirs.1055
Hurtaud C. & Peyraud J.L., 2007. Effects of feeding Camelina (seeds or meal) on milk fatty acid composition and butter spreadability. J. Dairy Sci., 90, 5134-5145, doi.org/10.3168/jds.2007-0031
Jeantet R. et al., 2008. Les produits laitiers. Paris : Lavoisier, Éditions Tec & Doc.
Jensen R.G., 2002. The composition of bovine milk lipids: January 1995 to December 2000. J. Dairy Sci., 85, 295-350, doi.org/10.3168/jds.S0022-0302(02)74079-4
Karoui R. & De Baerdemaeker J., 2007. A review of the analytical methods coupled with chemometric tools for the determination of the quality and identity of dairy products. Food Chem., 102, 621-640, doi.org/10.1016/j.foodchem.2006.05.042
Keogh M.K., 2006. Chemistry and technology of butter and milk fat spreads. In: Fox P.F. & McSweeney P.L.H., eds. Advanced dairy chemistry. Vol. 2. Lipids. Berlin, Germany: Springer, 333-363.
La Spina S., 2016. Pistes d’avenir pour le secteur laitier wallon. Jambes, Belgique : Nature & Progrès.
MacGibbon A.K.H. & Taylor M.W., 2006. Composition and structure of bovine milk lipids. In: Fox P.F. & McSweeney P.L.H., eds. Advanced dairy chemistry. Vol. 2. Lipids. Berlin, Germany: Springer, 1-42.
Mahaut M., Jeantet R. & Brulé G., 2003. Initiation à la technologie fromagère. Paris : Lavoisier, Éditions Tec & Doc.
Massart D.L. et al., 1997. Data handling in science and technology. In: Vandeginste B.G.M. & Rutan S.C., eds. Handbook of chemometrics and qualimetrics. Part A. Amsterdam: Elsevier, 867.
Soyeurt H. et al., 2009. Potential estimation of major mineral contents in cow milk using mid-infrared spectrometry. J. Dairy Sci., 92, 2444-2454, doi.org/10.3168/jds.2008-1734
Soyeurt H. et al., 2011. Mid-infrared prediction of bovine milk fatty acids across multiple breeds, production systems, and countries. J. Dairy Sci., 94, 1657-1667, doi.org/10.3168/jds.2010-3408
