
Genetic structuring of parental populations of coffee (Coffea canephora Pierre ex A. Froehner) breeding in Côte d’Ivoire using SNP markers
Résumé
Structuration génétique des populations parentales de cultures de caféiers (Coffea canephora Pierre ex A. Froehner) en Côte d'Ivoire à l'aide de marqueurs SNP
Description. La culture du café joue un rôle économique et social important en Côte d'Ivoire. Parmi les dizaines d'espèces de Coffea, seule l’espèce Coffea canephora, également appelée robusta, est cultivée dans le pays. L'amélioration génétique de cette espèce a fait l'objet d'un programme de sélection mis en place par le Centre national de la recherche agronomique (CNRA) à travers un programme de sélection récurrente réciproque impliquant deux groupes génétiques de base : un groupe de caféiers guinéens et un groupe de caféiers congolais. Ces groupes ont été déterminés à l'aide de marqueurs enzymatiques peu informatifs.
Objectifs. L’objectif de ce travail est d’affiner la structuration génétique des populations parentales utilisées pour mettre en place le programme de sélection de C. canephora en Côte d’Ivoire en utilisant les marqueurs SNP et de mettre en relation cette structure avec des valeurs en test chez les génotypes concernés.
Méthode. Soixante-six individus représentant les deux populations parentales ont été analysés à l'aide de 200 marqueurs SNP. Les paramètres de la diversité génétique ont été calculés, puis la structure génétique a été déterminée. La production cumulative au cours des quatre premières années de production, la sensibilité à la rouille et la taille des grains ont été évaluées. Les individus guinéens ont été croisés avec un testeur congolais 464 et les individus congolais ont été croisés avec un testeur guinéen 410, ce qui a permis d’évaluer leur aptitude à la combinaison.
Résultats. L'analyse de la variance moléculaire (AMOVA) a révélé que 75 % de la variation totale était due à la variation entre les populations. La classification bayésienne et l'analyse des coordonnées principales (PCoA) ont divisé les 66 génotypes en deux groupes principaux de caféiers guinéens et de caféiers congolais. Alors que le groupe guinéen semble être homogène, le groupe congolais est subdivisé en quatre sous-groupes nommés SG1, SG2, B et C. Les valeurs maximales des tests sont trouvées pour les sous-groupes SG1 et SG2. Le groupe guinéen a montré des performances inférieures. Il est important dans ce groupe de sélectionner les meilleurs géniteurs.
Conclusions. Les marqueurs de SNP ont été efficaces pour évaluer la structure génétique de la population. Cette étude a permis également d'identifier un génotype indéterminé dans les études précédentes. L'utilisation de cet ensemble de marqueurs sera utile pour le contrôle des futurs géniteurs. Le même progrès génétique peut être réalisé en croisant SG1 et SG2 avec un bon père guinéen. Il serait donc important de faire une sélection parmi les caféiers guinéens avant de les croiser avec un testeur congolais.
Abstract
Description. Coffee cultivation plays an important economic and social role in Côte d'Ivoire. Among the dozens of Coffea species, only Coffea canephora, also known as robusta, is grown in the country. The genetic improvement of this species has been the subject of a selection program set up by the National Center for Agronomic Research (CNRA). This program involves two basic genetic groups, Guinean and Congolese. These groups have been determined using enzymatic markers which are known to be less informative. So little is known about the reliability of the genetic structuring of the parental populations.
Objectives. The objective of this work is to refine the genetic structuring of the parental populations used to set up the C. canephora breeding program in Côte d'Ivoire using SNP markers and to relate this structure to test values in the genotypes concerned.
Method. Sixty-six individuals representing parental genotypes of the two populations were analyzed using 200 SNPs markers. The parameters of genetic diversity were calculated and then the genetic structure was determined. The yield over four years of production, susceptibility to rust, and bean size have been evaluated. Results of these agronomic traits have been included in this analysis. The Guinean genotypes were crossed with a Congolese tester named 464 and the Congolese individuals were crossed with a Guinean tester 410, for assessing their combining ability.
Results. The analysis of molecular variance (AMOVA) revealed that 75% of the total variation was due to variation between populations. Bayesian classification and Principal Coordinates Analysis (PCoA) structure the 66 genotypes into two main groups of Guineans and Congoleses. While the Guinean group appears to be homogeneous, the Congolese group is split into four subgroups of SG1, SG2, B and C. Maximum test values are found for the SG1 and SG2 subgroups. The Guinean group showed lower performance. It is important in this group to select the best progenitors.
Conclusions. SNP markers were effective in genetic structuring of the population. This study also allows the identification of a genotype that was not determined. The use of this set of markers will be useful for the control of future progenitors. The same genetic progress can be achieved by crossing SG1 or SG2 with a good Guinean male. It seems important to make a selection among the Guineans before crossing them with a Congolese tester.
Received 23 March 2021, accepted 6 September 2022, available online 6 October 2022.
This article is distributed under the terms and conditions of the CC-BY License (http://creativecommons.org/licenses/by/4.0)
1. Introduction
1Coffee (Coffea sp.) is cultivated in the tropical and intertropical areas of Africa, Madagascar, Comoros, Mascarene Islands (Mauritius and Reunion), Asia, and Australia (Davis et al., 2006). The genus Coffea is subdivided into 130 species (Davis & Rakotonasolo, 2021), all of which belong to the family Rubiaceae (Davis et al., 2011). Among these species, only two are widely cultivated: Coffea arabica and Coffea canephora. The arabica species remains the main commercialized species and the most valued by consumers due to its aroma and taste (Lecolier et al., 2009). The production of C. canephora also known as robusta which had gradually increased and accounted for almost 40% of the world coffee market (ICO, 2018), has experienced a 2.1% decline in global production which will be offset by the 2.1% increase in arabica (ICO, 2021). With more than 13 million tons of green coffee produced representing 169.6 million of 60 kg bags of green coffee for the year 2020/2021 (ICO, 2021), coffee appears among the main export products and rural activities of about 25 million farming families. Its drink, which provides a stimulating and relaxing effect, is consumed by more than 80% of the world's population (Van Der Vossen, 2016).
2In Côte d'Ivoire, C. canephora is the only cultivated coffee species. This species is diploid, strictly allogamous and self-incompatible (Devreux et al., 1959). Its gametophytic type of self-incompatibility system is controlled by a multi-allelic S locus (Berthaud, 1980; Coulibaly et al., 2002). The center of diversification of C. canephora naturally covers area from Guinea in the West to Uganda in the East and from South Sudan in the North to Angola in the South (Davis et al., 2006).
3The genetic diversity of C. canephora was first studied using isoenzymes markers (Berthaud, 1986). This work allowed to split the population into two genetically distinct pools within this species. The first pool is composed of species of Guinean origin and is characterized by stocky trees with short internodes, small leaves, strongly spreading branching, small grain size (often less than 12 g·100 seeds-1), high caffeine content, precocity in production and a high susceptibility to orange rust disease. The second pool is composed of species of Congolese origin and is characterized by tall trees with long internodes, large leaves, weakly spreading ramifications, a big grain size (on average 16 g·100 seeds-1), a moderate caffeine level, a late production and is more resistant to orange rust. The genetic crosses between the two groups revealed that there is an heterosis effect for most of the traits of interest (Leroy, 1993). Based on this result, a reciprocal recurrent scheme has been adopted to improve simultaneously the two identified populations and select based on the traits. However, the success requires the knowledge of the genetic structure inside each parental group constituted. For this purpose, molecular markers have been used, leading to the split of the Congolese pool into several groups. Montagnon et al. (1992) first identified those as SG1 and SG2 groups. Dussert et al. (2003) renamed the SG1 group as genetic group A, then these authors added two other genetic groups to the Congolese pool: B and C. This was confirmed by several studies (Gomez et al., 2009; Musoli et al., 2009; Cubry et al., 2013; Leroy et al., 2014). All these studies were performed using isozymes, microsatellites and RFLP markers. The isozymes markers are known to be less informative whereas the RFLPs are difficult to apply because of the dangerousness of chemicals such as radioactive materials used in the protocol. Microsatellites are polymorphic, co-dominant and reliable markers. However, changes in allele sizes may introduce bias when using this technique. Today, the most stable, repeatable, and cheapest markers are the SNP (Single Nucleotide Polymorphism) markers. Although their development is recent, they offer the advantage of being reproducible and represent definite genomic regions. The application of such markers in the breeding process is partly depending on its effectiveness in structuring the parental populations. Although previous analysis using other markers showed results that linked geographic origin and genetic groups, no studies have been conducted with SNP markers to obtain such results for C. canephora populations breeding in Côte d’Ivoire.
4SNPs or single nucleotide polymorphisms are variations (polymorphism) of a single base-pair of the genome between individuals of the same species. Being very abundant and widespread across many species genomes, SNPs are very effective for detecting polymorphism in low diversity species compared to other molecular marker systems. For example, they have been shown to be the most suitable markers for the study of genetic diversity of C. arabica (Zarate et al., 2010).
5Several SNP-based genetic studies have been reported on C. canephora, demonstrating the usefulness of SNP markers on genebank management, diversity analysis and crop improvement (Garavito et al., 2016; Zhou et al., 2016; Bikila et al., 2017; Anagbogu et al., 2019; Merot-L’Anthoene et al., 2019; Akpertey et al., 2021).
6Furthermore, given the complementary characteristics of the Guinean and Congolese pools, these populations were used to set the scheme by reciprocal recurrent selection (RRS) of the CNRA of Côte d'Ivoire (Leroy et al., 1993; Leroy et al., 1997; Montagnon et al., 2008). The test values of Guinean and Congolese parents, involved in the first cycle of RRS for parameters such as yield, susceptibility to orange rust and grain size were quantified by Montagnon (2000) and were included in our study.
7The objective of the present study is to evaluate the genetic structure of the base population of the reciprocal recurrent selection of C. canephora using SNPs markers and relate this genetic structure to the combining abilities of these genotypes estimated in the first cycle reciprocal recurrent selection.
2. Materials and methods
2.1. Plant material
8The plant material is composed of 66 genotypes belonging to the Congolese and Guinean pools of C. canephora previously selected to set the parental populations of the reciprocal recurrent selection. Among them, 36 individuals are from the Guinean pool which composed one genetic group. In opposite, genotypes of Congolese pool are known to be split into different groups according to previous studies with isozymes, RFLPs or SSRs:
9- the first (named hereafter "B-Und") included four genotypes of the Congolese group B and one undetermined genotype, originate from Central Africa;
10- the second (named hereafter "C") is composed by three genotypes of the Congolese group C originate from Cameroon;
11- the third (named hereafter "SG1") consisted of 10 genotypes of the Congolese group SG1 originate from Gabon;
12- the fourth (named hereafter "SG2") is composed of 12 genotypes of the Congolese group SG2 originate from Central Africa.
13All this plant material is maintained at the research station of the National Agronomic Research Center (CNRA).
2.2. Discovering SNP markers through data mining
14SNP data mining was performed using sequence data of 14 C. canephora genotypes which were deposited in the NCBI Sequence Read Archive (SRA) database. These SRA reads were downloaded from the database and mapped on the C. canephora reference genome (Denoeud et al., 2014) using BWA program. The Genome Analysis Toolkit (GATK) package v 3.520 was used for SNP calling using HaplotypeCaller with default parameter. Then the hard filters (parameters: QD < 2.0 || FS > 60.0 || MQ < 40.0 || MQRankSum < -12.5 || ReadPosRankSum < -8.0) were applied to exclude low-quality alleles. To select high-quality SNPs for experimental validation, any SNPs that had other possible adjacent SNP sites 80 bp upstream or 80 bp downstream were eliminated. From the discovered putative SNPs, a subset of 288 putative SNPs was selected for validation test using the nanofluidic array genotyping system (Fluidigm Co, South San Francisco, CA). The primers of the selected 288 SNPs were designed by Fluidigm and applied on the selected jujube cultivars for validation. Based on the validation result, the top 200 SNPs with high repeatability were used for further analysis in this study of genetic diversity.
2.3. DNA isolation and SNP genotyping
15Genomic DNA was extracted from fresh leave using the modified Mixed Alkyl Trimethyl Ammonium Bromide (MATAB) method. The DNA extracts obtained were quantified using a Nanodrop UV Vis 2000 spectrophotometer (Thermo Scientific, USA). SNP genotyping was performed at USDA-ARS, Sustainable Perennial Crops Lab, Beltsville, MD, USA, using the Fluidigm 96.96 Dynamic ArrayTM (Fluidigm, San Francisco, CA). Each 96.96 Dynamic Array can run 96 samples against 96 SNP assays generating a total of 9,216 data points in a single experiment. One key feature of this protocol is the inclusion of a specific targeted amplification (STA) reaction (Wang et al., 2009), which allows the enrichment of template molecules for each individual Integrated Fluidic Circuit® (IFC) reaction that facilitates the multiplexing during genotyping. An advantage to STA is that it allows the use of limited or low-quality DNA samples and reduces bias that may occur when samples are loaded to the 96 sample wells of the IFC. Since coffee leaf tissues contain high levels of polysaccharides and polyphenolic compounds that can potentially inhibit PCR amplification, the STA step was strongly recommended. The STA reaction was performed as described in the Fluidigm SNP Genotyping User Guide, PN 68000098 Rev I1 (Fluidigm, 2011). The STA master mix consisted of 2.5 µL of TaqMan® Taq polymerase (Life Technologies, Carlsbad, CA), PreAmp Master Mix (2X), 1.25 µL of Pooled assay mix (0.2X), and 1.25 µL of genomic DNA for a total reaction volume of 5.0 µL.
16PCR was performed with an initial denaturation step at 95 °C for 10 min, followed by 14 cycles of a 2-step amplification profile consisting of 15 sec at 95 °C and 4 min at 60 °C. The resulting amplified DNA was then diluted 1:5 in TE buffer to reduce the concentration of any remaining PCR by-products. Samples were then genotyped using the nanofluidic 96.96 Dynamic ArrayTM IFC (Integrated Fluidic Circuit; Fluidigm Corp.). The 96.96 Dynamic Array IFC for SNP genotyping was described by Wang et al. (2009). End-point fluorescent images of the 96.96 IFC were acquired on an EP1TM imager (Fluidigm Corp.). The data was recorded with Fluidigm Genotyping Analysis Software (Fluidigm, San Francisco, CA).
2.4. Genetic structure and diversity parameters
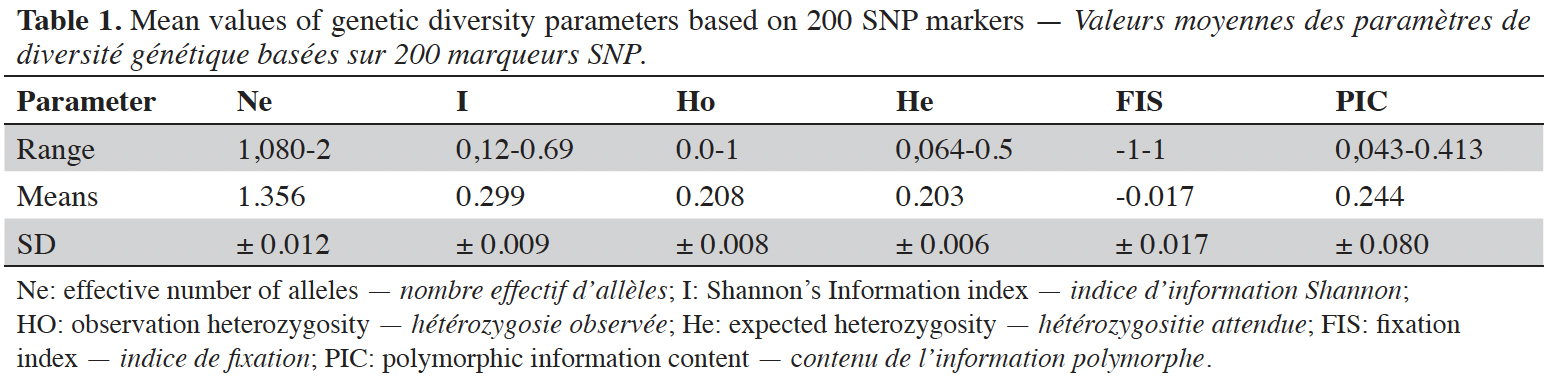
17The following parameters were calculated using GenAlEx 6.5 software (Peakall & Smouse, 2012) to analyze the diversity among and within genetic groups of coffee trees: the effective number of allele (Ne), observed heterozygosity (Ho), the expected heterozygosity (He), the Shannon diversity index (I) and the fixation index (FIS). Mann-Whitney U test was used to compare observed and expected heterozygosity values. Molecular Analysis of Variance (AMOVA) was performed to determine the level of genetic differentiation between and within populations.
18Differences between populations were measured using PhiPT (analogue of binding index FST), as implemented in the GenAlEx 6.5 program (Peakall & Smouse, 2012). The significance of AMOVA was tested using a nonparametric permutation approach with 999 permutations. The pairwise genetic distances defined by Peakall & Smouse (2012) and calculated using the DISTANCE procedure implemented in GenAlEx 6.5 were used to perform the Principal Coordinate Analysis (PCoA).
19Then, the Polymorphism Information Content (PIC) which assesses the discriminatory capacity of a marker in a population was calculated using Power Marker software (version 3.25) (Liu & Muse, 2005).
20The dissimilarity matrix was used to make unrooted tree using Neighbor-joining (NJ) method using Darwin v 6.5 software (Perrier & Jacquemoud-Collet, 2006). The reliability of the dendrogram was tested by a bootstrap of 1,000.
21Finally, the Bayesian model-based classification algorithm implemented in STRUCTURE v2.3.4 software (Pritchard et al., 2000) was applied to refine the genetic structure of the collection. STRUCTURE analysis was performed with five iterations of K values (assumed number of subpopulations). The value of K varied from 1 to 10, with 100,000 repetitions of Markov Chain Monte Carlo (MCMC) and a break-in period of 50,000, using the mixing model. The optimal number of groups (optimal K) for the set of data was determined using the Evanno method (Evanno et al., 2005) implemented in the STRUCTURE HARVESTER software (Earl & von Holdt, 2012).
2.5. Evaluation of combining ability
22The genotypes were all evaluated for their reciprocal combining ability. The overall method is described in Montagnon et al. (2008). The cumulative production over the first four years of production, susceptibility to rust, and bean size were evaluated. As the RRS trials were spread over different years, cumulative yield is expressed as a percentage of that of the control clone 461 (T%), which is the most stable clone and represented in all plots. Its production of berry coffee reached 1,834 t·ha-1 under the conditions of the trial. The bean size was expressed in grams of 100 beans at 12% humidity. Susceptibility to coffee leaf rust (SCLR) was assessed each year tree by tree using a visual score ranging from one (Resistant) to five (Susceptible). The value in test is expressed as the percentage of individuals in the progeny with score superior to three (Montagnon et al., 1994).
3. Results
3.1. Genetic diversity parameters
23The effective number of allele (Ne) ranged from 1.080 to 2 with a mean of 1.356 ± 0.012 when considering all loci. The observed heterozygosity (Ho) varied from 0 for the markers chr2_4390042 and chr11_29050267 to 1 for chr5_19874100 with a mean of 0.208 ± 0.009, while the mean value of expected heterozygosity (He) (genetic diversity) was 0.203 ± 0.007 ranging from 0.064 to 0.50 in the C. canephora population. The Shannon Information Index (I) ranged from 0.12 to 0.693 in C. canephora genotypes, with a mean of 0.299 ± 0.009. The value of Fixation Index (FIS) was zero (-0.017) for the 66 genotypes analyzed (0.017). The mean polymorphic information content (PIC) value was 0.244 ± 0.080, with a maximum of 0.413 for the chr10_3418874 locus and a minimum of 0.043 observed for the chr11_28434584 locus (Table 1).
3.2. Genetic differentiation
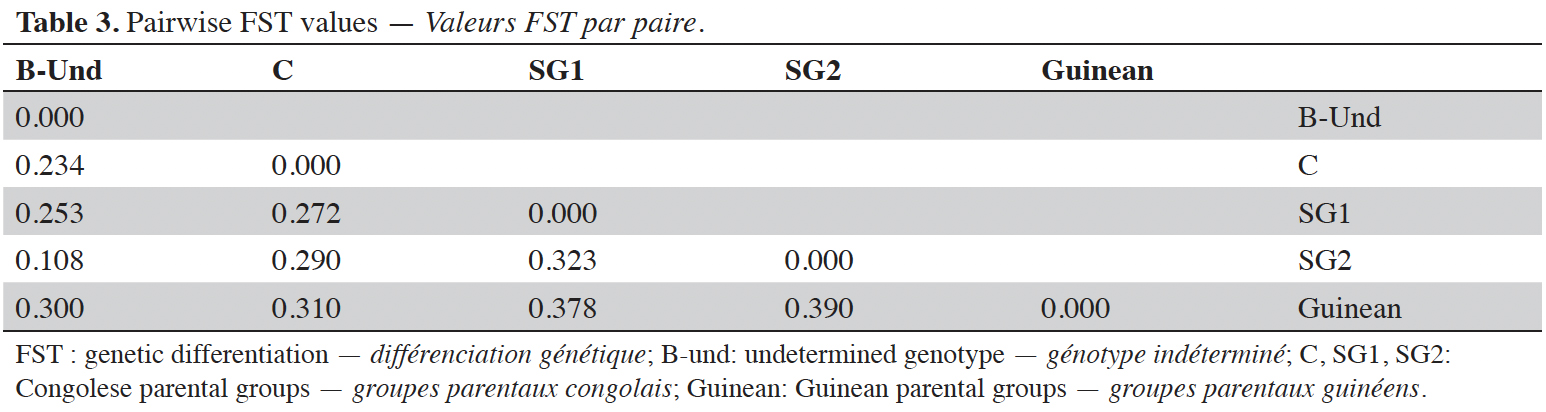
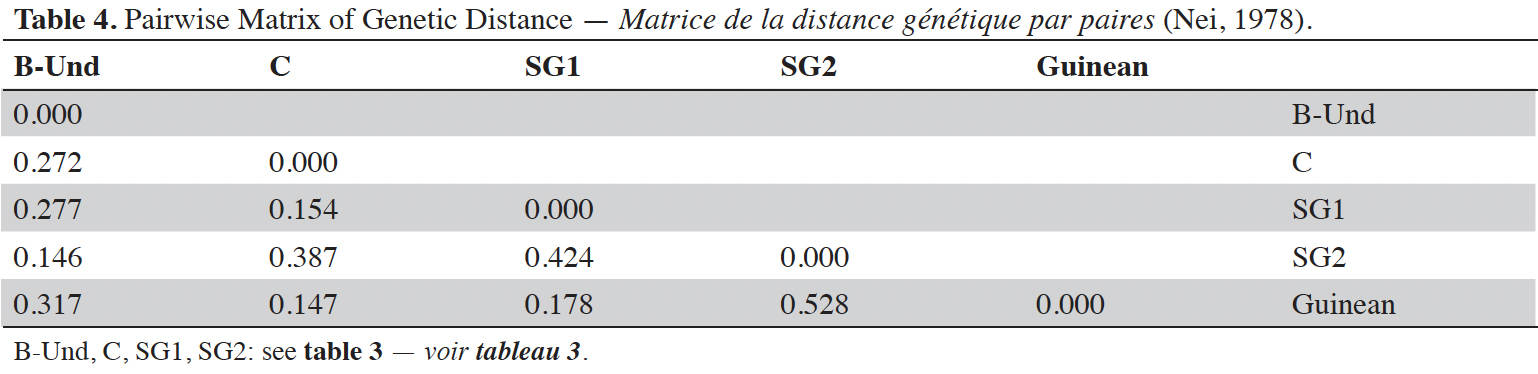
24Analysis of molecular variance (AMOVA) revealed that genetic variation within and between Guinean and Congolese pools was significant (PhiPT = 0.747, p <0.001). The estimated molecular variance across the 66 genotypes was very high (117.272) (Table 2). The genetic differentiations observed between the pools were greater, with 75% of the total genetic variance, than that observed within the pools with 25% of the total variation (Figure 1A). On the other hand, the AMOVA of the Congolese pool alone showed both a great genetic differentiation between the groups of this pool with 56% of the total variation and within them with 44% of the total variation (Figure 1B). The genetic structure of the coffee tree genotypes analyzed was also estimated by the matrix of FST values per population pair which are recorded in tables 3 and 4. An important differentiation was observed between Congolese coffee trees (B-Und, C, SG1 and SG2) and Guinean coffee trees with FST values of respectively; 0.300; 0.310; 0.378 and 0.390. Within the Congolese group, a moderate differentiation was revealed between populations B-Und, C and SG2 with FST values per population pair of 0.108 (B-Und/ SG2), 0.290 (C//SG2) and 0.234 (B-Und//C).
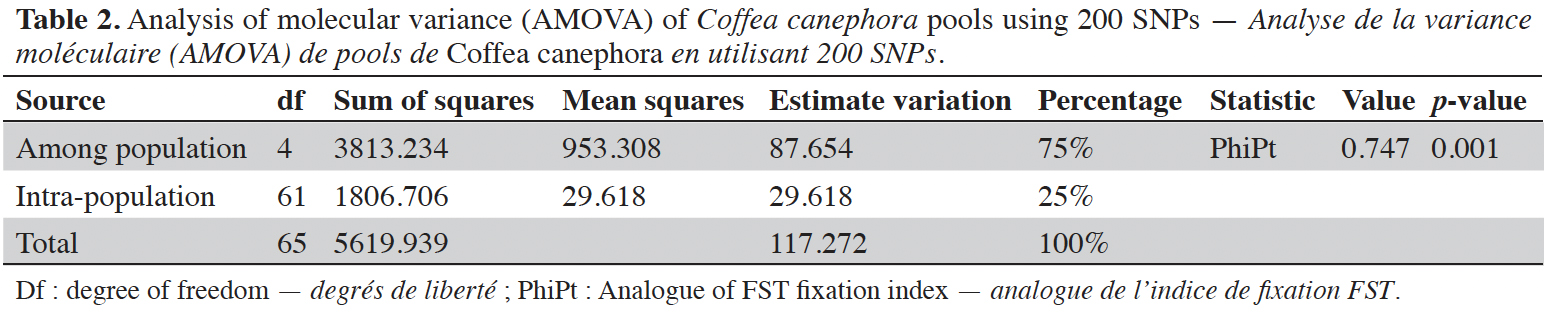
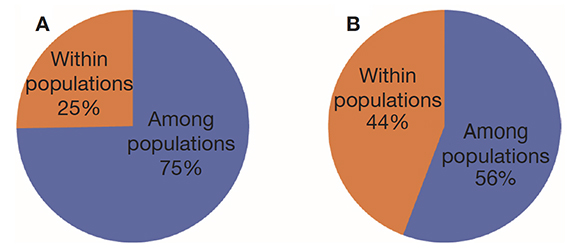
Figure 1. A. Analysis of molecular variance (AMOVA) run using the whole 66 genotypes of Coffea canephora — Analyse de la variance moléculaire (AMOVA) réalisée à partir de l’ensemble des 66 génotypes de Coffea canephora;
B. AMOVA run using Congolese pool only — AMOVA réalisée en utilisant uniquement le pool congolais.
3.3. Organization and genetic relationship between genotypes
25The genetic relationships between the 66 genotypes based on the 200 SNPs were described by principal coordinate analysis (PCoA) (Figure 2). PCoA scatter plot revealed differentiation between different genetic groups. The first three axes explain respectively 48.10%; 14.02% and 5.47 of the total variation. The PCoA revealed a differentiation between Guinean and Congolese coffee trees. Thus, axis 1 clearly separated the Guinean coffee trees from the Congolese populations of B-Und, C, SG1 and SG2. Within Congolese coffee trees, two groups were observed and separated by axis 2; with SG2 in its negative part and SG1 in its positive part. However, the five groups differed markedly without any overlap. This structuring of the genotypes studied was confirmed by the phylogenetic tree constructed using the neighbor-joining method (Figure 3). These genetic groups were discriminated with bootstrap values greater than 95% (Figure 3).
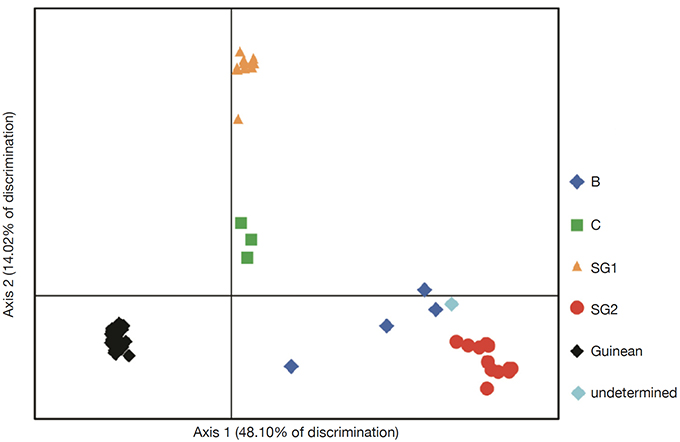 Figure 2. Scatter plot of Principal Coordinates Analysis (PCoA) of 66 genotypes of coffee tree representing 62.12% of the total variation — Diagramme de dispersion de l’analyse des coordonnées principales (PCoA) de 66 génotypes de caféiers représentant 62,12 % de la variation totale.
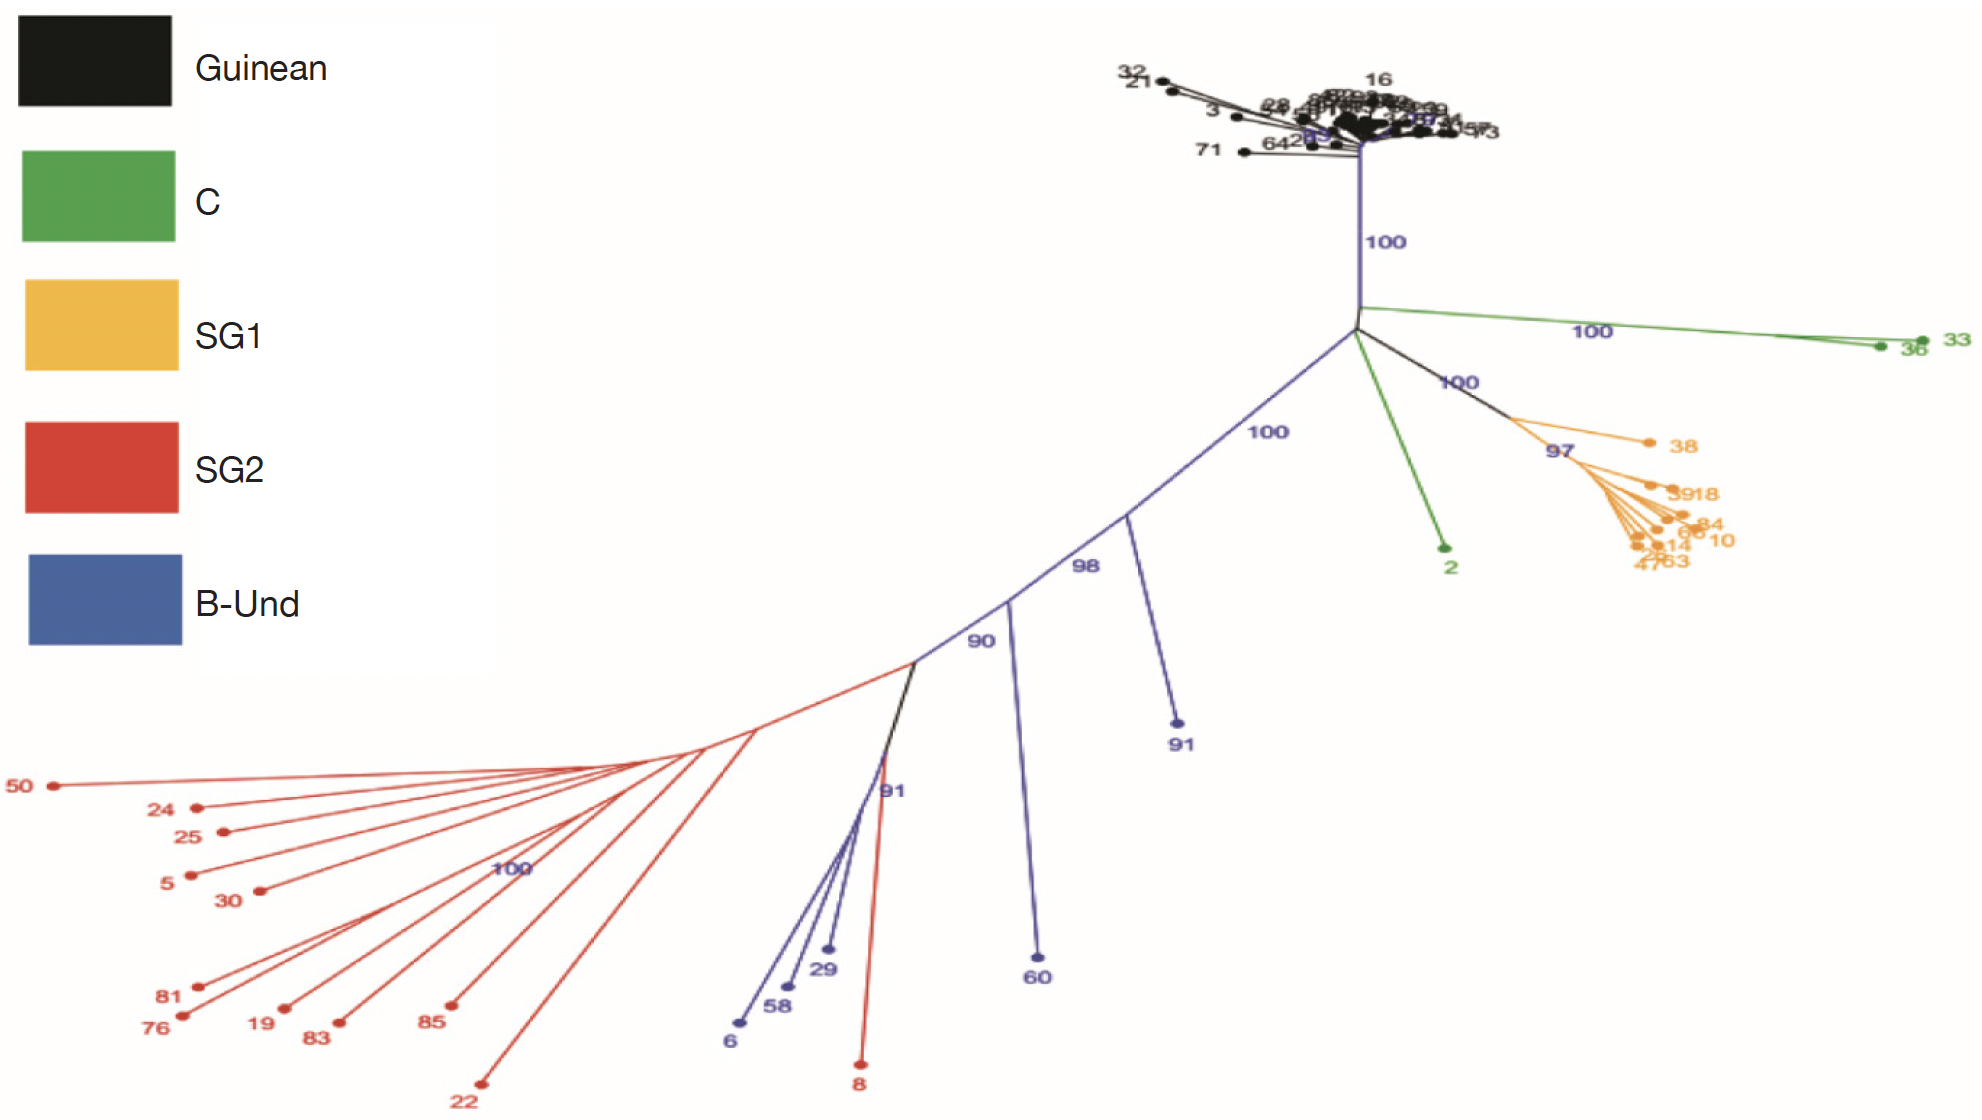
Figure 3. Unrooted tree using Neighbor joining based on genetic among the 66 genotypes of Coffea canephora tree. The colors of branches indicate genotypes corresponding to three populations (Guinean, C, SG1, SG2 and B-Und) — Arbre non raciné utilisant la jonction de voisins basée sur la génétique parmi les 66 génotypes de Coffea canephora. Les couleurs des branches indiquent les génotypes correspondant à trois populations (guinéenne, C, SG1, SG2 et B-Und).
26For fine study of the genetic structure, Bayesian analysis was implemented using the Structure software. The highest value of ΔK was found at K = 2, confirming the existence of two genetic main groups within the collection of C. canephora (Figure 4). The genotypes of the B-Und, C, SG1, SG2 groups were assigned to the unique Congolese genetic pool and the Guinean genotypes were assigned to the unique Guinean genetic pool (Figures 5 and 6).
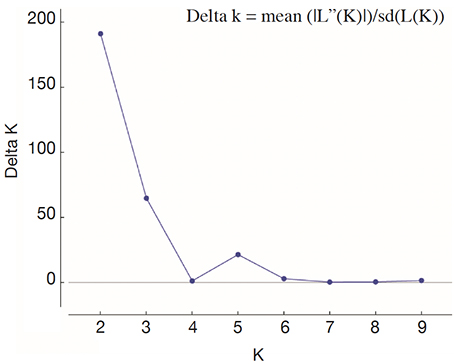
Figure 4. Profile of ΔK presenting the likelihood of K — Profil de ΔK présentant la probabilité de K.

Figure 5. Genetic structuring of the 66 Coffea canephora genotypes at K= 3 — Structuration génétique des 66 génotypes de Coffea canephora à K= 3.
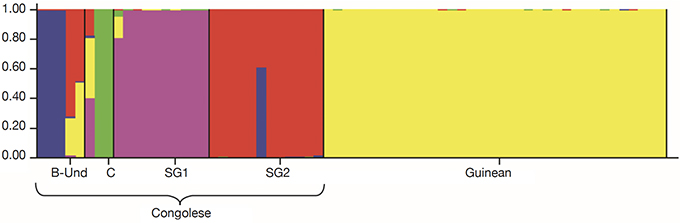
Figure 6. Genetic structuring of the 66 Coffea canephora genotypes at K= 5 — Structuration génétique des 66 génotypes de Coffea canephora à K= 5.
3.4. Ability test values of Guinean and Congolese parents
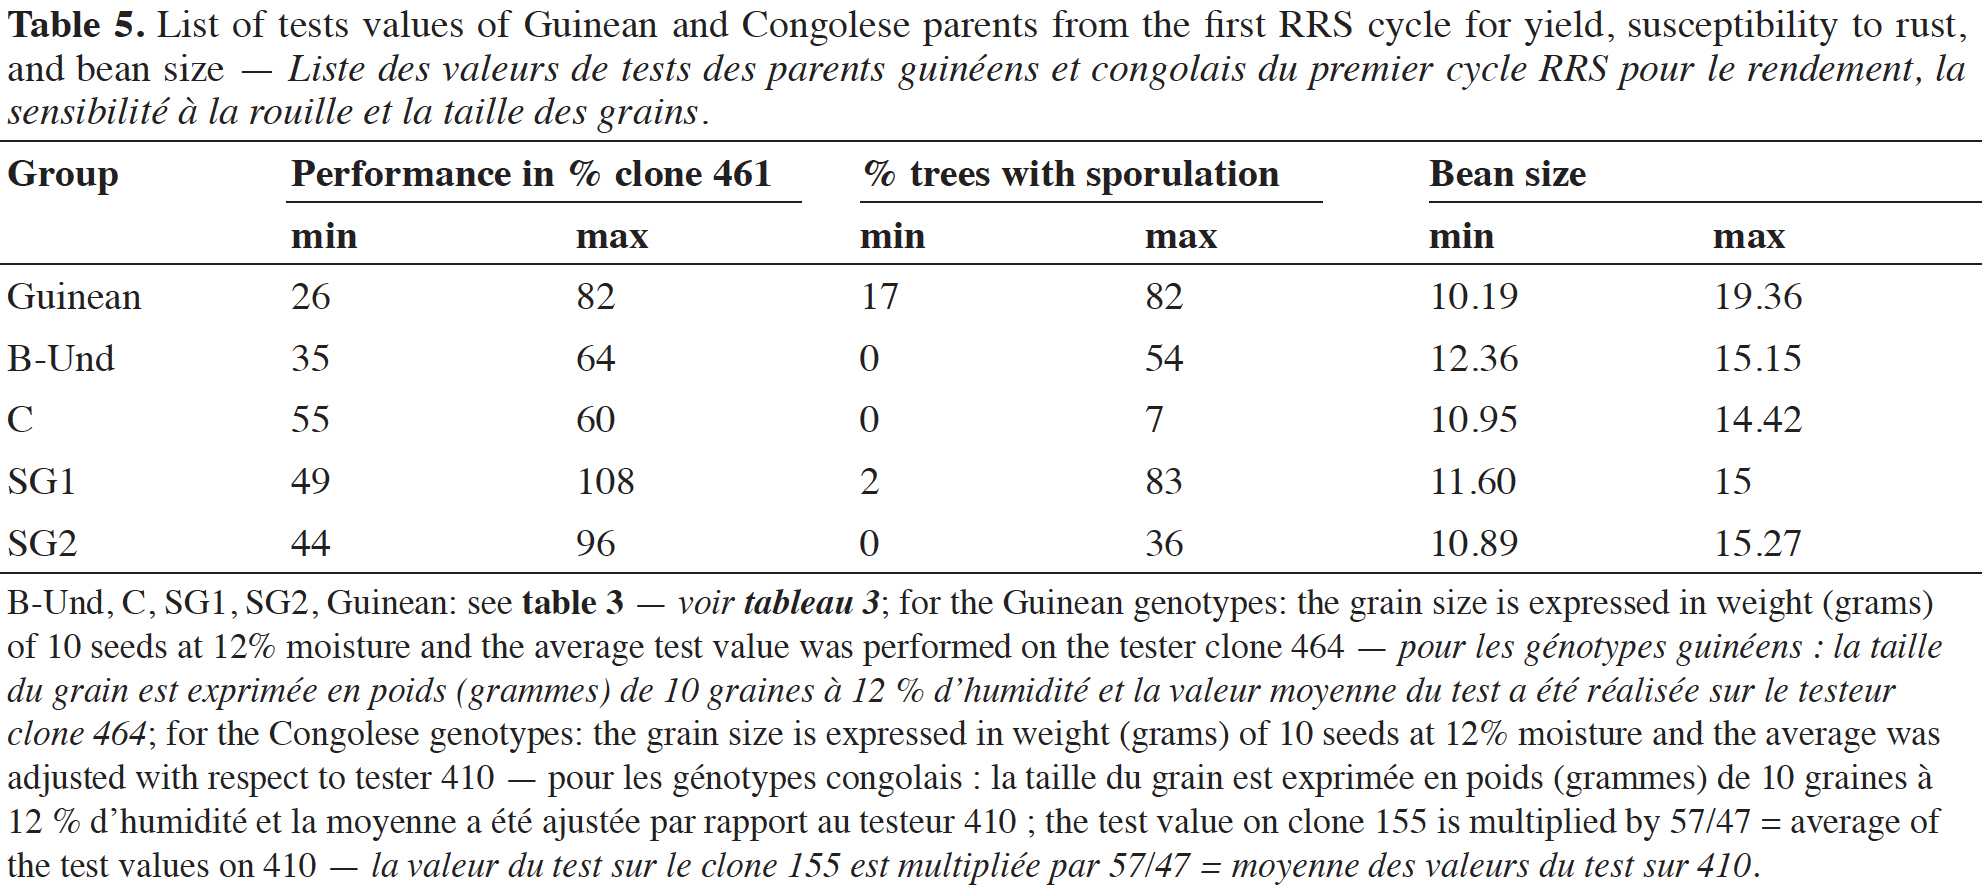
27The ability of Guinean parent tests values for yield ranged from 26 to 82% of the performance of the clone 461. The rust susceptibility test value varied from 17 to 82% and for the bean size, from 10.19 to 19.36 g for 100 beans. B-Und parent test values for yield ranged from 35 to 64% of the performance of the clone 461. The rust susceptibility test value varied from 0 to 54% and for the bean size, from 12.36 to 15.15 g for 100 beans. Group C parent test values for yield ranged from 55 to 60% of the performance of the clone 461. The rust susceptibility test value varied from 0 to 7% and for the bean size, from 10.95 to 14.42 g for 100 beans. Group SG1 parent test values for yield ranged from 40 to 108% of the performance of the clone 461. The rust susceptibility test value varied from 2 to 83% and for the bean size, from 11.60 to 15.00 g for 100 beans. Group SG2 parent test values for yield ranged from 44 to 96% of the performance of the clone 461. The rust susceptibility test value varied from 0 to 36% and for the bean size, from 10.89 to 15.27 g for 100 beans (Table 5). The intergroup test values of the parents in the different groups for the three main traits studied are reported in Appendix 1.
3.5. Relation average yield in % of the performance of the clone 461 and distance matrix of the different C. canephora gene groups
28The relationship between the mean value of yield of the different Congolese groups and the genetic distance to the Guinean coffee trees while used as male parent is presented in table 6. The analysis of variance showed a highly significant group effect for yield performance. The subsequent classification of mean yields of the Congolese groups in percentage to the Guinean genotype 461 revealed clear separation of the different groups. The SG1 and SG2 groups are not statistically different at the threshold of 0.05%. These groups obtained a better production potential with almost respective average yields of 82.75% and 76%. They are followed by group C. The lowest production potential yield of 40.33% is belonging to sub-group B-Und. As regard rust sensitivity and the weight of 100 grains, no significant difference was observed between the Congolese subgroups.
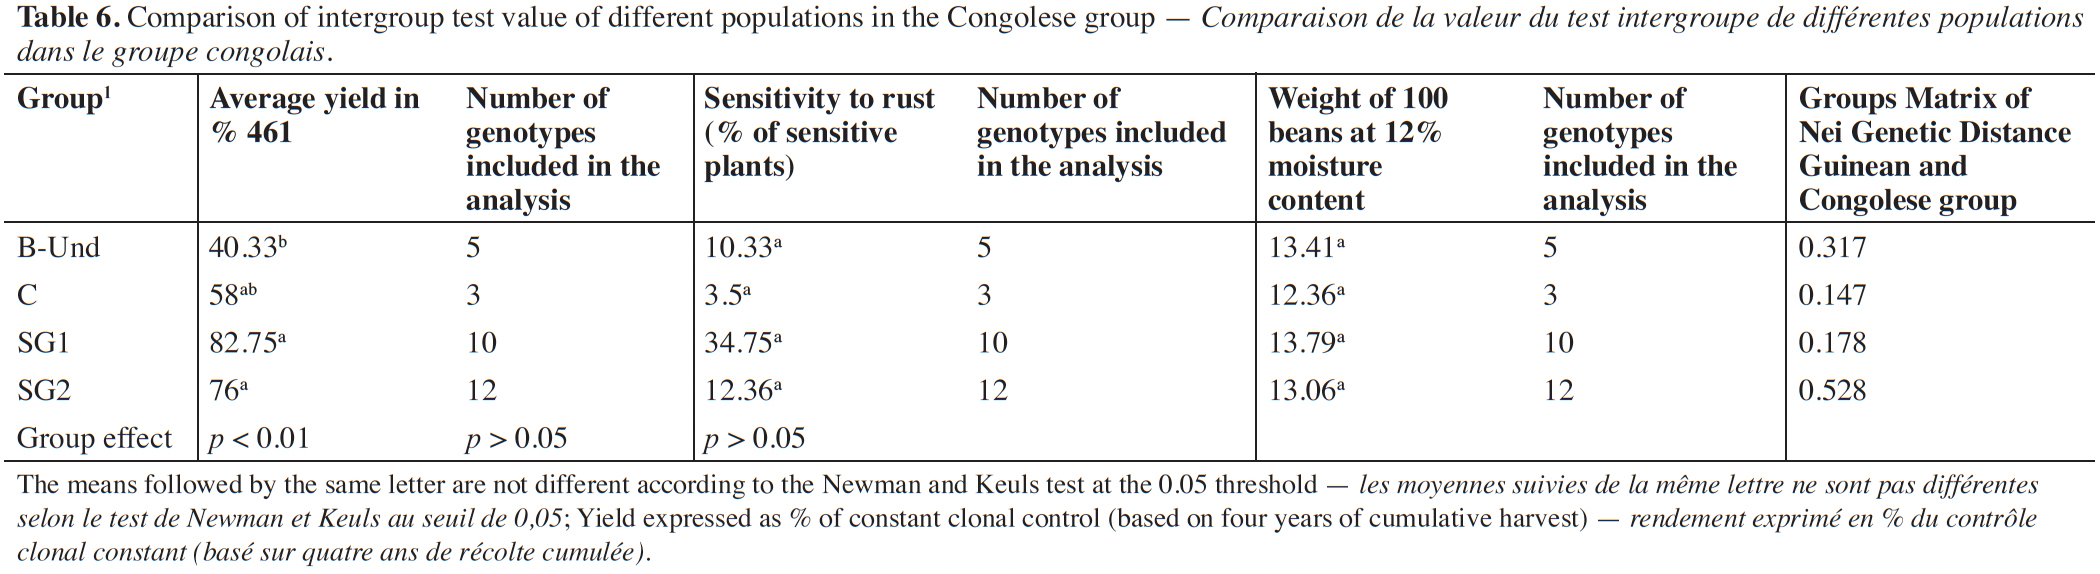
29Besides, when the Congolese groups are compared using their genetic distance to the Guinean group, a highest differentiation was found between the SG2 group and the Guinean group with a genetic distance of 0.528. The differentiation between the B-Und group and the Guinean group was intermediate with a genetic distance of 0.317. Finally, the lowest genetic differentiations were observed between SG1, C groups and Guineans with genetic distances of 0.178 and 0.147 respectively.
4. Discussion
30The 200 SNPs markers used to study the genetic structure of the two base populations of the selection of C. canephora in Côte d’Ivoire were found to have low polymorphic information content (PIC) value of less than 0.25 (Hayden et al., 2010). However, some higher values were observed by Garavito et al. (2016) on 105 individuals from 87 accessions of coffee. When we consider individually the SNP markers used, the polymorphic information content of some markers was less than 0.25 while most of them showed higher values than 0.25. These high values concerned 103 markers which could be identified as informative (Hayden et al., 2010). For further study of genetic structuring of the breeding populations of C. canephora, these markers set would be appropriate.
31The diversity indices, especially (He) of 0.203 and the Shannon index (I) of 0.299 were low comparing to the values observed using SSR markers. Indeed, Cubry et al. (2013) obtained values of He = 0.36 and I = 0.72 in 293 individuals using microsatellite markers. SSR markers are multi-allelic with a higher polymorphism than bi-allelic SNP markers (Guichoux et al., 2011). That is the reason why SNP are more numerous in the study than microsatellite markers. It is estimated that 3 SNPs were necessary to achieve the same matching probability than one microsatellite in diversity study (Fernandez et al., 2013). In addition, numerous diversity studies in C. canephora populations have shown a large genetic variability using various markers such as enzymatic markers, RLFPs and SRRs (Berthaud, 1986; Dussert et al., 1999; Cubry et al., 2008; Gomez et al., 2009; Musoli et al., 2009; Cubry et al., 2013).
32Analysis of molecular variance (AMOVA) showed that 75% of the total variation is explained by the differentiation between the Guinean and Congolese genetic pools of C. canephora. The differentiation between the populations of coffee trees studied was confirmed by the FST values of population pair. The large geographical distribution of the genus Coffea especially that of the genotypes used in this study as well as the natural allogamy of C. canephora could explain this structuration (Davis et al., 2006; Cubry et al., 2013; Babova et al., 2016). Besides, previous studies on the diversity of C. canephora trees have shown an extremely broad genetic background with enzyme markers, RLFPs and SRRs (Berthaud, 1986; Montagnon et al., 1992; Dussert et al., 1999; Cubry et al., 2008; Gomez et al., 2009; Musoli et al., 2009; Cubry et al., 2013). This differentiation between groups of C. canephora is likely to explain the high value of heterosis observed for yield trait which has been quantified (Montagnon, 2000): 150% more yield for the hybrids Guinean/Congolese-SG2 compared to the average value of the parents. The application of this study for coffee improvement resides in the heterosis effect found on progenies from parents that show high genetic distance. Indeed, the large genetic distance and the geographical differentiation between the Guineans and Congolese-SG2 would be an advantage for the development of vigorous hybrid varieties. The Guinean group is characterized by early maturation and resilience to drought and to the shoot beetle pest. The Congolese-SG2 group is known to have big grain size with low caffeine content and good aroma (Montagnon et al., 1994; Montagnon, 2000; Coulibaly, 2002). In addition, the results presented here showed that the hybrids of Guinean/Congolese-SG2 provide a good resistance to coffee leaf rust at the level of the parents Congolese SG2. So, the genetic distance, the complementarity and heritability of the traits of interest of the Guinean and Congolese-SG2 groups should allow the introgression of trait of interest into the hybrid progenies. In opposite, the susceptibility of the SG1 group to leaf rust led to high levels of susceptibility within the hybrids from Guinean and Congolese-SG1: 53% of susceptible plants per progeny on average for these hybrids in the first run of crosses (Leroy et al., 1993; Montagnon, 2000). The variability observed within the intergroup hybrids, 23% to 74% of susceptible plants to leaf rust offers the possibility for selection. Also, the absence of genetic correlation between yield and susceptibility to coffee leaf rust would allow to maintain a stable production (Montagnon, 2000).
33Principal coordinate analysis (PCoA) clearly separated Guinean genotypes from Congolese genotypes. This result confirms the genetic difference between these groups of coffee trees C. canephora (Guinean and Congolese) as already reported by isozymes markers (Berthaud, 1986). The subdivision of C. canephora into two groups could not only be due to the geographic isolation of the two groups but also to historical glacial events that occurred 18,000 years ago (Cubry et al., 2013). The genotypes of the Guinean group showed a homogenous group, indicating a strong genetic relationship between individuals of this group. In opposite, the genotypes of the Congolese group are split into sub-groups, SG1, SG2, C and B-Und. The center of origin of the Congolese is much larger and covers an area from the central Africa to east Africa. It is possible that different subpopulations in this area were created in different locations. This genetic structuring of the Congolese group was revealed in previous works using isoenzymes (Montagnon et al., 1992; Dussert et al., 2003; Gomez et al., 2009). The Bayesian analysis carried out here also showed the possibility of subdividing the Congolese group into four subgroups including SG1, SG2, C and B-Und. This genetic diversity is reflected by the broad phenotypic diversity (Montagnon et al., 1992; Montagnon & Leroy, 1993; Montagnon, 2000).
34Previous work with the RLFP and SSR markers has classified the populations of central Africa into two different genetic groups (SG2 and B). However, two genotypes (2513 and 2518) were not classified (Montagnon, 2000). This study using SNPs made it possible to classify the previously undetermined genotype (2518) in genetic group B of Congolese coffee trees. This reinforces the usefulness of SNPs as markers of choice for the accurate identification of genotypes and the evaluation of genetic structuring. As these baseline populations are a valuable tool for future work on coffee breeding in Côte d'Ivoire, highly accurate authentication is necessary for the advancement of C. canephora selection in Côte d'Ivoire.
35When crossed with a Guinean tester, SG1 and SG2 have the same performance for productivity, rust susceptibility and grain size. In other words, the same progress can be made by crossing SG1 and SG2 with a good Guinean parent. The Guinean group appears genetically homogeneous, but when crossed with a Congolese tester, progeny with different performances in terms of productivity, rust sensitivity and grain size appears. It is therefore important to make a selection among the Guinean coffee trees to obtain the parent with the best combining abilities when crossed with a Congolese tester.
5. Conclusions
36The analysis of the genetic diversity of the parental populations of the selection of C. canephora in Côte d’Ivoire using this SNP markers set confirms the genetic structure of this species. The Guinean and Congolese groups have been clearly identified. Also, within the Congolese group, subgroups SG1, SG2, C and B-Und have been identified. This study also allows to identify an indeterminate genotype in previous studies. The use of this marker set will be useful to determine the different populations created during the selection program. Also, any unknown genotype with trait of interest could be integrated in the selection population by determining the genetic group that they belong to. This set of markers will also help guide the best combinations to be tested in the reciprocal recurrent selection program.
Acknowledgements
37We thank Miss Yao Amah Lucie and Mr Tahou Leonard for their technical assistance in sampling. Our gratitude goes to the USDA-ARS team for the genotyping and the screening of the SNP.
Bibliographie
Akpertey A., Francis P., Lyndel M. & Zhang D., 2021. Effectiveness of Single Nucleotide Polymorphism markers in genotyping germplasm collections of Coffea canephora using KASP assay. Front Plant Sci., 11, article 612593, doi.org/10.3389/fpls.2020.612593
Anagbogu C.F. et al., 2019. Genetic diversity and re-classification of coffee (Coffea canephora Pierre ex A. Froehner) from South Western Nigeria through genotyping-by-sequencing-single nucleotide polymorphism analysis. Genet. Resour. Crop Evol., 66, 685-696, doi.org/10.1007/s10722-019-00744-2
Babova O., Occhipinti A. & Maffei M.E., 2016. Chemical partitioning and antioxidant capacity of green coffee (Coffea arabica and Coffea canephora) of different geographical origin. Phytochemistry, 123, 33-39, doi.org/10.1016/j.phytochem.2016.01.016
Berthaud J., 1980. L'incompatibilité chez C. canephora : méthode de test et déterminisme génétique. In : Actes du 9e Colloque scientifique international sur le café, 16-20 juin 1980, Londres. Paris : ASIC, 517-526.
Berthaud J., 1986. Genetic resources for the improvement of African diploid coffee trees: evaluation of the genetic richness of forest populations and its organizing mechanisms. Implications for application. Paris : ORSTOM.
Bikila B.A., Sakiyama N.S. & Caixeta E.T., 2017. SNPs based molecular diversity of Coffea canephora. J. Microbiol. Exp., 5(1), 00136, doi.org/10.15406/jmen.2017.05.00136
Coulibaly I., 2002. Heredity of autogamy and restoration of fertility in interspecific hybrids between Coffea canephora Pierre and C. heterocalyx Stoffelen. PhD thesis: École Nationale Supérieure Agronomique de Montpellier (France).
Coulibaly I. et al., 2002. Introgression of self-compatibility from Coffea heterocalyx to the cultivated species Coffea canephora. Theor. Appl. Genet., 105, 6-7, 994-999, doi.org/10.1007/s00122-002-1008-z
Cubry P. et al., 2008. Diversity in coffee assessed with SSR markers: structure of the genus Coffea and perspectives for breeding. Genome, 51, 50-63, doi.org/10.1139/g07-096
Cubry P. et al., 2013. Global analysis of Coffea canephora Pierre ex Froehner (Rubiaceae) from the Guineo-Congolese region reveals impacts from climatic refuges and migration effects. Genet. Resour. Crop Evol., 60(2), 483-501, doi.org/10.1007/s10722-012-9851-5
Davis A.P., Govaerts R., Bridson D.M. & Stoffelen P., 2006. An annotated taxonomic conspectus of the genus Coffea (Rubiaceae). Bot. J. Linn. Soc., 152(4), 465-512, doi.org/10.1111/j.1095-8339.2006.00584.x
Davis A.P., Tosh J., Ruch N. & Fay M.F., 2011. Growing coffee Psilanthus (Rubiaceae) subsumed on the basis of molecular and morphological data; implications for the size, morphology, distribution and evolutionary history of Coffea. Bot. J. Linn. Soc., 167, 357-377, doi.org/10.1111/j.1095-8339.2011.01177.x
Davis A.P. & Rakotonasolo F., 2021. Six new species of coffee (Coffea) from northern Madagascar. Kew Bull., 76, 497-511, doi.org/10.1007/s12225-021-09952-5
Denoeud F. et al., 2014. Le génome du café donne un aperçu de l'évolution convergente de la biosynthèse de la caféine. Sciences, 345(6201), 1181-1184.
Devreux M., Vallaeys G., Pochet P. & Gilles A., 1959. Research on the self-sterility of the Robusta coffee tree (Coffea canephora Pierre). Brussels: INEAC.
Dussert S. et al., 1999. Le caféier, Coffea canephora. In : Hamon P., Seguin M., Perrier X. & Glaszmann J.C., éds. Diversité génétique des plantes tropicales cultivées. Montpellier, France : Cirad.
Dussert S. et al., 2003. Coffee (Coffea canephora). In: Hamon P., Seguin M., Perrier X. & Glaszmann J.C., eds. Genetic diversity of cultivated tropical plants. Enfield, UK: Science Publishers Inc.
Earl D.A. & von Holdt B.M., 2012. STRUCTURE HARVESTER: a website and program for visualizing STRUCTURE output and implementing the Evanno method. Conserv. Genet. Resour., 4, 359-361.
Evanno G., Regnaut. S & Goudet J., 2005. Detecting the number of clusters of individuals using the software STRUCTURE: a simulation study. Mol. Ecol., 14, 2611-2620, doi.org/10.1111/j.1365-294X.2005.02553.x
Fernandez M.E. et al., 2013. Comparison of the effectiveness of microsatellites and SNP panels for genetic identification, traceability and assessment of parentage in an inbred Angus herd. Genet. Mol. Biol., 36, 185-191, doi.org/10.1590/S1415-47572013000200008
Fluidigm, 2011. SNP Genotyping User Guide. South San Francisco, CA, USA: Fluidigm Corporation.
Garavito A., Montagnon C., Guyot R. & Bertrand B., 2016. Identification by the DArTseq method of the genetic origin of the Coffea canephora cultivated in Vietnam and Mexico. BMC Plant Biol., 16, 242, doi.org/10.1186/s12870-016-0933-y
Gomez C. et al., 2009. Current genetic differentiation of Coffea canephora Pierre ex A. Froehn in the Guineo-Congolian African zone: cumulative impact of ancient climatic changes and recent human activities. BMC Evol. Biol., 9, 167, doi.org/10.1186/1471-2148-9-167
Guichoux E. et al., 2011. Current trends in microsatellite genotyping. Mol. Ecol. Resour., 1, 591-611, 10.1111/j.1755-0998.2011.03014.x
Hayden M.K. et al., 2010. An informative set of SNP markers for molecular characterisation of Australian barley germplasm. Crop Pasture Sci., 61, 70-83, doi.org/10.1071/CP09140
ICO (International Coffee Organization), 2018. Coffee market report. October 2018, http://www.ico.org/documents/cy2018-19/cmr-1018-e.pdf, (5 July 2022).
ICO (International Coffee Organization), 2021. Le rapport sur le marché du café. Septembre 2021, http://www.ico.org/documents/cy2020-21/cmr-0921-f.pdf, (5 July 2022).
Lecolier A. et al., 2009. Unraveling the origin of Coffea arabica “Bourbon pointu” from la Réunion: a historical and scientific perspective. Euphytica, 168(1), 1-10, doi.org/10.1007/s10681-009-9886-7
Leroy T. et al., 2014. Developing core collections to optimize the management and the exploitation of diversity of the coffee Coffea canephora. Genetica, 142, 185-199, doi.org/10.1007/s10709-014-9766-5
Leroy T., 1993. Diversité, paramètres génétiques et amélioration par sélection récurrente réciproque du caféier Coffea canephora P. Thèse de doctorat : École nationale supérieure agronomique de Rennes (France).
Leroy T. et al., 1997. Reciprocal recurrent selection applied to Coffea canephora Pierre. III. Genetic gains and results of first intergroups crosses. Euphytica, 95, 347-354, doi.org/10.1023/A:1003074716379
Leroy T., Montagnon C., Charrier A. & Eskes A.B., 1993. Reciprocal recurrent selection applied to Coffea canephora Pierre. I. Characterization and evaluation of breeding populations and value of intergroup hybrids. Euphytica, 67(1), 113-125, http://dx.doi.org/10.1007/BF00022734
Liu K. & Muse S.V., 2005. Power Marker: an integrated analysis environment for genetic marker analysis. Bioinformatics, 21, 2128-2129, doi.org/10.1007/BF00022734
Merot-L’Anthoene V. et al., 2019. Development and evaluation of a genome‐wide Coffee 8.5K SNP array and its application for high‐density genetic mapping and for investigating the origin of Coffea arabica L. Plant Biotechnol. J., 17, 1418-1430, doi.org/10.1111/pbi.13066
Montagnon C., Leroy T. & Yapo A., 1992. Genotypic and phenotypic diversity of some coffee groups (Coffea canephora Pierre) in the collections – consequences on their use in breeding. Café Cacao The, 36(3), 187-198.
Montagnon C. & Leroy T., 1993. Reaction to drought of young Coffea canephora coffee trees in Côte d'Ivoire belonging to different genetic groups. Café Cacao Thé, 37, 179-190.
Montagnon C., Leroy T., Kebe I. & Eskes A.B., 1994. Importance of coffee leaf rust and factors involved in field evaluation of the resistance of Coffea canephora in Côte d’Ivoire. Café Cacao The, 38, 103-112.
Montagnon C., 2000. Optimization of the grains in the reciprocal recurrent selection scheme of Coffea canephora Pierre. PhD thesis: École Nationale Supérieure Agronomique de Montpellier (France).
Montagnon C. et al., 2008. Heterozygous genotypes are efficient testers for assessing between-population combining ability in the reciprocal recurrent selection of Coffea canephora. Euphytica, 160(1), 101-110, doi.org/10.1007/s10681-007-9561-9
Musoli P. et al., 2009. Genetic differentiation of wild and cultivated populations: diversity of Coffea canephora Pierre in Uganda. Genome, 52, 634-646, doi.org/10.1139/G09-037
Nei M., 1978. Estimation of average heterozygosity and genetic distance from a small number of individuals. Genetics, 89(3), 583-590, doi.org/10.1093/genetics/89.3.583
Peakall R. & Smouse P.E., 2012. GenAlEx 6.5: genetic analysis in Excel. Population genetic software for teaching and research an update. Bioinformatics, 28, 2537-2539, doi.org/10.1093%2Fbioinformatics%2Fbts460
Perrier X. & Jacquemoud-Collet J., 2006. DARwin software. Version 6.0. Montpellier, France : Cirad.
Pritchard J.K., Stephens M. & Donnelly P., 2000. Inference of population structure using multilocus genotype data. Genetics, 155, 945-959, doi.org/10.1093/genetics/155.2.945
Van Der Vossen H., 2016. Narrowing the yield gap of smallholder coffee production as sustainable strategy to meet rising demand for quality coffees. In: Proceedings of the 26th International Conference on Coffee Science, November 13rd-17th, 2016, Kunming, China.
Wang J. et al., 2009. High-throughput single nucleotide polymorphism genotyping using nanofluidic dynamic arrays. BMC Genomics, 10, 561, doi.org/10.1186/1471-2164-10-561
Zarate L.A., Cristancho M.A. & Moncada P., 2010. Strategies to develop polymorphic markers for Coffea arabica L. Euphytica, 173, 243-253, doi.org/10.1007/s10681-009-0102-6
Zhou L. et al., 2016. Developing single nucleotide polymorphism (SNP) markers for the identification of coffee germplasm. Trop. Plant Biol., 9, 82-95, doi.org/10.1007/s12042-016-9167-2
To cite this article
