


- Accueil
- Volume 26 (2022)
- Special issue : 150 years of CRA-W
- Decision support tools for grass-based fodder management on Walloon dairy farms: current adoption and perspectives


Visualisation(s): 1568 (48 ULiège)
Téléchargement(s): 321 (4 ULiège)

Decision support tools for grass-based fodder management on Walloon dairy farms: current adoption and perspectives

Résumé
Outils d'aide à la décision pour la gestion des fourrages herbagers dans les exploitations laitières wallonnes : adoption et perspectives
Description du sujet. Afin d’optimiser la gestion des fourrages herbagers par les éleveurs laitiers, de nombreux outils d'aide à la décision (OAD) ont été développés mais leur taux d'adoption reste faible.
Objectifs. L'objectif était de caractériser et comprendre le taux d'adoption des OAD liés à la valorisation des fourrages herbagers.
Méthodologie. Un total de 61 éleveurs laitiers wallons (Belgique) ont répondu à une enquête en ligne concernant l’utilisation de 23 OAD en lien avec la valorisation des fourrages herbagers de manière directe (pâturages et prairies) ou indirecte (alimentation et gestion technico-économique) ainsi que sur les freins et les leviers, leurs intérêts et leur satisfaction en matière de support technique associés à ces OAD.
Résultats. Les outils de gestion du pâturage sont les moins utilisés alors que les éleveurs leur montrent le plus grand intérêt. Les indicateurs simples sont plus utilisés que les logiciels et outils automatisés. Les éleveurs mentionnent que les OAD sont trop coûteux en temps et en argent, même s'ils sont conscients des économies qui pourraient y être associées. La formation continue fait défaut. Quatre types d'utilisateurs ont été identifiés sur base de l’utilisation d’OAD : haut utilisateur sans pâturage (H-NG), haut utilisateur pâturage technique ou traditionnel (H-T/TG), bas utilisateur pâturage traditionnel (L-TG) et utilisateur moyen bio (M-ORG).
Conclusions. La communication avec les éleveurs pendant la création d’OAD permettrait (1) de préciser les besoins d'une diversité d’utilisateurs et (2) de créer des outils qui soient plus en phase avec leurs pratiques. L'accompagnement à long terme doit être renforcé pour informer les éleveurs sur les OAD existants et transmettre les connaissances nécessaires à leur utilisation.
Abstract
Description of the subject. Many decision support tools (DSTs) have been developed to help dairy farmers optimally manage the high variability in the quality and availability of grass-based fodder, but their adoption rate remains low.
Objectives. The objective was to characterize and understand the adoption rate of DSTs related to using grass-based fodder.
Methodology. A sample of 61 Walloon (Belgium) dairy farmers responded to an online survey concerning their current use of 23 DSTs related to using grass-based fodder either directly (pasture or grassland) or indirectly (feeding or techno-economic), as well as barriers to and incentives for adopting them, their current interest in DSTs, and satisfaction with the guidance on using these DSTs.
Results. Pasture management DSTs were used the least, even though farmers were the most interested in them. Farmers used simple indicators rather than software or automated tools. Farmers indicated that DSTs were too expensive and time consuming, even if they could ultimately save them time and money. Continuing education is lacking. Four types of users were identified who influence the use of DSTs: high user no grazing (H-NG), high user traditional or technical grazing (H-T/TG), low user traditional grazing (L-TG), and moderate user organic (M-ORG).
Conclusions. Communicating with end-users during each step of DST development would help (1) identify the specific needs of a diverse set of dairy farmers and (2) develop DSTs that better correspond to their practices. More long-term guidance is required to inform farmers about existing DSTs and to transfer the knowledge required to use them.
Table des matières
Received 14 January 2022, accepted 6 October 2022, available online 25 October 2022
This article is distributed under the terms and conditions of the CC-BY License (http://creativecommons.org/licenses/by/4.0)
1“Unless the researcher is involved in and concerned with implementation, we shall succeed only in amassing technical successes and practical failures.” (Ackoff, 1960).
1. Introduction
2Shortly after World War II, techniques to mathematically simulate processes that guide management practices began to percolate from the industrial sector into agricultural sciences. As farm management was requiring more time and expertise, the idea was to replace the need for human expert/adviser intermediaries, who were lacking, with the computer interface of a mathematical model (Little, 1970). This marked the beginning of decision support systems (DSS). At this time, the new field of agricultural modelling lay at the intersection of agricultural scientists interested in understanding processes using a mathematical approach and business-management science (McCown, 2002a). The idea of creating software that is simple to use and that can continuously provide assistance to managers was so attractive that scientists from many backgrounds saw it as a way to extend the practical application of their methods, although generally without much interest in the theory of decision support itself (Keen, 1987). DSS initially failed due to conflict between the scientific vision of tool development, which is based on precise quantification, rationality, and structured decision-making, and farm management, which is based on heuristic rules of thumb, simplicity, and daily implementation (Donnelly et al., 2002; McCown, 2002b; Eastwood et al., 2009).
3The term “DSS” evolved from a strictly defined computer-based system into any kind of information-based tool, including decision support that is not computer-based, or more generally into “decision support tools” (DSTs) (Meinke et al., 2001). This evolution occurred along with the development of other DST formats, such as objects or manuals, which was influenced by the importance of reconnecting with practical management-decision schemes (Plant & Stone, 1991). In recent years, however, the increase in precision technologies and big data has influenced the development of connected DSTs, which can analyse real-time data and lead to the automation of certain tasks, such as milking or feeding. They represent opportunities to improve farmers’ quality of life (Schewe & Stuart, 2015). As a result, dairy farmers prefer DSTs that integrate the automation of the decided tasks (Dela Rue et al., 2020). However, those digital tools may represent a new gap between farmers’ practices and scientific approaches, as the information and the way they are processed are increasingly complex and changes the interactions between farmers and animals (Hostiou et al., 2017; Mougenot et al., 2020).
4Little (1970) stated that to be adopted, models should be simple, robust, easy to control, adaptive, as complete as possible, and easy to communicate with. Since then, major challenges to the successful adoption of DSTs have been extensively documented. Peyraud & Delaby (2005) mentioned the need for simplicity of use, a short recording time, and readily available input variables. Dolecheck et al. (2013) highlighted that DSTs should be inexpensive, robust, flexible, reliable, and easy to maintain. Rose et al. (2016) developed a general theory of adoption and use of DSTs in the agricultural sector by grouping the key influencing factors into “core factors” (i.e. performances, ease of use, peer recommendation, trust, cost, habit, relevance to the user, and farmer-adviser compatibility), “enabling and driving factors” (i.e. facilitating conditions, compliance with legislation, and the level of marketing), and “modifying factors” (i.e. farmer age, scale of business, farming type, and level of information technology education).
5These modifying factors have been analysed for dairy farms and facilitate the conceptualisation of different types of DST users. The use of a smartphone (Edwards et al., 2015), a larger farm area, and a larger number of cows (Edwards et al., 2015; Gargiulo et al., 2018) are associated with a higher adoption rate of DSTs. Young farmers and farmers with new dairy installations also use more DSTs (Allain et al., 2015; Edwards et al., 2015; Yang et al., 2021). The type of milking parlour (Edwards et al., 2015; Yang et al., 2021) and grazing practice also have an influence (Allain et al., 2015). Last, the adoption of DSTs is higher for indoor intensive maize-based dairy systems (Shalloo et al., 2018). Indeed, the adoption of DSTs by grazing systems has specific challenges: DST manufacturers lack interest in them due to the lower commercial value of the pasture-production market, connectivity is problematic due to the large area that cattle can roam, and grazing systems usually require less capital investment (Shalloo et al., 2018). The present study aimed to investigate dairy farmers’ adoption of DSTs related to using grass-based fodder and their perception of these DSTs in terms of barriers to and incentives for adopting them, satisfaction with the guidance on using them, and future interest in them. We tested the hypothesis that the perception of DSTs and the preferred DSTs depended on the type of DST user.
2. Methodology
2.1. Survey description
6In February 2021, we distributed a web-based survey (Google Forms) to Walloon (Belgium) dairy farmers via e-mail and Facebook (Supplementary material 1). The survey was a closed questionnaire (only one open answer was present to cite specific DST of interest, see 2.2.) and included 51 questions grouped into five themes: farm characteristics, current DST use, barriers to and incentives for adopting DSTs, their satisfaction with the guidance on using DSTs, and future interest in DSTs. Farmer organizations were asked to forward the survey to their members. The Regional Animal Health and Identification Association (ARSIA: all livestock farmers), Milk Committee (all dairy farms), the farmers’ union (FUGEA: members), and the regional agriculture journal (Sillon Belge: all farmers) forwarded the survey by e-mail, while the Walloon Breeders Association (Élévéo) and the Walloon Agricultural Research Centre (CRAW) forwarded the survey to their followers on Facebook. A total of 63 dairy farmers answered the survey, but two surveys were incomplete; thus, 61 surveys were analyzed. Survey respondents represented the following agricultural regions of Wallonia: Région limoneuse and Région sablo-limoneuse (27), Région herbagère liégeoise and Haute Ardenne (14), Condroz and Famenne (12), Ardenne and Jurassique (5) and Fagne (3) (Table 1).
2.2. Farmers’ perceptions and use of DSTs related to using grass-based fodder
7Farmers were asked about 23 DSTs, computerized or not, that were related directly (i.e. pasture or grassland management) or indirectly (i.e. feeding or techno-economic management) to using grass-based fodder (Figure 1). The list of DSTs was established after a preliminary review that identified 24 broad types of DSTs (Battheu-Noirfalise et al., 2022). Three levels of DST technical sophistication were considered: indicators, software, and automated tools. An indicator is a quantitative or qualitative value obtained from visual or technical measurements that can be further interpreted based on the context (other variables) by the farmers’ knowledge or computer software (Eastwood & Kenny, 2009). The farmer can then take action, which can also be performed independently by an automated tool. Of the six scopes in our initial review (i.e. pasture, grassland, feeding, herd management, techno-economic management, and dairy-system management), we excluded DSTs for herd management (e.g. crossbreeding or breed-change simulators, genetic selection programs) and dairy-system management (e.g. farming-system simulation programs, serious games) to decrease the time required to complete the questionnaire. Techno-economic management was considered as it can help farmers better consider the dimensions that influence their choices (e.g. reducing grazing costs) and management practices related to the fodder strategy (e.g. a single short calving interval is required for a grouped calving strategy to improve use of grazed grassland). Some DSTs were defined in greater detail in the questionnaire; for example, “milk production and quality” was defined as milk analysis on the farm, online, or on the dairy invoice. To describe how frequently they used each DST, farmers chose among “never”, “almost never”, “a few times a year”, “many times a month” and “every day”. Water quality monitors, automatic milk dispensers, administrative declaration software, and financial management software were included in the survey, but were excluded from the analysis as they lay outside the scope of this article.
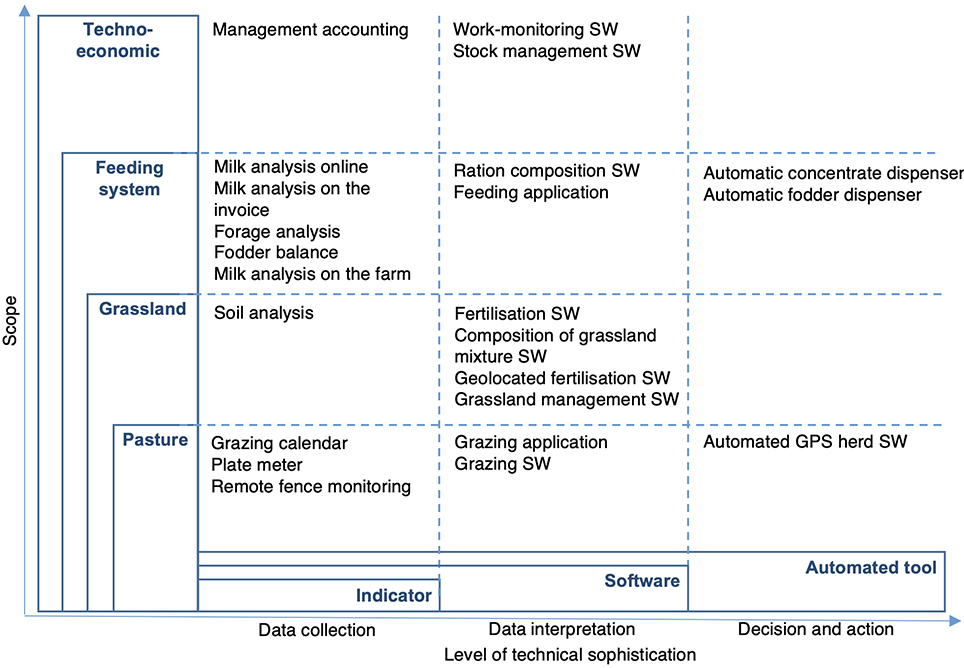
Figure 1. The 23 decision support tools analysed in this study, related directly or indirectly to using grass-based fodder, which were classified as a function of their scope (pasture, grassland, feeding, or techno-economic management) and level of technical sophistication (indicator, software, or automated tool). Software can be computer software (SW) or smartphone applications — Les 23 outils d’aide à la décision analysés dans cette étude, liés directement ou indirectement à l’utilisation de fourrages à base d’herbe, ont été classés en fonction de leur champ d’application (pâturages, prairies, alimentation ou gestion technico-économique) et du niveau de sophistication technique (indicateur, logiciel ou outil automatisé). Les logiciels peuvent être des logiciels (SW) ou des applications pour smartphones.
8Barriers to and incentives for adopting DSTs were framed as statements with which farmers could express their degree of agreement: “Not at all”, “I don’t know”, “I think so”, and “Absolutely”. These statements, based on expert knowledge, were obtained from a study of digital DSTs for grazing farmers in France (Lachia et al., 2021). Farmers rated the sources of guidance on using DSTs (i.e. advisers, internet, technical documents, and exchanges with other farmers) as ”Not enough”, “No, but I don’t need it”, and “Sufficient” (Lachia et al., 2021). For each scope, farmers could express whether they intended to adopt a DST in the future as “Absolutely not”, “Not really”, “Yes, why not”, and “Yes, I am already thinking about it” (Figure 1). They could also mention a specific DST in an open answer.
2.3. Variables used to define types of DST users
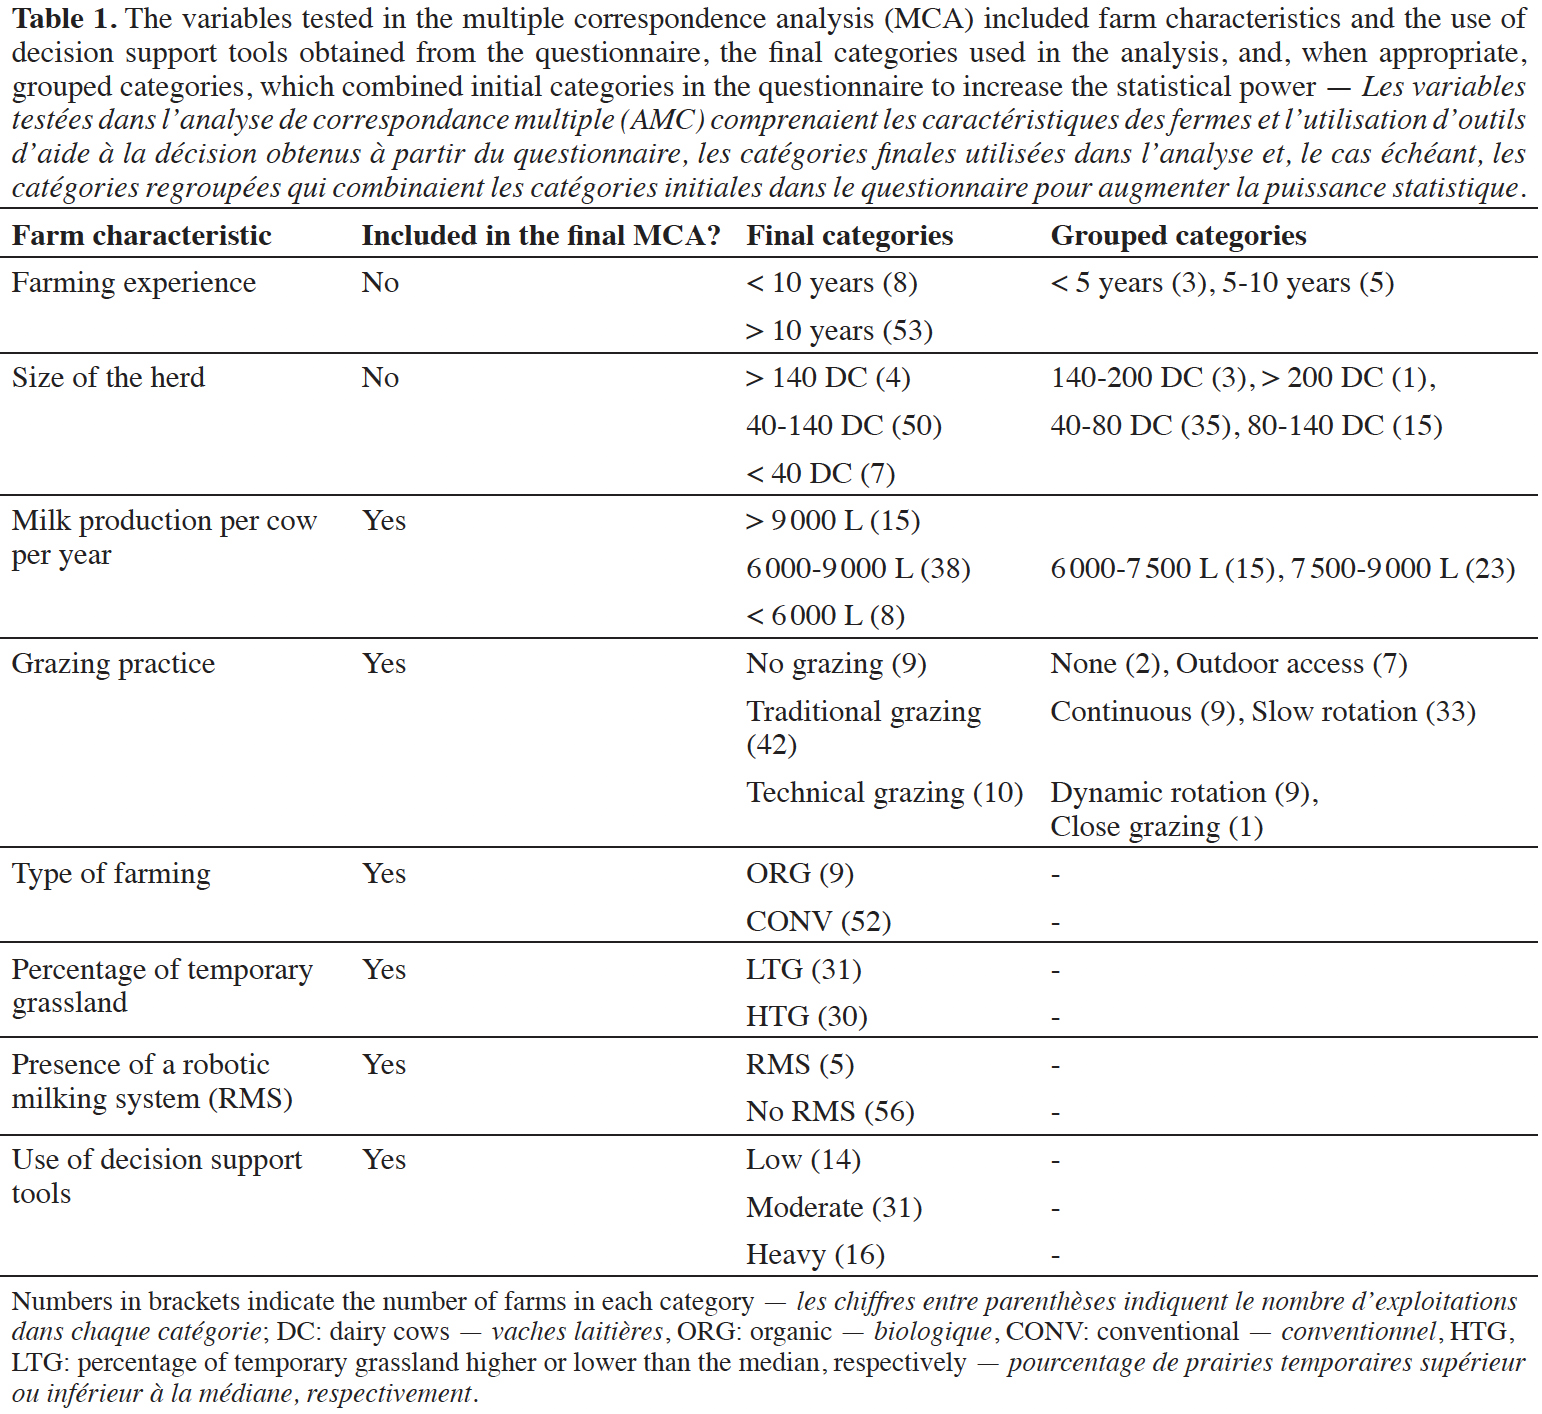
9The questions about farm characteristics (Table 1) were inspired by the “modifying factors” of DST adoption (Rose et al., 2016). We asked about the number of years of dairy farming experience and the scale of the business (i.e. number of dairy cows). We asked about the type of farming, as described by Rose et al. (2016), as milk production per cow, grazing practice, use of a robotic milking system (RMS), type of farming (organic or conventional), and percentage of temporary grassland in the total grassland area (permanent and temporary). All variables were categorical except for the percentage of temporary grassland. From this variable, we created two categories based on whether the percentage of temporary grassland was higher (HTG) or lower (LTG) than the median percentage (21 %).
10To create a general categorical variable that represented the use of DSTs, we calculated the frequency of “never” answers for the 23 types of DST (Table 1). This approach yielded a number from 0 (i.e. used all 23 types of DST at least once) to 23 (i.e. never used any of the types of DST). We grouped the farmers into three categories based on the first (14) and second tertile (16) of this variable: low user (> 16 “never”), moderate user (14-16 “never”), and heavy user (< 14 “never”). The median number of “never” for each of the three categories was 18, 15, and 12, respectively.
2.4. Statistical analysis
11All statistical analyses were performed using R v. 4.1.0 (R Core Team, 2021). For questions about DST use, barriers, incentives, satisfaction with guidance, and interest in DSTs, farmers chose among three (3-point Likert alternatives) or five (5-point Likert alternatives) answers that were always expressed as a “greater than” relationship. Because these data were ordinal (Likert-type data), we used statistics adapted for discrete data: the median represented the central trend, while frequencies represented the variability (Boone & Boone, 2012). A Wilcoxon signed-rank test was used to identify significant (p < 0,10) differences between answers (de Winter & Dodou, 2010).
12We performed multiple correspondence analysis (MCA) of farm characteristics (Table 1) and DST use to highlight the main relations between them. To determine the types of DST users, farms were grouped using a k-means clustering algorithm based on Euclidian distances of MCA principal components whose eigenvalue contributed more than the mean of the eigenvalues. The elbow method was used to identify the optimal number of clusters (Borcard et al., 2011). To reduce the dimensions of the final MCA, we kept only the variables that were significantly influenced by user types according to a Fisher test (Fisher, 1970) using backward stepwise variable selection (i.e. removing variables one-by-one that were not significantly associated with the user types). Years of experience and herd size had no significant relation with user types; thus, they were removed from the MCA (Table 1). The influence of user type on the frequency of DST use, barriers, incentives, satisfaction with guidance, and interest was determined using a Kruskal-Wallis test followed by a post-hoc pairwise Wilkinson test adjusted with the Benjamini-Hochberg method to reduce the false discovery rate (Kruskal & Wallis, 1952; Bauer, 1972; Benjamini & Yekutieli, 2001). Differences among the scopes (i.e. pasture, grassland, feeding, or techno-economic management) and levels of technical sophistication (i.e. indicator, software, or automated tool) were analyzed using the same procedure.
3. Results
3.1. Dairy farmers’ use of DSTs related to using grass-based fodder
13All farmers used at least one feeding DST a few times a year. Techno-economic, grassland, and pasture DSTs were used at least a few times a year by 89%, 93%, and 33% of the farmers, respectively. Characteristics of the four DST scopes differed significantly (p < 0.01). Regarding the level of technical sophistication, 100%, 67%, and 41% of farmers used an indicator, software, or automated tool, respectively, as a DST at least a few times a year. The frequency of use did not differ significantly between software and automated tools. The DSTs used most frequently were milk analysis (both online and on the invoice), forage analysis, and management accounting (Figure 2). The DSTs used next most frequently were automatic concentrate dispensers, milk analysis on the farm, and software to adjust the ration composition, but their use did not differ significantly from those for the fodder balance, a grazing calendar and fertilization software. All other DSTs (16 out of 23) were used by less than 25% of the farmers.
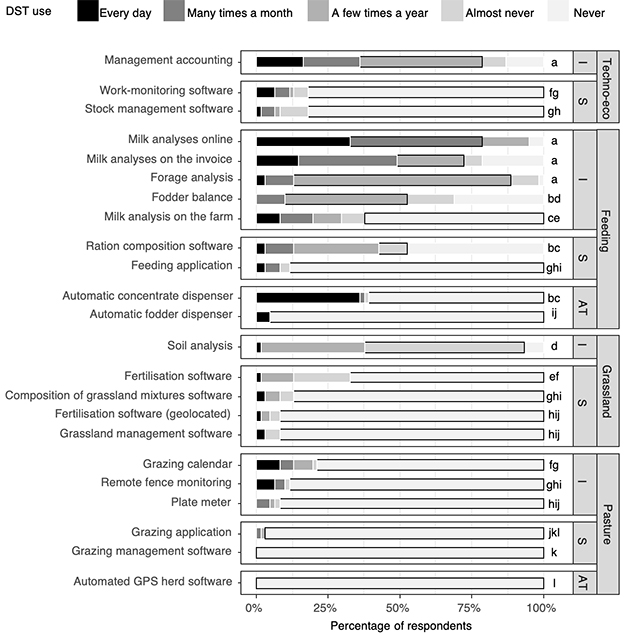
Figure 2. Distribution of the frequency with which dairy farmers used decision support tools (DSTs) related to using grass-based fodder — Répartition de la fréquence à laquelle les producteurs laitiers utilisent les outils d’aide à la décision (OAD) liés à l’utilisation de fourrage à base d’herbe.
The median frequency is outlined in black — la fréquence médiane est indiquée en noir; different letters indicate significant differences among DSTs (p < 0.10) — différentes lettres indiquent des différences significatives entre les OAD (p < 0,10); DSTs are classified by their scope (pasture, grassland, feeding, or techno-economic) and level of technical sophistication (indicator (I), software (S), or automated tools (AT)) — les OAD sont classés selon leur champ d’application (pâturages, prairies, alimentation ou technico-économique) et leur niveau de sophistication technique (indicateur (I), logiciel (S), outil automatisé (OA).
3.2. Barriers to and incentives for adopting DSTs
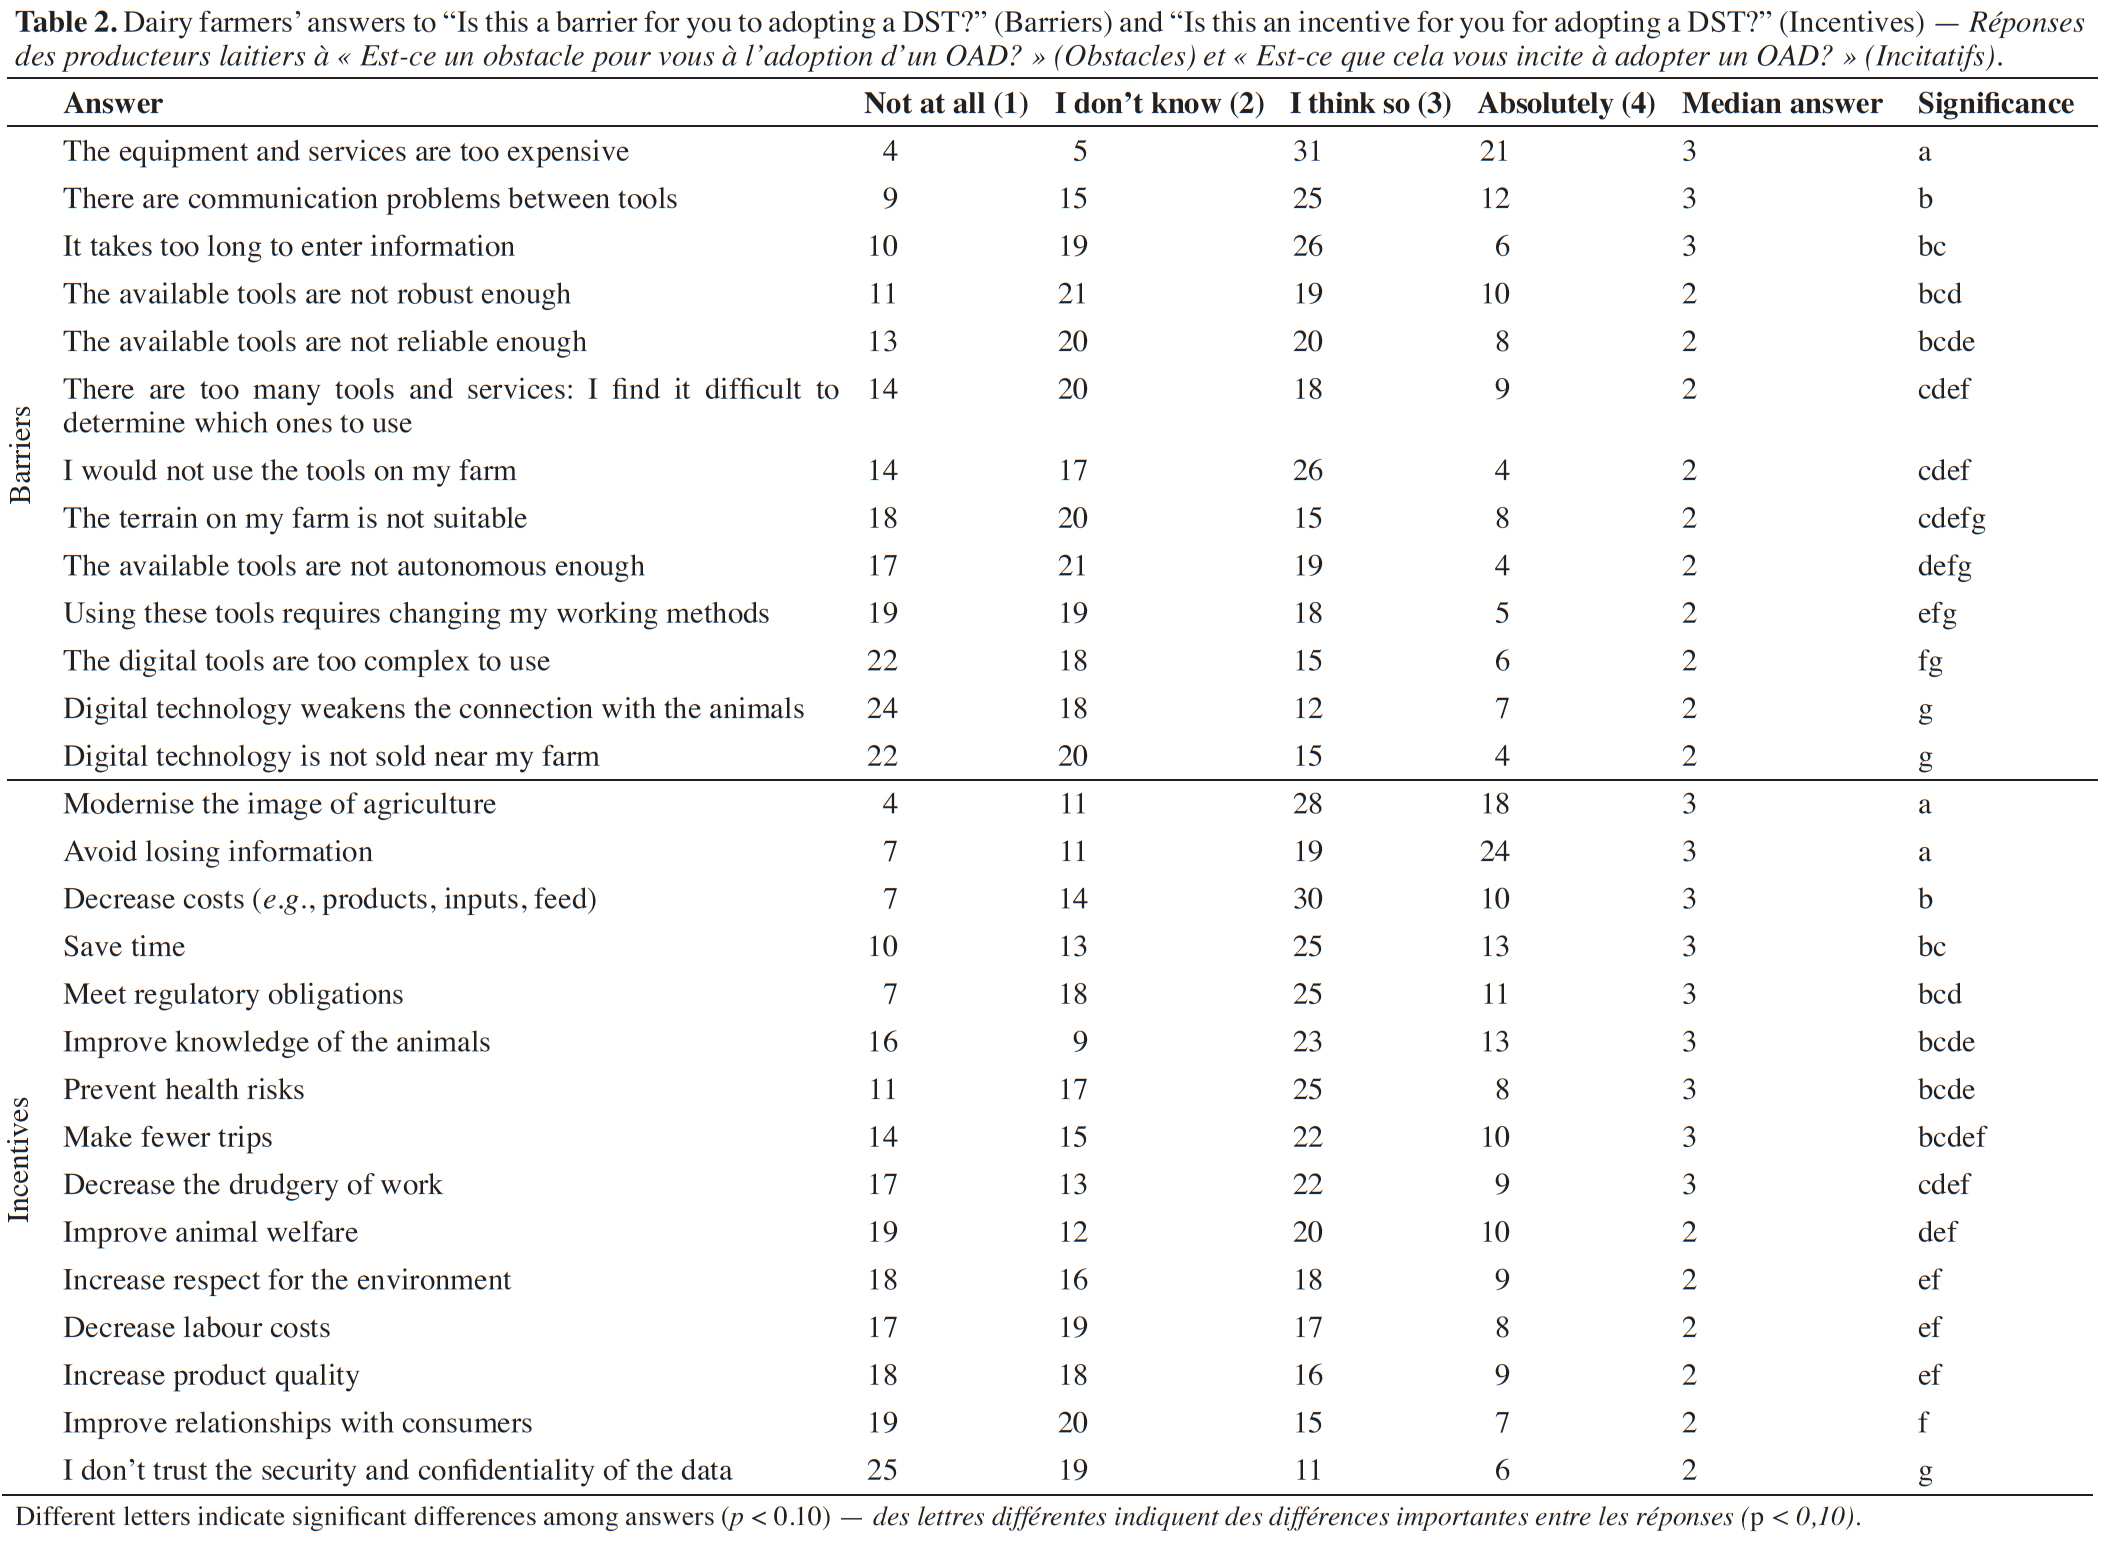
14Famers’ perceptions of barriers to and incentives for adopting DSTs varied (Table 2). Three barriers had the highest median answer of “I think so”: the cost of DSTs, communication problems between DSTs, and the time required to enter information. However, the cost had significantly more influence than the other two barriers, while the last barrier did not differ significantly from the fragility (lack of robustness) of DSTs (i.e. they break easily), the lack of reliability in terms of advice, too many and unclear choices of DST, a lack of usability (i.e. DSTs do not respond to users’ need), and farm terrain unsuitable for using DSTs. The barriers cited least were specifically related to digital DSTs, such as potential complexity, loss of connection with the animals, and the lack of sellers nearby. Farmers cited two main incentives for adopting DSTs: modernizing agriculture and avoiding losing information. Other incentives had a median answer of “I think so” but differed significantly from those already cited: decreasing the drudgery of work, making fewer trips, preventing health risks, improving knowledge of the animals, meeting regulatory obligations, saving time, and saving money. The least cited incentives, with a median answer of “I don’t know”, included improving relationships with consumers, improving product quality, decreasing labor costs, increasing respect for the environment, and improving animal welfare.
3.3. Interest in DSTs
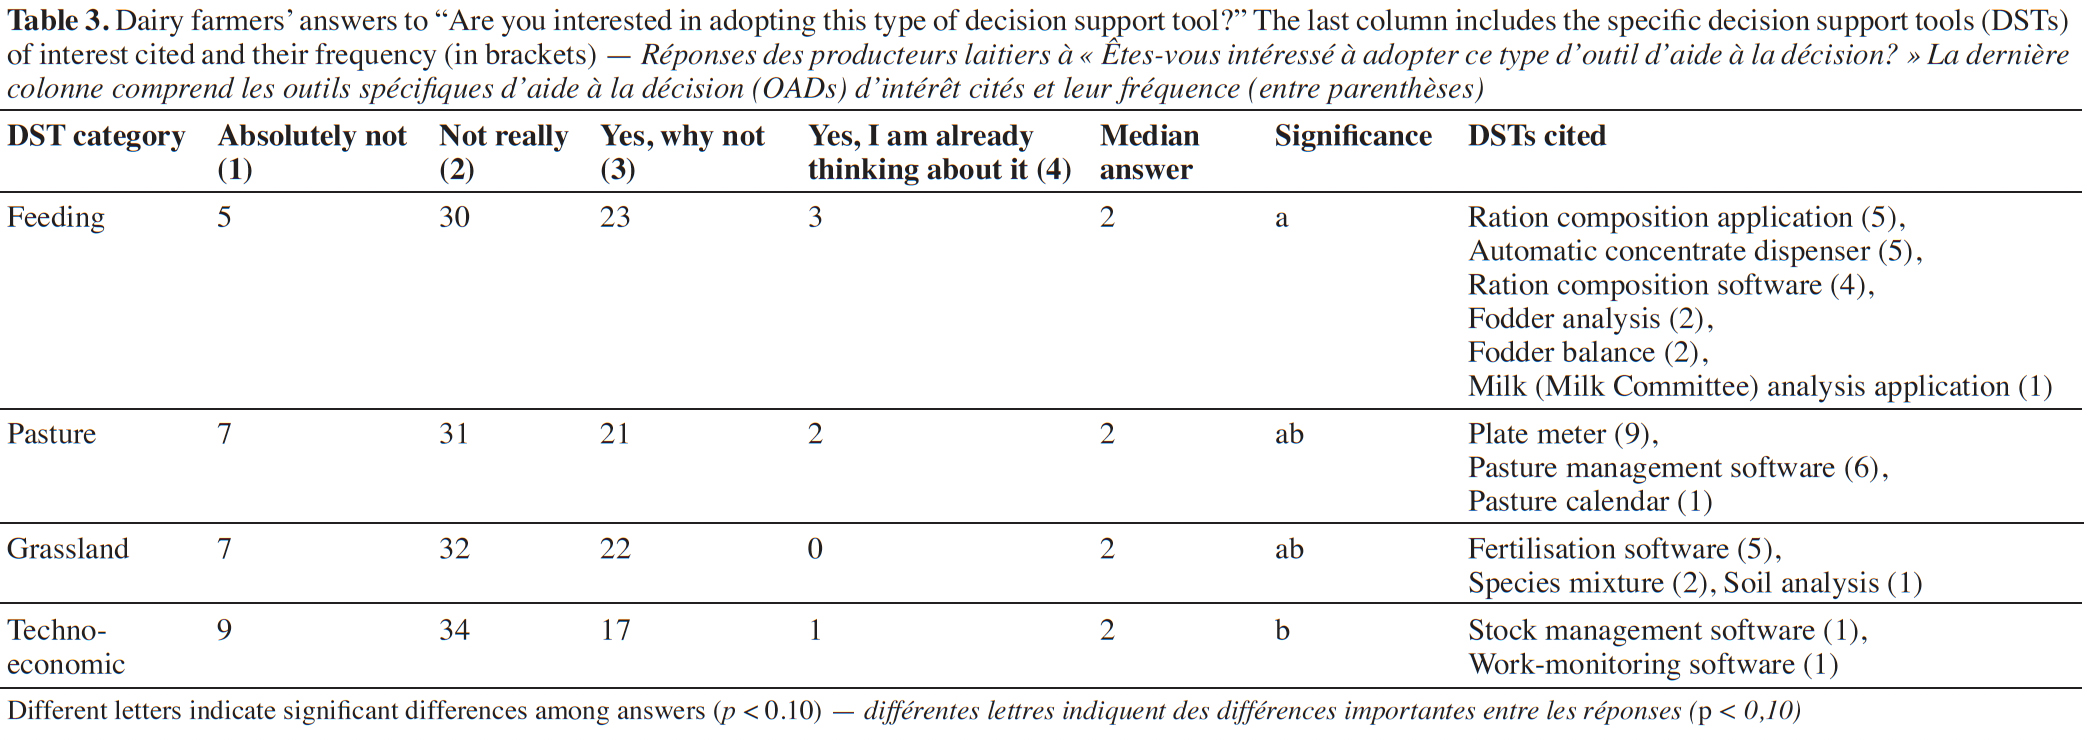
15In terms of interest, feeding, pasture, grassland and techno-economic DSTs had a median answer of “Not really” (Table 3). Farmers were significantly more interested in using feeding DSTs than techno-economic DSTs. However, only 5% of farmers were interested in adopting a feeding DST in the short term. The DSTs of interest cited by at least three farmers included plate meters (n = 9), pasture management software (n = 6), smartphone applications to support feeding management (n = 5), automatic concentrate dispensers (n = 5), fertilization software (n = 5) and ration composition software (n = 4).
3.4. Guidance
16Of the different sources of guidance, the internet was the only one that more than half the farmers identified as sufficient, but it did not differ significantly from information from advisers or technical documents. All other sources of guidance had a median answer of “No, but I don’t need it”. Farmers identified continuing education as the most insufficient source of information, but it did not differ significantly from initial training, exchanges with other farmers, or technical documents. Farmers’ perceptions of the sources of information are shown in Supplementary material, table 1.
3.5. Influence of user type on the use and perception of DSTs
17Farmers were grouped into four types of users (H-NG: high user – no grazing, H-T/TG: high user – traditional or technical grazing, L-TG: low user – traditional grazing, and M-ORG: moderate user – organic) using a k-means algorithm based on Euclidean distances calculated from the first five principal components of the MCA (Figure 3). The low percentage of variance in the data set explained by the two first components (36.1%) is normal for an MCA, which analyses categorical variables. The third component, which explained 13.5% of the variance, distinguished H-T/TG and L-TG better. The distribution of user types among the categories of each variable and the significance of differences between them are shown in Supplementary material, table 2.
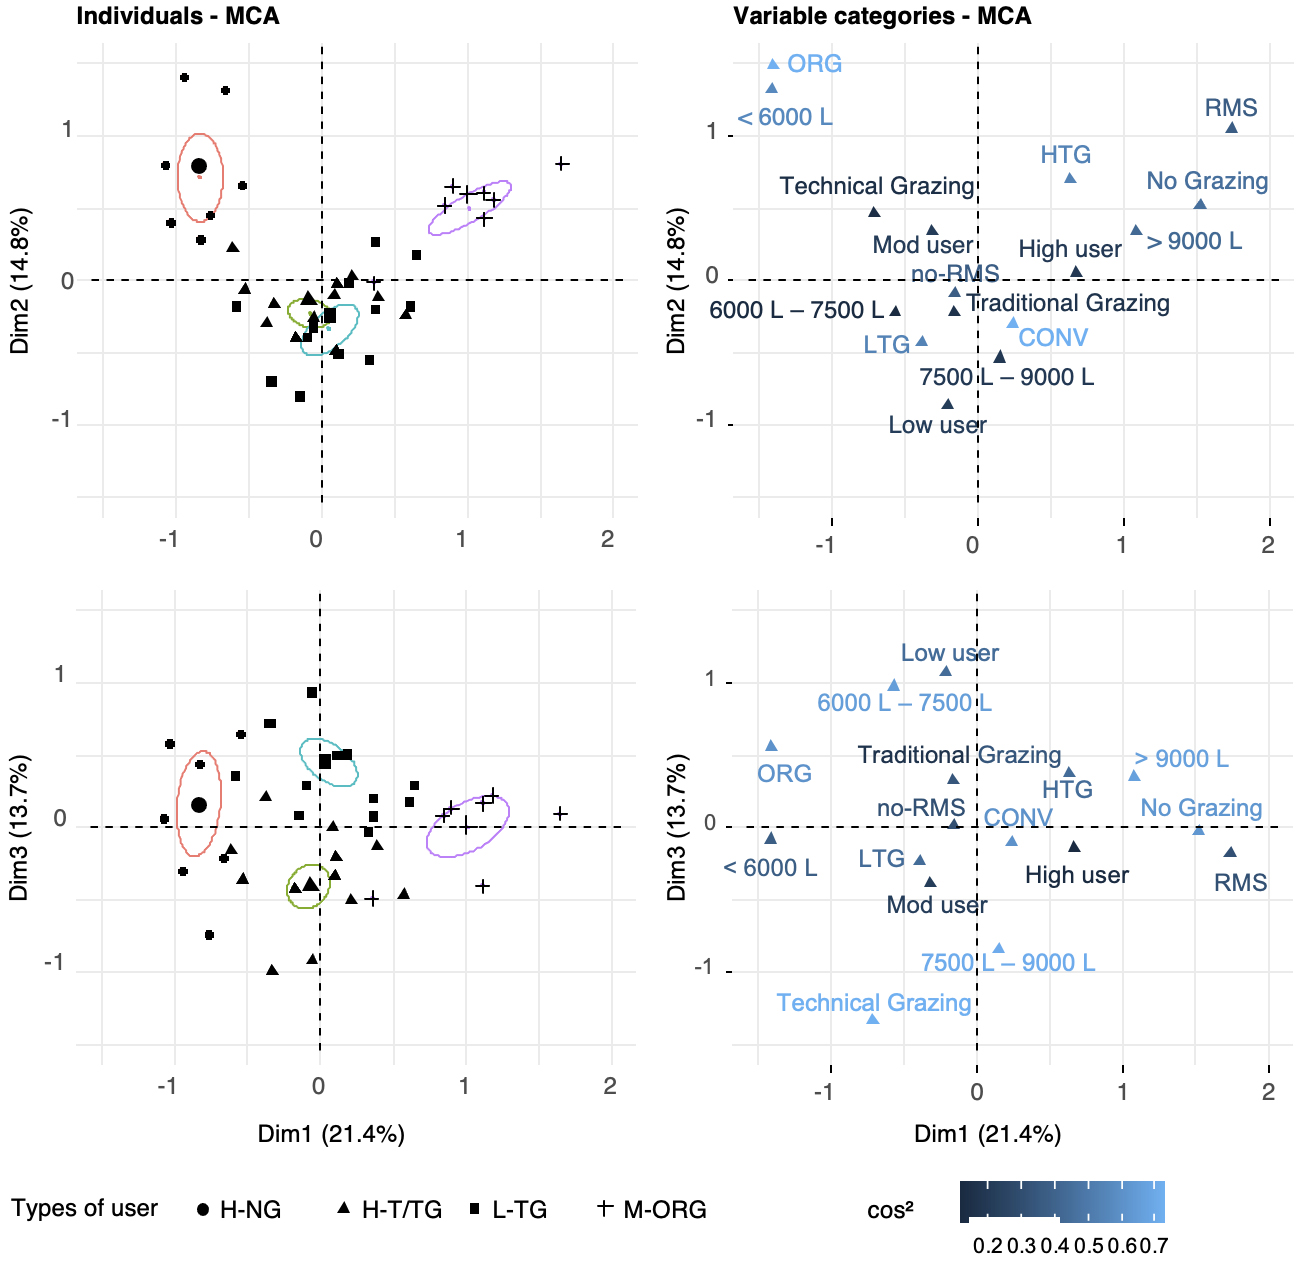
Figure 3. Biplots of (top) dimensions 1 and 2 and (bottom) dimensions 1 and 3 of the multiple correspondence analysis (MCA) of structural parameters (grazing practice, milk production per cow, number of dairy cows, percentage of temporary grassland (high [HTG] or low [LTG]), presence of a robotic milking system (RMS), and type of farming (CONVentional or ORGanic)) and overall level of use of decision support tools (DSTs) (low, moderate, or high for the 23 types of DST assessed) that significantly influenced the types of users defined (H-NG: high user no grazing, H-T/TG: high user traditional or technical grazing, L-TG: low user traditional grazing, and M-ORG: moderate user organic) identified through k-means analysis. The biplots show (left) user types, with the barycentre of each type and its 95% confidence interval, and (right) categorical variables. Categories are shaded as a function of their degree of representation (cos²) in the biplot — Biplots de dimensions (supérieures) 1 et 2 et de dimensions (inférieures) 1 et 3 de l’analyse par correspondance multiple (AMC) des paramètres structurels (pâturage, production laitière par vache, nombre de vaches laitières, pourcentage de prairies temporaires [HTG] élevé ou faible [LTG]), la présence d’un système de traite robotisé (RMS), et le type d’agriculture [CONVentional ou ORGanic]) et le niveau global d’utilisation des outils d’aide à la décision (OAD) (faible, modéré ou élevé pour les 23 types d’OAD évalués) qui ont fortement influencé les types d’utilisateurs définis (H-NG : utilisation élevée sans pâturage, H-T/TG : utilisation élevée de pâturages traditionnels ou techniques, L-TG : utilisation faible de pâturages traditionnels et M-ORG : utilisation modérée de produits biologiques) identifiés par l’analyse des k-means. Les biplots montrent (à gauche) les types d’utilisateurs, avec le barycentre de chaque type et son intervalle de confiance à 95 % et (à droite) les variables catégoriques. Les catégories sont ombrées en fonction de leur degré de représentation (cos²) dans le biplot.
18M-ORG (n = 10) consisted of moderate users of DSTs. This type included all organic farms (90% of farms in the type) and had milk production < 6000 L, no RMS, and technical and continuous-to-slow rotational (traditional) grazing. The other three types consisted exclusively of conventional farms. H-NG (n = 8) consisted of high users of DSTs and had the highest milk production (> 9000 L), no grazing (with or without outdoor access), and a high percentage of temporary grassland. Four of the five RMS users belonged to this type. H-T/TG (n = 24), the second largest type of DST user, included those who used the most technical grazing practices (6 out of 10; Table 1) and many traditional grazers (17), and had milk production of 7 500-9 000 L and a low percentage of temporary grassland. L-TG (n = 19) consisted of farms that used the fewest DSTs and had milk production of 6 000-7 500 L, traditional grazing, and an intermediate percentage of temporary grassland.
19These user types had significant relations with the types of DST used, certain incentives, and perceptions of the guidance on using DSTs (all p < 0.10, pairwise comparison included; Supplementary material, table 3). In terms of the level of technical sophistication, L-TG used significantly fewer indicators than H-T/TG. H-NG used automatic concentrate dispensers (albeit not significantly different from H-T/TG) and stock management software the most often. H-T/TG and H-NG used ration composition software more often than the other two types. H-T/TG used a fodder balance DST more often than L-TG did. M-ORG used a pasture calendar more often than all other user types. L-TG was less convinced of the benefit of using DSTs: this type agreed significantly less than M-ORG did about the potential time savings, and less than H-NG and H-T/TG about the help that DSTs could provide in meeting regulatory obligations. L-TG was also the least satisfied with information about DSTs on the internet (median answer: “No, but I don’t need it”) and through exchanges with other farmers (median answer: “Not enough”).
4. Discussion
4.1. DST use and interest
20Our results showed that farmers rarely used all of the DSTs available: 16 of the 23 DSTs analyzed were used by less than 25% of the farmers. However, 100% of the farmers used at least a few times a year a DST for using grass-based fodder, directly or indirectly. This percentage is larger than the 49% observed in the United Kingdom by Rose et al. (2016) when studying a wider range of production types (i.e. arable crops, sheep, beef, dairy) and the 68% of dairy farmers observed in The Netherlands (Bufe et al., 2018). Both studies defined DSTs broadly and considered multiple types of DSTs.
21The level of technical sophistication influenced the use of DSTs. The DSTs used most frequently were relatively simple general indicators from information sources that were already available on the farm by other means (e.g. accounting, milk invoice) or obtained from a specific test (e.g. fodder, soil). Bufe et al. (2018) found similar results, as the DSTs most frequently used were practical field measurement instruments and manuals. To this end, one recommendation is to provide simple performance indicators and values to farmers so that they will develop solutions themselves that are adapted to their own contexts (pers. comm., H. Kohnen, Agricultural Technical School, Luxembourg).
22In terms of the scope, the DSTs used least focused on pastures (Figure 2). Among them, the grazing calendar was the most frequently used pasture DST, mainly in a paper format, which is a simple method for keeping records. Nevertheless, only computerized calendars can calculate performances and perform simulations automatically (Seuret et al., 2014). Currently, the adoption of plate meters is considered a major challenge for more precise management of pasture resources (Wilkinson et al., 2020). Our results show that their adoption remains low, and farmers did not use grazing management software that can use grass height to provide recommendations about rotational grazing management. Nevertheless, farmers were interested in plate meters and grazing management software (Table 3).
4.2. User type influences DST adoption rate and the types of DST adopted
23Non-grazing intensive farms (H-NG) used the most DSTs, which confirms the observations of Shalloo et al. (2018). However, the observation that farmers who depended on pasture resources were low users of DSTs can be explained in more detail. We observed that intensive traditional or technical grazers (H-T/TG) were high users of DSTs and that extensive and/or organic farmers (M-ORG) were moderate users of DSTs. This result is similar to the typology of Allain et al. (2015) for the adoption of connected technology on dairy farms. While they defined a highly equipped type of farm with a large herd, they also described a type of grazing farm with an intermediate herd size and a farmer interested in using more connected technology. In the present study, user types had preferences for specific types of DSTs; for example, H-NG used automatic concentrate dispensers and stock management software most frequently, while M-ORG used a pasture calendar most frequently. As a result, a one-DST-fits-all solution may not be the most suitable, and DST development must adapt to the diversity of DST user types.
4.3. Barriers to and incentives for adopting DSTs
24Our results show that farmers perceived cost as the main barrier to adopting DSTs. However, 66% of them also agreed that using DSTs would reduce their operational costs. Hence, the added value (savings – costs) of DSTs must be explored (Nguyen et al., 2007). The second largest barrier to adopting DSTs was the time needed to implement and use them: (1) the tools do not communicate enough, and (2) it takes too long to enter information. More than half of the farmers agreed that DSTs can help them make fewer trips and decrease the drudgery of work. Thus, DSTs may require an initial investment of money and/or time to provide a gain later. This indicates the need to address the lack of time (or question the time priority) and lack of financial support of farmers to invest in DSTs (Lile et al., 2001; Dobos et al., 2004; Nguyen et al., 2007).
25Some DSTs require too much time to enter the needed raw data, but this step can be shortened by using inter-connected DSTs, exchanging the information needed, or using one overall DST that directly covers multiple scopes. In this case, developing big data, along with storing data on an integrated platform, could help address this issue (Lokhorst et al., 2019). Information can also be entered automatically by connected sensors and/or databases, which would automate tasks (Faverdin et al., 2020). However, overall connected DSTs could become too complex to understand and require a large initial investment (Baldin et al., 2021). We observed that software and automated tools were adopted less often than indicators, except for ration composition software and automatic concentrate dispensers (Figure 2).
26Nearly half of the farmers indicated that barriers to adopting DSTs included their fragility and lack of reliability, which corresponds to the core factors “trust” and “performances” of Rose et al. (2016). In the 10-year participatory study of Carberry et al. (2002), farmers were initially skeptical of the DST developed because they did not understand how a model could represent real-world behavior. However, the accuracy of the model’s predictions ultimately inspired their confidence. Hence, to gain trust, the functioning of DSTs could be better documented (Carberry et al., 2002; Moore, 2007), and they could be developed and updated based on the best available science (Reeves et al., 1996; Moore, 2007). However, this search for accuracy and optimal performance often involves using new technologies and advanced mathematical models, which could again hinder farmers’ understanding. We observed that the complexity of digital DSTs did not seem to be a major barrier to farmers adopting them. Thus, we suggest that a DST’s interface be kept as simple as possible, but not its background model, which must predict accurately. However, the “functioning” and associated knowledge system of the model must be well understood (Michels et al., 2019).
27Continued support is required to promote the adoption of new knowledge systems (Eastwood & Kenny, 2009). We identified that continuing education was the most insufficient source of information. More than 30% of the farmers perceived that advisers, technical documents, exchanges with other farmers, and initial training were also insufficient sources of information. Turner et al. (2020) demonstrated that providing innovative DSTs does not result in changes in practices unless farmers learn how to use the data effectively. DSTs cannot provide a new knowledge system on their own; the appropriate knowledge system must be provided to inform farmers about how a particular DST can assist them. The L-TG user type illustrates this point, as it was the least convinced of the benefits of DSTs and used them the least frequently, which may represent “unconscious incompetence” (Turner et al., 2020). Along with the lowest DST use, this user type also had the lowest milk production among the conventional farms, which is similar to the survey results of Creighton et al. (2011) and may have been due to a specific strategy of low capital investment (Shalloo et al., 2018). However, more knowledge-intensive technical grazing could help increase both milk production and income (Hanrahan et al., 2018).
28Approximately 30% of the farmers thought (and 10% were absolutely convinced) that there were too many DSTs and that it was difficult to determine which ones to use, which indicates the need to increase communication about DSTs (Nguyen et al., 2007). Farmers’ perceptions of DSTs could improve, as approximately half of the farmers agreed that using DSTs could improve animal welfare, prevent health risks, reduce environmental impacts, meet regulatory obligations, increase product quality, and improve relationships with consumers. Moore (2007) indicated the need to integrate DST development into a life-cycle project, stressing the need for ongoing commitment from the “host” organization, especially for dissemination and support. Without this holistic approach of DST conception, the risk is that public DSTs developed in research projects will not be maintained or disseminated once the project is finished (Bufe et al., 2018).
29Approximately half of the farmers perceived that DSTs would not be useful on their farms, were not adapted to their farm terrain, or would require changing their working methods. The development of technology-driven DSTs does not always meet the needs of the sector. Faverdin et al. (2020) explain that DST development must transition from “technology driven” (i.e. What will I do with this new information?) to “decision driven” (i.e. What information do I need to approach this situation?). The interface or medium used to communicate information to end-users, as well as the scripts (i.e. knowledge structure) between developers and end-users, can vary greatly and create obstacles (Eastwood & Kenny, 2009). Therefore, collaboration with end-users should be improved throughout DST development, beginning with identifying the help needed and defining the problem (Shalloo et al., 2018; Allain et al., 2021). To correspond better with practices, DSTs should use not only new technology but also new heuristics (Plant & Stone, 1991).
4.4. Limitations of this study
30Overall, the different agricultural regions of Wallonia were well represented in the survey even though the proportion of answers from the Région Limoneuse and Région sablo-limoneuse (44%) was higher than the proportion of dairy farmers in those regions (34%) (SPW, 2022). The sample of farmers represented only 2% of the dairy farmer population of Wallonia (SPW, 2022). A larger sample could enhance the quality of the MCA. Furthermore, the results could be biased as the survey was online, restricting its use to farmers having a computer or smartphone.
5. Conclusions
31Dairy farmers mainly used simple indicators as DSTs to manage grass-based fodder rather than software or automated tools. As indicators are already present and used on the farm, their effectiveness would likely improve by increasing communication about how to interpret them, which would provide low-cost DSTs for farmers and developers. DSTs that support pasture management were used the least, but farmers had the most interest in them, especially in plate meters and associated grazing management software. The type of user influences the perception of DSTs, their adoption rate, as well as the type of DSTs considered interesting. To be successful, we recommend that DST developers include end-users in each step of the development process to better target sector needs and adapt DSTs to diverse user types. Furthermore, additional guidance is needed to provide the necessary knowledge system associated with DSTs, and communication about existing tools must continue to improve. Finally, future studies should consider farmers’ time and/or financial investment in DSTs.
Acknowledgements
32This research was realized in the frame of the project EFFORT, financed by the Walloon Agricultural Research Center (CRA-W) within the framework of the law of defiscalisation of research institutions (known as the Moerman Law). The authors are very grateful to the 61 farmers who spent their precious time to answer the survey and to Nina Lachia (AgroTIC) who kindly transferred us a survey on digital tools from which some of our questions are derived.
Bibliographie
Ackoff R.L., 1960. Unsuccessful case studies and why. Oper. Res., 8(2), 259-263, doi.org/10.1287/opre.8.2.259
Allain C. et al., 2015. La connectivité des élevages bovins laitiers. In : Actes des 22e Rencontres autour des Recherches sur les Ruminants, Paris, Centre des Congrès de la Villette, 403.
Allain C., Pavie J., Gautier D. & Pierre P., 2021. L’internet des objets appliqué aux fourrages, à la conduite. Fourrages Prairies 2.0., 247, 1-9.
Baldin M. et al., 2021. Integrated Decision Support Systems (IDSS) for dairy farming: a discussion on how to improve their sustained adoption. Animals, 11(7), 2025, doi.org/10.3390/ani11072025
Battheu-Noirfalise C. et al., 2022. Gestion des ressources fourragères : quels outils d’aide à la décision sont à disposition des éleveurs laitiers ? Fourrages, in press.
Bauer D.F., 1972. Constructing confidence sets using rank statistics. J. Am. Stat. Assoc., 67(339), 687-690, doi.org/10.1080/01621459.1972.10481279
Benjamini Y. & Yekutieli D., 2001. The control of the false discovery rate in multiple testing under dependency. Ann. Stat., 29(4), doi.org/10.1214/aos/1013699998.
Boone H.N. & Boone D.A., 2012. Analyzing likert data. J. Extension (JOE), 50(2), article 48.
Borcard D., Gillet F. & Legendre P., 2011. Numerical ecology with R, Use R! New York: Springer-Verlag.
Bufe C. et al., 2018. Beslisondersteunende hulpmiddelen voor de ruwvoerproductie in Nederland : inventarisatie van online beslisondersteunende hulpmiddelen en analyse van het gebruik in de praktijk. Wageningen, The Netherlands: Stichting Wageningen Research, Wageningen Plant Research.
Carberry P.S. et al., 2002. The FARMSCAPE approach to decision support: farmers’, advisers’, researchers’ monitoring, simulation, communication and performance evaluation. Agric. Syst., 74(1), 141-177, doi.org/10.1016/S0308-521X(02)00025-2
Creighton P. et al., 2011. A survey analysis of grassland dairy farming in Ireland, investigating grassland management, technology adoption and sward renewal: grassland management, technology adoption and sward renewal. Grass Forage Sci., 66(2), 251-264, doi.org/10.1111/j.1365-2494.2011.00784.x
de Winter J.F.C. & Dodou D., 2010. Five-point likert items: t test versus Mann-Whitney-Wilcoxon. Pract. Assess. Res. Eval., 15(1), Article 11, doi.org/10.7275/bj1p-ts64
Dela Rue B.T., Eastwood C.R., Edwards J.P. & Cuthbert S., 2020. New Zealand dairy farmers preference investments in automation technology over decision-support technology. Anim. Prod. Sci., 60(1), 133, doi.org/10.1071/AN18566
Dobos R.C., Ashwood A.M., Moore K. & Youman M., 2004. A decision tool to help in feed planning on dairy farms. Environ. Modell. Software, 19(10), 967-974, doi.org/10.1016/j.envsoft.2003.11.013
Dolecheck K., Heersche G.J. & Bewley J., 2013. Investment analysis of automated estrus detection technologies. In: Proceedings of the Precision dairy conference and expo, June 26-27, 2013, University of Minnesota, Mayo Civic Center, Rochester, Minnesota, 103-104.
Donnelly J.R. et al., 2002. Evolution of the GRAZPLAN decision support tools and adoption by the grazing industry in temperate Australia. Agric. Syst., 74(1), 115-139, doi.org/10.1016/S0308-521X(02)00024-0
Eastwood C.R. & Kenny S., 2009. Art or science? Heuristic versus data driven grazing management on dairy farms. Extension Farming Syst. J., 5(1), 95-102.
Edwards J.P., Dela Rue B.T. & Jago J.G., 2015. Evaluating rates of technology adoption and milking practices on New Zealand dairy farms. Anim. Prod. Sci., 55(6), 702, doi.org/10.1071/AN14065
Faverdin P. et al., 2020. Élevage de précision : de nouvelles informations utiles pour la décision ? INRA Prod. Anim., 33(4), 223-234, doi.org/10.20870/productions-animales.2020.33.4.4585
Fisher R.A., 1970. Statistical methods for research workers. Edinburgh: Oliver and Boyd, 362.
Gargiulo J.I., Eastwood C.R., Garcia S.C. & Lyons N.A., 2018. Dairy farmers with larger herd sizes adopt more precision dairy technologies. J. Dairy Sci., 101(6), 5466-5473, doi.org/10.3168/jds.2017-13324
Hanrahan L. et al., 2018. Factors associated with profitability in pasture-based systems of milk production. J. Dairy Sci., 101(6), 5474-5485, doi.org/10.3168/jds.2017-13223
Hostiou N. et al., 2017. Impact of precision livestock farming on work and human-animal interactions on dairy farms. A review. Biotechnol. Agron. Soc. Environ., 21(4), 268-275.
Keen P.G.W., 1987. Decision support systems: the next decade. Decis. Support Syst., 3(3), 253-265, doi.org/10.1016/0167-9236(87)90180-1
Kruskal W.H. & Wallis W.A., 1952. Use of ranks in one-criterion variance analysis. J. Am. Stat. Assoc., 47(260), 583-621, doi.org/10.2307/2280779
Lachia N., Pichon L., Fourcaudot R. & Tisseyre B., 2021. Élevage pâturant : une filière peu équipée en outils numériques avec des besoins spécifiques. Fourrages Prairies 2.0., 247, 97-103.
Lile J.A. et al., 2001. Practical use of the rising plate meter (RPM) on New Zealand dairy farms. Proc. N. Z. Grassland Assoc., 63, 159-164, doi.org/10.33584/jnzg.2001.63.2425
Little J.D.C., 1970. Models and managers: the concept of a decision calculus. Manage. Sci., 16(8), B-466, doi.org/10.1287/mnsc.16.8.B466
Lokhorst C., de Mol R.M. & Kamphuis C., 2019. Invited review: big data in precision dairy farming. Animal, 13(7), 1519-1528, doi.org/10.1017/S1751731118003439
McCown R.L., 2002a. Locating agricultural decision support systems in the troubled past and socio-technical complexity of ‘models for management.’ Agric. Syst., 74(1), 11-25, doi.org/10.1016/S0308-521X(02)00020-3
McCown R.L., 2002b. Changing systems for supporting farmers’ decisions: problems, paradigms, and prospects. Agric. Syst., 74(1), 179-220, doi.org/10.1016/S0308-521X(02)00026-4
Meinke H. et al., 2001. Increasing profits and reducing risks in crop production using participatory systems simulation approaches. Agric. Syst., 70(2-3), 493-513, doi.org/10.1016/S0308-521X(01)00057-9
Michels M., Bonke V. & Musshoff O., 2019. Understanding the adoption of smartphone apps in dairy herd management. J. Dairy Sci., 102(10), 9422-9434, doi.org/10.3168/jds.2019-16489
Moore A.D., 2007. Decision support tools: key to success. In: Holden N.M., ed. Making science work on the farm: a workshop on decision support systems for Irish agriculture. Dublin: Joint Working Group in Applied Agricultural Meteorology, 1-10.
Mougenot C., Petit S. & Gaillard C., 2020. Le « coup d’œil » de l’éleveur est-il menacé par l’élevage de précision ? Activités, 17(2), doi.org/10.4000/activites.5693
Nguyen N.C., Wegener M. & Russell I., 2007. Decision support systems in Australian agriculture: state of the art and future development. Agric. Bus. Manage. Farming Syst., 4, 15-21.
Peyraud J.L. & Delaby L., 2005. Combiner la gestion optimale du pâturage et les performances des vaches laitières : enjeux et outils. INRA Prod. Anim., 18(4), 231-240, doi.org/10.20870/productions-animales.2005.18.4.3529
Plant R.E. & Stone N.D., 1991. Knowledge-based systems in agriculture. New York: McGraw-Hill, Inc., 364.
R Core Team, 2021. R: a language and environment for statistical computing. Vienna: R Foundation for Statistical Computing, https://www.r-project.org/, (20/06/2022).
Reeves M., Fulkerson W., Kellaway R. & Dove H., 1996. A comparison of three techniques to determine the herbage intake of dairy cows grazing kikuyu (Pennisetum clandestinum) pasture. Aust. J. Exp. Agric., 36(1), 23, doi.org/10.1071/EA9960023
Rose D.C. et al., 2016. Decision support tools for agriculture: towards effective design and delivery. Agric. Syst., 149, 165-174, doi.org/10.1016/j.agsy.2016.09.009
Schewe R. & Stuart D., 2015. Diversity in agricultural technology adoption: how are automatic milking systems used and to what end? Agric. Hum. Values, 32(2), 199-213, doi.org/10.1007/s10460-014-9542-2
Seuret J.-M. et al., 2014. Des outils d’aide à la gestion du pâturage pour mieux valoriser les prairies et renforcer la confiance des éleveurs. Fourrages, 218, 191-201.
Shalloo L. et al., 2018. Review: grass-based dairy systems, data and precision technologies. Animal, 12(s2), s262-s271, doi.org/10.1017/S175173111800246X
SPW (Service public de Wallonie), 2022. Cheptel bovin laitier. État de l’agriculture wallonne, http://etat-agriculture.wallonie.be/cms/render/live/fr/sites/reaw/contents/indicatorsheets/EAW-A_II_c_2.html, (07/09/2022).
Turner L., Irvine L. & Kilpatrick S., 2020. Incorporating data into grazing management decisions: supporting farmer learning. Anim. Prod. Sci., 60(1), 138-142, doi.org/10.1071/AN18533
Wilkinson J.M., Lee M.R.F., Rivero M.J. & Chamberlain A.T., 2020. Some challenges and opportunities for grazing dairy cows on temperate pastures. Grass Forage Sci., 75(1), 1-17, doi.org/10.1111/gfs.12458
Yang W. et al., 2021. Analysis of adoption trends of in-parlor technologies over a 10-year period for labor saving and data capture on pasture-based dairy farms. J. Dairy Sci., 104(1), 431-442, doi.org/10.3168/jds.2020-18726
