


- Accueil
- Volume 27 (2023)
- Numéro 2
- Weed control under increasing cover crop diversity in tropical summer and winter


Visualisation(s): 1737 (43 ULiège)
Téléchargement(s): 300 (5 ULiège)

Weed control under increasing cover crop diversity in tropical summer and winter

Résumé
Lutte contre les adventices dans le cadre d'une diversité croissante des cultures de couverture en été et en hiver dans les régions tropicales
Description du sujet. La pression des adventices est une contrainte biotique majeure dans les systèmes de culture tropicaux. Les mélanges de plantes de services ont gagné en popularité pour limiter la croissance des adventices par la compétition pour les ressources, mais la relation entre la diversité des plantes de services et la suppression des adventices est encore en débat.
Objectifs. Cette étude vise à évaluer l'impact de l'augmentation de la diversité des plantes de services (une à quatre espèces) sur la maîtrise des adventices pendant deux saisons de croissance (été tropical et hiver) sur l'île de la Réunion.
Méthode. La maîtrise des adventices a été exprimée en fonction de la couverture du sol et de la masse sèche aérienne des adventices, et la réponse de cette maîtrise aux traits des plantes de services a été testée en utilisant un modèle d’équations structurelles.
Résultats. Alors que les plantes de services ont réduit le recouvrement et la masse sèche des adventices de 60 % et 68 % en moyenne en été et en hiver, respectivement, un nombre plus élevé d'espèces dans un mélange n'a pas augmenté la maîtrise moyenne des adventices. Néanmoins, la maîtrise des adventices a été influencée par la composition du mélange et a été améliorée par l’utilisation de Guizotia abyssinica. De plus, les traits des plantes de services expliquant la maîtrise des adventices différaient selon les saisons. En été, la maîtrise des adventices a été principalement expliquée par la biomasse aérienne et la surface foliaire des plantes de services (stratégie d' « épuisement »). En revanche, en hiver, la maîtrise des adventices a été principalement expliquée par la vitesse de recouvrement des plantes de services (stratégie d' « obstruction »).
Conclusions. L'utilisation de traits pour caractériser les mélanges de plantes de services nous a permis d'identifier des mélanges d'espèces et de traits adaptés à différentes conditions de croissance. Notre étude suggère qu'une attention particulière à l'identité des espèces plutôt qu'à leur diversité devrait être accordée dans les mélanges pour améliorer la maîtrise des adventices dans les conditions tropicales.
Abstract
Description of the subject. Weed pressure is a main biotic constraint in tropical agriculture. Cover crop mixtures have increased in popularity to limit weed growth through competition for resources, but the relationship between cover crop diversity and weed suppression is still under debate.
Objectives. This study aimed to assess the impact of increasing cover crop diversity (one to four species) on weed control during two growing seasons (tropical summer and winter) in Reunion Island.
Method. Weed control was expressed regarding ground cover by weeds and weed aboveground dry mass in the mixtures during four months of growth and its response to cover crop traits was tested using structural equation models.
Results. While cover crops reduced weed ground cover and dry mass by 60% and 68% on average in summer and winter, respectively, a higher number of cover crop species within a mixture did not increase mean weed control. Nonetheless, weed control was influenced by the mixture composition and improved when including Guizotia abyssinica. Additionally, cover crop traits explaining weed control differed between growing seasons. In summer, weed control was mainly explained by the final cover crop aboveground biomass and leaf area (depletion strategy). In contrast, weed control was mainly explained by the cover crop rate of increase in ground cover (obstruction strategy) in winter.
Conclusions. Using traits to characterize cover crop mixture enables us to identify mixtures of species and traits adapted to different growing conditions. Our study suggests that particular attention on species identity rather than diversity should be paid in mixture to improve weed control in tropical conditions.
Table des matières
Received 29 July 2022, accepted 20 March 2023, available online 17 April 2023.
This article is distributed under the terms and conditions of the CC-BY License (http://creativecommons.org/licenses/by/4.0)
1. Introduction
1Faced with climate change and environmental and public health problems, the new challenge for crop science is to make current agriculture more sustainable by increasing production and limiting the use of inputs (Hunter et al., 2017). In most tropical areas, weed pressure is a main biotic constraint to agriculture (FAO, 2017). It can induce a production loss in terms of quality and quantity (Oerke, 2006). The climate is favorable for weed growth, and chemical inputs are often used to control them (Oerke & Dehne, 2004). Under new societal and environmental pressures, there is a growing need for alternatives to herbicides.
2The use of cover crops before planting (Lu et al., 2000) or during crop growth as an intercrop (Vandermeer, 1992) to control weeds can be one of these alternatives (Bhaskar et al., 2018; Mennan et al., 2020). These plants are increasingly used in innovative cropping systems to deliver well-characterized agro-ecosystem services such as erosion control (Quinton et al., 1997), improvements in soil structure and health (Snapp et al., 2005; Wortman et al., 2012; Kocira et al., 2020), pest and disease regulation (Teasdale, 1996) or suppressing weeds (Bàrberi, 2002; Altieri et al., 2011; Christina et al., 2021). But species cannot perform all targeted services, and effectiveness depends strongly on the choice of species (Snapp et al., 2005; Damour et al., 2015; McKenzie-Gopsill et al., 2022). By increasing diversity in mixtures, the various services of cover crops may be enhanced, and their variability may be reduced (Wortman et al., 2012; Finney et al., 2016; Rouge et al., 2022). Nonetheless, several studies have failed to find evidence in support of this hypothesis in annual cover-cropping systems (Smith et al., 2014; Florence et al., 2019; Florence & McGuire, 2020; Smith et al., 2020), highlighting the crucial role of species choice in crop mixture (McKenzie-Gopsill et al., 2022).
3The stability hypothesis is based on interspecific interactions between cover crops, particularly niche complementarity (Vandermeer, 1992; Damour et al., 2014, 2015; Tribouillois et al., 2015) and facilitation (Høgh-Jensen & Schjoerring, 2010). The objective of mixtures is to efficiently share resources among species (Tilman et al., 2014). Each species within a mixture can have different competitive, acquisition and use of resources strategies in terms of light interception (Tardy et al., 2015; Damour et al., 2016), water absorption, or nutrients uptake (e.g., nitrogen, Høgh-Jensen & Schjoerring, 2010; Tardy et al., 2015; Tribouillois et al., 2015). The choice of species allows orientating these strategies to determine the potential performance of the mixtures (Malézieux et al., 2009; Holmes et al., 2017). In tropical agrosystems, competition for light is often put forwards to explain weed control as other resources are seldom limiting (high fertilization rates and rainfall, Tardy et al., 2015; Christina et al., 2021). The ability of cover crops to compete for light may result from an overgrowth ability or to reduce access to light by its neighbors through shading (Tardy et al., 2015).
4Approaches based on traits are particularly relevant to characterize the interactions among cover crops within a mixture. A functional trait is a morpho-physio-phenological feature which is measurable at the plant level and impacts plant fitness as well as community demographic parameter (e.g. growth, Violle et al., 2007). Traits can be considered an indicator of plant-driven processes and make it possible to compare wide ranges of plants as, for example, cover crops. Although trait-based approaches have been extensively used in natural ecosystems, applications of these approaches to agroecosystems remain relatively new (Garnier & Navas, 2012; Damour et al., 2014; Tardy et al., 2015; Damour et al., 2016; Gaba et al., 2017). However, they can represent a high potential to identify the most suitable traits to study the role of mixtures or each species in mixtures. In tropical conditions, cover crop species with an overgrowth strategy (in height or biomass, Christina et al., 2021) or twining plants (Teasdale et al., 1998) showed high weed suppression ability. The combination of these two traits in mixtures is therefore expected to improve weed control.
5In Reunion Island, weed pressure is a major constraint for agriculture. Due to a growing demand for viable alternatives to herbicides, the 2018 Ecophyto II program aims to reduce the use of herbicides in the French agricultural sector by 50% by 2025. Cover crop mixtures appeared as an alternative to herbicides in many cropping-systems in Reunion Island (Christina et al., 2021). Based on the literature, we hypothesized that increasing the species diversity in cover crop mixtures would enhance weed control. Currently, this type of study is rare in tropical cropping-system and the weed control efficiency of mixtures compared to pure cover crops is still under debate. A trait-based approach makes it possible to characterize the different mixtures and their ability to suppress weed growth. The objectives of this study were:
6– to assess the weed control efficiency depending on the number of species in cover crop mixtures;
7– to identify traits responsible for this control in mixtures;
8– to assess the influence of species choice in the mixture.
9Field experiments with cover crops were performed during two growing seasons in Reunion Island (tropical summer and winter), with an increasing number of cover crops from one to four species in the mixture.
2. Materials and methods
2.1. Experimental site
10The field experiment was conducted from 2019 to 2020 at the Bassin Plat CIRAD experimental station in Reunion Island (-21.323, 55.491) at an altitude of 150 m a.s.l. On average, annual precipitation in this site was 850 mm·year-1 (data from 2002 to 2019), with mean monthly temperatures ranging from 20.0 °C (July, austral winter) to 26.1 °C (January, austral summer). During the trials, mean temperatures were 25.6 °C and 20.1 °C in summer and winter, respectively, and average rainfall were 147 and 33 mm·month-1 in summer and winter, respectively (Table S1). The soil type was classified as an andic cambisol (WRB classification) with main characteristics in table S2. The dominant weed flora present during the two trials was listed in table S3.
2.2. Experimental design
11The experimental design consisted of one trial performed in austral summer (from November to March) and another one in austral winter (from May to September) using tropical and temperate cover crop species (Table 1). Each trial was a complete randomized design with 13 treatments repeated three times (Figure S1, Table S4). In both trials, treatments 1 to 4 were plots with one cover crop species sown, and treatments 5 to 8 and 9 to 12 were plots with mixtures of two and three species sown, respectively. Treatment number 14 was a treatment with a mixture of four species sown and was repeated four times. Treatment plots were separated with neighbor control plots where only weeds were grown without intervention (20 control plots in total, Figure S1). Treatment plots with cover crops were 8 m² (2 m x 4 m) and weed plots were 3 m² (2 m x 1.5 m).
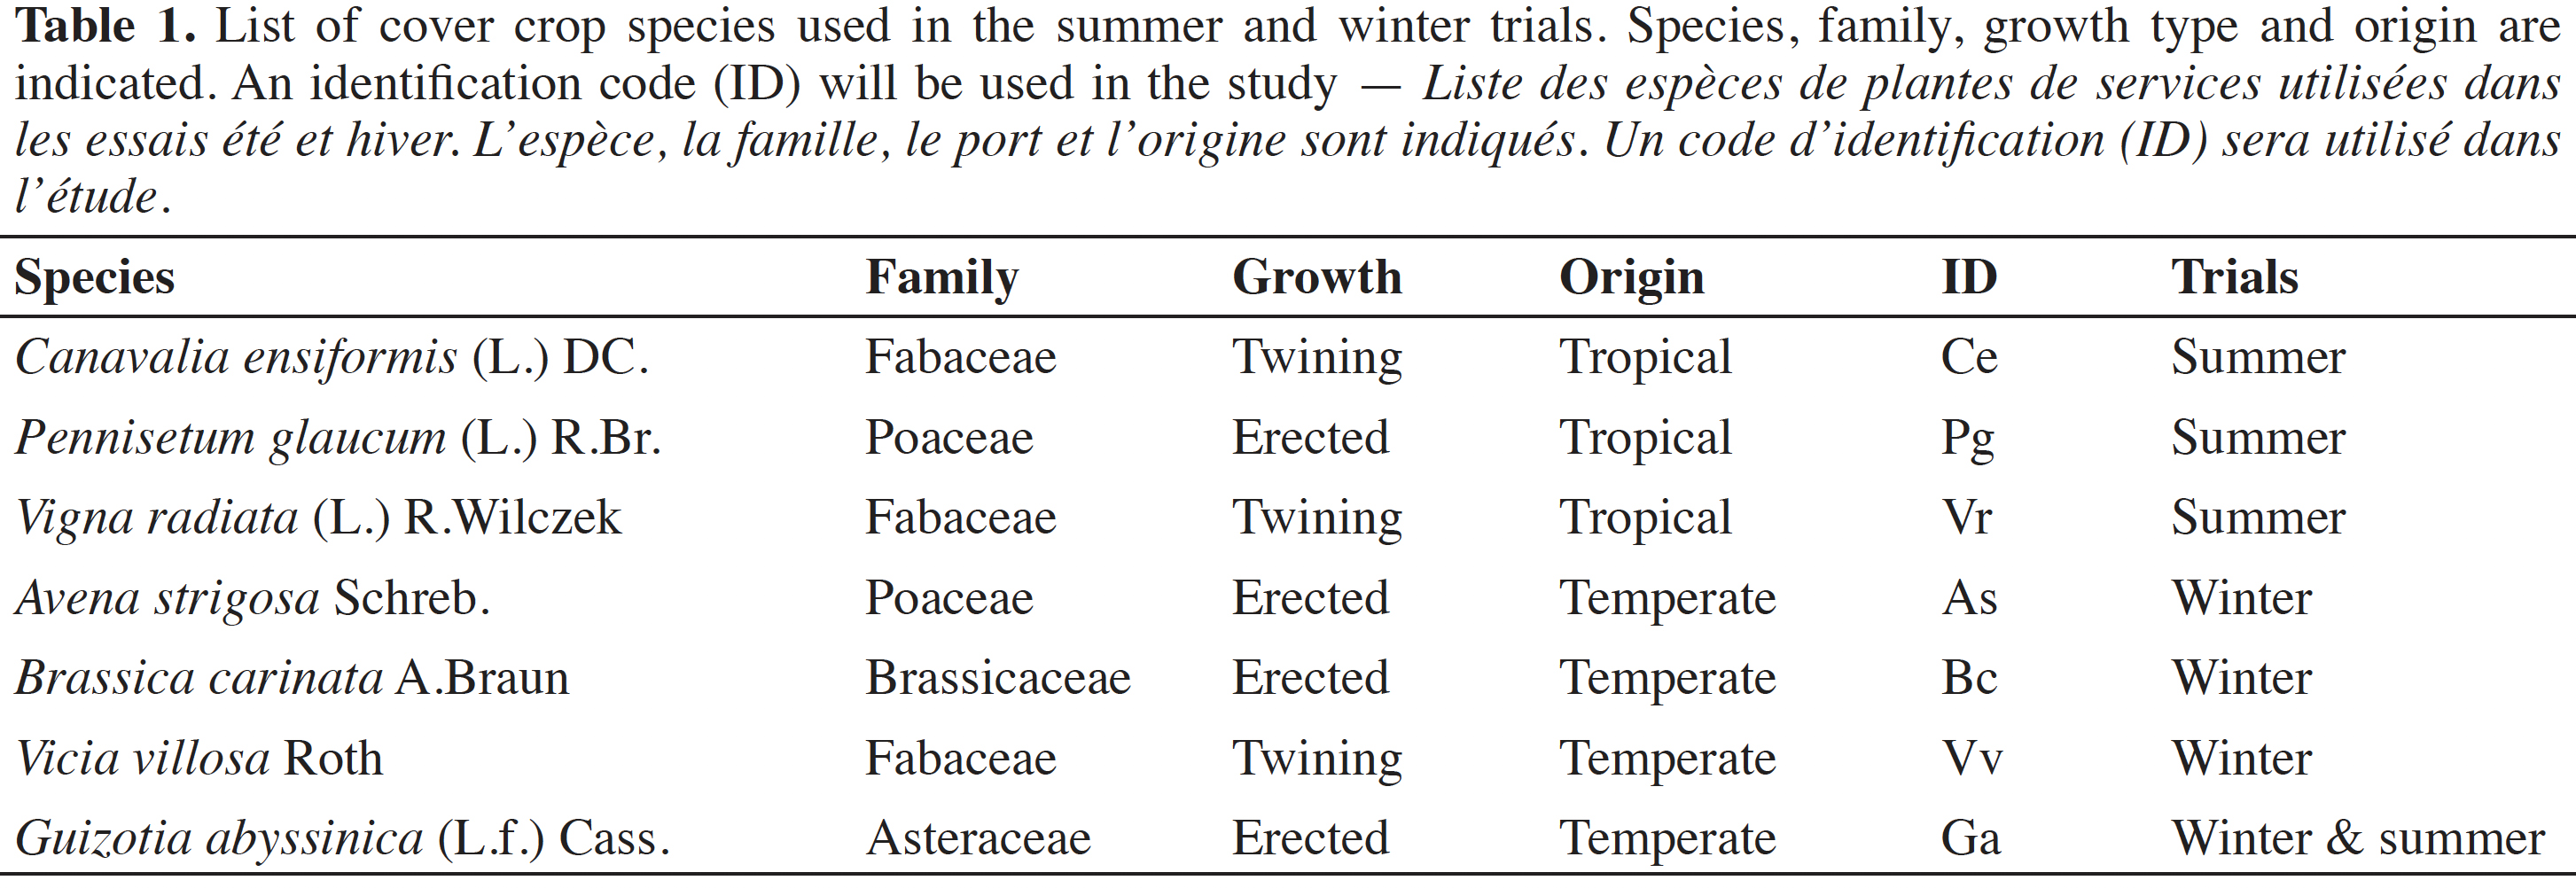
2.3. Cover crop species
12A total of 7 cover crop species were tested in this experiment, with one common species between the two trials. They were Asteraceae, Brassicaceae, Fabaceae, and Poaceae plants. Guizotia abyssinica was used in both trials because it can grow in both seasons (Tribouillois et al., 2016; Christina et al., 2021). Not all species combinations were tested. Four combinations per treatment (e.g. four combinations of two species) were chosen according to the botanical family, the origin (temperate or tropical), the plant growth habit (Table 1), and personal expertise, among a wide range of cover crop species already tested in Reunion Island (Christina et al., 2021).
2.4. Experimental management
13Soil tillage was performed before sowing using a rototiller. The first trial was sown manually on the 12th of November 2019 and harvested on the 3rd of March 2020. The second trial was sown manually on the 20th of May 2020 and harvested on the 4th of September 2020. Seed sowing densities were indicated in table S4. Sowing densities in pure crops were chosen based on local reference (Christina et al., 2021). When cover crops were mixed, the sowing density of each species in pure plots was divided by the number of species presented in the mixture. Both trials were fertilized manually at sowing with 300 kg·ha-1 of 15-12-24 (N-P-K). Finally, both trials were irrigated with around 10 mm per week divided into three applications. For both trials, the paths between plots were maintained with a brush cutter.
2.5. Trait measurements
14Trait measurements were performed during the cover crop growth from one week after sowing onwards (ground cover and height), and at the end of each experiment (3.5 months after sowing) for destructive measurements (Table 2). The same protocol was used in both summer and winter trials based on traits proposed in Christina et al. (2021). Ground cover by cover crops or weeds was measured in each plot using a visual notation method described in table S5 and used in previous studies (Marnotte, 1984; Mansuy et al., 2019; Christina et al., 2021). Notations were made weekly during the first month and every two weeks until cover crop harvest. The ground cover was assessed for each cover crop species in treatment plots and weeds as a whole in both treatment and control plots. Between two measurement dates, the ground cover was linearly extrapolated each day, and the mean ground cover (COVMEAN, %) was calculated from sowing to harvest. The maximum cover (COVMAX, %) was defined as the maximum value of cover reached by the species concerned. A rate of increase in ground cover per day (COVRATE, %·d-1) was calculated as the COVMAX divided by the number of days needed to reach it after sowing. Additionally, the height of four individuals per cover crop species was measured on the same date that the ground cover in each treatment plot. The rate of increase in height (HRATE, cm·d-1) was calculated as the slope of the linear regression between the height of the cover crops and the number of days since sowing up to reaching the maximum height.
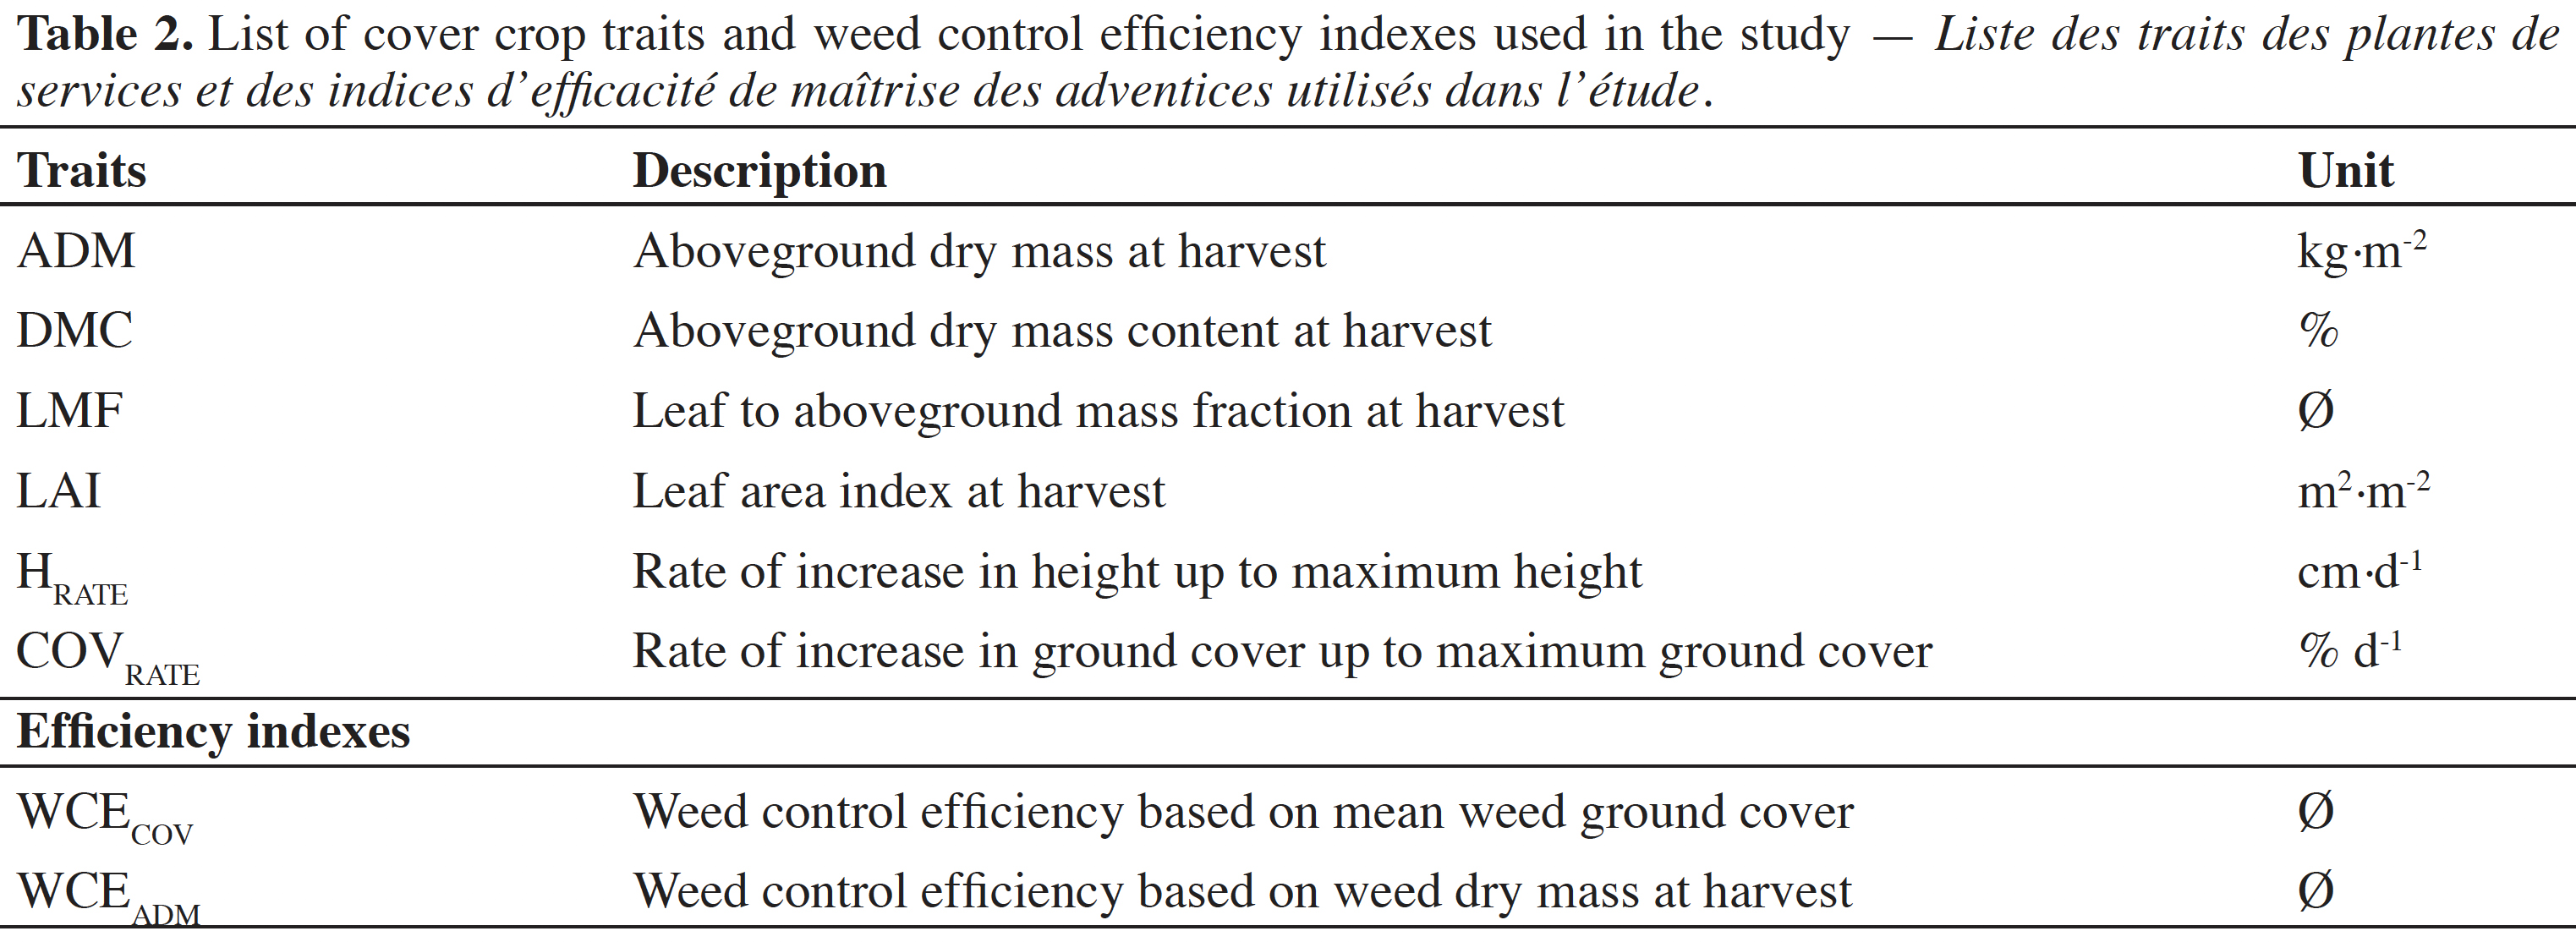
15At harvest, the fresh aboveground biomass of the whole treatment and control plots was measured and separated into each cover crop species and the whole weeds. Due to too much biomass to be dried, a sample of each cover crop species and weeds was dried at 60 °C for 48 h, and dry weights were used to assess the aboveground dry mass (ADM, kg·m-2) and the dry matter content (DMC, %) of each cover crop and weeds in the whole plot. For cover crops samples, leaves were separated to calculate the dry leaves to aboveground mass fraction (LMF). The leaf area index (LAI, m2·m-2) of each cover crop species was calculated based on leaf dry mass and specific leaf area (SLA, cm2·g-1). For each species in the whole trial, fresh leaves were selected from five individuals, leaf area was measured with the EasyLeafArea software (Easlon & Bloom, 2014), and specific leaf area was calculated based on dry mass. In each treatment plot, a community-weighted mean cover crop trait was calculated for the whole mixture of cover crops (TraitMIX) and weighted by the COVMEAN of each species, as follows:
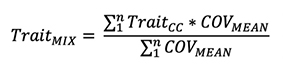
16where TraitCC is the trait of each cover crop and n is the number of cover crops within the mixture.
2.6. Weed control efficiency
17Two indexes were calculated to assess weed control efficiency based on weed ground cover (WCECOV) and weed dry mass (WCEADM). At harvest, the WCECOV was calculated in each treatment plot as follows:

18where COVMEANweed,treatment is the mean ground cover by weeds in the treatment plot and COVMEANweed,control the mean ground cover by weeds in the three nearest control plots during the whole trial. A similar equation using the weed dry mass at harvest was used for WCEADM calculation.
2.7. Data analyses
19Experimental data from this study are available online on CIRAD dataverse (Négrier et al., 2022; https://doi.org/10.18167/DVN1/WPGRAM). All analyses and plots were performed with R 4.0 (R Development Core Team, 2020). First, the influence of the presence or absence of cover crop species, the day after sowing and their interaction on the ground cover by weeds were tested using a linear mixed-effects model with the plot identification as random effect in both summer and winter seasons (lme function from nlme package, Pinheiro et al., 2022). To respect residue normality, a Box-Cox transformation was used on ground cover in summer (λ = 1.1), and in winter (λ = 0.53) separately (MASS package, Venables & Ripley, 2013). The influence of the number of cover crop species on the ground cover by weeds was tested each day after sowing using an analysis of variance followed by a sequential Bonferroni–Holm p-value correction due to multiple pairwise comparisons (Holm, 1979). The influence of the number of cover crop species, and the mixture composition on WCECOV and WCEADM were tested using an analysis of variance. In each model, the least-squares means and their 95% confidence intervals predicted by the models were calculated with emmeans package (Lenth et al., 2018).
20For each growing season and after assessing Pearson correlations among cover crop traits (R package corrplot, Wei & Simko, 2022), structural equation models (SEM, R package piecewiseSEM, Lefcheck, 2016) were built to identify and mathematically characterize the direct impact of COVRATE, LAI, and ADM on weed control efficiency. An indirect effect of LMF and COVRATE on LAI and ADM was accounted for when building SEM. Additionally, a correlation without a causal relationship was assumed between LAI and ADM. The fit of the model was evaluated using the AIC, BIC, and the global goodness-fit-criteria (Fisher’s C test). The variables selected in the model were removed when the path coefficient was not significant (p > 0.05).
21In each growing season, a principal component analysis (PCA) was performed on WCECOV, WCEADM, ADM, LAI, COVRATE, and LMF with FactoMineR (Lê et al., 2008) and factoextra (Kassambara & Mundt, 2020) R packages. The influence of the presence or absence of a given species on the cover crop traits and weed control efficiencies in the PCA was tested using a permutational multivariate analysis of variance using distance matrices with the Euclidean method to calculate pairwise distances (adonis2 function from the vegan package, Oksanen et al., 2022). The presence or absence of a given species on each trait and WCE was finally tested using a non-parametric Wilcoxon test.
3. Results
3.1. Time-course of weed ground cover
22Ground cover by weeds was influenced by the interaction between the presence or absence of cover crops and the number of days after sowing, both in summer (F10,580 = 31.4, p < 0.0001) and in winter (F8,544 = 35.4, p < 0.0001, Figure 1, Table S6). In control plots, ground cover by weeds increased up to more than 90% and peaked at this level around 30 days and 60 days after sowing in summer and winter, respectively. In the plots with cover crops, the mean ground cover by weeds across treatments reached 82 and 70% at the same date before decreasing to 31 and 48% at the end of the experiment, in summer and winter, respectively. At the beginning of the growth, ground cover by weeds was not influenced by the presence of a cover crop. The difference in ground cover started to appear after reaching the peak in ground cover.
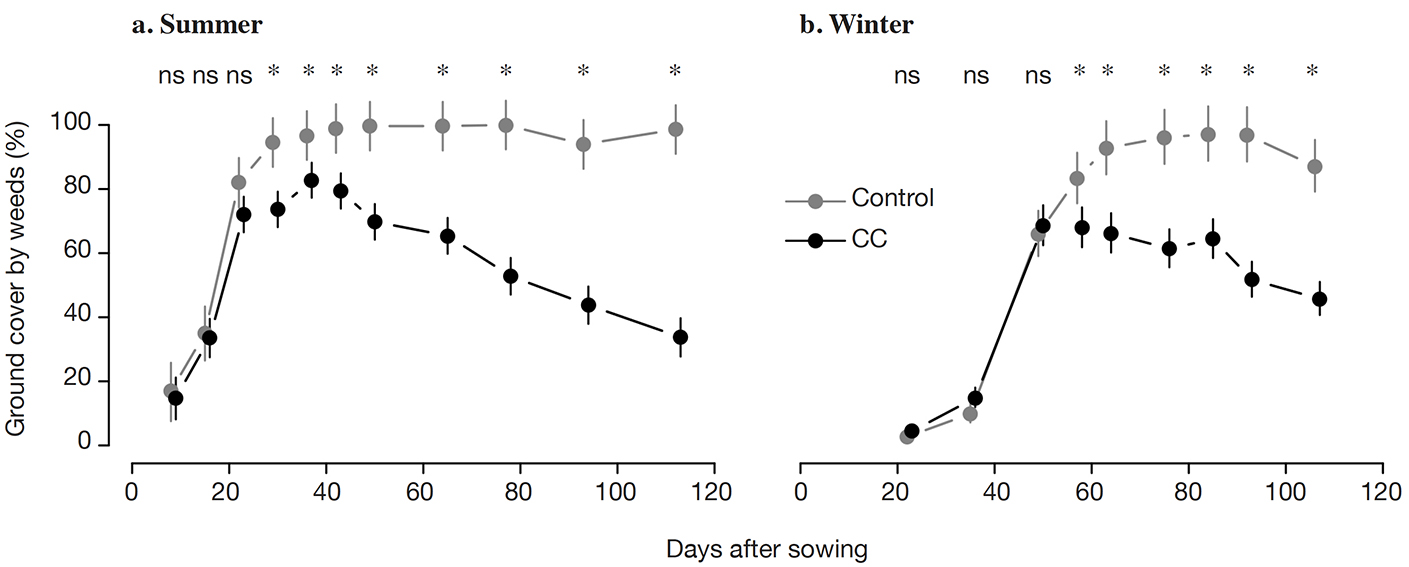
Figure 1. Time-course of ground cover by weeds depending on the presence (CC) or absence (Control) of cover crops in the summer (a) and winter (b) trials — Évolution au cours du temps de la couverture du sol par les adventices en fonction de la présence (CC) ou de l’absence (Control) de plantes de services dans les essais été (a) et hiver (b).
Mean and 95% confidence intervals predicted by the mixed linear model are represented. The effect of CC at each date was indicated as “*” when p-value was lower than 0.05 and “ns” when non-significant — Les moyennes et les intervalles de confiance à 95 % prédits par le modèle linéaire mixte sont représentés. L’effet des plantes de services à chaque date a été indiqué par «*» lorsque la p-value était inférieure à 0,05 et par « ns » lorsque l’effet n’était pas significatif.
3.2. Weed control efficiency depending on mixtures
23WCECOV and WCEADM were not different depending on the number of cover crop species within the plot, whatever growing season (Figure 2, Figure S2, Table S7). Across all treatments, the mean WCECOV was 0.38 and 0.30 in summer and winter, respectively, and the mean WCEADM was 0.42 and 0.34 in summer and winter, respectively. Nonetheless, WCECOV was influenced by the cover crop mixture composition both in summer and winter (Figure 3). WCEADM was also influenced by the cover crop mixture but only in summer (Figure S3). In summer, the cover crops with the lowest WCECOV and WCEADM were Vr and Ce pure crops and their VrCe mixtures, while the cover crops with the highest WCECOV were Ga pure crops as well as mixtures, including Ga (GaVrPg and GaVrCe, Figure 3a). In winter, the cover crops with the highest WCECOV were also mixtures and pure Ga crops (Figure 3b).
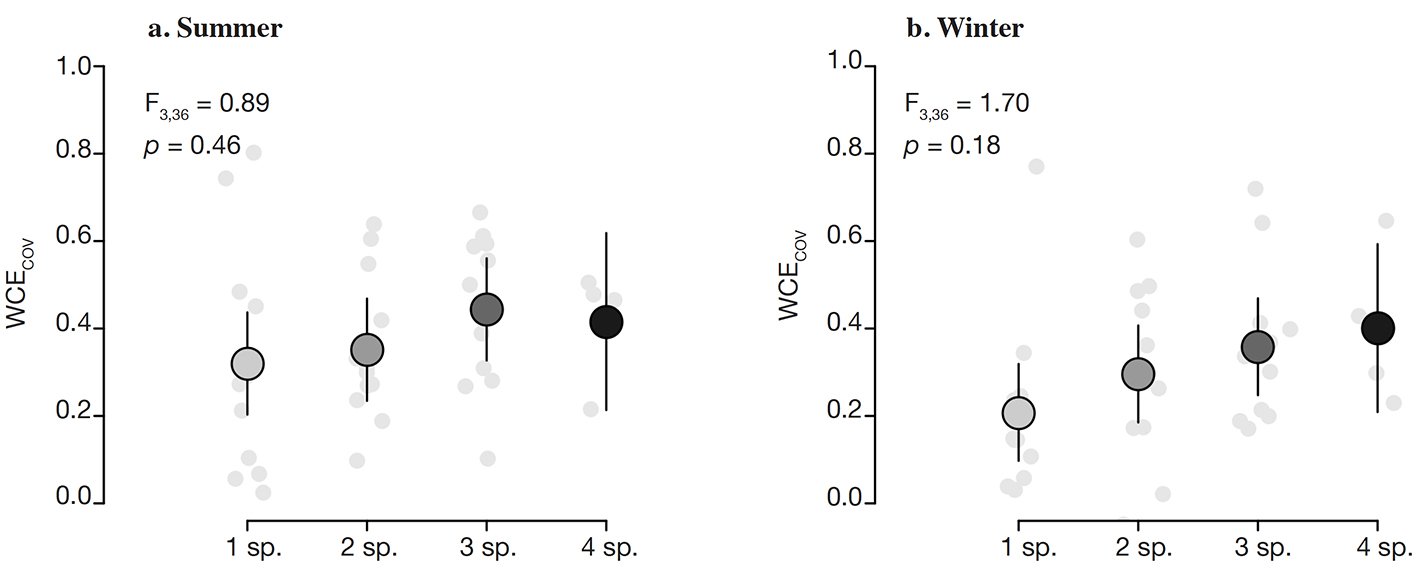
Figure 2. Weed control efficiency in terms of weed ground cover (WCECOV) depending on the number of cover crop species (sp.) in the mixture during summer (a) and winter (b) trials — Efficacité de maîtrise des adventices en termes de couverture végétale (WCECOV) en fonction du nombre d’espèces de plantes de services (sp.) dans le mélange au cours des essais été (a) et hiver (b).
Small points represented observed values. Mean (big points), and 95% confidence intervals (bars) predicted by the analysis of variance are represented — Les petits points représentent les valeurs observées. Les moyennes (gros points) et les intervalles de confiance à 95 % (barres) prédits par l’analyse linéaire de la variance sont représentés.
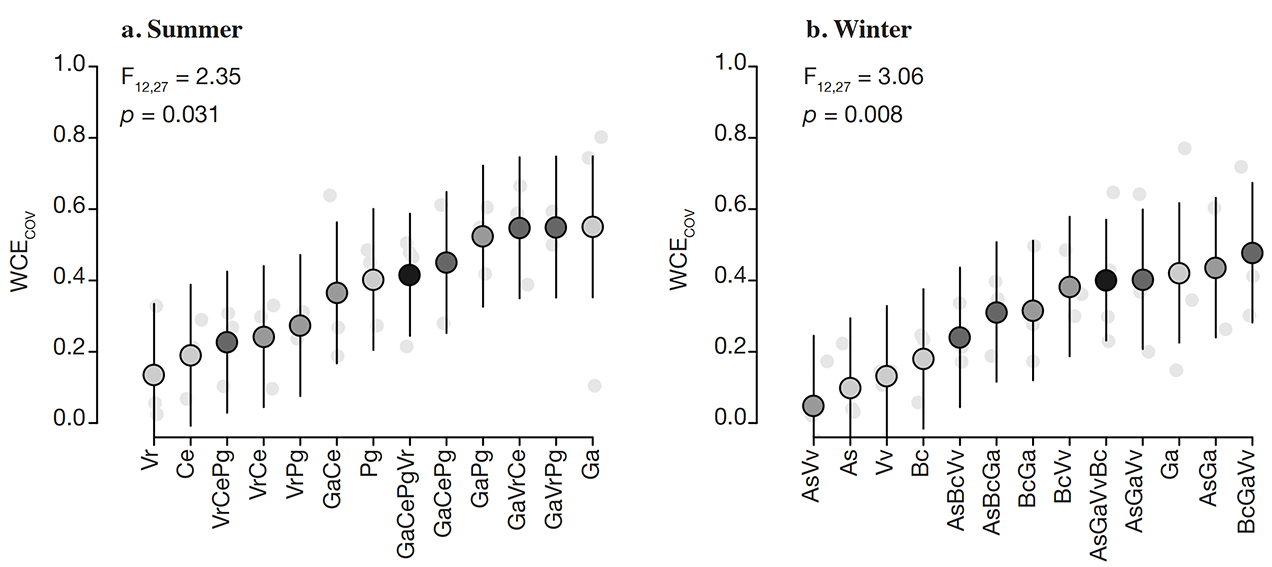
Figure 3. Weed control efficiency in terms of weed ground cover (WCECOV) depending on cover crop mixtures. WCECOV is presented in the summer (a) and winter trials (b) — Efficacité de maîtrise des adventices en termes de couverture végétale (WCECOV) en fonction des mélanges de plantes de services. Le WCECOV est présenté dans les essais été (a) et hiver (b).
Small points, big point, bars — petits points, gros points, barres: see figure 2 — voir figure 2.
3.3. Weed control and cover crop traits
24Based on multiple correlations among cover crop traits (Figure S4, Figure S5), a structural equation modeling approach was performed to test the influence of the rate of increase in ground cover after sowing (COVRATE) and the final cover crop(s) development (ADM and LAI at harvest) on WCECOV (Figure 4a). In summer, the variation in WCECOV was explained (R² = 0.74) by a direct and positive effect of LAI, ADM, and COVRATE and an indirect effect of LMF through ADM (Figure 4b). Nonetheless, COVRATE only explained 4% of WCECOV variance in summer. In winter, WCECOV variance was explained (R² = 0.80) by a direct effect of COVRATE and LAI as well as an indirect effect of COVRATE through LAI and an indirect effect of LMF through COVRATE (Figure 4c). The direct effect (0.47) of COVRATE on WCECOV was about twice as large as its indirect effect (0.27). On the contrary, ADM had no direct effect on WCECOV in winter. Similar results were found using the WCEDM (Figure S6). Like WCECOV and WCEADM, the number of cover crop species did not impact cover crop traits in both growing seasons (Tables S8 and S9).
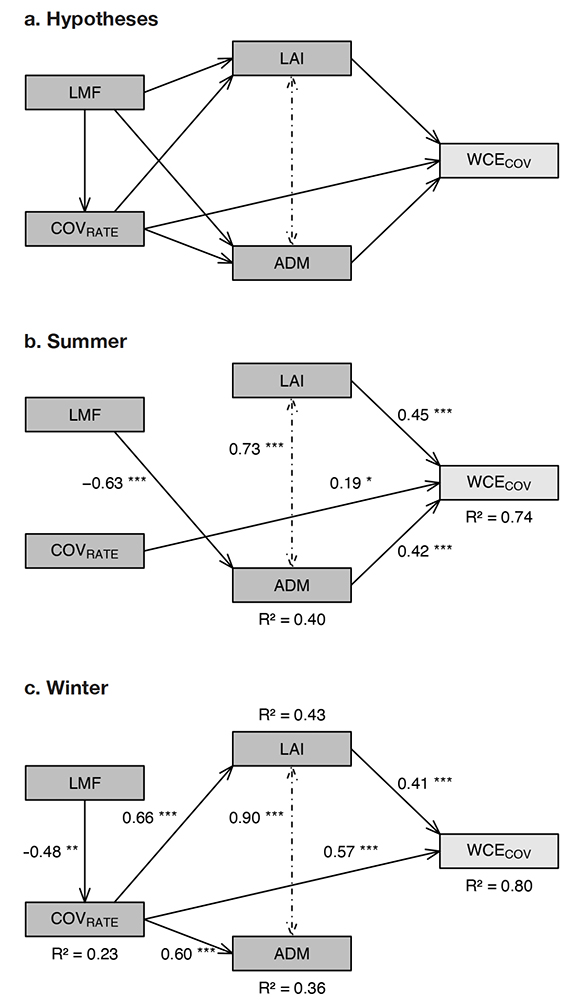
Figure 4. Structural equation models showing direct and indirect effects of cover crop traits on weed control efficiency in ground cover (WCECOV). Arrows in (a) represent the initial hypothesized structural equation model with all variables tested: cover crop(s) rate of increase in ground cover (COVRATE, %.d-1), leaf area index of the cover crop(s) (LAI, m2.m-2), aboveground dry mass of the cover crop(s) (ADM, kg.m-2) and leaf to aboveground mass fraction (LMF). The dashed arrows between LAI and ADM represent a correlation between these two variables without a causal relationship. The arrows in (b) and (c) represent the significant result of the analysis in summer and winter, respectively. The asterisks relate the significance levels of the coefficients (*: < 0.05, **: < 0.01, ***: < 0.0001), and R² per predicted variables are given. The standardized estimates in the model were presented to compare the relative strengths of predictors — Modèles d’équations structurelles montrant les effets directs et indirects des traits de plantes de services sur l’efficacité de maîtrise des adventices dans la couverture du sol (WCECOV). Les flèches en (a) représentent le modèle d’équations structurelles initial hypothétique avec toutes les variables testées : taux d’augmentation de la couverture végétale (COVRATE, %.d-1), indice de surface foliaire de la (des) plante(s) de services (LAI, m2.m-2), biomasse aérienne sèche de la (des) plante(s) de services (ADM, kg.m-2) et proportion de la biomasse foliaire dans la biomasse aérienne (LMF). Les flèches en pointillé entre LAI et ADM représentent une corrélation entre ces deux variables sans relation de cause à effet. Les flèches en (b) et (c) représentent le résultat significatif de l’analyse en été et en hiver, respectivement. Les astérisques indiquent les significativités des coefficients (* : < 0,05 ; ** : < 0,01 ; *** : < 0,0001) et le R² par variable prédite est indiqué. Les estimations standardisées du modèle ont été présentées pour comparer les forces relatives des prédicteurs.
3.4. Weed control and cover crop species
25The PCA summarized the cover crop traits (LAI, ADM, LMF, and COVRATE) and weed control efficiency (WCECOV and WCEADM) into two axes (PC1 and PC2, Figure 5). In summer (Figures 5a, 5b, 5c, 5d), PC1 (62.1% of the explained variance) was mainly determined by WCECOV, WCEADM, and ADM, while COVRATE, LAI, and LMF mainly determined PC2 (15.5% of the explained variance). In winter (Figures 5e, 5f, 5g, 5h), PC1 (66.6% of the explained variance) was mainly determined by WCECOV, WCEADM, and COVRATE, while LMF mainly determined PC2 (16.1% of the explained variance). The presence of C. ensiformis, V. radiata, B. carinata, and A. sativa had no impact on cover crop traits and WCE (Figure 5). On the contrary, the presence of G. abyssinica influenced the traits and WCE (Figures 5a and 5e), through an increase in WCE and ADM in summer, and an increase in WCE, ADM and COVRATE in winter (Figure S7). The presence of P. glaucum also influenced the mixture traits (Figure 5d) through an increase in ADM in summer (Figure S7). Finally, the presence of V. villosa influenced the mixture traits (Figure 5h) through an increase in ADM in winter.
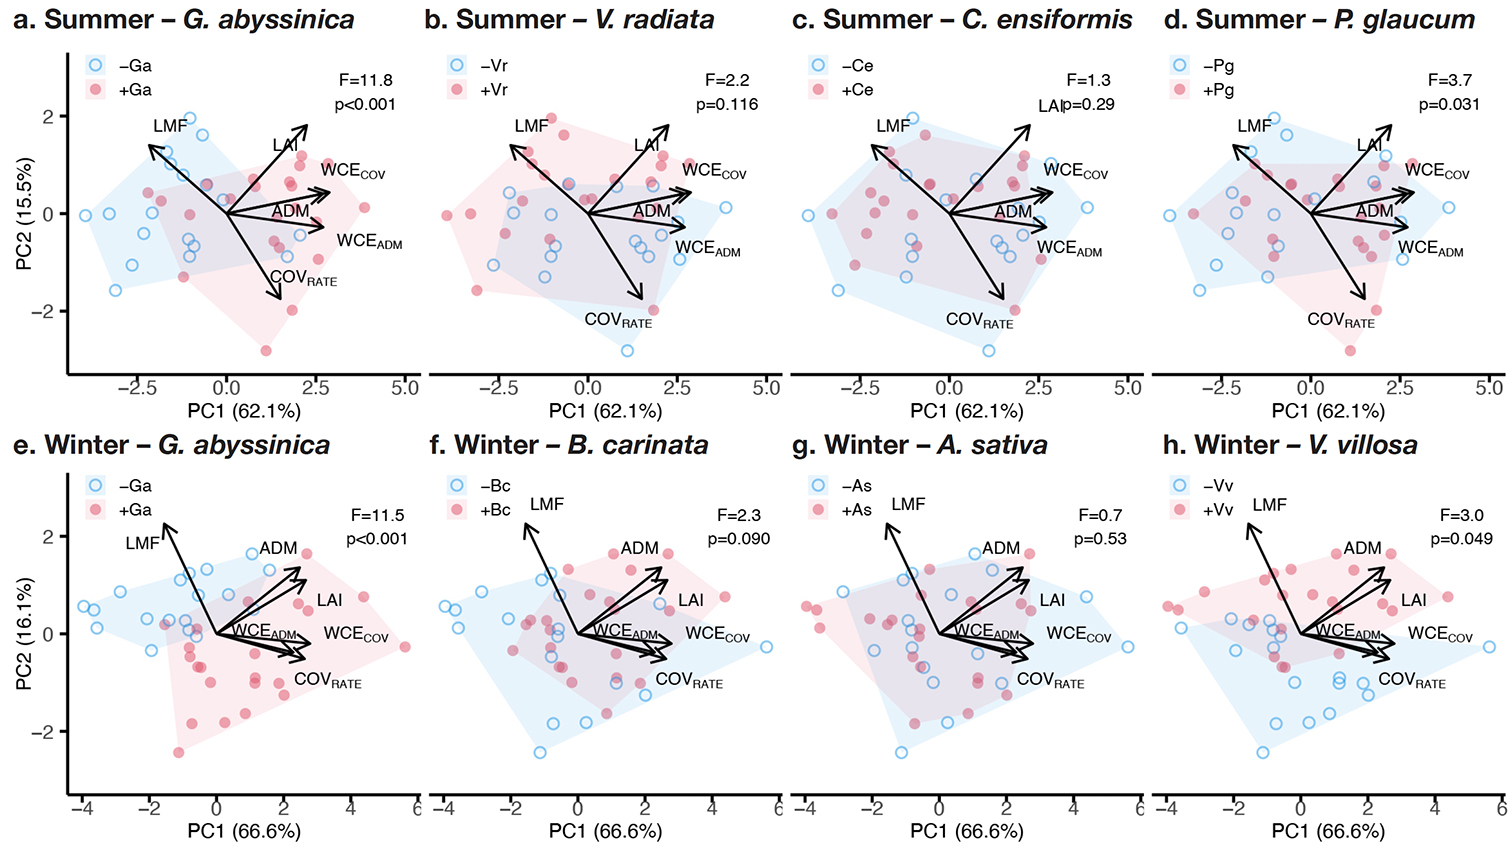
Figure 5. Principal component analysis (PCA) on cover crop traits (LAI, ADM, LMF, and COVRATE) and weed control efficiencies (WCECOV and WCEADM) during summer (a, b, c, d) and winter (e, f, g, h) depending on the presence (+, red filled point) or absence (-, blue open circle) of each species in the plot: Guizotia abyssinica (Ga, a, e), Vigna radiata (Vr, b), Canavalia ensiformis (Ce, c), Pennisetum glaucum (Pg, d), Brassica carinata (Bc, f), Avena sativa (As, g) and Vicia villosa (Vv, h). For each species, the impact of the presence or absence of the species was tested with a permutational multivariate analysis of variance with a Euclidean method to calculate pairwise distances, and the F statistics and p-values were indicated — Analyse en composantes principales (ACP) des traits des plantes de services (LAI, ADM, LMF et COVRATE) et de l’efficacité de maîtrise des adventices (WCECOV et WCEADM) en été (a, b, c, d) et en hiver (e, f, g, h) en fonction de la présence (+, point rouge rempli) ou de l’absence (-, cercle bleu) de chaque espèce dans la parcelle : Guizotia abyssinica (Ga, a, e), Vigna radiata (Vr, b), Canavalia ensiformis (Ce, c), Pennisetum glaucum (Pg, d), Brassica carinata (Bc, f), Avena sativa (As, g) et Vicia villosa (Vv, h). Pour chaque espèce, l’impact de la présence ou de l’absence de l’espèce a été testé à l’aide d’une analyse de variance multivariée permutationnelle avec une méthode Euclidienne pour calculer les distances par paire entre les matrices, et les statistiques F et les p-value ont été indiquées.
4. Discussion
26As any site-specific study, cover crop mixture performance was linked to the soil and climatic context in our study in the South of Reunion Island. Nevertheless, this study gave enlightened perspectives on weed control by cover crops in tropical summer and winter, involving different crop traits and competitive strategies.
4.1. Cover crop mixtures and weed control
27Cover crops were able to reduce weed infestation in many different situations (Teasdale, 1996; Bàrberi, 2002; Altieri et al., 2011; Cordeau & Moreau, 2017). Our study supports these previous observations: mean weed ground cover was reduced by cover crops, regardless of the number of species in the mixture. Interest in using mixtures of cover crop species has grown in recent years. The theory suggests that cover crop mixtures may increase the breadth of services provided (Tilman et al., 2014; Baraibar et al., 2018) such as a greater weed suppression (Akemo et al., 2000; Brennan & Smith, 2005; Lawson et al., 2015; Ranaldo et al., 2020). In our study, increasing the number of cover crop species in the mixture did not increase weed control. No difference in weed control efficiency regarding ground cover or biomass was found between 2, 3, or 4 species mixtures compared to the pure crop. These results are consistent with recent studies showing that cover crop mixtures are no more weed suppressive than the best-performing pure crops (Finney et al., 2016; Baraibar et al., 2018; Osipitan et al., 2018; Schappert et al., 2019; Smith & Cordeau, 2020; Gu et al., 2021). In particular, Florence & McGuire (2020) highlighted through a meta-analysis in a systematic review that in 88% of cases, there is no difference between pure crops and mixtures, and only in 2% of cases is the mixture better. Additionally, some publications suggested that by increasing diversity in mixtures, the variability of cover crop service over time and space could be decreased (Finney et al., 2016; Elhakeem et al., 2021; Franco et al., 2021). Combining species may increase resilience against weather conditions, an advantage in achieving efficient long-term weed control (Lawson et al., 2015; Schappert et al., 2019). Nonetheless, previous studies did not always support this hypothesis (Smith et al., 2014; Florence et al., 2019; Smith et al., 2020), highlighting the importance of species identity rather than just diversity (Wendling et al., 2019). For example, McKenzie-Gopsill et al. (2022) showed that legumes and mixtures containing legumes were the least stable in terms of weed control in Canada. Additionally, our results suggest that combining less species with performant ones (such as G. abyssinica) would be as efficient that mixture with high diversity.
4.2. Cover crop traits and weed control
28In our analysis, the relation between cover crop traits and weed control in mixtures differed depending on the growing season. In our tropical summer, weed control was mainly explained by aboveground biomass (ADM) compared to the rate of increase in ground cover (COVRATE). Plants, especially weeds, grow rapidly with favorable climatic conditions (temperature, light, rainfall, and nutrients). Cover crop species with high biomass were more likely to control weeds in tropical summer. Many studies highlight the relationship between biomass and weed control (Holmes et al., 2017; Osipitan et al., 2018; Schappert et al., 2019). For example, Christina et al. (2021) showed that increasing cover crop biomass was positively correlated with weed suppression in Reunion Island, as Finney et al. (2016) in central Pennsylvania in the USA or MacLaren et al. (2019) in South Africa’s winter rainfall region. At the opposite, COVRATE was the most important trait for weed control in our tropical winter conditions. Due to colder and drier climate conditions and a shorter photoperiod, weeds took longer to grow. Consequently, cover crop species with a fast ground cover rate were more likely to control weeds. These results agreed with other studies suggesting that rapid cover crop development after sowing could be more important than the final cover crop biomass to prevent weed growth (Brennan & Smith, 2005; Hayden et al., 2012; Dorn et al., 2015; Baraibar et al., 2018).
29The scientific community does not agree on the nature of the cover crop traits linked to weed control. Our study suggests that the season (i.e., climatic context) induces different weed control strategies involving different cover crop traits. On the one hand, high growth in biomass can increase the effect of competition (den Hollander et al., 2007; Tobin et al., 2012) through water or soil nutrients (Høgh-Jensen & Schjoerring, 2010; MacLaren et al., 2019) and light (Tardy et al., 2015; Damour et al., 2016). In that case, cover crops have a “depletion” competition strategy towards weeds. On the other hand, cover crops can invest in rapid ground cover to occupy the soil surface more quickly and avoid germination and the emergence of weeds. In that case, they have an “obstruction” competition strategy (Tardy et al., 2015). In our study, cover crops that successfully controlled weeds tend to have a “depletion” competition strategy in summer and an “obstruction” competition strategy in winter. Trait complementarity of cover crop species in mixtures could improve weed control stability in innovative cropping systems. Cover crops with interesting traits can be combined regardless of the number of species in the mixture (Osipitan et al., 2018; Schappert et al., 2019). Nonetheless, further studies are needed to investigate the question of trait complementarity to understand whether weed control efficiency is due to a combination of traits or the presence of a particular species in the mixture.
4.3. Cover crop species identity and weed control
30Our results highlighted how cover crop species choice is crucial regarding mixture performance rather than just the increasing diversity. In our study, G. abyssinica and mixtures including G. abyssinica control weeds better than other mixtures in both seasons. In contrast, the mixtures that less controlled weeds included C. ensiformis and V. radiata in summer an A. strigosa and mixtures with V. villosa in winter. Usually, tall grasses effectively control weeds due to their rapid growth rate (Baraibar et al., 2018; Christina et al., 2021) or high biomass (Franco et al., 2021; McKenzie-Gopsill et al., 2022). Previous studies also reported that Poaceae were often more efficient in controlling weeds than Fabaceae species (Akemo et al., 2000; Brainard et al., 2011; Baraibar et al., 2018). In our study, while mixtures including P. glaucum were efficient in summer in most cases, except for VrPg and VrCePg mixtures, and increased aboveground dry mass, it was not the case for A. strigosa in winter. Nonetheless, previous studies have shown that A. strigosa can efficiently control weeds, particularly in pure crops (Khan & McVay, 2019; Schappert et al., 2019; Christina et al., 2021).
31Despite increasing aboveground dry mass in the mixtures, V. villosa presence did not limit weed growth in our study (Figure S7). This species showed limited weed control ability in Schappert et al., (2019), Baraibar et al. (2018), and Hayden et al. (2012) due to its slow growth rate. This cover crop stayed alive in our trial under weeds and other cover crops. It grew above the canopy only at the end of the trial, rapidly increasing its ground cover. This species is not recommended in short cover crop mixtures in our climatic conditions. Still, it can be interesting for longer cover cropping when the other cover crops have finished their cycle. Our low results of V. radiata may be explained by a low emergence rate of this species in our trial, as its presence in the mixture reduced rate of increase in ground cover. Finally, while B. carinata presence did not improve weed control in our tropical winter, Holmes et al. (2017) highlighted a decrease in weed biomass with mixtures including mustards. Globally, Brassicaceae species seem to perform well because of their rapid growth and high biomass (Kunz et al., 2016), and they can dominate community biomass in mixtures (Wortman et al., 2012). In our study, winter climatic conditions may not have been suitable for cold season species, especially for A. strigosa and B. carinata. Thus, G. abyssinica seems to be a good candidate for weed management in cropping systems in our tropical conditions as a pure crop or mixtures in both summer and winter. Its high biomass in summer, and its high ground coverage rate in winter both allow to limit weed growth. In this study, the trait approach allowed us to identify different cover crop strategies that effectively control weeds. The study of traits in a broader range of cover crop species (Christina et al., 2021) could help to identify cover crop species that would be adapted to mixtures depending on growing seasons in tropical conditions.
5. Conclusions
32Our study aimed to assess the weed control efficiency under increasing cover crop diversity. Increasing the number of cover crop species in a mixture did not increase weed control. Nonetheless, weed control was influenced by the mixture composition highlighting the importance of species choice. Additionally, cover crop traits related to weed control differed according to the growing season. In summer, weed control was mainly explained by cover crops aboveground biomass (depletion strategy). In contrast, weed control was explained primarily by the cover crop rate of increase in ground cover (obstruction strategy) in winter. Among tested species, Guizotia abyssinica was the best species candidate, both in pure or mixed stands and growing seasons. In addition to their ability to control weeds, cover crops provide other ecosystem services in innovative cropping systems. Future studies will be focused on the relationship between the diversity of cover crops and the multifunctionality of cover crop mixtures.
Acknowledgements
33We thank the Conseil Régional de La Réunion, the French Ministry of Agriculture and Food, the European Union (Feader program, grant n°AG/974/DAAF/2016-00096 and Feder program, grant n°GURTDI 20151501-0000735) and Cirad for funding, within the framework of the project “Services et impacts des activités agricoles en milieu tropical” (Siaam).
Bibliographie
Akemo M.C., Regnier E.E. & Bennett M.A., 2000. Weed suppression in spring-sown rye (Secale cereale): pea (Pisum sativum) cover crop mixes. Weed Technol., 14(3), 545-549.
Altieri M.A. et al., 2011. Enhancing crop productivity via weed suppression in organic no-till cropping systems in Santa Catarina, Brazil. J. Sustain. Agric., 35(8), 855-869, doi.org/10.1080/10440046.2011.588998
Baraibar B. et al., 2018. Weed suppression in cover crop monocultures and mixtures. Weed Sci., 66(1), 121-133, doi.org/10.1017/wsc.2017.59
Bàrberi P., 2002. Weed management in organic agriculture: are we addressing the right issues? Weed Res., 42(3), 177-193, doi.org/10.1046/j.1365-3180.2002.00277.x
Bhaskar V., Bellinder R.R., DiTommaso A. & Walter M.F., 2018. Living mulch performance in a tropical cotton system and impact on yield and weed control. Agriculture, 8(2), 1-17, doi.org/10.3390/agriculture8020019
Brainard D.C., Bellinder R.R. & Kumar V., 2011. Grass–legume mixtures and soil fertility affect cover crop performance and weed seed production. Weed Technol., 25(3), 473-479, doi.org/10.1614/WT-D-10-00134.1
Brennan E.B. & Smith R.F., 2005. Winter cover crop growth and weed suppression on the central coast of California. Weed Technol., 19(4), 1017-1024.
Christina M. et al., 2021. A trait-based analysis to assess the ability of cover crops to control weeds in a tropical island. Eur. J. Agron., 128, 126316 , doi.org/10.1016/j.eja.2021.126316
Cordeau S. & Moreau D., 2017. Gestion des adventices au moyen des cultures intermédiaires multi-services : potentiels et limites. Innov. Agron., 62, 1-14.
Damour G. et al., 2014. A trait-based characterization of cover plants to assess their potential to provide a set of ecological services in banana cropping systems. Eur. J. Agron., 52, 218-228 , doi.org/10.1016/j.eja.2013.09.004
Damour G. et al., 2015. Using functional traits to assess the services provided by cover plants. In: Sparks D.L., ed. Advances in Agronomy, 134, 81-133.
Damour G., Guérin C. & Dorel M., 2016. Leaf area development strategies of cover plants used in banana plantations identified from a set of plant traits. Eur. J. Agron., 74, 103-111, doi.org/10.1016/j.eja.2015.12.007
den Hollander N.G., Bastiaans L. & Kropff M.J., 2007. Clover as a cover crop for weed suppression in an intercropping design: II. Competitive ability of several clover species. Eur. J. Agron., 26(2), 104-112, doi.org/10.1016/j.eja.2006.08.005
Dorn B., Jossi W. & van der Heijden M.G.A., 2015. Weed suppression by cover crops: comparative on-farm experiments under integrated and organic conservation tillage. Weed Res., 55(6), 586-597, doi.org/10.1111/wre.12175
Easlon H.M. & Bloom A.J., 2014. Easy Leaf Area: Automated digital image analysis for rapid and accurate measurement of leaf area. Appl. Plant Sci., 2(7), 1400033, doi.org/10.3732/apps.1400033
Elhakeem A. et al., 2021. Do cover crop mixtures give higher and more stable yields than pure stands? Field Crops Res., 270, 108217, doi.org/10.1016/j.fcr.2021.108217
FAO, 2017. Plant production and protection division integrated weed management. Roma: FAO, http://www.fao.org/agriculture/crops/thematic-sitemap/theme/spi/scpi-home/managing-ecosystems/integrated-weed-management/en/, (18/05/2020).
Finney D.M., White C.M. & Kaye J.P., 2016. Biomass production and carbon/nitrogen ratio influence ecosystem services from cover crop mixtures. Agron. J., 108(1), 39-52, doi.org/10.2134/agronj15.0182
Florence A.M. et al., 2019. Cover crop mixture diversity, biomass productivity, weed suppression, and stability. PLOS ONE, 14(3), e0206195, doi.org/10.1371/journal.pone.0206195
Florence A.M. & McGuire A.M., 2020. Do diverse cover crop mixtures perform better than monocultures? A systematic review. Agron. J., 112(5), 3513-3534, doi.org/10.1002/agj2.20340
Franco J.G., Gramig G.G., Beamer K.P. & Hendrickson J.R., 2021. Cover crop mixtures enhance stability but not productivity in a semi‐arid climate. Agron. J., 113(3), 2664-2680, doi.org/10.1002/agj2.20695
Gaba S. et al., 2017. Response and effect of traits of arable weeds in agro-ecosystems: a review of current knowledge. Weed Res., 57, 123-147, doi.org/10.1111/wre.12245
Garnier E. & Navas M.-L., 2012. A trait-based approach to comparative functional plant ecology: concepts, methods and applications for agroecology. A review. Agron. Sustainable Dev., 32, 365-399, doi.org/10.1007/s13593-011-0036-y
Gu C. et al., 2021. Annual intercropping suppresses weeds: a meta-analysis. Agric. Ecosyst. Environ., 322, 107658, doi.org/10.1016/j.agee.2021.107658
Hayden Z.D., Brainard D.C., Henshaw B. & Ngouajio M., 2012. Winter annual weed suppression in rye–vetch cover crop mixtures. Weed Technol., 26(4), 818-825, doi.org/10.1614/WT-D-12-00084.1
Høgh-Jensen H. & Schjoerring J.K., 2010. Interactions between nitrogen, phosphorus and potassium determine growth and N2-fixation in white clover and ryegrass leys. Nutr. Cycling Agroecosyst., 87(3), 327-338, doi.org/10.1007/s10705-009-9341-0
Holm S., 1979. A simple sequentially rejective multiple test procedure. Scand. J. Stat., 6(2), 65-70.
Holmes A.A., Thompson A.A. & Wortman S.E., 2017. Species‐specific contributions to productivity and weed suppression in cover crop mixtures. Agron. J., 109(6), 2808-2819, doi.org/10.2134/agronj2017.06.0309
Hunter M.C. et al., 2017. Agriculture in 2050: recalibrating targets for sustainable intensification. BioScience, 67(4), 386-391, doi.org/10.1093/biosci/bix010
Kassambara A. & Mundt F., 2020. Factoextra: extract and visualize the results of multivariate data analyses. R Package Version 107.
Khan Q.A. & McVay K.A., 2019. Productivity and stability of multi-species cover crop mixtures in the Northern great plains. Agron. J., 111(4), 1817-1827, doi.org/10.2134/agronj2018.03.0173
Kocira A. et al., 2020. Legume cover crops as one of the elements of strategic weed management and soil quality improvement. A review. Agriculture, 10(9), 394, doi.org/10.3390/agriculture10090394
Kunz Ch. et al., 2016. Allelopathic effects and weed suppressive ability of cover crops. Plant Soil Environ., 62(2), 6066, doi.org/10.17221/612/2015-PSE
Lawson A., Cogger C., Bary A. & Fortuna A.-M., 2015. Influence of seeding ratio, planting date, and termination date on rye-hairy vetch cover crop mixture performance under organic management. PLOS ONE, 10(6), e0129597, doi.org/10.1371/journal.pone.0129597
Lê S., Josse J. & Husson F., 2008. FactoMineR: An R Package for Multivariate Analysis. J. Stat. Software, 25, 1-18, doi.org/10.18637/jss.v025.i01
Lefcheck J.S., 2016. piecewiseSEM: Piecewise structural equation modelling in r for ecology, evolution, and systematics. Methods Ecol. Evol., 7(5), 573-579, doi.org/10.1111/2041-210X.122512
Lenth R. et al., 2018. Emmeans: Estimated marginal means, aka least-squares means. R package version 1, 3, https://CRAN.R-project.org/package=emmeans, (23/3/2023).
Lu Y.-C., Watkins K.B., Teasdale J.R. & Abdul-Baki A.A., 2000. Cover crops in sustainable food production. Food Rev. Int., 16(2), 121-157, doi.org/10.1081/FRI-100100285
MacLaren C. et al., 2019. Cover crop biomass production is more important than diversity for weed suppression. Crop Sci., 59(2), 733-748, doi.org/10.2135/cropsci2018.05.0329
Malézieux E. et al., 2009. Mixing plant species in cropping systems: concepts, tools and models. Agron. Sustainable Dev., 29(1), 43-62, doi.org/10.1051/agro:2007057
Mansuy A. et al., 2019. Can écoH : mise au point de leviers pour une canne à sucre économe en herbicide à La Réunion. Innov. Agron., 76, 103-119, doi.org/10.15454/tskwve
Marnotte P., 1984. Influence des facteurs agroécologiques sur le développement des mauvaises herbes en climat tropical humide. In : 7ème Colloque international sur la biologie, l’écologie et la systématique des mauvaises herbes, 9-11 octobre 1984, Paris, 183-189.
McKenzie-Gopsill A., Mills A., MacDonald A.N. & Wyand S., 2022. The importance of species selection in cover crop mixture design. Weed Sci., 70(4), 436-447, doi.org/10.1017/wsc.2022.28
Mennan H., Jabran K., Zandstra B.H. & Pala F., 2020. Non-chemical weed management in vegetables by using cover crops: a review. Agronomy, 10(2), 257, doi.org/10.3390/agronomy10020257
Négrier A., Christina M. & Auzoux S., 2022. Experimental data set of cover crop mixture and weed control in tropical summer and winter in Reunion Island. CIRAD Dataverse, doi.org/10.18167/DVN1/WPGRAM
Oerke E.-C., 2006. Crop losses to pests. J. Agric. Sci., 144(1), 31-43, doi.org/10.1017/S0021859605005708
Oerke E.C. & Dehne H.W., 2004. Safeguarding production - losses in major crops and the role of crop protection. Crop Prot., 23(4), 275-285, doi.org/10.1016/j.cropro.2003.10.001
Oksanen J. et al., 2022. vegan: Community Ecology Package. R package version 2.6-4, https://CRAN.R-project.org/package=vegan, (23/3/2023).
Osipitan O.A., Dille J.A., Assefa Y. & Knezevic S.Z., 2018. Cover crop for early season weed suppression in crops: systematic review and meta-analysis. Agron. J., 110(6), 2211-2221, doi.org/10.2134/agronj2017.12.0752
Pinheiro J. et al., 2022. nlme: Linear and Nonlinear Mixed Effects Models.
Quinton J.N., Edwards G.M. & Morgan R.P.C., 1997. The influence of vegetation species and plant properties on runoff and soil erosion: results from a rainfall simulation study in south east Spain. Soil Use Manage., 13(3), 143-148, doi.org/10.1111/j.1475-2743.1997.tb00575.x
R Development Core Team, 2020. R: A language and environment for statistical computing. Vienna: R Foundation for Statistical Computing.
Ranaldo M., Carlesi S., Costanzo A. & Bàrberi P., 2020. Functional diversity of cover crop mixtures enhances biomass yield and weed suppression in a Mediterranean agroecosystem. Weed Res., 60(1), 96-108, doi.org/10.1111/wre.12388
Rouge A. et al., 2022. Weed suppression in cover crop mixtures under contrasted levels of resource availability. Eur. J. Agron., 136, 126499, doi.org/10.1016/j.eja.2022.126499
Schappert A., Schumacher M. & Gerhards R., 2019. Weed control ability of single sown cover crops compared to species mixtures. Agronomy, 9(6), doi.org/10.3390/agronomy9060294
Smith R.G., Atwood L.W. & Warren N.D., 2014. Increased productivity of a cover crop mixture is not associated with enhanced agroecosystem services. PLOS ONE, 9(5), e97351, doi.org/10.1371/journal.pone.0097351
Smith R.G., Warren N.D. & Cordeau S., 2020. Are cover crop mixtures better at suppressing weeds than cover crop monocultures? Weed Sci., 68(2), 186-194, doi.org/10.1017/wsc.2020.12
Snapp S.S. et al., 2005. Evaluating cover crops for benefits, costs and performance within cropping system niches. Agron. J., 97(1), 322-332.
Tardy F., Moreau D., Dorel M. & Damour G., 2015. Trait-based characterisation of cover plants’ light competition strategies for weed control in banana cropping systems in the French West Indies. Eur. J. Agron., 71, 10-18, doi.org/10.1016/j.eja.2015.08.002
Teasdale J.R., 1996. Contribution of cover crops to weed management in sustainable agricultural systems. J. Prod. Agric., 9(4), 475-479, doi.org/10.2134/jpa1996.0475
Teasdale J.R., Hatfield J.L., Buhler D.D. & Stewart B.A., 1998. Cover crops, smother plants, and weed management. Integr. Weed Soil Manage., 247, 270.
Tilman D., Forest I. & Cowles J.M., 2014. Biodiversity and ecosystem functioning. Annu. Rev. Ecol. Evol. Syst., 45(1), 471-493, doi.org/10.1146/annurev-ecolsys-120213-091917
Tobin M.F., Wright A.J., Mangan S.A. & Schnitzer S.A., 2012. Lianas have a greater competitive effect than trees of similar biomass on tropical canopy trees. Ecosphere, 3(2), art20, doi.org/10.1890/ES11-00322.1
Tribouillois H. et al., 2015. A functional characterisation of a wide range of cover crop species: growth and nitrogen acquisition rates, leaf traits and ecological strategies. PLOS ONE, 10(3), e0122156, doi.org/10.1371/journal.pone.0122156
Tribouillois H. et al., 2016. Determination of germination response to temperature and water potential for a wide range of cover crop species and related functional groups. PLOS ONE, 11(8), e0161185, doi.org/10.1371/journal.pone.0161185
Vandermeer J.H., 1992. The ecology of intercropping. Cambridge, UK: Cambridge University Press, 254.
Venables W.N. & Ripley B.D., 2013. Modern applied statistics with S-PLUS. Springer Science & Business Media, 508.
Violle C. et al., 2007. Let the concept of trait be functional! Oikos, 116(5), 882-892, doi.org/10.1111/j.0030-1299.2007.15559.x
Wei T. & Simko V., 2022. R Package “Corrplot”: visualization of a correlation matrix (Version 0.84).
Wendling M. et al., 2019. Effect of species identity and diversity on biomass production and its stability in cover crop mixtures. Agric. Ecosyst. Environ., 281, 81-91, doi.org/10.1016/j.agee.2019.04.032
Wortman S.E., Francis C.A. & Lindquist J.L., 2012. Cover crop mixtures for the western corn belt: opportunities for increased productivity and stability. Agron. J., 104(3), 699-705, doi.org/10.2134/agronj2011.0422
