


- Accueil
- Volume 27 (2023)
- Numéro 2
- Agrometeorological conditions in western Pará compared to agricultural production variables using principal component analysis


Visualisation(s): 2282 (20 ULiège)
Téléchargement(s): 116 (0 ULiège)

Agrometeorological conditions in western Pará compared to agricultural production variables using principal component analysis

Document(s) associé(s)
Version PDF originaleRésumé
Comparaison des conditions agrométéorologiques au Pará occidental et des variables de production agricole en utilisant une analyse en composantes principales
Description du sujet. Depuis le début du 21e siècle, les superficies cultivées du soja se sont étendues en Amazonie légale. Parmi les facteurs qui contribuent à l'expansion de cette culture agricole en Amazonie, les conditions climatiques favorables sont le plus important, elles correspondent à des précipitations élevées et à des régimes thermiques favorables pendant la saison de culture.
Objectifs. Dans ce contexte, le but de cette étude est de décrire les réponses de rendement du soja en fonction des variables climatiques en utilisant les données d’une importante région de culture des grains en Amazonie.
Méthode. L’analyse en composantes principales (ACP) a été utilisée avec la matrice des corrélations de Pearson selon les variables de réponse suivantes : la précipitation (R), la température de l’air (T), l'évapotranspiration réelle, le stress (WST) et l’excédent hydrique, la superficie récoltée du soja (HVA), le rendement du soja (PD), les occurrences des phénomènes d’El Niño et de La Niña (LAN).
Résultats. Les variables de production étaient négativement corrélées avec les précipitations et l'excès de surplus d'eau. Il y avait aussi une corrélation négative entre El Niño, la température et le stress hydrique. Les variables qui avaient le plus de poids dans la composante 1 étaient R, T et WST. Considérant la composante 2, les variables qui ont le plus contribué à la variation étaient HVA, PD et LAN.
Conclusions. L'apparition forte ou sévère de La Niña influence la production de soja dans la région de Belterra-PA, en raison de l'indice de précipitations élevé provoquant un excès d'eau dans le sol, entrainant un stress des plantes. L'occurrence modérée de La Niña influence positivement la production de soja dans la région pour maintenir l'approvisionnement en eau à des niveaux adéquats pour les plantes. Ces résultats montrent l'importance du suivi des variables climatiques pour l'agriculture de la région.
Abstract
Description of the subject. Since the beginning of the twenty-first century, soybean cultivation areas have been expanding in the Legal Amazon. Among the factors that contribute to the process of expansion of cultivation of grains in the Amazon, favorable climate conditions are one of the most important, and these include high rainfall indices and good thermal regimes during the cultivation period.
Objectives. In this context, the objective of this study was to describe responses of soybean production as a function of climate variables, considering data from an important grain production center in the Amazon.
Method. Principal Component Analysis (PCA) was used including the following response variables: rainfall (R), air temperature (T), real evapotranspiration, water stress (WST) and surplus, soybean area harvested (HVA), quantity produced (PD), occurrence of El Niño and La Niña (LAN).
Results. Production variables were negatively correlated with precipitation and water surplus. There was also a negative correlation between El Niño, temperature and water stress. The variables that had greater weight in component 1 were R, T and WST. Considering component 2, the variables that most contributed to the variation were HVA, PD and LAN.
Conclusions. The strong or severe occurrence of La Niña influences the soybean production in the region of Belterra-PA, due to the high rainfall index causing excess water in the soil, leading the plants to stress. The moderate occurrence of La Niña positively influences soybean production in the region to maintain the water supply at adequate levels for the plants. These results show the importance of monitoring climate variables for agriculture in the region.
Table des matières
Received 16 August 2021, accepted 26 April 2023, available online 15 May 2023
This article is distributed under the terms and conditions of the CC-BY License (http://creativecommons.org/licenses/by/4.0)
1. Introduction
1The area of soybean cultivation in the Brazilian Amazon has greatly increased during recent years, from a little over 250,000 km2 in 2006 to approximately 350,000 km2 in 2017 (Gazzoni & Dall’agnol, 2018). Before this expansion, soybean cultivation was concentrated exclusively in the Central and South regions of Brazil. However, in 2019, the area planted with soybeans in the North region, wherein is located the largest part of the Legal Amazon, reached a total of 1.9 million hectares (IBGE, 2022a). The migratory flux associated with this expansion of soybeans has stimulated the growth of regional grain production centers such as that of Western Pará, which is represented by such centers in Belterra, Mojuí dos Campos and Santarém (Costa et al., 2018).
2In the Amazon, the climate element that shows the highest variability is rainfall, and even in areas with high annual rainfall (Martorano et al., 2017), which can cause reductions in agricultural production. During some years there are large oscillations in the rainfall regime in the Amazon basin due to variations in the global climate that alter the transport of mass and energy as a result of teleconnections between dynamic atmospheric processes (do Nascimento Moura et al., 2018). These interannual global climate variations can cause oscillations of thermoclines in the South Pacific (El Niño and/or La Niña years) and on the surface of the Atlantic Ocean, thus affecting the rainfall regime in the Amazon and altering average temperatures (Moura et al., 2019; de Souza Nóia et al., 2020). In the Amazon region, during La Niña years, soil water surplus is more common, and in years with El Niño, soil water deficits usually occur.
3Extreme climatic variation compromises fundamental physiological plant processes and causes economic loss. Amazonian climatic conditions are generally favorable to agricultural crops, principally because the range of air temperature is ideal for many plants, besides the high level of rainfall. Long periods with soil water stress can severely negatively impact plant metabolism, principally during phases of high-water demand such as germination, flowering, and grain filling when there is also great demand for photo assimilates (da Rocha et al., 2017; da Silva et al., 2018).
4Climatic variables can directly and indirectly influence crop performance, and therefore these effects will be reflected in production, reducing economic gain by farmers due to a reduction in grain volume for export and price increases, and these effects are transmitted throughout the national soybean production chain (Battisti et al., 2017). In this context, the objective of this study was to identify the effect of climate variables on the production of soybeans in the grain production center in Belterra, state of Pará.
2. Materials and methods
2.1. Study area and data collection
5The study area is the grain hub in the municipality of Belterra, located in the west of the state of Pará, Amazon. The territorial area of the municipality is 4,398.18 km², with an estimated population of 17,944 inhabitants, included in the Amazon mesoregion, located between the geographic coordinates of 02°25' and 03°00' south latitude and 54°10' and 55°50' longitude west of Greenwich. Soybean is cropped on the part of the municipality formed by a plateau, with clay soils (Truckenbrodt & Kotschoubey, 1981; Oliveira Jr & Correa, 2001; IBGE, 2022b) (Figure 1).
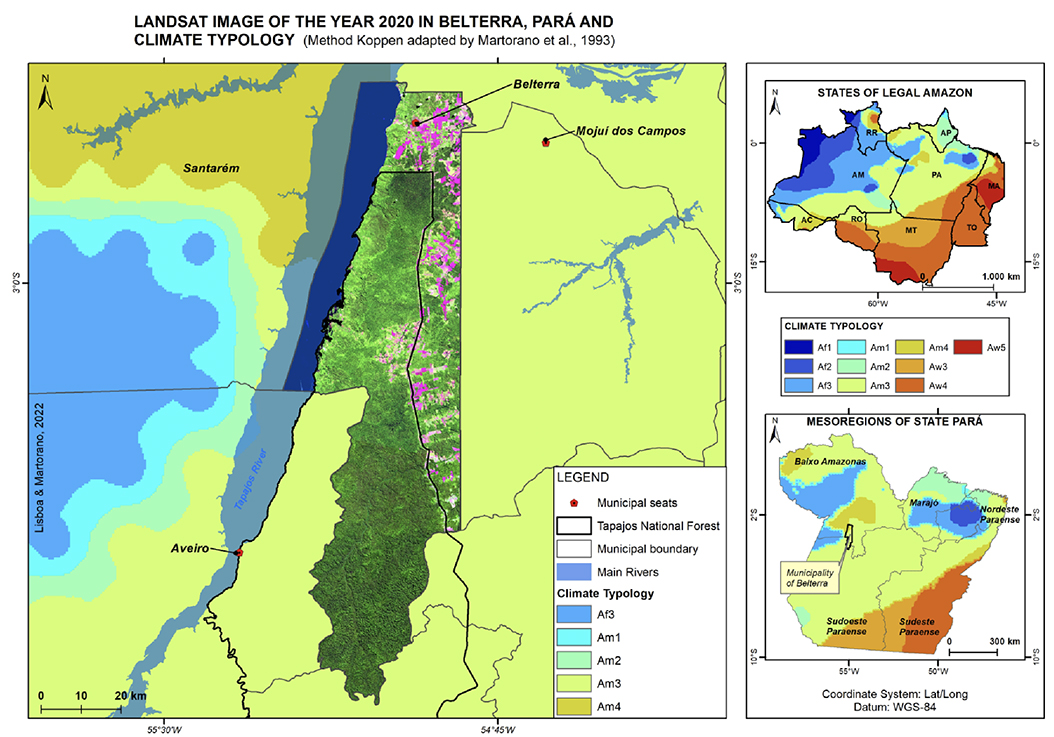
Figure 1. Grain center located in the municipality of Belterra, state of Pará, Brazil — Centre céréalier situé dans la municipalité de Belterra, État du Pará, Brésil.
6Belterra's climate is humid tropical with dry winter (Am), according to the Köppen classification (1948) (Alvares et al., 2014). According to Martorano et al. (1993), the climatic subtype of the municipality is Am3, with average annual rainfall varying between 2,000 mm and 2,500 mm.
7To carry out the analyses, meteorological and soybean production data were collected, comprising a historical series from 2006 to 2017. The response variables used in this analysis were: annual rainfall in millimeter (R), mean air temperature in degrees Celsius (T), soybean harvest area in hectare (HVA), soybean production in tons, considering the years with occurrence of El Niño (ELN) and La Niña (LAN). Meteorological data for the municipality of Belterra, Pará, were extracted from the BDMEP database, made available by the National Institute of Meteorology (INMET, 2022). Data on soybean production in Belterra were taken from the Brazilian Institute of Geography and Statistics (IBGE, 2022c) and data on the occurrence of El Niño and La Niña were obtained from the National Oceanic and Atmospheric Administration (NOAA, 2022). The following variables were also included in the analysis: real evapotranspiration in millimeter (ETR), water stress (WST) and water surplus in millimeter (WSP), obtained from the calculation of the water balance (BH) described next. Similar research using these variables to study the behavior of the crop in the field can be found in Xavier et al. (2016), Battisti & Sentelhas (2019), Reis et al. (2020) and Zhao et al. (2021).
2.2. Southern oscillation classification
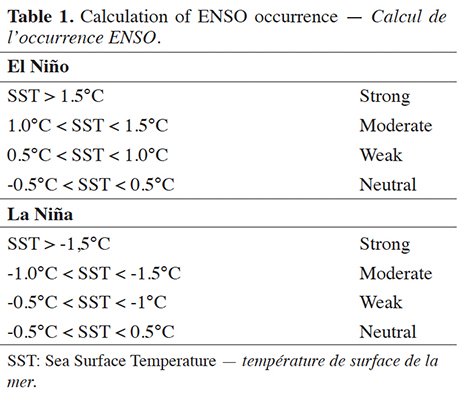
8The classification system presented by the National Oceanic and Atmospheric Administration (NOAA) was used to classify the ENSO phases. The NOAA system considers the anomaly of the Sea Surface Temperature of the Pacific Ocean in relation to normal (SSTA) in the region of El Niño 3.4 (5ºN-5ºS, 120º-170ºW). When the SSTA is equal to or greater than 0.5 °C for five consecutive 3-month averages it is classified as El Niño and when the SSTA is equal to or less than -0.5 °C for five consecutive 3-month averages it is classified as La Niña. A Neutral year is classified when SSTA remains between -0.5 and 0.5°C, according to table 1 (de Souza Nóia & Sentellas, 2019; NOAA, 2022).
2.3. Calculation of soil hydrological balance
9Considering that the water storage capacity of the root zone is the key factor that determines the impacts of drought in meeting the water demands of the plant, 100 mm of readily available water (RAW) was considered. Raw is the water that a plant can easily extract from the soil as a boundary condition for the crop (Weaver & Darland, 1949; de Albuquerque, 2010; Martorano et al., 2017). The estimates of water balance (WB) were done using the method of Thornthwaite & Mather (1955), following the assumptions described by Rolim et al. (1998).
2.4. Data analysis
10For data analysis, PCA (Principal Component Analysis) was used, with the objective of verifying the simultaneous relationship between variables of different natures, in addition to having the advantage of being able to reduce the dimensionality of the data, making the interpretation of the results simpler (Tourne et al., 2016). PCA using a Pearson correlation matrix was employed to avoid that the results were influenced by the magnitude of the units of the variables. PCA is a multivariate analysis technique that can explain the structure of variance and covariance of a set of variables through linear combinations (Principal Components) of these same variables. It has the objective of reducing the dimensionality of a set of variables and facilitating the interpretation of interdependence between them (Johnson & Wichern, 1998).
11For a vector of variables xT = (X1, X2,…, Xp) and a covariance matrix cov(x) = ∑(λ1, α1), (λ2, α2), … (λp, αp) the eigenvalues (λ1 ≥ λ2 ≥ … ≥ λp ≥ 0) and orthogonal standardized eigenvectors associated with ∑, the nth component is: Yi = αi1X1 + αi2X2 + … αipXp, where var (Yi) = λi, Cov (Yi, Yj) = 0 and αij measure the importance of the jth variable of the nth principal component.
12The biplot graph (Gabriel, 1971) represents the variables (physical or chemical) and individuals (observations) in a cartesian plane, and in order to construct this graph an approximation is sought (Y matrix) for the X matrix based on the decomposition of singular values. This way, the Y matrix can be factored into a product of matrices GH’, where the rows of the G matrix are marked by the observations (markers of the X rows) and the columns H’ represent the markers of the variables (markers of the X columns). Using these markers, it is possible to verify the position of an observation with respect to another, and the importance of each variable for each genotype. It is also possible to describe how the observations and the variables are grouped. Further details can be found in Gower & Hand (1996).
13The Biplot graph aids in the visualization of the results of the PCA analyses, wherein variables are represented and the years of the data series are used to verify relationships. It should be highlighted that the coordinates of the years and the variables are not constructed in the same space and that it is important to observe the direction of the variables and not their respective positions in the graph. In this sense, the years are placed on the same side of a variable that has a high value for a particular year, and in contrast, if the year is on the opposite side of a variable it has a low value for it.
14Data analysis was conducted in the R statistical package (R Core Team, 2019), using the FactoMineR (Lê et al., 2008) factoextra (Kassambara & Mundt, 2017) packages for analysis and graph construction.
3. Results
15During the time series considered in this study, there were moderate occurrences of ELN in 2006 and 2007 and strong occurrences in 2015 and 2016. In the years 2008, 2011 and 2017 there was a moderate occurrence of LAN (Figure 2). In these years, mainly 2011 and 2017, production was not harmed, but apparently it was favored. It can be seen that in the years of moderate occurrence of ELN, there was greater water stress and decreased soybean production. Production during the 2006-2017 period increased by 213.6%, going from 19,200 t to 41,016 t, and the harvested area increased by 170.9% increasing from 8,000 ha to 13,672 ha. The annual precipitation ranged from 1,301.5 mm to 2,435.7 mm and the average annual temperature between 26.0 °C and 26.8 °C.
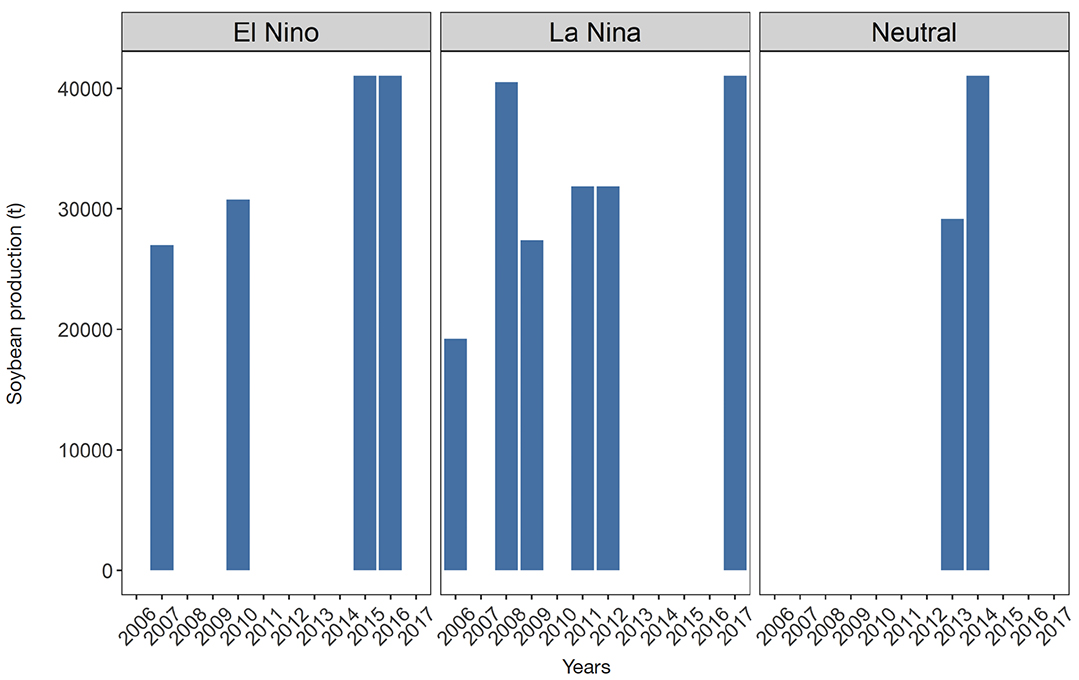
Figure 2. Soybean production during El Níño, La Niña and Neutral years in tons — Production de soja pendant les années El Níño, La Niña et neutres en tonnes.
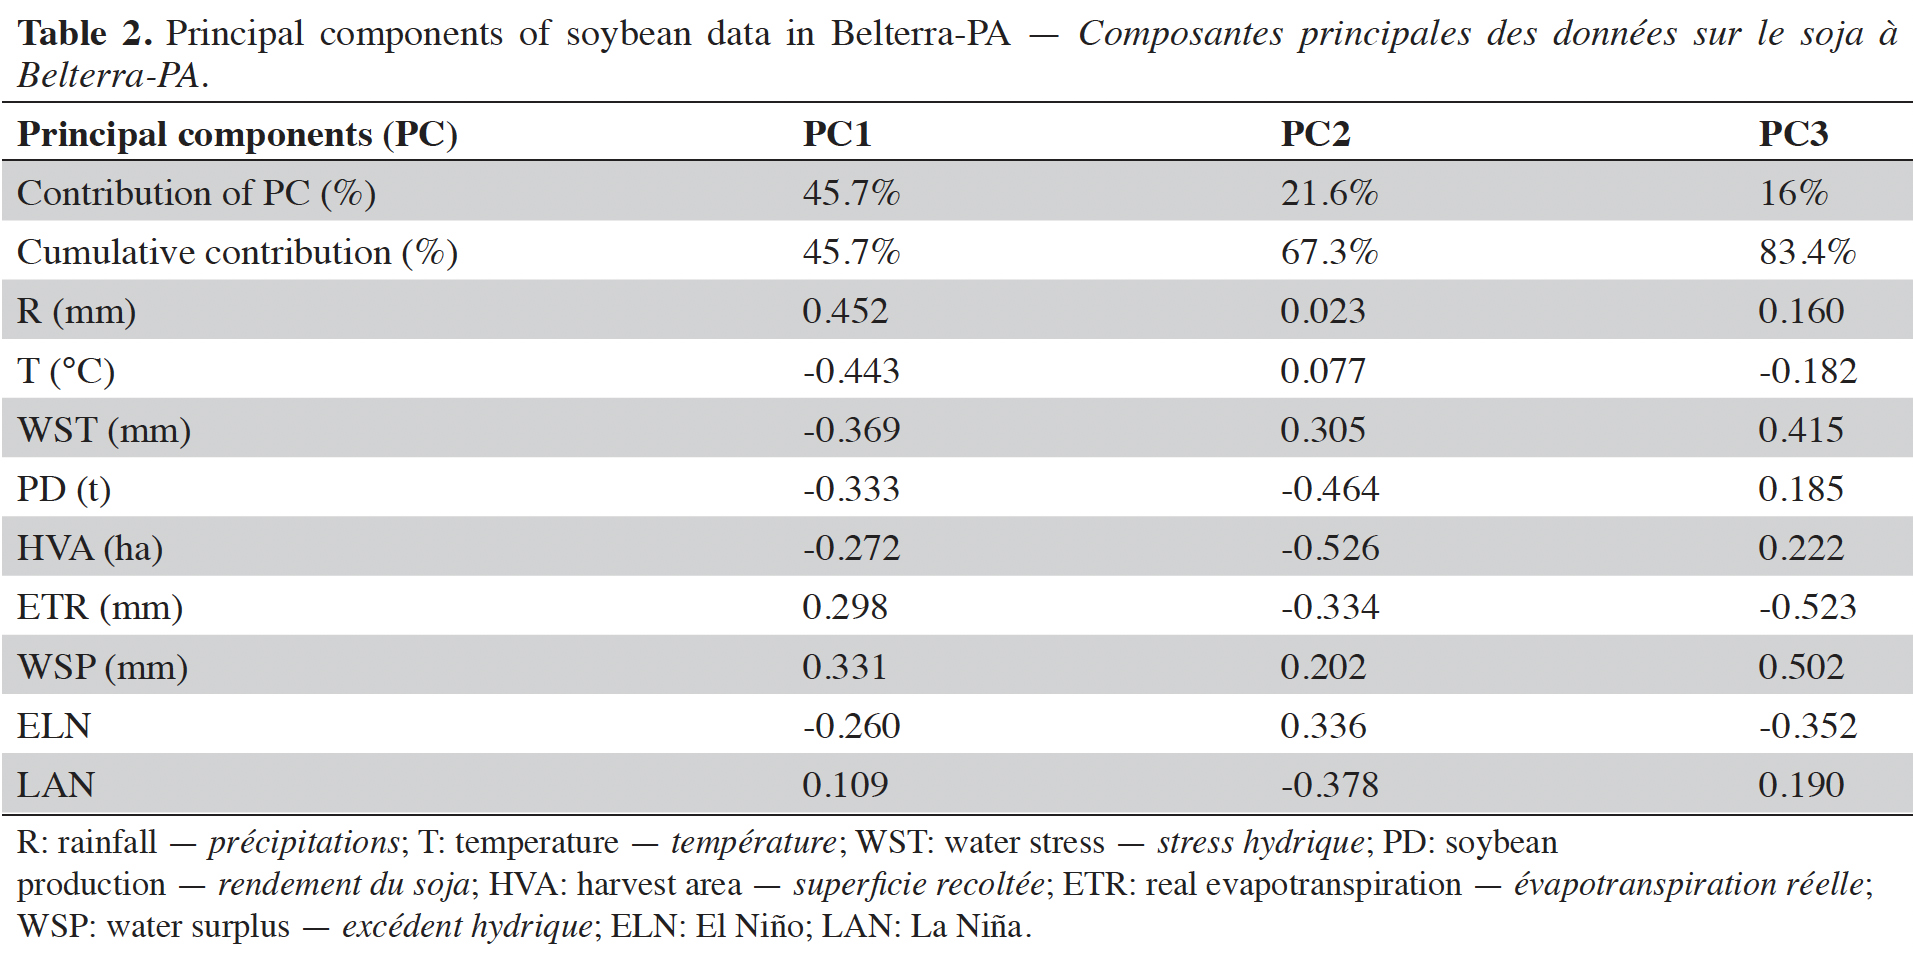
16The PCA results show that the first principal component concentrated 45.7% of the total variation of the dataset, the second had 21.6% and the third 16% for a total of 83.4% of the total variance across the three components. The variables that most contributed to variation in PC1 were R (0.452), T (-0,443) and WST (-0.369); in PC2 these were HVA (-0.526), PD (-0.464) and LAN (-0.378); in PC3 these were ETR (-0.523), WSP (0.502) and WST (0.415) (Table 2).
17Considering figure 3, the variables HVA and PD are strongly positively correlated with each other, considering the acute angle between them, and negatively correlated with R and WSP. ELN correlated positively with WST and T, but negatively with LAN, ETR and R.
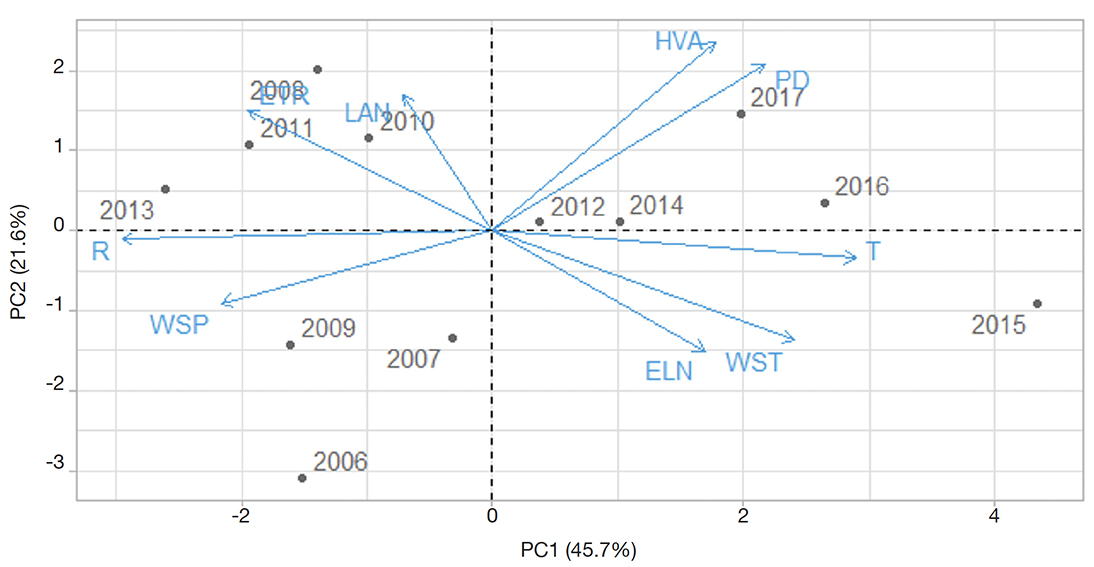
Figure 3. Biplot for Principal Component analysis PC1 and PC2 — Biplot pour l’analyse en composantes principales PC1 et PC2.
R, T, WST, PD, HVA, ETR, WSP, ELN, LAN: see table 2 — voir tableau 2.
18There is a positive correlation of LAN with HVA and PD, indicating a favoring of production due to the greater amount of precipitation in the region, provided it is provoked in a moderate way (Figure 4). When plotting component 1 with component 2, it can be seen that there is an apparent positive correlation between PD and WSP. But, as the variables form an angle of approximately 90º, it can be seen that the dynamics is close to 0. This demonstrates that the third component retained less information about the relationship between these two variables.
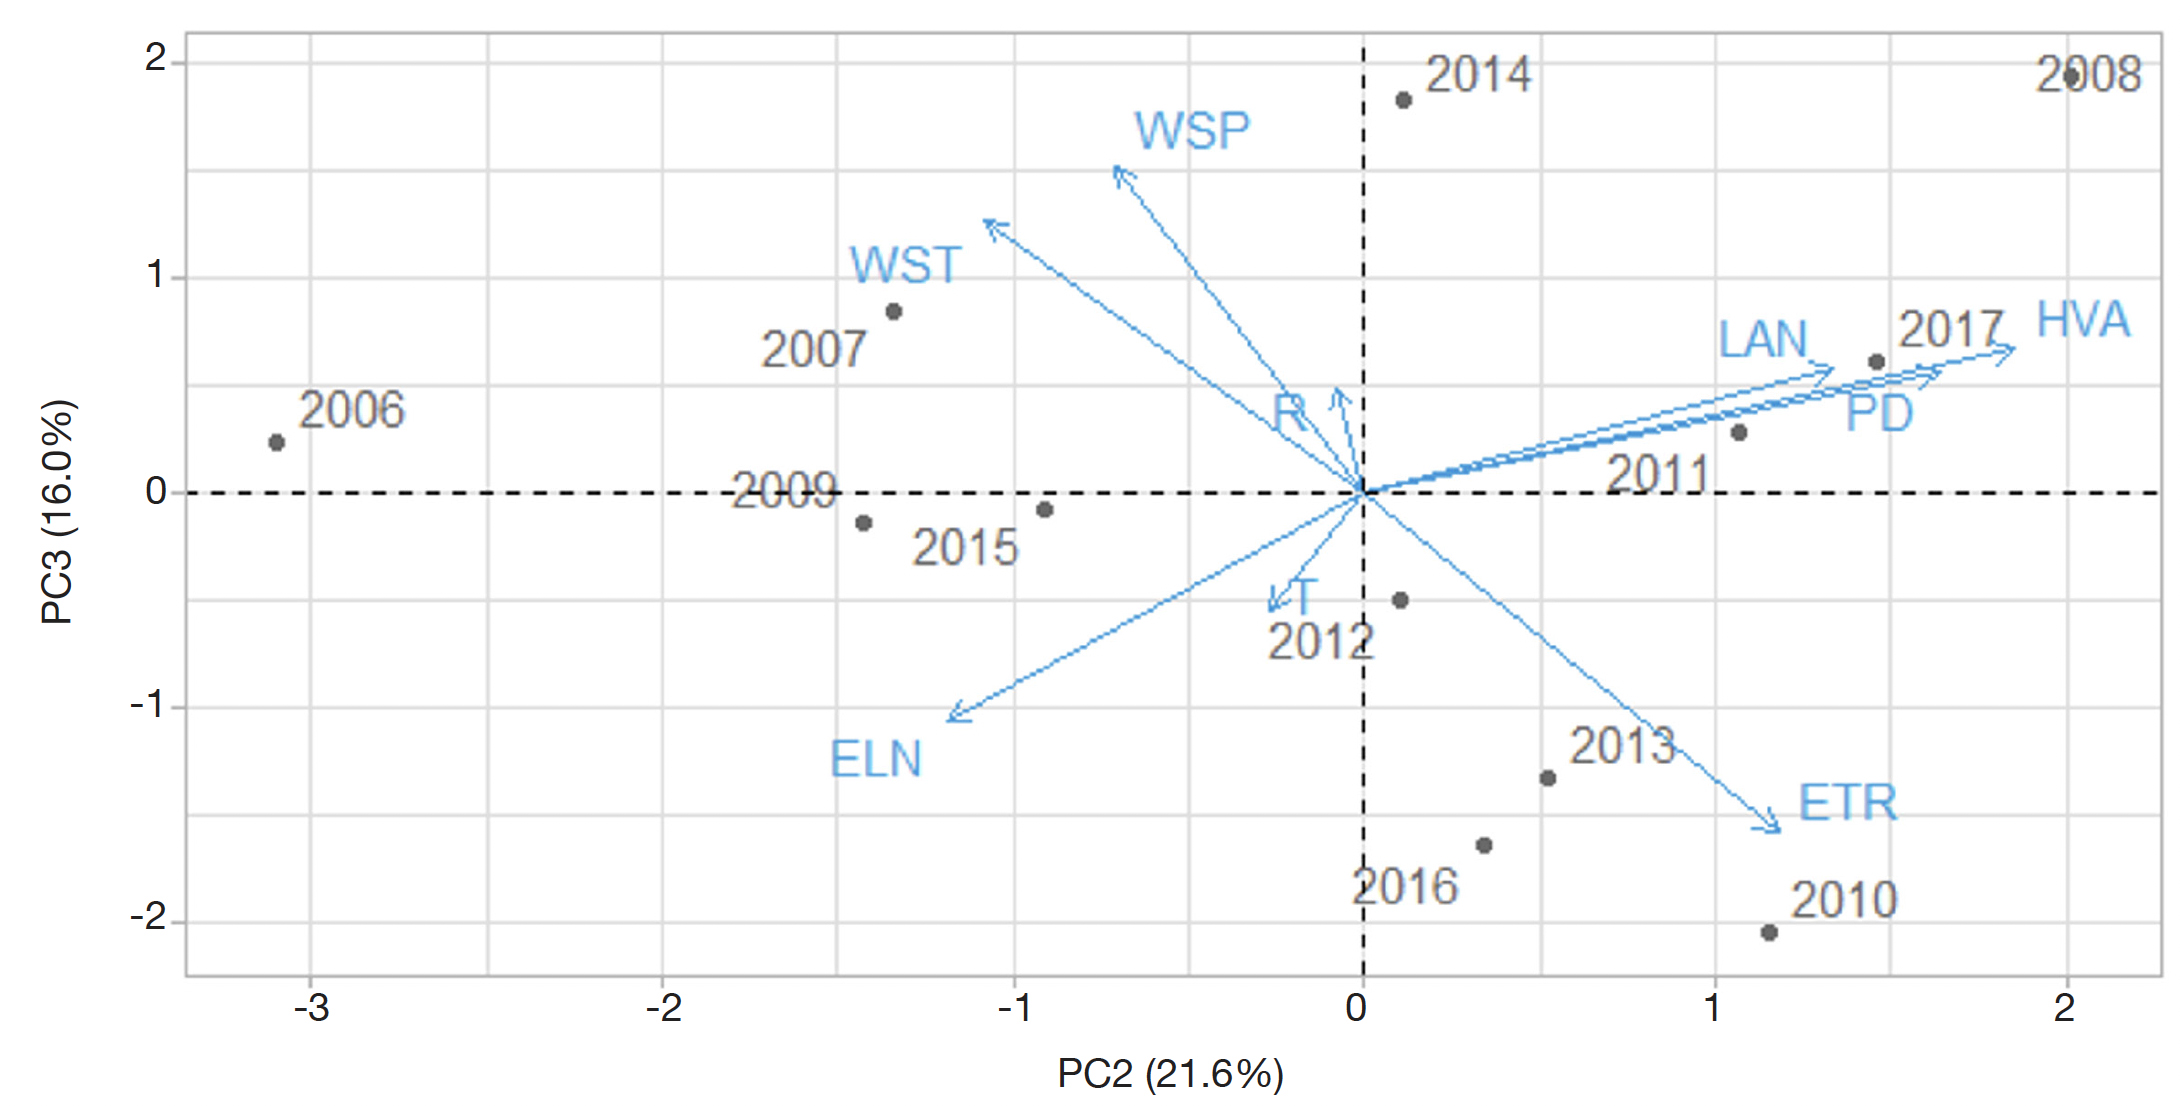
Figure 4. Biplot for Principal Component Analysis PC2 and PC3 — Biplot pour l’analyse en composantes principales PC2 et PC3.
R, T, WST, PD, HVA, ETR, WSP, ELN, LAN: see table 2 — voir tableau 2.
4. Discussion
19It is possible to verify how the culture is sensitive to climatic variations and that the ELN and LAN climatic events, if they occur in the period that the culture is in the field, can result in losses or increase in production, respectively, according to the intensity of its occurrence. Soybean is cultivated in the region in the first six months of each year, because the rains are concentrated mainly in this period. Therefore, the occurrence of water deficit is more common in the second semester. Thus, in this study, excess water is more important because it is the phenomenon that usually occurs when the crop is in the field (Barros & Pacheco, 2005).
20Precipitation was the variable that most contributed to the variation of PC1 and that it was negatively correlated with the PD and HVA variables. According Grzegozewski et al. (2017), in Brazil losses in soybean productivity are greater in regions with higher rainfall rates and temperatures and high incidence of solar irradiation, exactly the prevalent conditions in the west of the state of Pará during the months in which soybeans are cultivated. It should be highlighted that water is approximately 90% of the total weight of plants and participates in many biochemical processes, and therefore is of fundamental importance to the success of crop production, principally during the period of germination and seedling emergence and flowering and filling of grains. According to de Avila et al. (2013), water is a limiting factor in the initial phase of crop establishment because a seed needs to absorb at least 50% and at most 85% of its weight in water to assure good germination and uniformity in crop establishment.
21Air temperature is also an important meteorological aspect that controls crop production, including soybeans, because it has a strong influence on growth and development during plant phases and subsequent grain yield. Temperatures above 35 °C cause heat stress, retarding flowering and has harmful effect on pod set of soybeans (Liu et al., 2008). In this sense, as the average annual temperature varied around 26 ºC, this did not result in significant yield losses for the producer. However, in El Niño years and with the increase in air temperature, there may be a favoring of the occurrence of water deficit in the soil and consequent reduction of evapotranspiration rates of plants, which raises concern in relation to grain production in the region. The impacts of ENSO vary as a function of the phase of development of a plant, type of cultivation, seeding date, and location. El Niño events can negatively impact soybean productivity in the north of Brazil, and these impacts can be minimized through correctly choosing seeding periods (de Souza Nóia & Sentelhas, 2019).
22The positive relationship between rain and excess water emphasizes that excess during the grain filling phase can cause the loss of photoassimilates, which is of great importance for grain filling. These results show that, during La Niña years, there is greater precipitation in the Amazon region and, consequently, excess water in the soil, thus creating potential for significant losses in soybean production (Bortoluzzi et al., 2017).
23Extreme weather events are becoming increasingly frequent due to climate change affecting the productive performance of crops by influencing agricultural ecosystems and promoting the action of pests and the manifestation of diseases (Burdon & Zhan, 2020). Precipitation and higher temperatures, for example, can accelerate the life cycle of insects as plants reach the accumulated degree-day more quickly (Kocmánková et al., 2009), reinforcing the need for monitoring meteorological variables and their effects on crops. In this context, agronomic performance of a crop is influenced by variables that differ greatly in their characteristics, and therefore it is important to conduct analyses that take into consideration the simultaneous relationships between these different variables in order to verify the existence of significant interactions due to effects such as those of climate (Battisti & Sentelhas, 2019).
24The PCA was extremely useful because it allowed the simultaneous analysis of variables of different natures and their effects on the soybean crop, considering the study region, as well as providing a broad view of the relationship between the variables analyzed in this research. Furthermore, the use of PCA has potential to predict effects related to agricultural production as a function of a set of independent variables that are associated or that are covariates with the analyzed variables, such as occurred with the abiotic ones. These results demonstrate the importance of considering these agrometeorological variables in studies of productivity. For each annual harvest it is possible to analyze the effects of climatic variables to explain the magnitude of variation and its effects on production and productivity, as a function of the explanatory variables. The application of such results from the PCA can be extended to aid in analyses of agricultural credit and insurance and could also be used by agricultural companies in market analyses at a national level.
5. Conclusions
25The monitoring of climatic variables helps the producer in making decisions in the field.
26The strong or severe occurrence of La Niña negatively influences soybean production in the region of Belterra-PA, due to the high rainfall causing excess water in the soil, leading the plants to stress.
27The moderate occurrence of La Niña positively influences soybean production in the region by maintaining the water supply at adequate levels for the plants.
Bibliographie
Alvares C.A. et al., 2014. Köppens climate classification map for Brazil. Meteorol. Z., 22, 711-728.
Barros T.X. & Pacheco N.A., 2005. Freqüências de chuva no Estado do Pará no plano microrregional. Bol. Pesqui. Desenvolvimento, 50.
Battisti R. & Sentelhas P.C., 2019. Characterizing Brazilian soybean-growing regions by water deficit patterns. Field Crops Res., 240, 95-105, doi.org/10.1016/j.fcr.2019.06.007
Battisti R. et al., 2017. Assessment of soybean yield with altered water-related genetic improvement traits under climate change in Southern Brazil. Europa J. Agron., 83, 1-14, doi.org/10.1016/j.eja.2016.11.004
Bortoluzzi M.P. et al., 2017. Risk of water surplus in soybean crop on haplic planosol soil in the Central Depression of Rio Grande do Sul State, Brazil. Cienc. Rural, 47(2), doi.org/10.1590/0103-8478cr20160170
Burdon J.J. & Zhan J., 2020. Climate change and disease in plant communities. Plos Biol., 18(11), e3000949. https://doi.org/10.1371/journal.pbio.3000949
Costa D.C. et al., 2018. Dinâmica temporal da pegada hídrica por cultivar de soja em polo de grãos no oeste do Pará, Amazônia. Rev. Ambiente Água, 13, 1-10, doi.org/10.4136/ambi-agua.2051
da Rocha T.S.M. et al., 2017. Performance of soybean in hydromorphic and nonhydromorphic soil under irrigated or rainfed conditions. Pesqui. Agropecu. Bras., 52(5), 293-302, doi.org/10.1590/s0100-204x2017000500002
da Silva A.J. et al., 2018. Source-sink relationships in two soybean cultivars with indeterminate growth under water deficit. Bragantia, 77(1), 23-35, doi.org/10.1590/1678-4499.2017010
de Albuquerque P.E.P., 2010. Estratégias de manejo de irrigação: exemplos de cálculo. Circular técnica 136. Brasília: Embrapa.
de Avila A.M.H., Farias J.R.B., Pinto H.S. & Pilau F.G., 2013. Climatic restrictions for maximizing soybean yields. In: Board J.E. (ed.). A comprehensive survey of international soybean research - genetics, physiology, agronomy and nitrogen relationships. IntechOpen, doi.org/10.5772/52177
de Souza Nóia Jr R. & Sentelhas P.C., 2019. Soybean-maize off-season double crop system in Brazil as affected by El Niño Southern Oscillation phases. Agric. Syst., 173, 254-267, doi.org/10.1016/j.agsy.2019.03.012
de Souza Nóia Jr R. et al., 2020. Effects of the El Niño Southern Oscillation phenomenon and sowing dates on soybean yield and on the occurrence of extreme weather events in southern Brazil. Agric. For. Meteorol., 290, doi.org/10.1016/j.agrformet.2020.108038
do Nascimento Moura M., Vitorino M.I. & Adami M., 2018. Análise de componentes principais da precipitação pluvial associada à produtividade de soja na Amazônia legal. Rev. Bras. Climatol., 14(22), doi.org/10.5380/abclima.v22i0.55109
Gabriel K.R., 1971. The biplot graphic display of matrices with application to principal component analysis. Biometrika, 58(3), 453-467.
Gazzoni D.L. & Dall’agnol A., 2018. A saga da soja: de 1050 a.C. a 2050 d.C. Brasília: Embrapa.
Gower J.C. & Hand D.J., 1996. Biplots. London: Chapman and Hall.
Grzegozewski D.M., Uribe-Opazo M.A., Johann J.R. & Guedes L.P.C., 2017. Spatial correlation of soybean productivity, enhanced vegetation index (evi) and agrometeorological variables. J. Braz. Assoc. Agric. Eng., 37(3), 541-555, doi.org/10.1590/1809-4430-Eng.Agric.v37n3p541-555/2017
IBGE (Instituto Brasileiro de Geografia e Estatística), 2022a. Pesquisa agrícola municipal – PAM, https: //www.ibge.gov.br/estatisticas/economicas/agricultura-e-pecuaria/9117-producao-agricola-municipal-culturas-temporarias-e-permanentes.html?edicao=29008&t=resultados, (23/03/2022).
IBGE (Instituto Brasileiro de Geografia e Estatística), 2022b. Cidades e estados, https://www.ibge.gov.br/cidades-e-estados/pa/belterra.html, (23/03/2022).
IBGE (Instituto Brasileiro de Geografia e Estatística), 2022c. Pesquisa agrícola municipal – PAM, https://www.ibge.gov.br/estatisticas/economicas/agricultura-e-pecuaria/9117-producao-agricola-municipal-culturas-temporarias-e-permanentes.html?=&t=downloads, (23/03/2022).
INMET (Instituto Nacional de Meteorologia), 2022. Base de dados meteorológicos para ensino e pesquisa – BDMEP, http://www.inmet.gov.br/projetos/rede/pesquisa/, (23/03/2022).
Johnson R.A. & Wichern D.W., 1998. Applied multivariate statistical analysis. Madison, WI, USA: Prentice Hall International.
Kassambara A. & Mundt F., 2017. Factoextra: extract and visualize the results of multivariate data analyses. R package version 1.0.5., https://CRAN.R-project.org/package=factoextra, (1/5/2023).
Kocmánková E. et al., 2009. Impact of climate change on the occurrence and activity of harmful organisms. Plant Prot. Sci., 45(Special Is), 48-52.
Lê S., Josse J. & Husson F., 2008. FactoMineR: an r package for multivariate analysis. J. Stat. Software, 25(1), 1-18, doi.org/10.18637/jss.v025.i01
Liu X., Jian J., Wang W. & Herbert S.J., 2008. Soybean yield physiology and development of high-yielding practices in Northeast China. Field Crops Res., 105(3), 157-171, doi.org/10.1016/j.fcr.2007.09.003
Martorano L.G. et al., 1993. Tipologia climática do estado do Pará – Adaptação de Koppen. Bol. Geogr. Teorética, 23(25-26), 307-312.
Martorano L.G. et al., 2017. Climate conditions in the eastern Amazon: rainfall variability in Belem and indicative of soil water deficit. Afr. J. Agric. Res., 12(21), 1801-1810, doi.org/10.5897/AJAR2016.11801
Moura M.M. et al., 2019. Relation of El Niño and La Niña phenomena to precipitation, evapotranspiration and temperature in the Amazon basin. Sci.Total Environ., 651(1), 1639-1651, doi.org/10.1016/j.scitotenv.2018.09.242
NOAA (National Oceanic and Atmospheric Administration), 2022. Cold & warm episodes by season, https://origin.cpc.ncep.noaa.gov/products/analysis_monitoring/ensostuff/ONI_v5.php, (23/03/2022).
Oliveira Jr R.C. & Correa J.R.V., 2001. Aptidão agrícola dos solos do município de Belterra, estado do Pará. Documentos 91. Brasilia : EMBRAPA.
R Core Team., 2019. R: A language and environment for statistical computing. Vienna: R Foundation for Statistical Computing.
Reis L. et al., 2020. Influence of climate variability on soybean yield in Matopiba, Brazil. Atmosphere, 11, 1130, doi.org/10.3390/atmos11101130
Rolim G.S., Sentelhas P.C. & Barbieri V., 1998. Planilhas no ambiente ExcelTM para os cálculos de balanços hídricos: normal, sequencial de cultura e de produtividade real e potencial. Rev. Bras. Agrometeorol., 6(1), 133-137.
Thornthwaite C.W. & Mather J.R., 1955. The water balance. Centerton, AR, USA: Drexel Institute of Technology.
Tourne D.C.M. et al., 2016. Potential topoclimatic zones as support for forest plantation in the Amazon: advances and challenges to growing paricá (Schizolobium amazonicum). Environ. Dev., 18, 26-35, doi.org/10.1016/j.envdev.2015.11.002
Truckenbrodt W. & Kotschoubey B., 1981. Argila de Belterra – cobertura terciária das bauxitas amazônicas. Rev. Bras. Geociências, 11, 203-208.
Weaver J.E. & Darland R.W., 1949. Soil–root relationships of certain native grasses in various soil types. Ecol. Monogr., 19(4), 303-338.
Xavier A.C., King C.W. & Scanlon B.R., 2016. Daily gridded meteorological variables in Brazil (1980–2013). Int. J. Climatol., 36(2644-2659), doi.org/10.1002/joc.4518
Zhao J. et al., 2021. Modeling climatically suitable areas for soybean and their shifts across China. Agric. Syst., 192, 103205, doi.org/10.1016/j.agsy.2021.103205
