


- Accueil
- Volume 27 (2023)
- Numéro 3 : Colloque Agroforesterie en Afrique de l...
- Estimation of seasonal water use of Faidherbia albida (Delile) A.Chev. in a Sahelian agroforestry parkland


Visualisation(s): 1250 (8 ULiège)
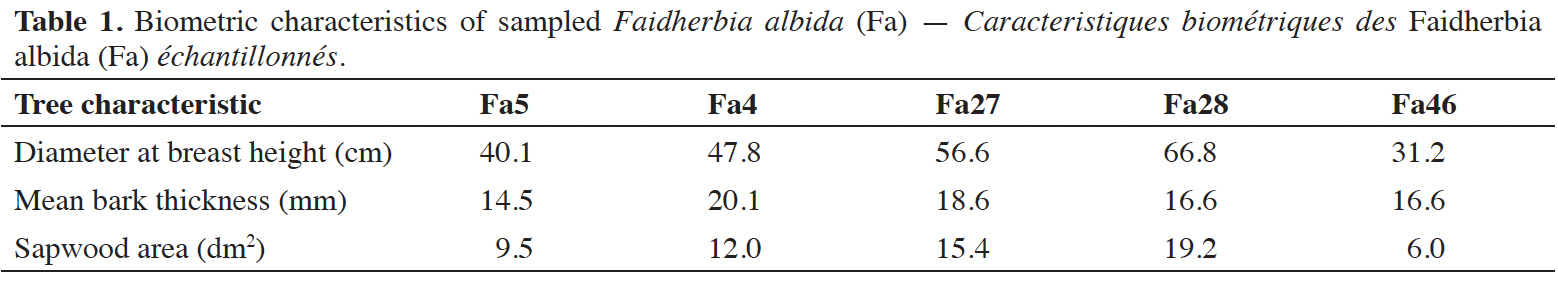
Téléchargement(s): 72 (0 ULiège)

Estimation of seasonal water use of Faidherbia albida (Delile) A.Chev. in a Sahelian agroforestry parkland

Document(s) associé(s)
Version PDF originaleRésumé
Utilisation saisonnière de l’eau par l’arbre Faidherbia albida (Delile) A.Chev. dans un parc agroforestier du Sahel
Description du sujet. Faidherbia albida est reconnue comme une espèce agroforestière prometteuse. Dans les systèmes agroforestiers, la dynamique de l'utilisation de l'eau par arbre (TWU) est une composante essentielle de son impact sur le rendement des cultures associées et sur le bilan hydrique. On sait peu de choses sur l'absorption d'eau du F. albida, alors qu'une estimation du bilan hydrique à l'échelle écosystémique est cruciale dans le contexte du changement climatique.
Objectifs. L’objectif de cette étude est d’évaluer l’utilisation de l’eau du F. albida pendant une année et déterminer l’implication de la taille de l’arbre, de la saison et de la phénologie.
Méthode. Cinq arbres matures ont été sélectionnés dans un parc agroforestier dans le bassin arachidier à côté du village de Niakhar, au Sénégal, pour y effectuer les mesures de flux de sève. Le flux total par arbre (Q) ou TWU a été calculé et l’enregistrement des paramètres climatiques, de la teneur en eau du sol et des différentes phases phénologiques effectué.
Résultats. Les résultats ont révélé une variabilité significative de TWU entre la saison des pluies et la saison sèche et les stades de feuillaisons. Les valeurs maximales d'utilisation de l'eau ont été observées dans la première partie de la saison sèche, entre décembre et janvier, lorsque les arbres sont en pleine feuillaison, avec une grande variabilité entre les arbres, allant de 118 à 261 l·arbre-1·jour-1. La variation de TWU était faible pendant la saison sèche, puis a atteint des valeurs minimales pendant la phase sans feuilles qui a lieu pendant la saison des pluies.
Conclusions. La consommation d'eau moyenne annuelle a été estimée à environ 40 000 l·arbre-1·an-1, soit 27 mm·arbre-1·an-1, ce qui représente 5,3 % des précipitations annuelles de 2019 (513 mm). La relation significative entre la consommation d'eau et les phases de feuillaison (R2 = 0,81) suscite la possibilité d'un modèle simple qui permettrait d'estimer l'utilisation de l'eau par les arbres.
Abstract
Description of the subject. Faidherbia albida is recognized as a promising agroforestry species. In agroforestry systems, tree water use (TWU) dynamics is a key component of its impacts on associated crop yield and the water balance. Little is known about F. albida water uptake while an estimation of the ecosystem water balance is crucial in the context of climate change.
Objectives. The aim of this study is to assess F. albida water use along a year and the implication of tree size, season and phenology.
Method. Five mature trees were selected in an agroforestry parkland in the groundnut basin near Niakhar village in Senegal to monitor sap flow. Tree water use (TWU) or (Q) was calculated and climate conditions, soil water content and leaf phenological phases were also continuously recorded.
Results. Results revealed a significant TWU variability between rainy and dry seasons and between leaf phenological stages. The maximal water use values were observed in the first part of the dry season between December and January, when the trees are in full leaf, with large between-tree variability, from 118 to 261 l·tree-1·d-1. The TWU slowly decreased during the dry season and reached minimal values during the leafless phase which takes place during the rainy season.
Conclusions. The average annual water use was estimated at about 40,000 l·tree-1·year-1, i.e. 27 mm·tree-1·year-1, which represents 5.3% of 2019 annual rainfall (513 mm). The significant relationship of TWU with leaf phenological phases (R2 = 0.81) supports the possibility that a simple model can estimate the tree water use.
Table des matières
Received 3 May 2023, accepted 6 December 2023, available online 13 December 2023.
This article is distributed under the terms and conditions of the CC-BY License (http://creativecommons.org/licenses/by/4.0)
1. Introduction
1Faidherbia albida (Delile) A Chev. is a multipurpose tree in Sub-Saharan Africa providing many ecosystem services to rural populations (Hirai, 2017; Ereso, 2019; Sileshi et al., 2020; Lu et al., 2022). Faidherbia albida is a leguminous tree that belongs to the Fabaceae family and Mimosoidea sub-family (Santiago & Lambert, 2010). Faidherbia albida is leafless during the rainy season, which reduces competition with associated rainfed crops for water, nutrients and light in West African agroforestry parklands. Because it improves soil fertility (“fertility island” effect), it also substantially increases associated crop yield under its canopy (Louppe, 1990; Bayala et al., 2012; Sida et al., 2018; Roupsard et al., 2020; Clermont-Dauphin et al., 2023). Accordingly, tree density in F. albida parklands is an important determinant of associated crop production. However, estimation of the optimal density of trees requires understanding the patterns of the water flows, and specially the vegetation water use component. Unlike most of the other agroforestry trees species, F. albida is considered as a phreatophyte species that only uses a little amount of annual rainfall. Roupsard et al. (1999) estimated tree water use of a F. albida parkland cover in a Sudanese agroforestry parkland at about 4% of the total annual rainfall. This particular advantage in the Sudanese savanna may be different under drier areas within different local climate conditions and tree density.
2In Sub-Saharan agroforestry systems, long term studies on tree water use dynamics are still scarce (Roupsard et al., 1999; Do et al., 2008). Especially, little is known about seasonal F. albida water use in Sahelian areas. As climate change impacts local precipitation patterns and water resources, complex water use strategies may be at play, especially for phreatophyte plant species. Intergovernmental panel on climate change (IPCC, 2021) expects deep changes in plant phenological cycles, with increase in photosynthesis, air vapor pressure deficit, and plant transpiration in Sub-Saharan tropical forests (Massmann et al., 2019; Adeyemi et al., 2020). In the Senegalese Sahel not only drier climate conditions but also soil salinization may be combined to affect F. albida water use (Faye et al., 2020). To optimize the management of F. albida, it is therefore important to better understand how this species responds to its local environmental conditions. Moreover, understanding F. albida contributions to the evapotranspiration component of the hydrologic cycle in agroforestry systems is crucial to optimize current and future management strategies of these systems according to current and future changes in soil water availability.
3Several approaches are used to evaluate tree water use (Granier, 1985; Do et al., 2011). In this study, we used the xylem sap flow measurements to evaluate F. albida water use because it is an indicator of plant water use. It is a light-intrusive method that has been applied in many ecosystems and particularly in semi-arid woody species (Roupsard et al., 1999; Compaoré, 2006; Bayala et al., 2008; Do et al., 2008; Van den Bilcke et al., 2013; Awessou et al., 2017). We aim at quantifying F. albida water use during the rainy and the dry seasons in a F. albida agroforestry parkland in the Senegalese Sahel. Specifically, leaf phenology, tree transpiration dynamics, and their contribution to the water balance are investigated.
2. Materials and methods
2.1. Study site
4This study was conducted from April 2019 to December 2020 in the intensive measurement “Faidherbia flux” site (Lat. N: 14°29'44.916" Long. W: 16°27'12.851") equipped with a 30 m tower for micro-meteorological sensors and the estimation of the Eddy covariance fluxes. The site is located in a 15 ha agro-silvo-pastoral F. albida parkland in the Peanut Basin at Sob village near Niakhar, in the West central ecoregion of Senegal (Tappan et al., 2004). The climate is semi-arid and Sudano-Sahelian in a sandy ferruginous tropical soil type (Tappan et al., 2004). Air temperatures average 29.8 °C and annual precipitation is about 600 mm with substantial inter annual variations ranging between 400 and 800 mm since 1960s (Lalou et al., 2019; Faye et al., 2020). Rainy season lasts four months between June and September. The study area is located less than 20 m above the sea level. Tree canopy is dominated by F. albida with a density of 6.8 tree·ha-1 (Lericollais,1972; Roupsard et al., 2020). For decades, it has been the object of permanent agro-silvo-pastoral practices to feed the high densities of the Serer population (50 to 70 inhabitants·km-² in 1950 and around 300 today) (Pélissier, 1966; ANSD, 2023).
2.2. Plant material and device
5We sampled five adults F. albida of representative sizes ranging between 31 and 66 cm of diameter at breast height (Table 1) on which sap flow was monitored.
6The transient thermal dissipation (TTD) method with single probe was applied with a cyclical heating of 10 min or 600 s every 30 min (Do et al., 2011; Nhean et al., 2019).
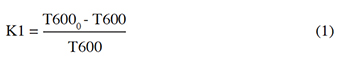
7The interpolation of temperatures before heating provides the baseline temperature. The temperature signal is the temperature increase after 600 s (T600). We assumed that the flux was reaching zero value each night and thus corresponds to the maximal temperature (T6000) recorded in the night. The thermal index related to sap flux density (K1) is calculated using the following formula:
8Single Granier needles with standard tip of 20 mm were used (UP Germany, Ibbenbüren) with a heating power of 200 mW. We applied the multispecies linear calibration provided by Isarangkool Na Ayutthaya et al. (2010):
9SFD = 12.95 × K1 (2)
10(n = 276, R2 =0.88, RRMSE = 24.1%)
11where SFD is the sap flux density expressed in Ldm-2·h-1. Probes were inserted into the sapwood at breast height. Trunk observations and preliminary coring showed in the area a xylem depth around 12 cm whatever the trunk diameter with an empty or decaying wood heart. The xylem was divided into four bands of 3 cm width. Four to six probes, according to tree diameter, were inserted at different azimuths (east, west, north, south) in the outer band where the sap flux densities are usually the highest (Figure 1). The radial profile of sap flux density was assessed on the North azimuth with three additional probes located in the middle of each band of the inner xylem. The outer value was taken as reference and the radial profiles provided decreasing coefficients which were applied to the average outer SFD to calculate a weighted SFD. An aluminum foil collar was placed around the probe’s installation section of the stem to avoid direct solar radiation.
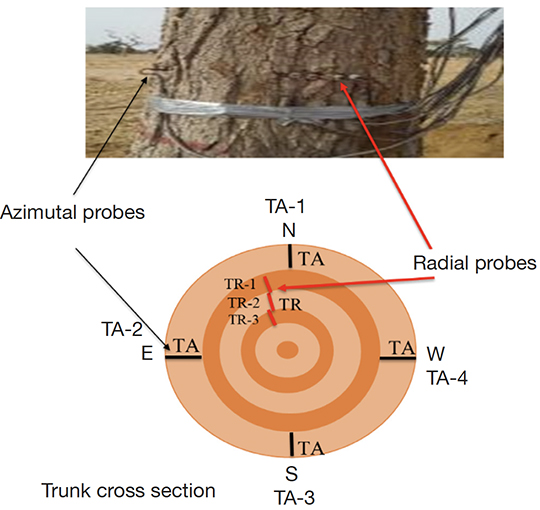
Figure 1. Sapflowmeter set up in trunks at breast height of the five Faidherbia albida trees (E: east, S: south, O: west, N: north, TA: azimutal probes, TR: radial probes) — Installation de l’appareil du flux de sève à hauteur de poitrine des troncs des cinq arbres de Faidherbia albida (E : est, O : ouest, N : nord, S : sud, TA : sondes azimutales, TR : sondes radiales).
2.3. Phenology monitoring
12Leaf phenology was assessed according to Grouzis & Sicot (1980): visual observations were made every 10 days even during the rainy season, when F. albida loses its leaves completely. These following stages were considered:
130. leafless;
141. leaf buds opening;
152. start of leaf expansion on 10-50% of branches;
163. leaves fully expanded on more than 50% of branches;
174. start of leaf senescence as indicated by color change on less than 50% of branches;
185. all leaves senescent or fallen on more than 50% of branches.
19Each of these phenological stages was converted in percentages that is estimated visually for each tree and then averaged.
2.4. Soil water content monitoring
20The volumetric soil water content was measured at 15, 35, 55, 75, 95, 115, 135, 155, 175 and 195 cm using automated Time Domain Reflectometers (TDR, type CS616, Campbell, USA, Logan), which were installed horizontally and calibrated with gravimetric water content and bulk density data.
21The devices were connected to a CR1000 data logger (Campbell Sc, USA, Logan). The measurements were automatically recorded every 30 min. The soil water storage expressed in mm is obtained from the following expression:
22R = Hv × Z (3)
23where Hv is the volume humidity of the soil (%) and Z, the soil depth (dm).
2.5. Calculation of transpiration
24The water use per tree (Q) was calculated by multiplying the weighted SFD by the sapwood area. The values were averaged between trees to yield a mean flow for an “average” tree. Such a flow is assumed equal to water use or transpiration by neglecting change in water storage. Hourly sap flows were cumulated over 24 h to calculate daily transpiration in Lday-1. To obtain convert in mm, the later value was divided by the average soil area per tree, estimated with the density of 6.8 trees·ha-1.
2.6. Data recording and analyses
25Meteorological data (relative humidity, photosynthetic active radiation [PAR], rainfall) were automatically measured and recorded every 30 min by the Eddy Flux Tower at 20 and 2 m heights. The vapor pressure deficit, VPD (KPa), is the difference between saturation vapor pressure (es) and partial vapor pressure (e) VPD (kpa) = es (kpa) - e (kpa) computed from air temperature T (°C) and relative humidity RH (%). Statistical analyses were performed using JMP Pro software, version 13.0. and homogeneity of the variances was tested with the Shapiro-Wilk normality and Bartlett test, respectively. If significant differences of analysis of variance were demonstrated, multiple comparisons were performed, using a Tukey Honestly Significant Difference (HSD) approach.
3. Results
3.1. External and radial profile of sap flux density
26During full leaf foliage in April 2019, the average external sap flux density reached 2 Ldm-2·h-1 for tree Fa27 and Fa28 and 1 Ldm-2·h-1 for tree Fa5 and Fa46. Between 12th and 15th April, the dynamics was the same between trees (Figure 2a). The SFD diurnal dynamics, both axial and radial, follow the PAR dynamics (Figure 2b). The analyses of variance showed significant differences of external sap flux density and radial profile between trees (p < 0.05).
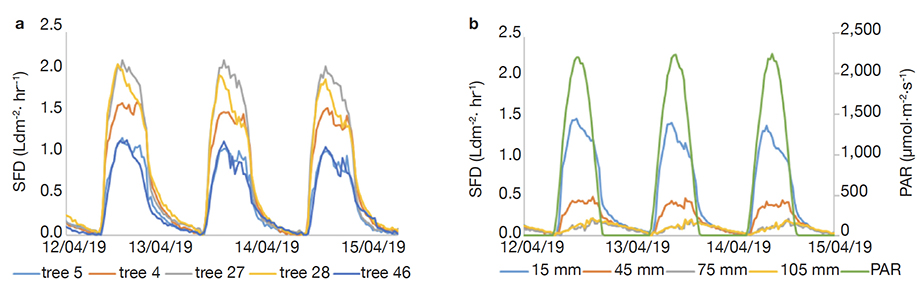
Figure 2. Patterns of sap flux density in the five sampled trees: a. averages per tree at the outest xylem location, b. total averages according location in the xylem radial profile (i.e. Figure 1) and Photosynthetic Active Radiation — Cinétique horaire de la densité du flux de sève chez les arbres échantillonnés : a. moyennes par individu dans le xylème externe, b. moyenne totale selon la position dans le profil radial dans la profondeur du xylème (cf. Figure 1) et rayonnement photosynthétique actif.
3.2. Seasonal variation of sap flux density, leaf phenology and meteorological conditions
27All measurements started on April 2019 till December 2020, but leaf foliage assessment ended on June 2020. Rainfall in 2019 was late as for the two previous years, and scarce in the beginning before being more regular in late August. The total annual rainfall was 513 mm in 2019 and 599 mm in 2020. The soil water stock in the 2 m profile increased during the rainy seasons and reached higher values during September within the highest value in 2020 which lasted longer than in 2019. In contrast, the VPD, sap flux density, and leaf foliage increased during dry seasons and reached the lowest values in rainy seasons (Figure 3).
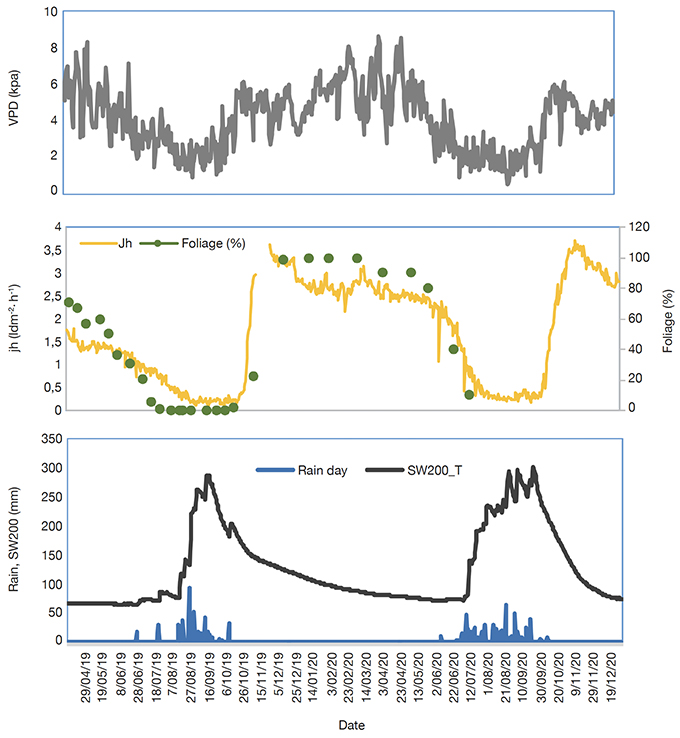
Figure 3. Seasonal variation of meteorological conditions (rainfall, vapor pressure deficit [VPD], soil water content at 200 cm depth [SW200]) and Faidherbia albida leaf foliage (%) and daily max sap flux density (Jh) in an agroforestry parkland in Senegal. Leaf phenology is average of leafing stage across the five trees — Variabilité saisonnière des conditions météorologiques (pluie, déficit de pression de vapeur [VPD] de la teneur en eau du sol à une profondeur de 200 cm [SW200]), du stade de feuillaison de Faidherbia albida (%) et de la densité maximale de flux de sève (Jh) dans un parc agroforestier au Sénégal. Le stade phénologique est la moyenne entre les cinq arbres.
3.3. Correlation between tree water use and canopy leafing
28Tree water use (Q) variation significantly (p < 0.05) depends on the stage of leaf foliation (Figure 4). The correlation coefficient is 81%.
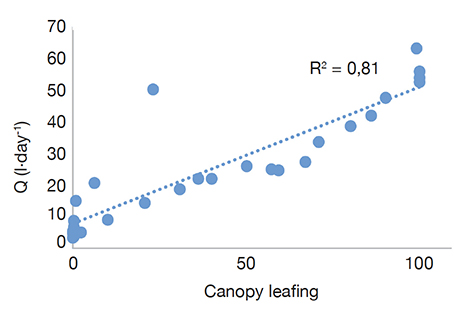
Figure 4. Tree water use (Q) versus canopy leafing (%) on average values between April 2019 and June 2020 2019 — Utilisation de l’eau par arbre (Q) versus feuillaison (%) sur les valeurs moyennes d’avril 2019 à juin 2020.
3.4. Seasonal variation of tree water use between trees
29The tree water use (Q) showed a clear seasonality and variation between trees (Figure 5). Tree water use follows the same trend for all trees as the mean average (Qd_mean). For all trees, higher Qd values are noticed at early dry season mid-November (100-300 l·day-1) with a quick increase then a slow decrease during the dry season. Faidherbia albida Fa5 and Fa46 maintained water use lower than the mean average (Qd_mean) particularly during dry season both in 2019 and 2020. In contrast, Q was higher than the mean average for trees Fa4, Fa27 and Fa28. During the wet season, August to October 2019 and July-August 2020, Q was very low, close to zero.
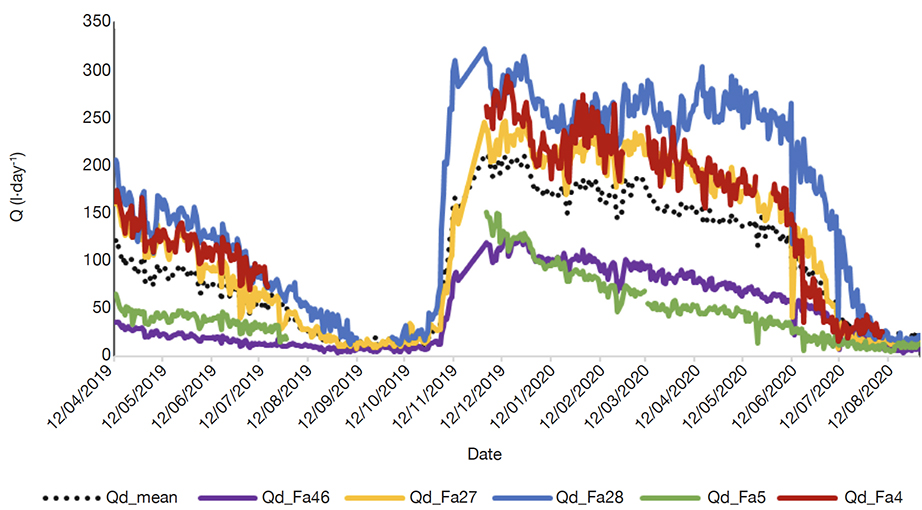
Figure 5. Tree water use (Q) variability by tree. Qd: daily tree water use, Qd_mean: daily mean average tree water use, Fa: Faidherbia albida. Between August and December 2019 no sap flow was measured for Fa4 and Fa5 — Variabilité du flux total de l’eau (Q) par arbre. Qd : utilisation journalière de l’eau par arbre, Qd_mean : utilisation moyenne journalière de l’eau par arbre, Fa : Faidherbia albida. Entre aout et décembre 2019, pas de mesure effectuée pour les arbres Fa4 et Fa5.
4. Discussion
30We observed in this study large seasonal F. albida water use which strongly changes according to season, leaf phenology and VPD as previously revealed by Roupsard et al. (1999). Thanks to the monitoring of water use throughout the year, we measured that values rose from 7 l in September to 212 l in December and January. When trees completely dropped leaves, from July to September 2019, corresponding to the growing season for crops, the sap flow density was at the lowest value, but was not nil. This residual sap flow was likely due to bark transpiration as recently revealed in other deciduous tree species (Anogeissus acuminata, Dipterocarpus tuberculatus and Tectona grandis) (Zafar & Kun-Fang, 2022). However, this has to be confirmed in the future in F. albida.
31Furthermore, F. albida water use on average (7 l·day-1) appears to be very small when compared to other dryland agroforestry trees such as Vitellaria paradoxa (26.8 l·day-1) and Acacia tortilis subsp. raddiana (50 l·day-1). Our results confirm Roupsard et al. (1999) ones. Thanks to its reverse phenology (leafing in dry season) compared to most of other agroforestry species, F. albida minimizes competition for water with associated crops. This contrast in terms of water use confirms F. albida advantage in dryland ecosystems.
32The maximum sap flow density reaches on average ca 3.6 l·dm-2·h-1, higher than in Sudanian (wetter) climate conditions (ca 2.5 l·dm-2·h-1) for the same species (Roupsard et al., 1999) and much higher than other agroforestry trees species V. paradoxa (1.68 l·dm-2·h-1) and Acacia tortilis (1.17 l·dm-2·h-1) (Do et al., 2008; Awessou et al., 2017). The highest daily water use, 212 l on average, despite drier upper-soil conditions, is explained by higher atmospheric demand (VPD) in dry season combined with access to groundwater by F. albida (Roupsard et al., 1999).
33However, despite strong relationship between water use and tree, observed by Awessou et al. (2017) on V. paradoxa and recently in a forest species Populus tomentosa by Zafar & Kun-Fang (2022) on fully irrigated tree species, the relationship between sap flow density and tree size in our study was not significant. But, as the sampling size was low (5), increasing tree sampling in future studies may give insight on whether or not tree size affects F. albida water use. Finally, the monitoring throughout the year allowed us to measure that F. albida annual water consumption reached on average 40,000 l·tree-1 in 2019/2020, i.e. 27 mm according to the density of 6.8 trees·ha-1. This value represented 5.3% of 2019 annual rainfall (513 mm) in our study site. It is close to the one reported by Roupsard et al. (1999) of about 4% (39 mm) of total rainfall amount, but with a tree density (23.9 tree·ha-1) and annual rainfall (992 mm) which is higher than in our current study (6.8 tree·ha-1). Hence, it seems important to take into account a possible trade-off between tree density, climate conditions, and F. albida water use. Therefore, more ecophysiological research is needed to depict the determinant factors in F. albida water use. The low tree water consumption during the associated crop growing season, the species significant nitrogen fertilizing effect that increases associated crop yield that was observed by previous authors (Louppe, 1990; Rhoades, 1995; Mai Moussa et al., 1999; Yengwe et al., 2018; Roupsard, 2020; Faye, 2022; Clermont-Dauphin et al., 2023) suggest that F. albida density can be increased and that an increase in crop yield can be expected as a consequence until a threshold to be determined. Moreover, tree density variation changes water infiltration rate (Koala et al., 2021). It is possible that F. albida impacts the water cycle as tree transpiration and the water table recharge are in the same order of magnitude. Actually, tree water use only represents 5% of rainfall amount, but the direct water table recharge is also estimated at around 5% (data not shown). Therefore, tree water use may have an important impact on the recharge pathway. However, the main water table recharge pathway is supposed to be via the temporary watershed ponds because they alone could, through lateral transfer, be responsible of rapid water table recharge after the rainy season. These give insights to fostering the desired balance between tree density and productivity in F. albida parklands in the future.
5. Conclusions
34Unlike other agroforestry trees, F. albida uses less water during cropping season. This study revealed that F. albida annual water consumption was about 40,000 l·tree-1 in 2019/2020 and only represented 5.3% of annual rainfall in the study site. This finding could lead to recommendations in terms of optimal tree density in agroforestry parklands. A strong relationship between total flow and phenology was found which implies leaf phenology as an important factor for this species transpiration in an agroforestry parkland. However, to accurately predict F. albida water use, it is crucial to further explore relationships between water use and tree size while considering a larger sampling size.
Acknowledgements
35This work was supported by the UE Eranet LEAP Agri-215 project Roles of Agroforestry in sustainable intensification of small farMs and food SEcurity for SocIetIes in West Africa (RAMSES II), https://www.ramsesiiagroforesterie.com/
Bibliographie
Adeyemi T.O.A., Agboje I., Osazuwa D.K. & Oripelaye O.S., 2020. Climate change impact on tropical forest ecosystem and biodiversity: the case of Sub-Saharan Africa. J. Agric. Environ. Resour. Manage., 4(1), 145-154.
ANSD (Agence Nationale de la Statistique et de la Démographie), 2023. Rapport préliminaire. Recensement général de la population et de l’habitat (rgph-5). Dakar : ANSD, 11-22.
Awessou K.G.B. et al., 2017. Differences in transpiration between a forest and an agroforestry tree species in the Sudanian belt. Agrofor. Syst., 91(3), 403-413, doi.org/10.1007/s10457-016-9937-8
Bayala J., Heng L.K., van Noordwijkc M. & Ouedraogo S.J., 2008. Hydraulic redistribution study in two native tree species of agroforestry parklands of West African dry savanna. Acta Oecol., 34, 370-378.
Bayala J. et al., 2012. Cereal yield response to conservation agriculture practices in drylands of West Africa: a quantitative synthesis. J. Arid Environ., 78, 13-25, doi.org/10.1016/j.jaridenv.2011.10.011
Clermont-Dauphin C. et al., 2023. Faidherbia albida trees form a natural buffer against millet water stress in agroforestry parklands in Senegal. Biotechnol. Agron. Soc. Environ., 27(3), Colloque Agroforesterie en Afrique de l’Ouest, 182-195, doi.org/10.25518/1780-4507.20477
Compaore H., 2006. The impact of savannah vegetation on the spatial and temporal variation of the actual evapotranspiration in the Volta Basin, Navrongo, Upper East Ghana. Göttingen, Germany: Cuvillier Verlag.
Do F.C. et al., 2008. Stable annual pattern of water use by Acacia tortilis in Sahelian Africa. Tree Physiol., 28(1), 95-104, doi.org/10.1093/treephys/28.1.95
Do F.C, Isarangkool Na Ayutthaya S. & Rocheteau A., 2011. Transient thermal dissipation method for xylem sap flow measurement: implementation with a single probe. Tree Physiol., 31(4), 369-380, doi.org/10.1093/treephys/tpr020
Ereso T., 2019. The role of Faidherbia albida tree species in parkland agroforestry and its management in Ethiopia. J. Hortic. For., 11(3), 42-47, doi.org/10.5897/jhf2018.0570
Faye W. et al., 2020. Climatic variability in the Sine-Saloum basin and its impacts on water resources: case of the Sob and Diohine watersheds in the region of Niakhar. Proc. Int. Assoc. Hydrol. Sci., 383, 391-399, doi.org/10.5194/piahs-383-391-2020
Faye W., 2022. Écohydrologie du bassin arachidier (cas de Niakhar) : dynamique de l’infiltration et modélisation hydrologique des aquifères superficiels dans un espace sylvopastoral semi-aride. Thèse de doctorat : Université Cheikh Anta Diop de Dakar (Sénégal).
Granier A., 1985. Une nouvelle méthode pour la mesure du flux de sève dans le tronc des arbres. Ann. Sci. For., 42(2), 193-200, doi.org/10.1051/forest:19850204
Grouzis M. & Sicot M., 1980. A method for the phenological study of browse populations in the Sahel: the influence of some ecological factors. In: Le Houerou H.N., ed. Browse in Africa - the current state of knowledge. Addis-Abeba: ILCA, 233-240.
Hirai M., 2017. Changes and local adjustment in the Faidherbia albida use as fodder and fuelwood among the Sereer, Senegal. Afr. Study Monogr., 38(1), 27-49.
IPCC, 2021. Summary for policymakers. In: Masson-Delmotte V. et al., eds. Climate change 2021: the physical science basis. Contribution of Working Group I to the sixth assessment report of the Intergovernmental Panel on Climate Change. Cambridge, UK; New York, NY, USA: Cambridge University Press, 3-32, doi:10.1017/9781009157896.001
Isarangkool Na Ayutthaya S. et al., 2010. Transient thermal dissipation method of xylem sap flow measurement: multi-species calibration and field evaluation. Tree Physiol., 30(1), 139-148, doi.org/10.1093/treephys/tpp092
Koala J., Raymond K. & Yelemou B., 2021. Influence of trees densities in water infiltration improvement in agroforestry parkland in Burkina Faso. Int. J. Agric. Environ. Res., 7(2), 332-343, doi.org/10.51193/IJAER.2021.7209
Lalou R., Sultan B., Muller B. & Ndonky A., 2019. Does climate opportunity facilitate smallholder farmers’ adaptive capacity in the Sahel? Palgrave Commun., 5(1), 1-11, doi.org/10.1057/s41599-019-0288-8
Lericollais A., 1972. Sob: étude géographique d'un terroir Sérèr. Paris ; La Haye : Mouton & Co.
Louppe D., 1990. Influence du Faidherbia albida sur les rendements agricoles. Nogent-sur-Marne, France : Cirad-CTFT, 1-15.
Lu T. et al., 2022. Mapping the abundance of multipurpose agroforestry Faidherbia albida trees in Senegal. Remote Sens., 14, 662, doi.org/10.3390/rs14030662
Mai Moussa K.M, Williams J.H. & Bationo A., 1999. Propriétés chimiques des sols sableux sahéliens sous parcs à « Faidherbia albida » (Del.) A. Chev. Cah. Agric., 8(1), 70-72.
Massmann A., Gentine P. & Lin C., 2019. When does vapor pressure deficit drive or reduce evapotranspiration? J. Adv. Model. Earth Syst., 11(10), 3305-3320, doi.org/10.5194/hess-2018-553
Nhean S., Isarangkool Na Ayutthaya S., Rocheteau A. & Do F.C., 2019. Multi-species test and calibration of an improved transient thermal dissipation system of sap flow measurement with single probe. Tree Physiol., 39(6), 1061-1070, doi.org/10.1093/treephys/tpz017
Pélissier P., 1966. Les paysans du Sénégal : les civilisations agraires du Cayor à la Casamance. Saint-Yrieix, France : Imprimerie Fabrègue.
Rhoades C., 1995. Seasonal pattern of nitrogen mineralization and soil moisture beneath Faidherbia albida (syn. Acacia albida) in central Malawi. Agrofor. Syst., 29, 133-145, doi.org/10.1007/bf00704882
Roupsard O. et al., 1999. Reverse phenology and dry-season water uptake by Faidherbia albida (Del.) A. Chev. in an agroforestry parkland of Sudanese west Africa. Funct. Ecol., 13, 460-472, doi.org/10.1046/j.1365-2435.1999.00345.x
Roupsard O. et al., 2020. How far does the tree affect the crop in agroforestry? New spatial analysis methods in a Faidherbia parkland. Agric. Ecosyst. Environ., 296, 106928, doi.org/10.1016/j.agee.2020.106928
Santiago B.J.A. & Lambert J.B., 2010. Legumes and their exudates. Aridus, 22(1).
Sida T.S., Baudron F., Kim H. & Giller K.E., 2018. Climate-smart agroforestry: Faidherbia albida trees buffer wheat against climatic extremes in the Central Rift Valley of Ethiopia. Agric. For. Meteorol., 248, 339-347, doi.org/10.1016/j.agrformet.2017.10.013
Sileshi G.W., Mafongoya P.L. & Nath A.J., 2020. Agroforestry systems for improving nutrient recycling and soil fertility on degraded lands. In: Agroforestry for degraded landscapes. Singapore: Springer, 225-253, doi.org/10.1007/978-981-15-4136-0_8
Tappan G.G., Sall M., Wood E.C. & Cushing M., 2004. Ecoregions and land cover trends in Senegal. J. Arid Environ., 59(3), 427-462, doi.org/10.1016/j.jaridenv.2004.03.018
Van den Bilcke N., De Smedt S., Simbo D.J. & Samson R., 2013. Sap flow and water use in African baobab (Adansonia digitata L.) seedlings in response to drought stress. South Afr. J. Bot., 88, 438-446, doi.org/10.1016/j.sajb.2013.09.006
Yengwe J. et al., 2018. Effects of Faidherbia albida canopy and leaf litter on soil microbial communities and nitrogen mineralization in selected Zambian soils. Agrofor. Syst., 92, 349-363, doi.org/10.1007/s10457-016-0063-4
Zafar S. & Kun-Fang C., 2022. Water consumption during a leafless period in a dry season in three deciduous tropical timber species. J. Hydrol., 616(7), 128705, doi.org/10.1016/j.jhydrol.2022.128705
