


- Home
- volume 13 (2009)
- numéro spécial
- Image analysis and microscopy: a useful combination


View(s): 3223 (2 ULiège)
Download(s): 141 (1 ULiège)

Image analysis and microscopy: a useful combination

Abstract
The TSE Roadmap published in 2005 (DG for Health and Consumer Protection, 2005) suggests that short and medium term (2005-2009) amendments to control BSE policy should include “a relaxation of certain measures of the current total feed ban when certain conditions are met”. The same document noted “the starting point when revising the current feed ban provisions should be risk-based but at the same time taking into account the control tools in place to evaluate and ensure the proper implementation of this feed ban”. The clear implication is that adequate analytical methods to detect constituents of animal origin in feedstuffs are required. The official analytical method for the detection of constituents of animal origin in feedstuffs is the microscopic examination technique as described in Commission Directive 2003/126/EC of 23 December 2003 [OJ L 339, 24.12.2003, 78]. Although the microscopic method is usually able to distinguish fish from land animal material, it is often unable to distinguish between different terrestrial animals. Fulfillments of the requirements of Regulation 1774/2002/EC laying down health rules concerning animal by-products not intended for human consumption, clearly implies that it must be possible to identify the origin animal materials, at higher taxonomic levels than in the past. Thus improvements in all methods of detecting constituents of animal origin are required, including the microscopic method. This article will examine the problem of meat and bone meal in animal feeds, and the use of microscopic methods in association with computer image analysis to identify the source species of these feedstuff contaminants. Image processing, integrated with morphometric measurements can provide accurate and reliable results and can be a very useful aid to the analyst in the characterization, analysis and control of feedstuffs.
Table of content
1. Introduction
1The European Commission recently published The TSE Roadmap that presents a plan for future developments in legislation for animal feeds. The current total ban on animal meals in feed is expected to be replaced by a “species-to-species” ban that prohibits the feeding of animal proteins to the same species. As a consequence adequate analytical methods to detect constituents of animal origin in feedstuffs are required.
2The official analytical method for the detection of constituents of animal origin in feedstuffs is the microscopic examination technique, described in Commission Directive 2003/126/EC of 23 December 2003 [OJ L 339, 24.12.2003, 78]. The method specifies the examination of treated samples under compound and stereo-microscopes at several magnifications to identify bone constituents mainly. However, more recently attention has turned other structures within meal, and it seems possible to determine whether muscle fibres, for example, are of mammalian or avian origin (van Raamsdonk et al., 2004; 2007). However, the accuracy of qualitative and quantitative estimates using the microscopic method depends crucially on the experience of the analyst; furthermore quantitative estimates are always approximate. Regulation 1774/2002/EC clearly implies that it must be possible to identify the origin of animal materials at higher taxonomic levels than in the past. Thus improvements in all methods of detecting constituents of animal origin are required, including the microscopic method. This article examines the problem species identification of meat and bone meal in animal feeds, and the use of the computer image analysis as a useful combination to the microscopic method for identification of the origin of animal ingredient contaminants in feedstuffs.
2. Bone fragments and lacunae features
3The microscopic method is capable of distinguishing between fish and terrestrial animal material based essentially on bone characteristics. Mammalian and avian bone material may also be distinguished (Gizzi et al., 2003; van Raamsdonk et al., 2007). Specifically at high magnifications (from 10x) mammalian bone particles are generally transparent, more or less rounded, and contain elliptical to almost circular lacunae; canaliculae may be visible depending on the preservation and transparency of the particles. By contrast, bone particles from poultry are darker, have a more splintered (sharp-edged) appearance, more rounded and denser lacunae, and canaliculae are rarely visible (Gizzi et al., 2003). These characteristics were determined by examination of samples of known origin and processing history, and are consistent with histological textbooks and the literature on animal meal (Gizzi et al., 2003). Nevertheless, poultry and mammalian particles remain difficult to differentiate and their characteristics may overlap. As a consequence the experience of the microscopist is a crucial factor in successful identification. Most of these differences are incorporated in the ARIES (Animal Remains Identification and Evaluation System) software (Version 1.0, 2004) and are implemented as full descriptions, images and interactive identification trees. ARIES is a decision support tool for identifying animal material in feeds in the daily practice of control laboratories, and a training tool for microscopists (van Raamsdonk et al., 2007). Computer image analysis can be a useful supplement to microscopic observations for the characterization of animal feedstuffs.
3. Image analysis
4The image analysis procedure consists of a sequence of steps as follows:
5– image acquisition captures in digital form in the computer an array of pixels representing the structure and features to be evaluated,
6– image enhancement improves the visibility of image detail, and is a precursor to image thresholding,
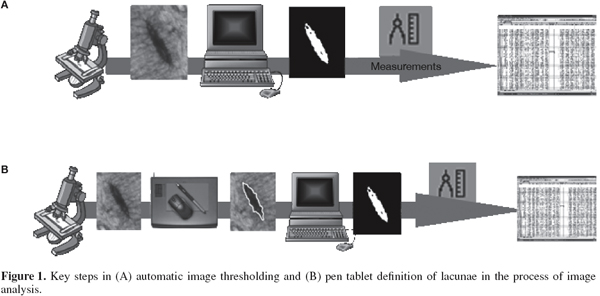
7– thresholding selects a range of brightness or color values that characterize the object or structures of interest so as to isolate them from the rest of the image. Automatic setting of thresholds is preferred to manual setting because it is more reproducible and permits automation. However in some cases, manual definition of the image dimension and the features to be measured and counted is useful, and can be performed with computer peripherals such as a pen tablet. In either case, a binary (black and white) image is produced that captures the important structural features. Thresholded images are rarely perfect, and further processing to correct problems and measure selected parameters can be performed.
8Pinotti et al. (2004) have performed a preliminary study combining microscopy and image analysis, reporting that, of 32 descriptors pertaining to mammal and poultry lacunae, polygon area (area within the polygon defining the lacuna outline) and perimeter (length of lacuna outline) were able to distinguish bone fragments from the two animal classes. Although the study was based on a limited number of lacunae (13 from mammalian samples, 17 from poultry samples) and used reference material, 93.3% of lacunae were correctly classified, while on two occasions (6.6%) the lacunae from poultry bone fragments were incorrectly classified as mammalian (Pinotti et al., 2004). These findings indicated that although image analysis associated with microscopic observation had potential for determining the origin of animal materials, the characteristics of mammalian and poultry bone and bone lacunae overlap.
9From this experience it also emerged that many of the images did not have optimum image contrast and could not be thresholded automatically, so it was necessary to use a pen tablet. Pinotti and co-workers (2007a) therefore compared automatic image thresholding and manual definition in terms of the precision and accuracy in bone lacunae determinations. The key steps in the automatic and manual methods are illustrated in figure 1. One hundred mammalian and 100 poultry lacuna images were defined using both the automatic technique and manually with a pen tablet. Twenty-five descriptors for each lacuna were determined and compared. It was found that the numeric descriptors obtained using the two methods did not differ.
10Further studies were conducted to assess the potential of image analysis in combination with the official microscopic method, for distinguishing poultry and mammalian material. In the first study, 85 bone fragment lacunae from tibial diaphyses of poultry and mammals (coming from different animals) were examined (Pinotti et al., 2007b). It was found that, of 32 descriptors processed by the image analysis software, only 12 differed significantly at the P < 0.001 level between mammals and poultry, and were represented by area, perimeter, axis, diameter, radius, size, feret, aspect, as well as some derived or constructed from them.
11Most of these descriptors were closely associated with the general characteristics of mammalian and poultry bone fragments and lacunae reported by Gizzi et al. (2003). However, the aspect and minor axis indicated that poultry lacunae were not as globular as previously reported (Gizzi et al., 2003). In fact, aspect was higher (3.67 vs 2.86) and minor axis was lower (4.78 vs 6.86) in poultry than mammalian lacunae, indicating that lacunae had a tapering shape in poultry. This study (Pinotti et al., 2007b) also analyzed poultry vs mammalian descriptor characteristics by linear discriminant analysis (LDA), with a cross validation procedure. It was found that 86% of lacunae were correctly classified by class (mammalian vs avian) with 14% classified incorrectly: 5 mammalian lacunae were identified as poultry and 7 poultry lacunae identified as mammalian. This outcome is encouraging and indicated that LDA has potential in discriminating mammalian from avian content.
12In a further study (Campagnoli et al., 2009), 863 lacunae were measured using both manual and automatic methods in reference samples containing poultry and mammalian meat meal and bone meal (Agricultural Research Centre of Gembloux, Belgium, and SAFEED-PAP Project; VSA, University of Milan). In this case 26 descriptors were determined on the lacunae, of these 23 differed significantly (P < 0.001, ANOVA ) between mammalian and poultry bone. However, box-plots of means and medians indicated that 8 descriptors best discriminated the animal classes. These were lacuna area, length of minor axis of ellipse, length of shortest line joining two points of object outline and passing through the centroid, minimum distance between centroid and outline, roundness [(perimeter squared)/(4π x area), Feret’s minimum diameter, polygon area (area of polygon defining object outline)] and width (Feret’s diameter along minor axis). These findings provided further evidence that numerical lacuna descriptors derived from image analysis can reliably distinguish mammalian from avian material.
13Investigations of morphological descriptors to distinguish animal material at taxonomic levels higher than class have been carried out recently, concentrating on derived shape variables constructed by combining the various size variables so that dimension units cancel out. Thus, using the dataset of 863 lacunae, and 26 descriptors together with 4 additional derived shape descriptors (calculated according Russ, 2005), Pinotti et al. (unpublished results) investigated whether it was possible to distinguish ruminants (bovine and ovine) from non-ruminants (pig, rabbit, chicken, turkey). The results indicated that:
14– the variables that best discriminated ruminants from non-ruminants were almost exactly the same as reported previously (Pinotti et al., 2007b),
15– the four additional derived shape descriptors were also able to distinguish ruminants from non-ruminants,
16– by LDA, 88.3% of non-ruminant lacunae were classified correctly, and 11.7% incorrectly as ruminant. However only 61.2% of ruminant lacunae were correctly classified (and 38.8% incorrectly classified as non-ruminant).
4. Conclusion
17The use of microscopic methods in association with computer image analysis to identify the source species of feedstuff contaminants appears promising although there are several limitations, particularly when trying to distinguish material from higher taxonomic level than class. Further progress in this area requires the establishment of a sufficiently large and representative reference dataset, the identification of key distinguishing descriptors (e.g. derived shape descriptors) and the use of better-defined statistical methods to support the image analysis approach. Improvements in these areas will render image processing, integrated with morphometric measurements, better able to provide accurate and reliable means for characterizing feedstuff constituents of animal origin.
18Acknowledgements
19This work is funded by the European Commission, within the framework of the FOOD-CT-2006-036221 Project SAFEED-PAP ("Detection of presence of species-specific processed animal proteins in animal feed"; http://safeedpap.feedsafety.org) under the specific FP6 research and technological development program "Integrating and strengthening the European Research Area".
20The information contained in this work reflect the authors’ views; the European Commission is not liable for any use of the information contained therein.
Bibliographie
Campagnoli A. et al., 2009. Combining microscopic methods and computer image analysis for lacunae morpho-metric measurements in poultry and mammal by-products characterization. Biotechnol. Agron. Soc. Environ., 13(S), 25-27.
Directorate-General for Health and Consumer Protection, 2005. The TSE Roadmap. Brussels: European Commission, COM 322 FINAL, http: ec.europa.eu/food/food/biosafety/bse/roadmap_en.pdf, (01.11.07).
Gizzi G. et al., 2003. An overview of tests for animal tissues in feeds applied in response to public health concerns regarding bovine spongiform encephalopathy. Rev. Sci. Tech. Off. Int. Epizooti., 22(1), 311-331.
Pinotti L. et al., 2004. Microscopic method in processed animal proteins identification in feed: applications of image analysis. Biotechnol. Agron. Soc. Environ., 8(4), 249-251.
Pinotti L. et al., 2007a. Analisi d’immagine applicata alla tecnica microscopica classica nella caratterizzazione delle farine animali. Atti Soc. Ital. Sci. Vet., 61, 449-450.
Pinotti L. et al., 2007b. Selection of new markers for animal by-products characterization by classical microscopy. Ital. J. Anim. Sci., 6(Suppl.1), 339-341.
Russ J.C., 2005. Image analysis of food microstructure. Boca Raton, FL, USA: CRC Press.
van Raamsdonk L.W.D. et al., 2004. The microscopic detection of animal proteins in feeds. Biotechnol. Agron. Soc. Environ., 8(4), 241-247.
van Raamsdonk L.W.D. et al., 2007. New developments in the detection and identification of processed animal proteins in feeds. Anim. Feed Sci. Technol., 133, 63-83.
To cite this article
About: Luciano Pinotti
University of Milan. Veterinary Faculty. Department of Veterinary Science and Technology for Food Safety. Via Celoria, 10. I-20133 Milano (Italy). E-mail: luciano.pinotti@unimi.it
