


- Accueil
- volume 16 (2012)
- numéro 3
- Classical and NIR measurements of the quality and nutritional parameters of apples: a methodological study of intra-fruit variability


Visualisation(s): 4361 (24 ULiège)
Téléchargement(s): 270 (2 ULiège)

Classical and NIR measurements of the quality and nutritional parameters of apples: a methodological study of intra-fruit variability

Notes de la rédaction
Received on July 11, 2011; accepted on January 12, 2012
Résumé
Analyse de la qualité et des paramètres nutritionnels des pommes par les méthodes NIR et classiques : étude méthodologique de la variabilité intra-fruit. Dans le passé, les recherches ont porté sur l’application de la technique de Spectroscopie Proche Infrarouge (NIR) pour l’analyse de la qualité des pommes. Étant donné que les paramètres de qualité et nutritionnels sont influencés par de nombreux facteurs, il est très important de standardiser les méthodes d’échantillonnage avant de réaliser les analyses. Dans cette étude, la variabilité intra-fruit des variétés de pommes en termes de paramètres de qualité (contenu en sucre, polyphénols totaux et vitamine C) a été étudiée. L’adéquation des protocoles généralement utilisés pour analyser la qualité des fruits (mesures de référence réalisées sur un échantillon moyen du fruit et mesures NIR réalisées en quatre points situés à l’équateur du fruit) a ensuite été étudiée. Les mesures de référence ont montré une importante variabilité intra-fruit pour tous les paramètres de qualité étudiés. Les résultats ont aussi montré la faible différence entre la moyenne des valeurs aux quatre points de l’équateur et la valeur moyenne de la pomme entière. Ceci suggère que la valeur moyenne obtenue à partir d’un échantillon représentatif du fruit est suffisante pour estimer la variabilité au sein du fruit et pour estimer avec précision les paramètres de qualité. Les résultats obtenus avec la technique NIR montre que la mesure aux quatre points de l’équateur est adéquate pour prédire précisément les paramètres de qualité. En conclusion, les analyses de référence devraient être réalisées sur un échantillon représentatif du fruit et les mesures spectrales réalisées en quatre points à l’équateur du fruit.
Abstract
For the past few years, research has focused on the application of Near Infrared Spectroscopy (NIR) techniques to analyze the quality of apple varieties. As all fruit quality and nutritional parameters are affected by many factors, to standardize the sampling methods prior to analysis is very important. In this study, the intra-fruit variability of apple varieties in terms of quality parameters (sugar, total polyphenol and vitamin C content) was examined. The adequacy of the protocols usually applied to analyze apple quality (reference analyses of a representative sample of the apple and NIR measurements collected at four points 45° from each other in the equatorial region of the apple) was then investigated. The reference values for the quality parameters showed important intra-fruit variability for all quality parameters analyzed. The results also showed that there was little difference between the mean value at the four points and the mean value of the entire apple. This suggested that a mean value obtained from a representative sample of an apple is enough to assess the variability within the fruit and to estimate, with precision, the content of the quality parameters. The results of NIR spectroscopy showed that measurement at the four target points is suitable for predicting quality parameters precisely. The study concluded that standardized reference analyses should be done on a representative fruit sample of an apple and spectral measurements made at four points 45° from each other in the equatorial region of the apple.
Table des matières
1. Introduction
1Fruit quality has traditionally been evaluated by visual inspection of the external appearance and by using destructive methods to measure the internal quality parameters. Due to the destructive nature of the methods used, only a certain number of batches can be analyzed, even though fruit and vegetable batches are known to be highly variable (Flores et al., 2008). In the past decade, research has focused on developing non-destructive measurement techniques to analyze the quality attributes of agricultural products. Near Infrared Spectroscopy (NIR) is based on the reflection and selective absorption of NIR radiation, depending on the structure and chemical composition of the product. The resulting spectral data are analyzed using multivariate regression techniques in order to establish a relationship with the quality characteristics of interest (measured by reference method or by standardized observation). This is done by developing prediction models. NIR spectroscopy offers decisive advantages over traditional methods, the main ones being that it is rapid (a few seconds per sample) and non-destructive, which is very important for controlling and sorting agricultural products. It is also very simple, direct (no preparation of sample) and chemical-free (limited to the reagents required for reference analyses). Finally, it allows several product parameters to be studied simultaneously (Lammertyn et al., 1998).
2NIR spectroscopy has been applied widely to determine the internal quality of numerous agricultural and food products, including fruit, particularly apples. It has been used to predict firmness (Mehinagic et al., 2003; Lu, 2004; Zude et al., 2006), sugar content (Lu et al., 2000; Park et al., 2003; Peirs et al., 2003; Sanchez et al., 2003; Liu et al., 2006; Zude et al., 2006; Liu et al., 2007; Angra et al., 2009; Paz et al., 2009), water content (Qing et al., 2008), acidity (Lammertyn et al., 1998; Liu et al., 2005; Liu et al., 2006) and post-harvest quality (Bobelyn et al., 2010). It has also been used to discriminate varieties (Ciotti et al., 1998; He et al., 2007) and to detect such defects as bitter pit (Nicolaï et al., 2006), bruises on apples (Guillermin et al., 2005) and internal browning (Clark et al., 2003).
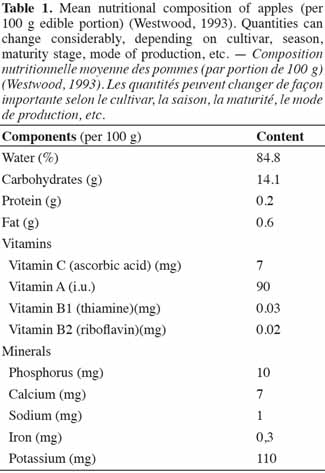
3In apples, a major indication of internal quality is sugar content, as this will affect consumer acceptance and therefore influence the product’s market value (Table 1). Polyphenols and vitamin C are also important criteria for evaluating the nutritional quality of apples. They are antioxidants and have many biological activities in the human body. The health benefits of apple phytochemicals have been widely studied (Boyer et al., 2004), but the chemical analysis of these nutritional characteristics involves destructive, laborious, costly and time-consuming methods. NIR spectroscopy could therefore be an interesting alternative for analyzing these nutritional parameters. Unlike the analysis of sugar content, firmness and acidity (see Nicolaï et al., 2007 and Camps et al., 2008 for review), there are no reports on the use of NIR for measuring the polyphenol and vitamin C content in apples in particular or fruit in general.
4With NIR analyses, to obtain a robust prediction model, the calibration dataset should be sufficiently rich in variation and should contain samples from diverse varieties, orchards and seasons. The influence of biological variability (variety, orchard, and season) has been demonstrated (Peirs et al., 2003). The dataset should therefore represent the existing variability in the species, but should also take account of the existing variability within the fruit itself. This is especially relevant when fresh and heterogeneous products such as fruits are analyzed. The anisotropic differences of NIR spectra and quality parameters could be observed in apples, as they have been demonstrated for peaches (Fu et al., 2008). In this case, it is essential to know more about the distribution of constituents in the fruit and to determine where and how many points need to be measured with NIR, as well as to assess the sample portion to be analyzed using reference methods, in order to have a representative figure of the product analyzed. In the literature, NIR usually involves taking measurements at up to four points located in the equatorial region of the fruit. In most studies on apples, four points situated at 45° from each other in the equatorial region are measured with NIR (Lammertyn et al., 1998; Peirs et al., 2003; Liu et al., 2004; Liu et al., 2005; Sinnaeve et al., 2009). However, no study has yet demonstrated the adequacy of this protocol. The mean spectrum at four points might not be enough to provide a representative spectrum of the entire fruit. Similarly, reference analyses are generally done on a representative sample of the fruit, but no study has demonstrated the adequacy of this protocol for apple. The adequacy of the protocol for apple therefore needs to be investigated. This could be done by analyzing and relating the quality parameters to the target points measured by NIR.
5Since 1973, an important research area at CRA-W has been the study of a large fruit genetic resources collection (Lateur et al., 1994; Lateur, 2003). The study has several objectives, including the conservation of the fruits’ patrimony, as well as the evaluation, conservation and valorization of the fruits. There is a particular focus on the selection and valorization of varieties that have low susceptibility to diseases and are adapted to low-input production modes (Lateur et al., 2009) and of varieties with specific nutritional properties (e.g., with a high content of ascorbic acid and phenolic compounds). The study of the quality and nutritional properties of fruits (sugar, ascorbic acid, malic acid, fibers and phenolic compounds contents) is one of the institution’s main areas of expertise (Planchon et al., 1999; Planchon et al., 2004; Romnée et al., 2009; Sinnaeve et al., 2009).
6The aims of this study were:
7– to investigate the intra-fruit variability of apples for quality parameters, particularly for sugar, polyphenol and vitamin C content;
8 – depending on this intra-fruit variability, to determine if the protocol usually applied for apple analyses (reference analyses done on a representative sample of the fruit and NIR measurements collected at four points 45° from each other in the apple’s equatorial region) is suitable.
2. Materials and methods
2.1. Fruit
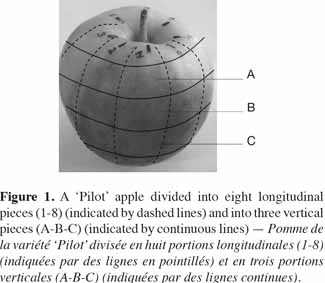
9Two apple varieties, ‘Hidala’ (red sort of ‘Braeburn’) and ‘Pilot’, were investigated. They were chosen for their distinct sugar content and coloration: ‘Pilot’ contains more sugar than ‘Hidala’ and is bi-colored, whereas ‘Hidala’ is completely red. Five apples per variety were selected. Each apple was divided into eight longitudinal pieces from its central axis (1 to 8) and three vertical pieces (A-B-C) with A being the upper part between the equator and the stalk; B being the equatorial region; and C being the lower part between the equator and the calyx. The division into longitudinal pieces took account of skin color, with piece 1 being the most highly colored. There was therefore a total of 24 target areas for each apple (Figure 1).
2.2. NIR analysis
10Part of the electromagnetic spectrum of each target area was measured using an XDS spectrophotometer (FOSS NIRSystems, Inc., USA) covering the visible and NIR range from 408 nm to 2,498 nm and taking data every 2 nm (Sinnaeve et al., 2009). For each apple, 24 spectra corresponding to the 24 target areas were collected. In the literature, only four target areas of apples are usually measured and averaged; they correspond, in this study, to the longitudinal pieces 1, 3, 5, and 7 of the equatorial region of the apple (i.e., areas B1, B3, B5, and B7).
2.3. Reference analysis
11The quality parameters (sugar and total polyphenols) were determined using standard protocols for fruits (Vaysse et al., 2004). Sugar content (°Brix), or more precisely the percentage of soluble solid content, was analyzed in apple juice using a digital hand-held refractometer (ATAGO CO., LTD., Japan). The polyphenol content was estimated using the Folin-Ciocalteau method. Vitamin C (ascorbic acid) content was determined using UPLC-MSMS (Waters Corp., USA) (Romnée et al., 2009). The repeatability of these analytical methods as defined by ISO 5725 had been previously estimated for each parameter using six ‘Hidala’ apples. For each apple, the reference analyses were repeated four times. The repeatability standard deviation was estimated using the formula:
12Sr = √S²r
13where S²r = (S²i)/k, with S²i = variance of the ith essay (apple) and k = number of essays.
14The reference analyses were performed in the same 24 target areas (about 1 cm³) as those measured with NIR; the portion of flesh illuminated by NIR was taken and analyzed. Each quality parameter was measured on only one apple per variety. After the NIR measurement, apple no. 1 was analyzed for the sugar content, apple no. 2 for the polyphenol content and apple no. 3 for the vitamin C content. All the reference analyses were performed immediately after the NIR measurements.
2.4. Data analysis
15For each quality parameter, the reference values were analyzed using ANOVA (Minitab 15 Inc., USA) in order to highlight the differentiation according to “longitudinal piece” or “vertical piece”. The reference values were then used to calibrate spectroscopic models using Winisi software (Infrasoft International LLC, USA). Multiple Linear Regression (MLR) and Partial Least Squares (PLS) regression techniques using different spectral ranges (408-2,498 nm, 950-1,774 nm and 1,600-2,390 nm) had been previously applied. In MLR, the forward stepwise selection of wavelengths has been used in order to avoid over-fitting as there are many more wavelengths than samples. For each quality parameter, the different models were compared on the basis of the calibration characteristics. The MLR regression method gave the most accurate models (lower SEC and higher RSQ and RPD) and was therefore used in the present study.
16For each quality parameter, a spectroscopic model was calculated for each variety separately. The performances of the models were estimated according to the following statistics: Standard Deviation (SD), Standard Error of Calibration (SEC), Standard Error of Cross-Validation (SECV), coefficient of determination of calibration (RSQ) and the ratio of prediction to deviation (RPD = SD/ SECV). The SECV was calculated independently by leaving out one longitudinal/vertical piece. Precisely, each longitudinal (or vertical) piece was leaved out and the SECV was calculated using a calibration set of n = 21 (or 16) and a test set of n = 3 (or 8). Finally, the SECV values obtained after having leaved each longitudinal (or vertical) piece were averaged to provide a mean SECV reported in the tables. Only results for the leaving out one vertical piece are presented in the paper.
17The calibration models were then used to predict the quality parameters of the five apples used in the study (including the one used for the calibration step).
18For the apples used for the calibration models, the first step was to analyze the reference values. In order to study the influence of the sampling on the calibration, the mean of the values for the four target areas usually analyzed (longitudinal pieces 1, 3, 5, and 7 of the equatorial region of the apple, hereafter referred to simply as “the four target areas usually measured”) was compared with the mean value of the entire apple. The NIR measurements were then analyzed. In order to evaluate the adequacy of the four NIR measurements for the target areas usually analyzed, the predicted values at these target areas were averaged and the mean was compared with the mean content of the entire apple (reference value). In addition, the four spectra were averaged and the predicted value of the mean spectrum was compared with the mean of the predicted values of the entire apple and with the mean content of the entire apple.
19For the apples with no reference values, the quality parameters were predicted using the calibration models. In order to evaluate the adequacy of the NIR measurements for the four target areas usually measured, the predicted values at these target areas were averaged and the mean was compared with the mean of the predicted values of the entire apple.
3. Results and discussion
3.1. Sugar content
20Reference analyses. The sugar content of apple no. 1 varied from 10.6 to 13.4 °Brix for ‘Hidala’ and from 14 to 15.8 °Brix for ‘Pilot’, depending on the target area (Table 2). With the repeatability standard deviation of the method being 0.10, the sugar content data revealed intra-fruit variability.
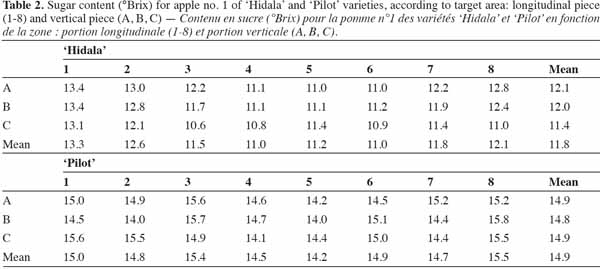
21For both varieties, the highest values were observed for longitudinal pieces 1 and 8, which were the most colored regions of the apples. However, ‘Hidala’ showed greater variability and a greater range of sugar content than ‘Pilot’. Variance analysis showed very highly significant differentiation between the longitudinal pieces of ‘Hidala’ (p-value < 0.001), but only significant differentiation for ‘Pilot’ (p-value = 0.037). From a vertical point of view, sugar content did not vary much and was similar for all the vertical pieces. No differentiation was revealed by ANOVA (p-value = 0.22 and 0.89 for ‘Hidala’ and ‘Pilot’, respectively).
22For ‘Hidala’, the mean sugar content was 11.8 °Brix. If only the four target areas usually measured were considered, the mean sugar content was 12.02 °Brix [(13.4 + 11.7 + 11.1 + 11.9)/4]. There was less than a 2% difference (Δ = 0.22 °Brix) between the mean sugar content of the entire apple and the mean sugar content of the four target areas at the equatorial region. For ‘Pilot’, the mean sugar content was 14.9 °Brix. The mean sugar content in the four target areas usually measured was 14.65 °Brix [(14.5 + 15.7 + 14 + 14.4)/4], which was very close to the mean sugar content of the entire apple (24 target areas) (Δ = 2%).
23For both varieties, therefore, the mean sugar content in the four target areas usually measured was very close to the mean sugar content of the entire apple, which demonstrates that analyzing four points is enough to assess the sugar variability within the fruits and to estimate, with precision, the sugar content of the apples.
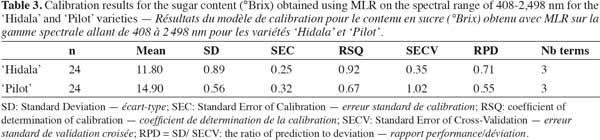
24Calibration and prediction of sugar content. Various regression methods and wavelength ranges were tested to calibrate the data of both varieties. The best results (lowest SEC and highest RSQ and RPD) were obtained using MLR on the spectral range of 408-2,498 nm. The calibration models were realized separately for both the varieties (n = 24) (Table 3). Sugar content predictions for all five apples were made using this calibration models.
25‘Hidala’. The predicted values for the five apples (data not shown) showed that there was both intra-fruit and inter-fruit variability. In addition to the variation of the predicted mean sugar content among the apples, the sugar content varied within apples, depending on the target area (longitudinal piece and vertical piece) of the apple. This sugar distribution was not constant and varied greatly among apples (data not shown).
26For apple no. 1 used in the calibration model, the predicted values were very close to those measured in the laboratory (reference values) (Table 4). The predicted mean sugar content was identical to the mean sugar content measured in the laboratory (11.8 °Brix). In addition, the mean of the predicted sugar content in the four target areas usually measured was 11.8 °Brix [(13.2 + 11.6 + 10.7 + 11.7)/4], which was identical to the mean sugar content (reference value). Finally, the predicted value of the mean spectrum for the four target areas was 11.7 °Brix, which was very close to the mean of the predicted sugar content in the four target areas and to the mean sugar content.
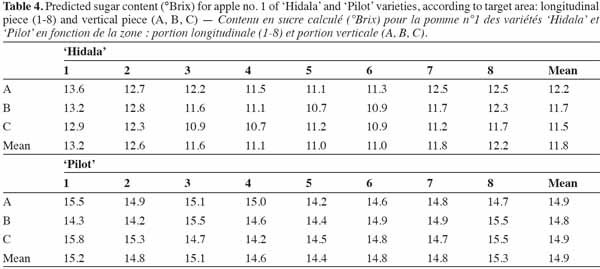
27These results proved the robustness of the calibration model and suggested that the measurements in the four target areas usually measured were enough to predict, with precision, the mean sugar content in apples.
28For the other apples (with no reference values), the predicted values showed sugar content to be in the same range as that of apple no. 1. The adequacy of the NIR measurements for the four target areas usually measured was also evaluated. The results showed that the means of the predicted values in these target areas were always very close to the means of the predicted values of the entire apple. The difference between the mean of the predicted values in these target areas and the mean of the predicted values of the entire apple was always equal to or less than 1%.
29‘Pilot’. The same observations can be made for the predicted values of the ‘Pilot’ apples. There was both intra- and inter-fruit variability, as well as great variability in sugar distribution among the apples (data not shown).
30For apple no. 1 used in the calibration model, as observed for ‘Hidala’, the predicted values were very close to the reference ones (Table 4). The predicted mean sugar content (14.9 °Brix) was identical to the mean sugar content measured in the laboratory (14.9 °Brix). The mean of the predicted sugar content for the four target areas usually measured was 14.8 °Brix [(14.3 + 15.5 + 14.4 + 14.9)/4], which was very close to the mean sugar content. Finally, as observed for ‘Hidala’, the predicted value of the mean spectrum of the four target areas was 14.7 °Brix, which was very close to the mean of the predicted sugar content in the four target areas and to the mean sugar content.
31For the other apples (with no reference values), the predicted values showed sugar content to be in the same range as that of apple no. 1. The adequacy of the NIR measurements for the four target areas usually measured was also evaluated. The results showed that the means of the predicted values for these target areas were always very close to the means of the predicted values of the entire apple. The difference between the mean of the predicted values for these target areas and the mean of the predicted values of the entire apple was always equal to or less than 1%.
32The results did not highlight a particular sugar distribution pattern in the ‘Hidala’ or ‘Pilot’ apples. However, they revealed that using NIR to measure the four target areas in the equatorial region of the fruit was enough to predict, with precision, the mean sugar content of apples.
3.2. Polyphenol content
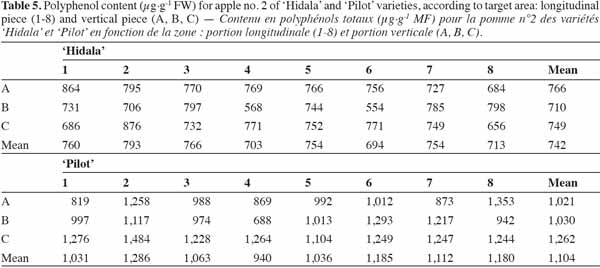
33Reference analyses. The polyphenol content of apple no. 2 varied from 554 to 876 μg.g-1 FW for ‘Hidala’ and from 688 to 1,484 μg.g-1 FW for ‘Pilot’, depending on the target area of the apple (Table 5). These values accord with the findings of Vrohvsek et al. (2004) and Vanzani et al. (2005), who found an average concentration of 75.4 mg.100g-1 FW and 2.6 mmol.kg-1 FW, respectively, in ‘Braeburn’ apples. ‘Pilot’ apples showed greater variability in the polyphenol content than ‘Braeburn’. With the repeatability standard deviation of the method being 74.5, the data revealed intra-fruit variability in terms of polyphenol content.
34For both varieties the data showed that there was no particular distribution of polyphenol content among the longitudinal pieces. No differentiation for this parameter was highlighted (p-value = 0.77 and 0.51 for ‘Hidala’ and ‘Pilot’, respectively). With regard to the vertical pieces, for ‘Hidala’ the polyphenol content was highly variable and there was no particular distribution. There was no differentiation among vertical pieces (p-value = 0.96). For ‘Pilot’, a higher polyphenol content was observed for vertical piece C than for vertical pieces A and B. The variance analysis showed significant differentiation among vertical pieces (p-value = 0.012).
35For ‘Hidala’, the mean polyphenol content was 742 µg.g-1 FW. If only the four target areas usually measured were considered, the mean content was 764 µg.g-1 FW [(731 + 797 + 744 + 785)/4]. The difference in the results obtained using the two protocols was only 3% (Δ = 22) between the mean polyphenol content of the entire apple and the mean content in the four target areas usually measured. For ‘Pilot’, the mean polyphenol content was 1,104 µg.g-1 FW. The mean content in the four target areas usually measured was 1,050 µg.g-1 FW [(997 + 974 + 1,013 + 1,217)/4], which revealed a 5% difference (Δ = 54) from the results obtained for the entire fruit.
36For both varieties, therefore, the mean polyphenol content in the four target areas usually measured was very close to the mean content of the entire apple, which again demonstrates that analyzing the four points is enough to assess polyphenol variability within fruits and to estimate, with precision, the polyphenol content.
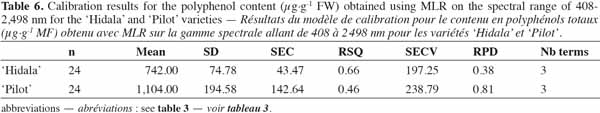
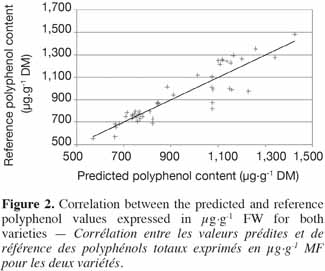
37Calibration and prediction of polyphenol content. Various regression methods and wavelength ranges were tested and compared. The best results (lowest SEC and highest RSQ and RPD) were obtained using MLR on the full spectrum of the XDS spectrophotometer. The calibration models are shown in table 6. Figure 2 shows the correlation between the predicted and reference polyphenol values for both varieties. Polyphenol content predictions for all five apples were made using these calibration models.
38‘Hidala’. As in the case of sugar content, there was both intra-fruit and inter-fruit variability in polyphenol content. The mean content varied slightly among the apples. However, the distribution of polyphenols within apples varied among the fruits, depending mainly on the quarter (data not shown).
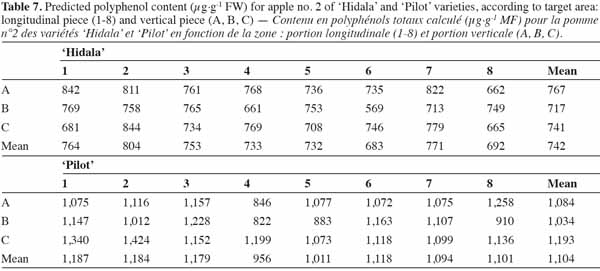
39For apple no. 2 used in the calibration model, predicted values were generally quite close to the reference values (Table 7). The predicted mean polyphenol content (742 μg.g-1 FW) was identical to the reference value (742 μg.g-1 FW). The mean of predicted values for the four target areas usually measured was 750 μg.g-1 FW [(769 + 765 + 753 + 713)/4], which was close to the mean polyphenol content (742 μg.g-1 FW). Finally, the predicted value of the mean spectrum for the four target areas was 751 μg.g-1 FW, which was very close to the mean of the predicted polyphenol content in the four target areas (750 μg.g-1 FW) and also close to the mean polyphenol content.
40For the other apples (with no reference values), the predicted values showed the polyphenol content to be in the same range as that for apple no. 2. The adequacy of the NIR measurements for the four target areas usually measured was also evaluated. The results showed that the means of the predicted values at these target areas were always very close to the means of the predicted values of the entire apple. The difference between the mean of the predicted values at these target areas and the mean of the predicted values of the entire apple was always less than 5%.
41‘Pilot’. As observed for ‘Hidala’, the mean polyphenol content varied slightly among the apples. Its distribution however varied among the apples, depending mainly on the quarter. The variation among the vertical pieces was less important (data not shown).
42For apple no. 2, the predicted values were fairly close to those measured in the laboratory (Table 7). Despite some differences between values, the predicted mean content (1,104 μg.g-1 FW) was identical to the reference value (1,104 μg.g-1 FW). The mean of the predicted values for the four target areas usually measured was 1,091 μg.g-1 FW [(1,147 + 1,228 + 883 + 1,107)/4], which was close to the mean content. Finally, the predicted value of the mean spectrum for the four target areas was 1,098 μg.g-1 FW, which was close to the mean of the predicted polyphenol contents in the four target areas (1,091 μg.g-1 FW) and close to the mean polyphenol content.
43For the other apples (with no reference values), the predicted values showed polyphenol content to be in the same range as that for apple no. 2. For ‘Hidala’, the adequacy of the NIR measurements for the four target areas usually measured was also evaluated. The results showed that the means of the predicted values in these target areas were always close to the means of the predicted values of the entire apple. The difference between the mean of the predicted values in these target areas and the mean of the predicted values of the entire apple was always less than 5%.
44As concluded for the sugar analysis, the results for both the ‘Hidala’ and ‘Pilot’ varieties showed that using NIR to measure the four target areas in the equatorial region of the fruit was enough to predict, with precision, the mean total polyphenol content of apples.
3.3. Vitamin C
45Reference analyses. The vitamin C content of apple no. 3 varied from 12.6 to 27.3 mg.100g-1 FW for ‘Hidala’ and from 12.9 to 28.1 mg.100g-1 FW for ‘Pilot’, depending on the target area of the apple (Table 8). These values accord with previous vitamin C analyses carried out in our laboratory and are close to those reported by Vrohvsek et al. (2004), who found an average concentration of 8.1 mg.100g-1 FW in ‘Braeburn’. The data showed that there was even higher intra-fruit variability than observed for sugar and total polyphenol content. The repeatability standard deviation of the method was 0.9.
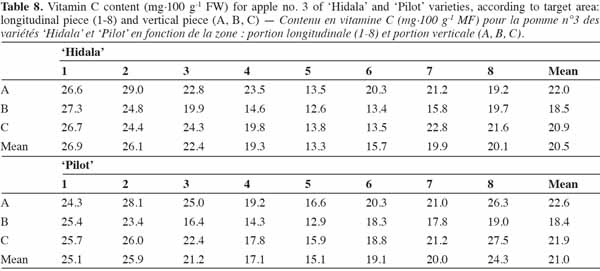
46For both varieties, the highest values were observed for longitudinal pieces 1 and 2. Both varieties showed a great variation in vitamin C content according to longitudinal pieces. ‘Hidala’ showed a greater range of vitamin C content and greater variability than ‘Pilot’. Variance analysis showed a very highly significant differentiation among longitudinal pieces for ‘Hidala’ (p-value < 0.001) and a highly significant differentiation for ‘Pilot’ (p-value = 0.002). From a vertical point of view, for both varieties the vitamin C content did not vary much. No differentiation according to the vertical pieces was revealed using ANOVA (p-value = 0.38 and 0.12 for ‘Hidala’ and ‘Pilot’, respectively).
47For ‘Hidala’, the mean vitamin C content was 20.5 mg.100 g-1 FW. If only the four target areas usually measured were considered, the mean content was 18.9 mg.100 g-1 FW [(27.3 + 19.9 + 12.6 + 15.8)/4]. For vitamin C, the difference between the mean vitamin C content of the entire apple and the mean content of the four target areas in the equatorial region of the apple was higher than that observed for the other parameters, and reached 8% (Δ = 1.6). For ‘Pilot’, the mean content was 21 mg.100 g-1 FW. The mean content for the four target areas usually measured was 18.1 mg.100 g-1 FW [(25.4 + 16.4 + 12.9 + 17.8)/4], which is close to the mean polyphenol content of the entire apple (Δ = 2.9) and represents a difference of 14%. For both varieties, therefore, the mean vitamin C content in the four target areas could be considered as representative of the mean content for the entire apple.
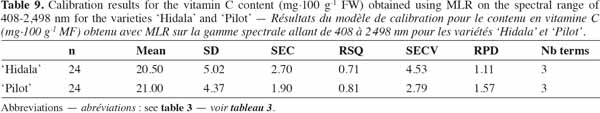
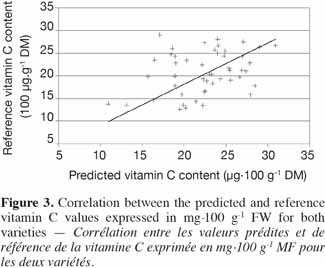
48Calibration and prediction of vitamin C content. As for sugar and polyphenol content, the calibration models for vitamin C were realized using MLR on the full spectrum of the XDS spectrophotometer (Table 9). Figure 3 shows the correlation between the predicted and reference vitamin C values for both varieties. Vitamin C content predictions for all five apples were made using these calibration models.
49‘Hidala’. As observed for sugar and polyphenol content, both intra-fruit and inter-fruit variability were observed. Predicted mean vitamin C content varied slightly among the apples. The distribution of vitamin C within apples varied slightly among fruits, according to both the longitudinal and vertical pieces (data not shown).
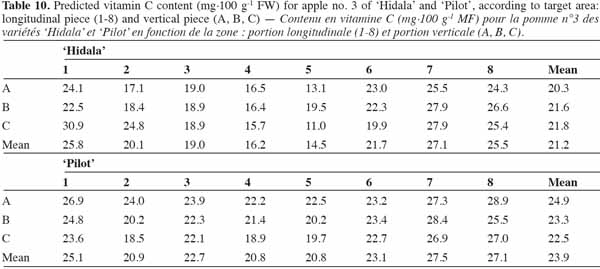
50For apple no. 3 used in the calibration model, the predicted values showed some differences from the reference values (Table 10). The predicted mean vitamin C content (21.2 mg.100g-1 FW) however was close to the reference value (20.5 mg.100 g-1 FW). The mean of the predicted values for the four target areas usually measured was 22.2 mg.100 g-1 FW [(22.5 + 18.9 + 19.5 + 27.9)/4], which was quite close to the mean vitamin C content. Finally, the predicted value of the mean spectrum for the four target areas was 20.4, which was quite close to the mean of the predicted vitamin C content in the four target areas and very close to the mean vitamin C content.
51For the other apples (with no reference values), the predicted values showed vitamin C content to be in the same range as that for apple no. 3. Again, the results showed that the means of the predicted values for the four target areas usually measured were always close to the means of the predicted values of the entire apple. The differences between the mean of the predicted values in these target areas and the mean of the predicted values of the entire apple ranged from 0.7 to 5%.
52‘Pilot’. As observed for ‘Hidala’, the predicted mean vitamin C content varied slightly among fruits. The distribution varied among apples. The highest values were generally observed for longitudinal pieces 1 and 8, which are the most colored regions of the apples, and for vertical pieces A and B (data not shown).
53For apple no. 3, the predicted values also showed some difference from the reference values (Table 10). However, the predicted mean content (23.9 mg.100 g-1 FW) was close to the mean content (21.0 mg.100 g-1 FW). The mean of the predicted values for the four target areas usually measured was 23.9 mg.100 g-1 FW [(24.8 + 22.3 + 20.2 + 28.4)/4], which was quite close to the mean content. Finally, the predicted value of the mean spectrum for the four target areas usually measured was 20.1 mg.100 g-1 FW, which was quite close to the mean of the predicted vitamin C content for the four target areas and close to the mean vitamin C content.
54For the other apples (with no reference values), the predicted values showed vitamin C content to be in the same range as that for apple no. 3. As observed for ‘Hidala’, the results showed that the means of the predicted values for the target areas usually measured were always close to the means of the predicted values of the entire apple. The differences between the mean of the predicted values for these target areas and the mean of the predicted values of the entire apple ranged from 2 to 7%.
55As concluded for the previous quality parameters analyzed, the results for both ‘Hidala’ and ‘Pilot’ varieties showed that using NIR to measure the four target areas in the equatorial region of the fruit was enough to predict the mean total vitamin C content of apples. It is however relevant to note that concentrations of vitamin C in apples (around 20 mg.100 g-1 for the varieties analyzed here) are very low to be detected by NIR. Indeed, NIR spectroscopy is unlikely to measure such low concentrations. It is generally accepted that only components at least at a mass concentration of 0.1% have a chance to be quantified by NIR (Lin et al., 2009). Consequently, it is very likely that the calibration models used here are related to another component, covariate of vitamin C. In this case, NIR spectroscopy can be used to measure indirectly its concentration.
4. Conclusion
56The analyses of reference values for the quality parameters show that there is intra-fruit variability in sugar and total polyphenol content and even more variability in vitamin C content. They also show that the difference between the mean value for the four target areas usually measured (longitudinal pieces 1, 3, 5 and 7 of the equatorial region of the fruit) and the mean value of the entire apple is small. Specific attention needs to be paid to the sampling of fruits used for vitamin C content analysis because the intra- and inter-fruit variability can be particularly high. This was discussed by Planchon et al. (2004). A mean value obtained with a representative sample of an apple is therefore enough to assess the variability within the fruit and to estimate, with precision, the content of the quality parameters (sugar, total polyphenols and vitamin C). It should be noted that the intra-fruit variability may be related to the position of the fruit within the tree. Indeed, the exposition of the fruit to the sun, its height in the tree (in the canopy or in the low part of the tree) and its relative distance to the trunk constitute factors susceptible to influence the distribution of quality parameters within the fruit. This reinforces the attention that should be paid when sampling fruits for analyses. In addition, only two varieties were investigated in this study. It is likely that the ‘variety’ factor also influences the distribution of quality parameters within the fruits. The intra-fruit variability may be more or less important according to the variety and the environmental conditions under which it is cultivated.
57The results on the intra-fruit variability highlighted in this study constitute elements to take into account to develop standardized sampling protocols when analyzing quality parameters of apples. However, the intra-fruit variability may be influenced by other factors, including environmental conditions, which has not been investigated in this study. Further research on this topic should be carried out in order to consider this source of variability in sampling protocols. From a spectroscopic point of view, it is particularly important to consider the intra-fruit variability when analyzing the quality parameters of apples with NIR, to avoid bias in the calibration steps.
58Analyses of the different regression methods reveal that MLR is generally better suited than PLS regression. For both the ‘Hidala’ and ‘Pilot’ varieties and for all quality parameters, the predicted value of the mean spectrum for the four target areas usually measured and the mean of the predicted values for the four target areas were always close, or very close, to the mean reference value. This clearly shows that the measurement of four target areas in the equatorial region is enough to predict, with precision, the quality parameters. The predicted value of the mean spectra in the four target areas usually measured was also always very close, or identical, to the mean of the predicted values for the four target areas. The two approaches are therefore similar and appropriate.
59In conclusion, NIR spectroscopy coupled with MLR method regression constitutes a good tool for predicting, directly or indirectly in the case of vitamin C, the quality parameters analyzed in this study. In further research, the reference analyses could be conducted on a representative sample of the apple and spectral measurements made at four points 45° from each other in the equatorial region of the apple.
60Acknowledgements
61This work was supported by the Moerman funds within the framework of the POMINNO project entitled “Recherche de méthodes rapides de sélection de variétés innovantes de pommes de qualités différenciées et adaptées à une agriculture durable”.
Bibliographie
Angra S.K., Dimri A.K. & Kapur P., 2009. Non-destructive evaluation of apples of different origin using Near Infrared filter based reflectance spectroscopy. Instrum. Sci. Technol., 37(2), 241-253.
Bobelyn E. et al., 2010. Postharvest quality of apple predicted by NIR-spectroscopy: study of the biological variability on spectra and model performance. Postharvest Biol. Technol., 55(3), 133-143.
Boyer J. & Liu R.H., 2004. Apple phytochemicals and their health benefits. Nutr. J., 3, 5-30.
Camps C., Siegrist J.-P. & Christen D., 2008. Qualité des fruits : mesure non destructive par spectroscopie proche infrarouge portable. Rev. Suisse Vitic. Arboric. Hortic., 40(3), 151-157.
Ciotti M. et al., 1998. Non-destructive determination of soluble solids in apple fruit by Near Infrared Spectroscopy (NIRS). Postharvest Biol. Technol., 14(1), 21-27.
Clark C.J., McGlone V.A. & Jordan R.B., 2003. Detection of brownheart in ‘Braeburn’ apple by transmission NIR spectroscopy. Postharvest Biol. Technol., 28(1), 87-96.
Flores K. et al., 2008. Prediction of total soluble solid content in intact and cut melons and watermelons using near infrared spectroscopy. J. Near Infrared Spectrosc., 16, 91-98.
Fu X., Ying Y., Zhou Y. & Xu H., 2008. Application of NIR spectroscopy for firmness evaluation of peaches. J. Zhejiang Univ. Sci., 9(7), 552-557.
Guillermin P. & Camps C., 2005. Detection of bruises on apples by Near Infrared Reflectance Spectroscopy. In: Mencarelli F. & Tonutti P., eds. Proceedings of the 5th International Postharvest Symposium, 6-11 June 2004, Verona, Italy. Acta Hortic., 682.
He Y., Li X. & Shao Y., 2007. Fast discrimination of apple varieties using Vis/NIR spectroscopy. Int. J. Food Prop., 10(1), 9-18.
Lammertyn J. et al., 1998. Non-destructive measurement of acidity, soluble solids, and firmness of Jonagold apples using NIR spectroscopy. Trans. ASAE, 41(4), 1089-1094.
Lateur M., 2003. The integration of different sectors is a key factor for the conservation, the evaluation and the utilization of our Belgian fruit tree biodiversity. Bull. Inst. R. Sci. Nat. Belg. Biol., 73, 85-95.
Lateur M. & Populer C., 1994. Screening fruit tree genetic resources in Belgium for disease resistance and other desirable characters. Euphytica, 77, 147-153.
Lateur M., Pissard A., Donis T. & Jamar L., 2009. Création et expérimentation de variétés de pommes adaptées à l’Agriculture Biologique. In : Actes des Journées Techniques Nationales Fruits et Légumes Biologiques, 8-9 December 2009, Paris, France. Paris : ITAB-GRAB, 39-47.
Lin H. & Ying Y., 2009. Theory and application of near infrared spectroscopy in assessment of fruit quality: a review. Sens. Instrum. Food Qual. Saf., 3, 130-141.
Liu Y.D. & Ying Y.B., 2004. Measurement of sugar content in Fuji apples by FT-NIR spectroscopy. J. Zhejiang Univ. Sci., 5(6), 651-655.
Liu Y.D., Ying Y.B. & Fu X.P., 2005. Prediction of valid acidity in intact apples with Fourrier transform Near Infrared Spectroscopy. J. Zhejiang Univ. Sci. B, 6(3), 158-164.
Liu Y.D., Ying Y.B. & Jiang H.Y., 2006. Rapid determination of maturity in apple using outlier detection and calibration model optimization. Trans. ASABE, 49(1), 91-95.
Liu Y.D., Ying Y.B., Fu X.P. & Lu H.S., 2007. Experiments on prediction sugar content in apples by FT-NIR technique. J. Food Eng., 80(3), 986-989.
Lu R.F., 2004. Multispectral imaging for predicting firmness and soluble solids content of apple fruit. Postharvest Biol. Technol., 31(2), 147-157.
Lu R., Guyer D.E. & Beaudry R.M., 2000. Determination of firmness and sugar content of apples using Near-Infrared Diffuse Reflectance. J. Texture Stud., 31, 615-630.
Mehinagic E. et al., 2003. Relationship between sensory analysis, penetrometry and visible – NIR spectroscopy of apples belonging to different cultivars. Food Qual. Preference, 14, 473-484.
Nicolaï B. et al., 2006. Non-destructive measurement of bitter pit in apple fruit using NIR hyperspectral imaging. Postharvest Biol. Technol., 40(1), 1-6.
Nicolaï B. et al., 2007. Non-destructive measurement of fruit and vegetable quality by means of NIR spectroscopy: a review. Postharvest Biol. Technol., 46(2), 99-118.
Park B. et al., 2003. Near-Infrared diffuse reflectance for quantitative and qualitative measurement of soluble solids and firmness of Delicious and Gala apples. Trans. ASAE, 46(6), 1721-1731.
Paz P. et al., 2009. Evaluating NIR instruments for quantitative and qualitative assessment of intact apple quality. J. Sci. Food Agric., 89, 781-790.
Peirs A. et al., 2003. Effect of biological variability on the robustness of NIR models for soluble solids content of apples. Postharvest Biol. Technol., 28(2), 269-280.
Planchon V. & Lateur M., 1999. The use of apple and pear genetic resources for selecting partially disease - resistant cultivars suitable for juice processing. In: Michalczuk L. & Plocharski W., eds. Fruit and vegetables juices and drinks - Today and in the XXI Century. Rytro, Poland: Ministry of Agriculture and Rural Development of Poland, 237-242.
Planchon V., Lateur M., Dupont P. & Lognay G., 2004. Ascorbic acid level of Belgian apple genetic resources. Sci. Hortic., 100, 51-61.
Qing Z., Ji B. & Zude M., 2008. Wavelength election for predicting physicochemical properties of apple fruit based on Near-Infrared Spectroscopy. J. Food Qual., 30, 511-526.
Romnée J.-M. et al., 2009. Ascorbic acid detection and quantification in apples: application of a UPLC-MSMS method, http://www.aoaceurope.com/2009/ROMNEE2.pdf, (10.06.2011).
Sanchez N.H., Lurol S., Roger J.M. & Bellon-Maurel W., 2003. Robustness of models based on NIR spectra for sugar content prediction in apples. J. Near Infrared Spectrosc., 11, 97-107.
Sinnaeve G. et al., 2009. Use of NIR spectroscopy for the determination of internal quality of entire apples, http://orbi.ulg.ac.be/handle/2268/25464, (10.06.2011).
Vanzani P. et al., 2005. Major phytochemicals in apple cultivars: contribution to peroxyl radical trapping efficiency. J. Agric. Food Chem., 53, 3377-3382.
Vaysse P. & Landry P., 2004. Pomme-poire de la récolte au conditionnement. Outils pratiques. Paris : Centre Technique Interprofessionnel des Fruits et Légumes (Ctifl).
Vrohvsek U., Rigo A., Tonon D. & Mattivi F., 2004. Quantitation of polyphenols in different apple varieties. J. Agric. Food Chem., 52(21), 6532-6538.
Westwood M.N., 1993. Temperate-zone pomology. Physiology and culture. 3rd ed. Portland, OR, USA: Timber Press, Inc.
Zude M. et al., 2006. Non-destructive tests on the prediction of apple fruit flesh firmness and soluble solids content on tree and shelf life. J. Food Eng., 77(2), 254-260.
Pour citer cet article
A propos de : Audrey Pissard
Walloon Agricultural Research Center (CRA-W). Life Sciences Department. Breeding and Biodiversity Unit. Rue de Liroux, 4. B-5030 Gembloux (Belgium). E-mail: a.pissard@cra.wallonie.be
A propos de : Vincent Baeten
Walloon Agricultural Research Center (CRA-W). Valorisation of Agricultural Products Department. Food and Feed Quality Unit. Chaussée de Namur, 24. B-5030 Gembloux (Belgium).
A propos de : Jean-Michel Romnée
Walloon Agricultural Research Center (CRA-W). Valorisation of Agricultural Products Department. Agricultural Product Technology Unit. Chaussée de Namur, 24. B-5030 Gembloux (Belgium).
A propos de : Pascal Dupont
Walloon Agricultural Research Center (CRA-W). Life Sciences Department. Breeding and Biodiversity Unit. Rue de Liroux, 4. B-5030 Gembloux (Belgium).
A propos de : Anne Mouteau
Walloon Agricultural Research Center (CRA-W). Valorisation of Agricultural Products Department. Food and Feed Quality Unit. Chaussée de Namur, 24. B-5030 Gembloux (Belgium).
A propos de : Marc Lateur
Walloon Agricultural Research Center (CRA-W). Life Sciences Department. Breeding and Biodiversity Unit. Rue de Liroux, 4. B-5030 Gembloux (Belgium).
