


- Startpagina tijdschrift
- volume 16 (2012)
- numéro 4
- Effect of water stress on growth, water consumption and yield of silage maize under flood irrigation in a semi-arid climate of Tadla (Morocco)


Weergave(s): 7348 (62 ULiège)
Download(s): 517 (2 ULiège)

Effect of water stress on growth, water consumption and yield of silage maize under flood irrigation in a semi-arid climate of Tadla (Morocco)

Nota's van de redactie
Received on October 11, 2011; accepted on March 21, 2012
Résumé
Effet du déficit hydrique sur le maïs ensilage conduit sous irrigation gravitaire au périmètre irrigué de Tadla (Maroc). L’étude de la réponse des cultures au déficit hydrique est importante pour maximiser les rendements et améliorer l’efficience d’utilisation de l’eau en agriculture dans les zones où les ressources hydriques sont de plus en plus limitées. Cette étude a été réalisée durant deux campagnes agricoles (2009 et 2010) dans l’objectif d’étudier l’effet du déficit hydrique sur la croissance, la consommation en eau et le rendement en matière sèche du maïs ensilage (Zea mays L.) alimenté par l’irrigation gravitaire sous le climat semi-aride de la région de Tadla au Maroc. Quatre à cinq régimes hydriques définis sur la base de coefficients qui affectent l’évapotranspiration (ETc) de la culture (100 %, 80 %, 60 %, 40 % et 20 % ETc) ont été comparés. Les mesures ont porté sur l’humidité du sol, la croissance et le rendement final en matière sèche. Les résultats ont montré que le déficit hydrique affecte la croissance en hauteur des plants, accélère la sénescence des feuilles et réduit l’indice foliaire. Les rendements en matière sèche ont varié de 5,3 t·ha-1 sous T4 (40 % ETc) à 16,4 t·ha-1 sous T1 (100 % ETc) en 2009, alors qu’en 2010, ils ont oscillé entre 3,9 t·ha-1 sous T5 (20 % ETc) à 12,5 t·ha-1 sous T1 (100 % ETc). L’établissement des bilans hydriques par phase de croissance a montré que l’efficience d’utilisation de l’eau est plus élevée durant la phase linéaire de croissance. L’efficience d’utilisation de l’eau calculée à la récolte varie entre 2,99 kg·m-3 sous T1 à 1,84 kg·m-3 sous T5. L’évapotranspiration réelle sous T1 (100 % ETc) est de 478 mm et 463 mm en 2009 et 2010, respectivement. En combinant les résultats des deux années, une relation linéaire a été établie entre le rendement en matière sèche et la consommation en eau. La valeur du coefficient de réponse (Ky) du maïs ensilage des deux campagnes 2009-2010 combinées est 1,12. Sous un climat semi-aride tel que celui de Tadla, le maïs ensilage doit être irrigué en priorité par rapport aux cultures ayant un Ky inférieur à 1,12 tout en appliquant le maximum d’arrosage disponible durant la phase de croissance linéaire de cette culture.
Abstract
The field study of crop response to water stress is important to maximize yield and improve agricultural water use efficiency in areas where water resources are limited. This study was carried out during two growing periods in 2009 and 2010 in order to study the effect of water stress on crop growth, water consumption and dry matter yield of silage maize (Zea mays L.) supplied with flood irrigation under the semi-arid climate of Tadla in Morocco. Four to five irrigation treatments were applied at the rates of 100, 80, 60, 40 and 20% crop evapotranspiration (ETc) of maize. Soil water status, crop growth, leaf area index and above-ground biomass were measured. Results showed that irrigation deficit affected plant height growth, accelerated the senescence of the leaves and reduced the leaf area index. The maximum values of this parameter reached at flowering under the full irrigation treatment (100% ETc) were 5.1 and 4.8 in 2009 and 2010, respectively. Dry matter yields varied from 5.3 t·ha-1 under T4 (40% ETc) to 16.4 t·ha-1 under T1 (100% ETc) in 2009, whereas in 2010, it oscillated between 3.9 t·ha-1 under T5 (20% ETc) to 12.5 t·ha-1 under T1 (100% ETc). The establishment of the water budget by growth phase showed that the water use efficiency was higher during the linear phase of growth. Water use efficiency calculated at harvest varied between 2.99 kg·m-3 under T1 to 1.84 kg·m-3 under T5. The actual evapotranspiration under T1 (100% ETc) was 478 mm and 463 mm in 2009 and 2010, respectively. Using the averaged values of the two years, linear relationships were evaluated between dry matter yield and water consumption ETa. The yield response factor (Ky) for the silage maize for both growth seasons was 1.12. Under the Tadla semi-arid climate, it is proposed that silage maize should be irrigated as a priority before other crops with a Ky lower than 1.12. It is also recommended that, under limited water supplies, irrigation be applied during the linear phase of growth of this crop.
Inhoudstafel
1. Introduction
1Water is the main factor limiting yield production in arid and semi-arid regions. When water resources are a factor limiting yield production, irrigation programming is essential in order to maximize production per m3 of irrigation water (Doorenbos et al., 1979). Deficit irrigation is one way of maximizing water use efficiency (Bekele et al., 2007).
2The water requirements of maize (Zea mays L.) for all growing cycles vary from 500 to 800 mm (Brouwer et al., 1986). Under the semi-arid climate of North India, Narandra et al. (2002) determined the crop evapotranspiration (ETc) of maize at 354 mm. Water stress has an important effect on water consumption and maize yield. A positive linear relationship between grain yield and water use has been recognized by several authors (Gencoglan et al., 1999; Istanbulluoglu et al., 2002; Fatih et al., 2008). Doorenbos et al. (1979) established a relationship between amount of water applied and yield, which can be used to predict yield per applied water unit. The determination of water use efficiency is essential to evaluate crop productivity in arid regions where water is a limiting factor (Johnson et al., 2002).
3The irrigated perimeter of Tadla is situated in a zone of semi-arid climate and is also one of the main cattle rearing regions of Morocco. In terms of acreage, silage maize is the fodder crop most commonly produced after alfalfa. The silage maize growing area has been continuously increasing in the last few years and now constitutes approximately 1,500 ha (ORMVAT, 2009).
4In this region, except for the rainy period, which extends from December to February, irrigation from water stored in the dam is necessary for agricultural production during the remainder of the year. However, water scarcity in the region during the last few years has imposed a reduction on the number of irrigations allocated to summer crops such as silage maize and alfalfa. The planning of irrigation according to the water stress tolerance and water use efficiency of crops remains the only way to guarantee the continuity of production in an arid climate such as the one found in the irrigated perimeter of Tadla.
5Yield response to water depends on many factors and may vary from region to region. There is therefore a need for studies to be conducted locally, and this applies to the region of Tadla where the silage maize response to water has not yet been studied.
6The objectives of this study were:
7– to determine the effect of water deficit on growth factors, yield biomass and water use efficiency of silage maize in the semi-arid conditions of Tadla;
8– to determine the yield response factor (Ky) useful for establishing irrigation scheduling programs in the study area.
2. Materials and methods
9This study was carried out during the growing periods of 2009 and 2010 at the experimental station in Tadla, Morocco (X = 32.3°; Y = 6.31'; Z = 450 m) run by the National Institute of Agronomic Research (INRA). The soil was classified as luvisols chromic, according to Badraoui et al. (2001). The climate in this area is arid with a great irregularity of rains. Average annual pluviometry is about 268 mm; average temperature is 18 °C, with a maximum in August that often exceeds 45 °C and a minimum in January of approximately 0 °C.
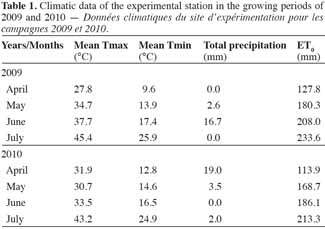
10The climatic variables for the growing periods during the experimental years are shown in table 1. The climatic data were collected from a local meteorological station. According to table 1, during the period of growth of silage maize (April-July), the temperatures were high, with maxima exceeding 40 °C. This period is characterized by hot and dry winds, locally called Chergui. Precipitations were few or absent.
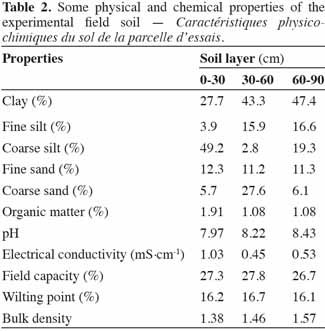
11Before starting the experiment, soil samples were collected with an auger from soil layers at 0-30, 30-60 and 60-90 cm for analyses. Physical and chemical properties of the soil are presented in table 2.
12The experiment was laid out in a total randomized design with three replications. The studied factor was irrigation treatment. Four irrigation regimes were established on the basis of coefficients (Kr) affecting maximal evapotranspiration of silage maize (ETc). Irrigation treatments were 100%, 80%, 60% and 40% ETc for T1, T2, T3 and T4, respectively. In 2010, a T5 treatment corresponding to 20% ETc was added. The whole experimental plot area was 2,500 m2. In line with local flood irrigation practices, the irrigation devices were traditional basins of 60 m2 (5 m × 12 m). Spaces of 10 m were established between the plot treatments in order to minimize the risk of water transfer between treatments.
13Following the basin irrigation technique, a flow rate of 12 l·s-1 was applied on one side of the basin until it was fully filled. Before sowing, fields were prepared with a disk plough (at a 25 cm depth) followed by two passages of cover crop (at a 15 cm depth). These tillage operations allowed the removal of weeds and the preparation of the seed bed. For both years, silage maize was planted in rotation with berseem (Trifolium alexandrinum L.). The late variety Zea mays L. Cecilia was used. This variety was obtained by single cross and was imported from France. The seeds were sown at a 4 cm (± 5%) depth with a seed drill on 24 April 2009 and on 15 May 2010. The plants were grown in rows and the distance between rows was 70 cm. The spacing between plants within each row was 20 cm. Before sowing, 70 kg·ha-1 N and 82 kg·ha-1 P2O5 (Urea + Diammonium phosphate) were applied to all plots. At the 6 leaves stage, 65 kg·ha-1 N was added. Insecticides were applied to limit the effect of pests.
14Theoretical water deficit (TWD, mm) for each treatment was calculated by:
15TWD = ETc * kr and ETc = Kc.ajst * ET0
16where Kc.ajst is a crop coefficient adjusted using the methods given in FAO paper no 56 (Allen et al., 1998), ET0 is the reference evapotranspiration (mm·day-1); ETc is the maximal evapotranspiration (mm·day-1); Kr is the reduction coefficient which defines irrigation treatments. Kr was set to 1, 0.8, 0.6, 0.4 and 0.2 for T1, T2, T3, T4 and T5, respectively. ET0 was calculated using the FAO Penman Monteith equation given by Allen et al. (1998):
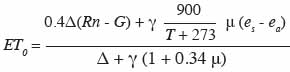
17where ET0 is the reference evapotranspiration (mm·day-1), Rn is net radiation at the crop surface (MJ·m-2·day-1), G is the soil heat flux density (MJ·m-2·day-1), T is the mean daily air temperature at 2 m height (°C), μ is the wind speed at 2 m height (m·s-1), es is the saturation vapor pressure (kPa), ea is the actual vapor pressure (kPa), (es - ea) is the saturation vapor pressure deficit (kPa), Δ is the slope of the saturation vapor pressure curve (kPa·°C-1), and γ is the psychrometric constant (kPa·°C-1).
18Irrigation was applied for each treatment when cumulative TWD reached 35 mm at the beginning of the vegetative period and 75 mm thereafter. This value corresponds to the easily usable soil water reserve at a 1 m depth. In this situation, the number of irrigation events and of intervals between them varies between treatments. Water supplied by a dam located at 20 km was of high quality with an electrical conductivity of 0.4 dS·m-1 and a pH of 7.2.
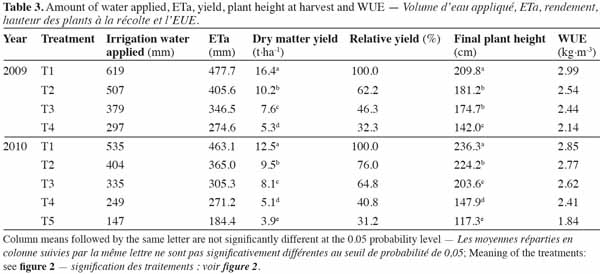
19Observations on plants at each treatment were carried out weekly (4 to 5 days at the beginning) from emergence until harvest. The phenological monitoring of stages is based on the number of visible leaves. A leaf is noted as visible when the apical end of the lamina points out of the whorl (Girardin et al., 1986). On the central row of each elementary plot, 10 consecutive plants were selected and marked for monitoring of the emission rhythm of leaves and the evolution of the apparent height of the plants.
20The dry matter evolution was monitored weekly from samples from 10 consecutive plants removed at ground level from the central rows for each treatment. Crop samples were weighed after oven-drying at 80 °C for 48 h. The leaf area index (LAI) was measured weekly by an LAI-2200 plant canopy analyzer (LI COR). This instrument contains the necessary electronics to measure, record and compute the final results of LAI in the field.
21Harvest was carried out when plants under treatment T1 (100% ETc) reached the pasty milky grain stage (approximately 90 days after sowing). Fresh yield was measured in six small plots of 8.4 m2 (2.1 m × 4 m) for each treatment. The following parameters were measured for each sample: total weight of aerial fresh matter, final plant height, number of green leaves per plant and dry matter rate. The aerial dry matter was also measured after drying samples at 80 °C for 72 h.
22Crop water consumption is based on the soil water balance equation, according to Garrity et al. (1982) and James (1988) :

23where ETa is the actual evapotranspiration (mm), P is the precipitation (mm), I is the amount of irrigation water applied (mm), Rc is the capillary rise (mm), D is the amount of drainage water beyond the rooting depth, ΔS is the variation in the soil water content (mm) and R is the amount of runoff (mm). Change in the soil water content was measured 2 to 3 times each month, and at final harvest. A conventional oven-drying (gravimetric) method was used to evaluate soil water content at soil layers 0-20, 20-40, 40-60, 60-80, 80-100 and 100-120 cm. Runoff R was neglected since blocked basins were used to irrigate. Capillary rise was considered as negligible because the water table was deep.
24Drainage water was determined by monitoring of the zero flux planes under each irrigation treatment. For this purpose, tensiometers were installed at soil depths of 20, 40, 60, 80, 100 and 120 cm. Water use efficiency (kg·m-3) was calculated by dividing total dry matter yield (kg·ha-1) by ETa (mm) (Howell et al., 1990; Scott, 2000).
25The relationship between relative evapotranspiration reduction (1 - ETa/ETc) and relative biomass yield reduction (1 - Yr/Ym) was determined using the method given by Doorenbos et al. (1979). The equations are as follows:
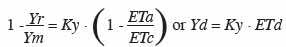
26where Ya is actual harvested biomass yield, Ym is maximum harvested biomass yield, Ky is the yield response factor, ETa is the actual evapotranspiration, ETc is the maximal evapotranspiration, Yd is the relative yield reduction, and ETd is the relative evapotranspiration reduction.
27Doorenbos et al. (1979) stated that, when Ky < 1, the biomass yield loss is less important than the evapotranspiration deficit; when Ky > 1, the biomass yield loss is more important than the evapotranspiration deficit; and when Ky = 1, the biomass yield loss is equal to the evapotranspiration deficit (line 1:1).
28Analysis of the data obtained from our experiments was performed through an analysis of variance (ANOVA) and the test of the least significant difference (LSD) (Cochran et al., 1957), using the SAS software.
3. Results
3.1. Effect of the irrigation regime on plant height growth and dry matter accumulation
29Results show that the evolution curves of height vs thermal time (°C day) from emergence to harvest had a sigmoid shape (Figure 1). Using a graphic method (Fournier et al., 2000; Birch et al., 2002), we found the usual three phases of growth: an exponential phase with slow growth from emergence until stage 9 leaves in 2009 and until 8 leaves in 2010. During this first period of growth, the effect of the irrigation mode was found to be not significant. The plant height average at the end of this phase was 25.1 and 24.3 cm in 2009 and 2010, respectively.
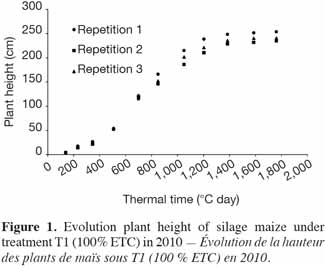
30Taking a base temperature of 6 °C (Khaledian et al., 2009) for this variety, the 2nd stage of growth started at thermal time 380 to 400 °C day and finished at the flowering stage (emergence of the tassel), which occurred at thermal time 1,253 °C day in 2009 and 1,263 °C day in 2010. The 2nd phase was characterized by a linear growth with a more or less high slope according to the irrigation treatment. The statistical analysis of plant heights measured at the end of this phase showed a highly significant (P < 0.01) effect of irrigation mode. Height averages obtained were 242, 203, 191 and 163 cm in 2009 and 239, 187, 161 and 122 cm in 2010 for T1, T2, T3 and T4, respectively. The 3rd phase of growth was marked by a quasi-stagnation of height evolution until the final harvest, which coincided with the stage pasty milky grain at thermal time 1,842 °C in 2009 and 1,851 °C in 2010.
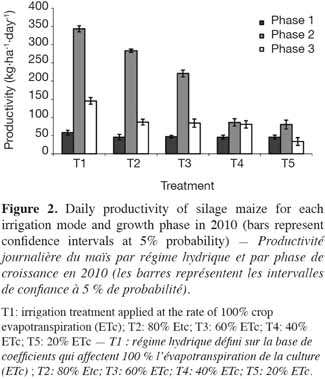
31Average daily accumulation of dry matter (DM) was calculated using samples of plants removed in 2010 for each of the growth phases described previously. During the first phase, average daily growth was weak (Figure 2) without showing significant differences (5%) between irrigation modes. The average daily growth during this stage was 49 kg·ha-1·day-1. As for the 2nd phase, daily accumulation of dry matter decreased with the level of water stress with highly significant differences (P < 0.01) between treatments. The calculated average values were 343, 283, 221, 86 and 80 kg·ha-1·day-1 under T1, T2, T3, T4 and T5, respectively. In the 3rd phase, growth was also influenced by irrigation mode with low average values compared to the 2nd phase. Average values obtained were 145, 87, 84, 81 and 34 kg·ha-1·day-1 under T1, T2, T3, T4 and T5, respectively.
3.2. Evolution of leaf area index and number of green leaves
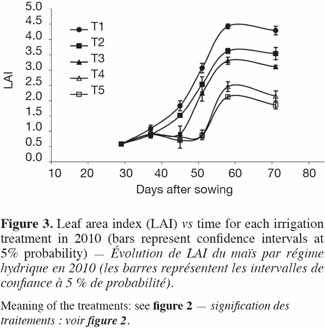
32Figure 3 shows the trend in the leaf area index (LAI) during the growth periods in 2010 for the compared irrigation treatments. These results show that under each irrigation mode, LAI increased from emergence onwards and that maximum values were reached at the flowering stage. The leaf area index always remained lower under the most water stressed treatments. Plant density evaluated after emergence was 8.7 (plants per m2) on average. The maximum average LAI values obtained in 2009 were 4.8, 4.2, 3.2, 2.3 and 1.9 for T1, T2, T3, T4 and T5, respectively. LAI values measured at flowering in 2009 were relatively higher compared to those of 2010 and were 5.1, 4.4, 3.9 and 3.4 under T1, T2, T3 and T4, respectively. Statistical analysis of the values measured at flowering for the two years showed that the effect of water stress was significant (P < 0.05), with a higher reduction in LAI with a higher level of water stress. After flowering, LAI values decreased whatever the irrigation treatment at a more or less high rate according to the irrigation strategy. This reduction can be explained by the end of the emergence of new leaves after emergence of the tassel but also by senescence of the old leaves, which is accelerated by water stress.
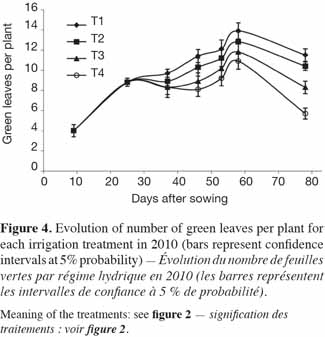
33Figure 4 gives the evolution of the average number of green leaves per plant according to irrigation modes compared in 2010. The number of green leaves per irrigation treatment at flowering was significantly (P < 0.05) affected by water stress. The number of green leaves per plant was on average 13.9, 12.8, 11.8 and 10.9 for T1, T2, T3 and T4, respectively.
3.3. Water applied and actual evapotranspiration
34The amount of irrigation water and actual evapotranspiration (ETa) values are presented in table 3. Applied irrigation water and ETa values in the 2009 growing period were higher than in 2010. This may be attributed to the differences in climatic conditions and in growing period duration. The average temperatures and climatic demand (ET0) were higher in 2009 (Table 1). The total crop growing period in 2009 (90 days) was slightly longer than in 2010 (79 days). Under the full irrigation treatment T1 (100% ETc), the amount of irrigation water applied and the ETa values were 619.3 and 477.7 mm in 2009 and 535.0 and 463.0 mm in 2010, respectively. As expected, the highest ETa values occurred in T1 (100% ETc), obviously owing to an adequate soil water supply during the growing period. Other irrigation strategies caused a certain amount of water deficit and consequently a lower ETa value. The lowest ETa value was observed under the most stressed treatments, 274.6 mm under T4 in 2009 and 184 mm under T5 in 2010.
3.4. Effect of irrigation mode on dry matter yield and plant height at harvest
35Results obtained over two years (Table 3) show that dry matter yield and plant height were significantly (P < 0.01) affected by water stress and that the highest values were obtained under T1 (100% ETc). Increasing water deficits induced a relative reduction in dry matter yield and plant height. In 2009, the levels of saved water were 20% (T2), 40% (T3) and 60% (T4) of T1, while the rates of reduction in average dry matter yield were 38, 54 and 68% of that obtained under T1 (100% ETc), respectively. In 2010, levels of saved water were 20% (T2), 40% (T3), 60% (T4) and 80% (T5) of T1, and the rates of decrease in average dry matter yield were found to be 24%, 35%, 59% and 69% of that obtained under T1, respectively. The ratio of reduction in yield varied from one irrigation mode to another.
3.5. Relationship between water and dry matter yield
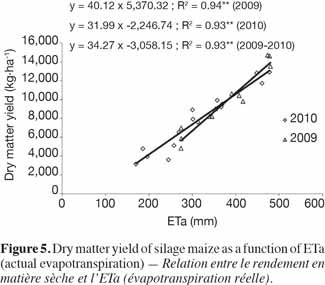
36The relationships between ETa value (mm) and dry matter yield (kg·ha-1) were evaluated for 2009, 2010 and 2009-2010. The relationship between evapotranspiration and dry matter yield was found to be linear (P < 0.01). The equation for the relationship was Ya = 31.9 * Eta - 2,246.7 with R2 = 0.93 for 2009; Ya = 40.1 * Eta - 5,370 with R2 = 0.94 for 2010 and Ya = 34.3 * Eta - 3,058 with R2 = 0.93 for 2009-2010, as seen in figure 5.
37Water use efficiency (WUE), calculated by dividing dry matter yield (kg·ha-1) by evapotranspiration (mm), was found to vary and to depend on the irrigation mode (Table 3). The lowest WUE value was obtained under the highest stress treatment (T5) in 2010. For both years, WUE increased with the amount of irrigation water, showing that dry matter (DM) accumulation was increased by irrigation.
38Water use efficiency was also found to vary depending on the growth phase (Figure 6). The linear phase of growth was characterized by the highest WUE values under treatment mode T1 followed by modes T2 and T3. Variance analysis showed that differences between treatments were non-significant in the 1st phase, significant (5%) in the 2nd phase and non-significant in the 3rd phase. Water use efficiency decreased with the level of water stress in the 2nd phase.
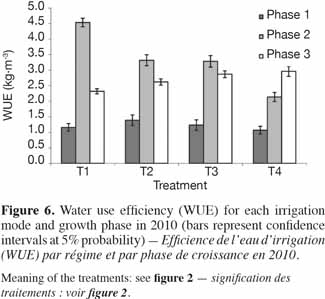
39In the 2nd phase of growth, plants under treatment modes T2 and T3 received two irrigations and expressed a similar level of water valorization at 3.32 and 3.28 kg·m-3, respectively. However, treatment T1 also received two irrigations with a higher valorization than T2 and T3, since it received further irrigation just before the end of the first phase (irrigation at 31 days after sowing). In the 3rd phase, the two irrigations allocated to T1 were less valorized compared with T3 and T4, which did not receive water at this stage. This was also true for T2, which received irrigation at the beginning of the 3rd phase.
3.6. Yield response factor (Ky) to water
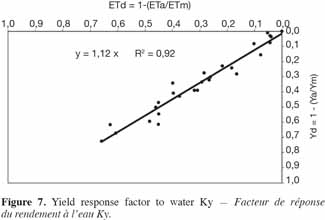
40The yield response factor (Ky) to water was calculated by combining the results of 2009 and 2010. Relative total dry matter yield (Yd) and relative actual evapotranspiration (ETd) were used to determine relative biomass yield reduction (1 - Yd) and relative evapotranspiration reduction (1 - ETd). A linear regression equation was adjusted to the data (Figure 7). The Ky value of the silage maize to water deficit for the whole growing season was 1.12, the coefficient of determination (R2) was 0.92, and the relationship was statistically significant at the level of P < 0.05.
4. Discussion
41The monitoring of plant height evolution and biomass accumulation allowed us to distinguish three phases of growth characterized by their appearance during thermal time. Daily accumulation of dry matter was found to decrease according to the level of water stress with highly significant differences (P < 0.01) between treatments. Under treatment T1, the average daily growth was 49, 343 and 145 kg·ha-1·day-1 for the 1st, 2nd and 3rd phase, respectively.
42The leaf area index (LAI) followed the same trend as plant height and was found to be significantly affected by water stress. The LAI was found always to remain lower under the most water stressed treatments. This result is in accordance with Pandey et al. (2000), who reported that the highest LAI value for grain maize was obtained under conditions of full irrigation (without water stress). In the present study, the maximal LAI measured at flowering in 2010 was 5.1. Narandra et al. (2002) found that the maximal LAI value of grain maize under a semi-arid climate in India was reached at flowering and that the value varied between 5.1 and 5.5.
43In the present study, the number of green leaves per plant was significantly (P = 0.05) affected by water stress. Water stress caused the number of leaves on the plant to decrease. Mollier (1999) identified the components of the LAI as the rate of leaf emergence, the individual surface area of the leaves and their rate of senescence. As the plant density was the same for all treatments in the present study, it cannot explain the variation in LAI between the different treatments. Although senescence of leaves is a normal physiological phenomenon for maize, its intensity is accentuated by water stress.
44Actual evapotranspiration (ETa) calculated for silage maize in this study was affected by the type of irrigation treatment. ETa ranged between 478 mm under T1 in 2009 and 184 mm under T5 in 2010, varying according to the irrigation strategy and irrigation technique used. Istanbulluoglu et al. (2002) found that, under furrow irrigation, the evapotranspiration of maize obtained was 586 mm for a full irrigation regime and 353 mm for a non-irrigation treatment in Tekirdag (Turkey). Using a sprinkler system in Nebraska, Payero et al. (2006) found that evapotranspiration of maize varied between 625 and 366 mm depending on the different irrigation treatments used. The relatively lower values of ETa obtained in the present study in Tadla, Morocco can be attributed to the relative lower efficiency (about 68%) of the traditional technique of flood irrigation (Bouazzama et al., 2007).
45In the present study, dry matter yield and plant height at harvest were significantly (P < 0.01) affected by water stress. Biomass yield ranged from 3.9 t·ha-1 under T5 in 2010 to 16.4 t·ha-1 under T1 in 2009. Results obtained are in accordance with those reported by several authors on the effect of water stress on biomass accumulation in maize. Otegui et al. (1995) and Istanbulluoglu et al. (2002) reported that water deficit reduced the plant height of maize. Wagger et al. (1993) found that silage yields for full and no irrigation plots were significantly different. Emile et al. (2006) determined the dry matter yield for irrigated maize as 20.1 t·ha-1 in France. In Romania, the dry matter yield of silage maize was found to be 0.2 t·ha-1 without irrigation and more than 10.7 t·ha-1 with irrigation (Naescu, 2000). Water stress causes a decrease in the leaf area index (Jamieson et al., 1995; Stone et al., 2001), resulting in a decrease in the rate of photosynthesis, and this contributes to a reduction in biomass yield. The dry matter production of non-stressed plants is usually high compared to stressed plants; this is because water-stressed plants cannot use solar radiation effectively (Kiniry et al., 1989; Muchow et al., 1990).
46Results from the present study allow us to establish a linear relationship between water consumption and the biomass yield of silage maize. Several authors have confirmed the linearity of the relationship between water consumption and the grain yield of maize (Gencoglan et al., 1999; Istanbulluoglu et al., 2002; Kirnak et al., 2003; Cakir, 2004; Dagdelen et al., 2006; Payero et al., 2006). According to these authors, this relationship varies according to the climate and to the variety of maize. Overman et al. (2002) confirmed the linear relationship in maize between the response of grain and silage yield and irrigation mode.
47Our results confirmed a variation in water use efficiency (WUE) according to the type of irrigation treatment applied. Water stress was found to reduce significantly WUE. The values obtained ranged between 2.99 kg·m-3 under T1 in 2009 and 1.84 kg·m-3 under T5 in 2010. In Turkey, Fatih et al. (2008) found that the WUE of silage maize depended on irrigation mode, ranging between 0.32 kg·m-3 without irrigation and 1.53 kg·m-3 at full irrigation. However, in Lebanon, Karam et al. (2003) found that the WUE calculated for aboveground dry matter of maize at full irrigation was 3.23 kg·m-3.
48In the present study, the calculation of WUE by growth phase showed that silage maize used water efficiently during the 2nd phase of growth. This result has important implications for the management of water allocation and irrigation programming in situations of water scarcity.
49The yield response factor (Ky) calculated for silage maize in Tadla was 1.12. This value is slightly lower than the Ky reported by Doorenbos et al. (1979), which was 1.25 for the total growing season of maize. Studies in different regions of Turkey have shown that this coefficient varies according to growth stage and zone 1.08–1.61 (Gencoglan et al., 1999), 0.76 (Istanbulluoglu et al., 2002), 0.77–0.81 (Kirnak et al., 2003), 0.81–1.36 (Cakir, 2004) and 1.03–1.04 (Dagdelen et al., 2006).
50The yield response factor is an essential tool in the planning of irrigation within an irrigated perimeter and at farm level. In the case of the Tadla irrigated perimeter, a comparison between the Ky of silage maize and that of other crops planted simultaneously implied that silage maize should be irrigated as a priority before other crops with a Ky of lower than 1.12.
51Water scarcity is known to occur in the Tadla irrigated perimeter as in other perimeters in Morocco. This imposes restrictions on the management services of the collective irrigation system and thereby limits the number of irrigations allocated to summer crops such as silage maize. The study of the effect of irrigation mode on crop growth and water consumption by this crop has a double interest:
52– to maximize biomass yield and water use efficiency. For this purpose, it is necessary to irrigate silage maize as a priority before other crops that are more tolerant to water stress (with a Ky of lower than 1.12). It is also recommended that the allocation of irrigations target the linear phase of growth, as this improves water use efficiency;
53– to establish local references useful for silage maize growth modeling. This will make possible the establishment of irrigation scenarios and the extrapolation of the results to other zones in Morocco with a similar climate and limited water resources.
54Acknowledgements
55The study which leads to this paper was partly funded by two cooperation programs: a PRAD joint program supported by the Ministry of Agriculture of Morocco and the French Foreign Office and a cooperation program supported by the Belgian government through Agence Belge de Développement (CTB).
Bibliographie
Allen R.G., Pereira L.S., Raes D. & Smith M., 1998. Crop evapotranspiration: guidelines for computing crop water requirements. Irrigation and Drainage Paper No. 56. Roma: FAO.
Badraoui M. & Stitou M., 2001. Status of soil survey and soil information systems in Morocco. Options Mediterr. Ser. B, 34, 193-204.
Bekele S. & Tilahun K., 2007. Regulated deficit irrigation scheduling of onion in a semi-arid region of Ethiopia. Agric. Water Manage., 98(1-2), 148-152.
Birch C.J., Andrieu B. & Fournier C., 2002. Dynamics of internode and stem elongation in three cultivars of maize. Agronomie, 22, 511-524.
Bouazzama B., Xanthoulis D. & Bouaziz A., 2007. Validation du modèle SIRMOD pour améliorer les performances de l’irrigation de la luzerne par la Robta au niveau du périmètre irrigué de Tadla. Hommes Terre Eaux, 136, 8-16.
Brouwer C. & Heibloem M., 1986. Irrigation water management: irrigation water needs. Training manual No. 3. Roma: FAO.
Cakir R., 2004. Effect of water stress at different development stages on vegetative and reproductive growth of corn. Field Crops Res., 89, 1-16.
Cochran W. & Cox G., 1957. Experimental Design. New York, USA: Wiley.
Dagdelen N., Yilmaz E., Sezgin F. & Gurbuz T., 2006. Water-yield relation and water use efficiency of cotton (Gossypium hirsutum L.) and second crop corn (Zea mays L.) in western Turkey. Agric. Water Manage., 82, 63-85.
Doorenbos J. & Kassam A.H., 1979. Yield response to water. Irrigation and Drainage Paper No. 33. Roma: FAO.
Emile J.C. et al., 2006. Grain sorghum silages as an alternative to irrigated maize silage. In: Proceedings of the 21st general meeting of the European Grassland Federation, April 3-6, Badajoz, Spain.
Fatih M.K., Ustun S., Yasemin K. & Talip T., 2008. Determining water-yield relationship, water use efficiency, crop and pan coefficients for silage maize in a semi-arid region. Irrig. Sci., 16, 112-123.
Fournier C. & Andrieu B., 2000. Dynamic of the elongation of internodes in maize (Zea mays L.): analysis of phases of elongation and their relationships to phytomer development. Ann. Bot., 86, 551-563
Garrity P.D., Watts D.G., Sullivan C.Y. & Gilley J.R., 1982. Moisture deficits and grain sorghum performance: evapotranspiration yield relationships. Agron. J., 74, 815-820.
Gencoglan C. & Yazar, 1999. The effects of deficit irrigations on corn yield and water use efficiency. Turk. J. Agric. For., 23, 233-241.
Girardin P., Jordan M.O., Picard D. & Trendel R., 1986. Harmonisation des notations concernant la description morphologique d’un pied de maïs (Zea mays L.). Agronomie, 6, 873-875.
Howell T.A., Cuenca R.H. & Solomon K.H., 1990. Crop yield response. In: Hoffman G.J., Howell T.A. & Solomon K.H., eds. Management of farm irrigation systems. ASAE Monograph No. 9. St. Joseph, MI, USA: American Society of Agricultural Engineers, 93-122.
Istanbulluoglu A., Kocaman I. & Konukcu F., 2002. Water use production relationship of maize under Tekirdag conditions in Turkey. Pak. J. Biol. Sci., 5(3), 287-291.
James L.G., 1988. Principles of farm irrigation system design. New York, USA: Wiley.
Jamieson P.D., Martin R.J., Francis G.S. & Wilson D.R., 1995. Drought effects on biomass production and radiation use efficiency in barley. Field Crops Res., 43, 77-86.
Johnson B.L. & Henderson T.L., 2002. Water use efficiency. Water use patterns of grain amaranth in the northern Great Plains. Agron J., 94, 1437-1443.
Karam F., Breidy J., Stephan C. & Rouphael J., 2003. Evapotranspiration, yield and water use efficiency of drip irrigated corn in the Bekaa Valley of Lebanon. Agric. Water Manage., 63(2), 125-137.
Khaledian M.R., Mailhol J.C., Ruelle P. & Rosique P., 2009. Adapting pilote model for water and yield management under direct seeding system: the case of corn and durum wheat in a Mediterranean context. Agric. Water Manage., 96, 757-770.
Kiniry J.R. et al., 1989. Radiation use efficiency in biomass accumulation prior to grain filling for five grain-crop species. Field Crops Res., 20, 51-64.
Kirnak H., Gencoglan C. & Degirmenci V., 2003. Effect of deficit irrigation on yield and growth of second crop corn in Harran plain conditions. Ataturk Univ. J. Fac. Agric., 34(2), 117-123.
Mollier A., 1999. Croissance racinaire du maïs (Zea mays L.) sous déficience en phosphore. Étude expérimentale et modélisation. Thèse de doctorat : Université Paris XI Orsay (France).
Muchow R.C., Sinclair T.R. & Bennett J.M., 1990. Temperature and solar radiation effects on potential maize yield accord locations. Agron. J., 82, 338-343.
Naescu V., 2000. The irrigation effect on silo maize yield in Romanian plain. Probleme de Agrofitotechnie Teoretica si aplicata, 22(1-2), 51-57.
ORMVAT (Office Régional de Mise en Valeur Agricole de Tadla), 2009. Données statistiques. Fkih Ben Salah, Maroc : ORMVAT.
Otegui M.E., Andrade F.H. & Suero E.E., 1995. Growth, water use, and kernel abortion of maize subjected to drought at silking. Field Crops Res., 40(2), 87-94.
Overman A.R. & Martin F.G., 2002. Corn response to irrigation and tillage. Commun. Soil Sci. Plant Anal., 33(19-20), 3603-3608.
Pandey R.K., Maranvilla J.W. & Chetima M.M., 2000. Deficit irrigation and nitrogen effects on maize in a Sahelian environment. Part II. Shoot-growth, nitrogen uptake and water extraction. Agric. Water Manage., 46, 15-27.
Payero J.O., Melvin S.R., Irmak S. & Tarkalson D., 2006. Yield response of corn to deficit irrigation in a semi-arid climate. Agric. Water Manage., 84, 101-112.
Scott H.D., 2000. Soil-plant-water relations. Soil physics. Agricultural and environmental applications. Ames, IA, USA: Iowa State University.
Stone P.J., Wilson D.R., Jamieson P.D. & Gillespie R.N., 2001. Water deficit effects on sweet corn. Part II. Canopy development. Aust. J. Agric. Res., 52, 115-126.
Tyagi N.K., Sharma D.K. & Luthra S.K., 2002. Determination of evapotranspiration for maize and berseem clover. Irrig. Sci., 21, 173-181.
Wagger M.G. & Cassel D.K., 1993. Corn yield and water-use efficiency as affected by tillage and irrigation. Soil Sci. Soc. Am. J., 57(1), 229-234.
Om dit artikel te citeren:
Over : Bassou Bouazzama
Univ. Liege - Gembloux Agro-Bio Tech. Hydraulic and Hydrology Unit. Passage des Déportés, 2. B-5030 Gembloux (Belgium). E-mail: b.bouazzama@student.ulg.ac.be – Centre Régional de la Recherche Agronomique de Tadla. INRA. BP 567. 23000 Beni Mellal (Morocco).
Over : Dimitri Xanthoulis
Univ. Liege - Gembloux Agro-Bio Tech. Hydraulic and Hydrology Unit. Passage des Déportés, 2. B-5030 Gembloux (Belgium).
Over : Ahmed Bouaziz
Institute of Agronomy and Veterinary Hassan II. BP 6202-Instituts. MA-10101 Rabat (Morocco).
Over : Pierre Ruelle
Cemagref. 361, rue J.F. Breton. B.P. 5095. F-34196 Montpellier, cedex 5 (France).
Over : Jean-Claude Mailhol
Cemagref. 361, rue J.F. Breton. B.P. 5095. F-34196 Montpellier, cedex 5 (France).
