


- Startpagina tijdschrift
- Volume 17 (2013)
- numéro 1
- Genetics of body condition score as an indicator of dairy cattle fertility. A review


Weergave(s): 7216 (54 ULiège)
Download(s): 266 (5 ULiège)

Genetics of body condition score as an indicator of dairy cattle fertility. A review

Nota's van de redactie
Received on June 8, 2012; accepted on November 15, 2012
Résumé
La note d’embonpoint chez la vache laitière : variabilité génétique et lien avec la fertilité (synthèse bibliographique). La note d’embonpoint (BCS) est une mesure subjective de la quantité d’énergie métabolisable chez un animal vivant. Les changements de BCS donnent des indications quant à l’importance et la durée de la balance énergétique négative postpartum chez la vache laitière. Bien que la perte de BCS au cours de la lactation présente une faible héritabilité, l’héritabilité du BCS varie en moyenne entre 0,20 et 0,50. De plus, le BCS est plus héritable en milieu de lactation, ce qui indique que les différences génétiques sont davantage liées à la manière dont les vaches reviennent en balance énergétique positive. Les mesures de BCS sont hautement corrélées au sein et à travers les lactations. Les corrélations génétiques entre le BCS et les rendements en lait, matière grasse et protéines sont défavorables et suggèrent que les vaches qui sont génétiquement de hautes productrices ont tendance à avoir un BCS plus faible, et plus particulièrement au cours de la lactation. Les corrélations génétiques sont modérées et favorables entre le BCS et la fertilité et suggèrent que des vaches qui présentent un BCS plus élevé, d’une part, ont plus de chances de concevoir après l’insémination et d’autre part, présentent un nombre plus faible de jours où elles ne sont pas gestantes. Étant donné que la sélection directe pour la fertilité peut être compliquée par une série de facteurs, la sélection pour des niveaux plus élevés de BCS, et plus particulièrement en milieu de lactation, apparait comme une bonne option pour améliorer indirectement la fertilité des vaches laitières.
Abstract
Body condition score (BCS) is a subjective measure of the amount of metabolizable energy stored in a live animal. Change in BCS of dairy cows is considered to be an indicator of the extent and the duration of postpartum negative energy balance. Although change in BCS over lactation is lowly heritable, heritability estimates of level of BCS range from 0.20 to 0.50. Also, BCS tends to be more heritable in mid-lactation indicating that genetic differences are more related to how well cows recover from the negative energy balance state. BCS measurements are generally highly correlated within and between lactations. Genetic correlations with BCS are unfavorable for milk, fat, and protein yield, suggesting that genetically superior producers tend to have lower BCS, especially during the lactation. Genetic correlations are generally moderate and favorable with fertility indicating that cows with higher levels of BCS would have a greater chance to conceive after insemination and fewer number of days when not pregnant. Because direct selection to improve fertility might be complicated by several factors, selection for higher levels of BCS, especially in mid-lactation, appears to be a good option to indirectly improve fertility in dairy cows.
Inhoudstafel
1. Introduction
1In general, dairy cows experience a negative energy balance (EB) for about 2 to 4 months following calving when nutrient requirements for growth (especially in first-parity cows), activity, maintenance and lactation exceed the ability of the cow to consume energy in the feed. In response to the energy deficit, cows mobilize tissue reserves. During lactation, dry matter intake increases at a slower rate than milk production, exacerbating negative EB. About 2 to 4 months after calving, dry matter intake increases to a point where energy input is greater than energy output, resulting in a positive EB for the remainder of the lactation (Bewley et al., 2008).
2Although negative EB in early lactation is a normal physiological state (i.e. all mammals are designed to convert body stores of energy to milk during lactation; Bewley et al., 2008), it is commonly assumed that duration and magnitude of negative EB both have an impact on reproductive performance of dairy cows. Butler et al. (1989) indicated that negative EB and rate of mobilization of body reserves in early lactation appear to be directly related to the interval from calving to first ovulation and to a lower conception rate. Also, de Vries et al. (2000) reported that a lower nadir of EB is correlated with a delay in the postpartum start of luteal activity. Furthermore, Friggens et al. (2007) provided evidence that body energy change is environmentally and genetically driven and suggested that genetic selection could affect EB profiles. Therefore, recording EB on a routine basis could enhance improvement of fertility and hence address one of the greatest challenges of the modern dairy industry, which is to overcome the decline in cow fertility that has taken place over the past five decades (Veerkamp et al., 2007).
3Direct measures of EB are primarily based on individual cow feed intake and milk output. However, measurement of individual feed intake is expensive and unfeasible in a commercial population. Therefore, indirect indicators of EB, such as body condition score (BCS) change, are commonly used. Body condition score is a subjective measure of the amount of metabolizable energy stored in a live animal (Edmonson et al., 1989) and it is recognized by animal scientists and producers as being a useful trait to customize feeding strategies and manage dairy cattle health and fertility.
4After an overview of the definition and the interest in BCS, this paper will focus on the genetic variability of BCS in dairy cows. Furthermore, the genetic association of BCS with other traits of economic importance and especially reproductive performance will be examined. Finally, the selection of BCS in order to indirectly improve the fertility of dairy cows will be considered.
2. Body condition score: definition, target values, and factors of variation
5Body condition scoring has been widely accepted as the most practical method for assessing changes in energy reserves in dairy cattle (Bewley et al., 2008). This technique is accomplished by the visual or tactile observation (or both) of a cow by a trained professional (Edmonson et al., 1989; Roche et al., 2004). Body condition can be scored by dairy farmers, veterinarians, field staff, or classifiers. It can be recorded once or several times over the lactation. Although it is a subjectively measured trait that only assesses subcutaneous fat stores, previous studies have indicated that BCS could be accurate enough to assess the relative amount of body fat mobilization (Waltner et al., 1994; Bewley et al., 2008).
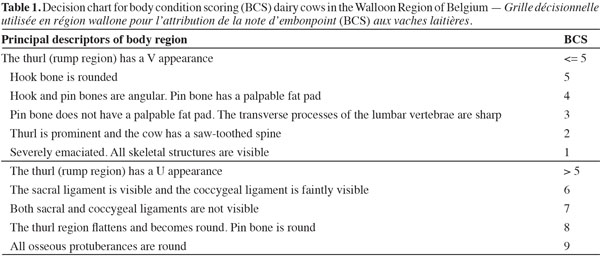
6During the last 25 years, various BCS systems have been described and researched throughout the world (Bewley et al., 2008). The scale used to measure BCS differs between countries, but low values generally reflect emaciation and high values reflect obesity (Roche et al., 2009a). Edmonson et al. (1989) developed a 5-point chart system used in the United States describing changes in conformation with body condition change for eight body locations identified as important for predicting BCS. In the Walloon Region of Belgium, dairy cows are assigned a BCS based on a nine-point scale with unit increments as used for the linear scoring system. The decision chart (Table 1), adapted from the five-point scale described by Ferguson et al. (1994), is mainly based on the observation and the tactile appraisal of the thurl region, the pin and hip bones and the sacral and coccygeal ligaments with scoring of 1 (= emaciated cows) to 9 (= obese cows).
7Mao et al. (2004) suggested that the change in a cow’s BCS over time is determined by changes in intake, in utilization of energy intake for yield, growth and maintenance, and in body tissue deposition and mobilization. Typically, the intercalving profile of BCS is a mirror image of the milk lactation profile, declining to a nadir at 40 to 100 days after calving as milk production peaks and tissue reserves are mobilized to compensate for negative EB, before replenishing lost body reserves as the milk lactation profile declines (Roche et al., 2007b). However, the shape of this profile could be influenced by the system of production; New Zealand cows grazing fresh pasture exhibit a W-shaped BCS profile (Roche et al., 2007b), declining for a second time in mid-lactation when pasture quality and quantity decline, before increasing again in late lactation (Roche et al., 2009b; Roche et al., 2009c).
8An extensive review of the literature by Roche et al. (2009a) summarized the phenotypic association between BCS (at calving, nadir and changes during the lactation) and milk production or fertility traits. They indicated that the association between BCS and milk production and fertility traits is generally nonlinear. Health and reproductive disorders arise from having cows that are either too thin (especially in early lactation) or too fat (especially before calving). Although low BCS during lactation or excessive loss of body condition in early lactation often result in impaired health and reproductive performances (Pryce et al., 2001; Reksen et al., 2002; Roche et al., 2007a), it has been reported that greater BCS at calving exacerbates BCS lost postcalving and negative EB problems instead of overcoming them (Garnsworthy, 2006; Roche et al., 2007b). Body condition score could therefore be considered an intermediate optimum trait (Loker, 2011). The ideal BCS is the level of body fat that allows the cow to optimize milk production while simultaneously minimizing metabolic and reproductive disorders (Bewley et al., 2008). The ideal BCS is highly dependent on lactation stage and on the production system in which cows are managed. Phenotypic target values for BCS as recommended by the Walloon Breeding Association (on a 9-point scale) are 4 to 6 between 0 and 45 days in milk (DIM), 4 to 5 between 46 and 300 DIM, and 5 to 6 after 300 DIM and during dry-off (Massart, 2011). Furthermore, an efficient BCS management strategy should also consider changes in BCS. Monitoring changes in body condition through a scoring system is probably of greater value than identifying absolute, snapshot measures of body condition (Bewley et al., 2008).
9Body condition score profiles vary among cows and many herd- or cow-level factors contribute to this variation. Factors associated with feeding level or diet type are of primary importance. Berry et al. (2006) showed that cows on higher feeding levels mobilized less BCS in early lactation than cows on lower feeding levels. Roche et al. (2009a) indicated that stocking rate, level of concentrates, or diet type (grazed grass or total mixed ration) affect BCS. Among others, parity, age within parity, season of calving, year of calving, breed, and genetics are all cow-level factors that impact BCS profiles (Koenen et al., 2001; Pryce et al., 2001; Berry et al., 2006). Within lactation, loss in BCS tends to increase with increasing parity and first-parity cows are generally managed to calve in greater BCS than later-parity cows (Berry et al., 2006; Bewley et al., 2008). Also, Koenen et al. (2001) showed that BCS increased as calving age increased. Differences in BCS profile among breeds and a heterosis effect have also been reported (Koenen et al., 2001; Mao et al., 2004; Pryce et al., 2006). Finally, as BCS is a subjectively scored trait, the effect of BCS assessor is of importance (Veerkamp et al., 2002) and it is often considered a “nuisance factor” (Roche et al., 2009a) that has to be considered and corrected for.
3. Genetic variability of body condition score
10Several studies investigated the genetic variability in BCS traits and provided evidence that differences in BCS profiles among cows are partly genetically driven. Although it is not exhaustive, table 2 provides an overview of the variety of studies that estimated genetic parameters for BCS. Estimates of heritability ranged from 0.05 to 0.79 but most of the studies reported heritabilities ranging from 0.20 to 0.50. Studies differ in the origin of data (field data or data from research herds), breed, number and stage of lactation being examined, definition of traits (e.g. scales used for scoring body condition), as well as the data edits, model used to estimate genetic parameters and heritability definition (i.e. daily vs lactation).
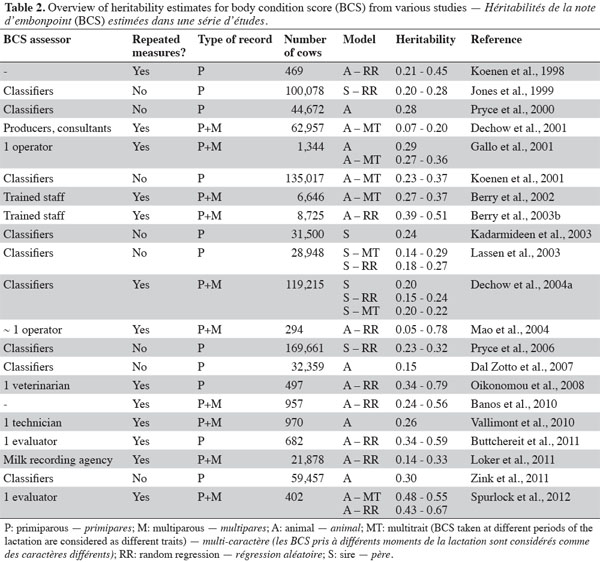
11Field data involve a large data set of BCS generally assessed by classifiers with one record per lactation while a data set from research herds generally includes several measurements of BCS by one assessor on a limited number of cows in a limited number of herds. Heritability estimates tend to be lower for field data (e.g. Lassen et al., 2003; Dal Zotto et al., 2007) than for research herd data (e.g. Oikonomou et al., 2008; Spurlock et al., 2012). This tendency could be attributed to the high variability among herds and BCS evaluators in field data while environmental conditions are more controlled in research herds. Furthermore, heritability estimates tend to be higher in studies in which BCS was assessed by a limited number of trained operators (Gallo et al., 2001; Berry et al., 2003a) than in studies in which BCS was assessed by producers or by a large number of evaluators (Dechow et al., 2001). Hence, Dechow et al. (2003) indicated that heritability for BCS increased from 0.14 to 0.19 after edits on BCS data to eliminate data with no BCS assessors or data scored inconsistently when compared with other BCS assessors’ data. These authors expected that the heritability estimate for BCS would increase as BCS assessors became more accustomed to evaluating cows for this trait. Dechow et al. (2004b) estimated a genetic correlation of 0.85 (with a standard error not greater than 0.06) between classifier recorded BCS and producer and herd-consultant recorded BCS, indicating that these traits are very similar but not exactly the same. Moreover, to alleviate differences in the range of scoring by different BCS assessors, some studies suggested preadjusting BCS records using the phenotypic standard deviation within classifier (Jones et al., 1999; Pryce et al., 2000; Koenen et al., 2001).
12Although BCS can be considered the same trait over the lactation with a constant genetic variance (Pryce et al., 2000; Kadarmideen et al., 2003; Dal Zotto et al., 2007; Zink et al., 2011), most studies hypothesized that the variation in BCS might be controlled by different genes across DIM. In such studies, genetic parameters were estimated using either multitrait models (BCS measured at different periods treated as separate traits) or random regression models (Table 2). Using these two last approaches on the same data, Lassen et al. (2003), Dechow et al. (2004a), and Spurlock et al. (2012) reported heritability estimates in the same range. Koenen et al. (1998), Veerkamp et al. (2001), and Berry et al. (2003b) investigated different orders of Legendre polynomials to model the additive genetic component and calculated the eigenvalues of the additive genetic covariance matrix to determine the contribution of each extra term to the overall variation in the curve. Using a quadratic random regression model, the first eigenfunction accounted for 71% (Berry et al., 2003b), 98% (Veerkamp et al., 2001), and 99% (Koenen et al., 1998) of genetic variance. Little advantage of using Legendre polynomials of order 3 instead of order 2 has been reported (Berry et al, 2003b).
13Using either a random regression or multitrait model, genetic variance and heritability of BCS tend to vary across days in milk (table 2). Various trends of genetic variances for BCS have been presented. The paucity of data at the beginning and the end of the lactation and the mathematical behavior of polynomials at data extremities might contribute to the large genetic variation at the peripheries of lactation in some studies (Berry et al., 2003b; Oikonomou et al., 2008). However, the majority of studies found lower genetic variance in early lactation than in the rest of the lactation (e.g. Koenen et al., 1998; Koenen et al., 2001; Veerkamp et al., 2001; Dechow et al., 2004a; Loker et al., 2011), suggesting that cows are more different in their rate of immediate recovery from negative EB than when they lose condition. Furthermore, Mao et al. (2004) reported that the genetic variance of BCS was the highest around 120 DIM, when energy expenditure and intake supposedly reach a balance during lactation and they concluded that BCS curves differ genetically between cows in shape and in height. Likewise, several authors found that heritability estimates peaked in midlactation (Gallo et al., 2001; Koenen et al., 2001; Berry et al., 2002; Berry et al., 2003b; Dechow et al., 2004a; Loker et al., 2011). Finally, heritability of BCS was generally lower in first-lactation than in later lactations (Dechow et al., 2001; Loker et al., 2011).
14Heritabilities reported in table 2 are for Holstein cows with the exception of estimates from Koenen et al. (2001; Holstein and Red-and-White), Mao et al. (2004; Holstein, Jersey, and Danish Red), Pryce et al. (2006; Holstein, Jersey, and crossbred), and Dal Zotto et al. (2007; Brown Swiss). Koenen et al. (2001) found lower heritability estimates for Red-and-White heifers (0.23 to 0.32) than for Holstein cows (0.28 to 0.37) while Dal Zotto et al. (2007) obtained a relatively low heritability (0.15) for BCS of Brown Swiss cattle. These results suggest that BCS might be under stronger genetic control in Holstein than in other breeds. However, Mao et al. (2004) reported higher heritability estimates for Jersey (0.55 to 0.78) and Danish-Red (0.58 to 0.70) than for Holstein (0.30 to 0.60). Nevertheless, the latter results were obtained from data collected in a single experimental herd that contained 294 cows and these estimates are probably subject to large standard errors.
15Body condition score measures are generally highly correlated within and between parity. Genetic correlations among parities ranged between 0.77 and 1.00 (Dechow et al., 2001; Loker et al., 2011) suggesting that selection based on first lactation BCS would be effective for later parities as well. Genetic correlation estimates between BCS measured at different points during the lactation are generally strong, especially between adjacent periods (Koenen et al., 2001; Loker et al., 2011). However, in some studies (Jones et al., 1999; Dechow et al., 2001; Gallo et al., 2001), BCS in early lactation appears to be genetically less similar to BCS in other periods. Jones et al. (1999) indicated that the correlation between BCS before 30 DIM and BCS from 151 to 210 DIM was 0.63. In the study from Dechow et al. (2001), the genetic correlation between BCS at calving and BCS before dry-off was 0.69. Roche et al. (2009a) concluded that much of the variation observed in BCS at different stages of the cow’s life would be under the influence of similar genes. However, Berry et al. (2003c) found genotype by environment interactions for BCS implying that genes that influence BCS may differ according to the nutritional (i.e. concentrate feeding level, grazing severity, and silage quality) or milk yield (i.e. herd-year mean milk yield) environment.
16As a consequence of the strong correlations among different BCS measurements over the lactation, little genetic variation in BCS change is expected in comparison to the variation in level of BCS. Heritability estimates for BCS change are actually lower than for BCS level and vary from 0.01 to 0.10 (Pryce et al., 2001; Berry et al., 2002; Dechow et al., 2002).
4. Genetic correlations of body condition score with other traits
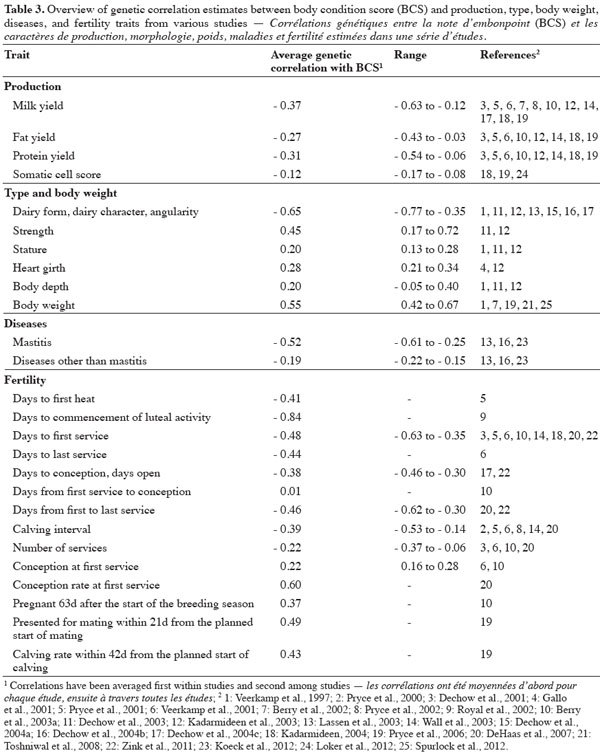
17An overview of various studies presenting genetic correlation estimates between BCS and production, type and body weight, diseases, and fertility traits is given in table 3. In general, the direction of correlations did not change between studies although the magnitude of correlations varied. Also, it should be noted that high standard errors have been reported for some correlation estimates.
4.1. Genetic correlations with non-fertility traits
18Over a range of studies, milk, fat, and protein yield had unfavorable genetic correlations with BCS. Clearly, cows that are genetically superior producers tend to have lower BCS, especially during the lactation. Genetic correlations with BCS were on average -0.37 for milk yield, -0.27 for fat yield, and -0.31 for protein yield (Table 3). Negative correlations of a similar magnitude have been also reported for test-day milk, fat, and protein yields, and fat and protein contents (Veerkamp et al., 1997; Toshniwal et al., 2008; Loker et al., 2012). Greater BCS change in early lactation is also expected for genetically superior producers (Pryce et al., 2001; Berry et al., 2002; Dechow et al., 2002; Berry et al., 2003a). There was a tendency for BCS measured in early lactation to give the weakest correlations with milk yield (Veerkamp et al., 2001; Berry et al., 2003a; Loker et al., 2012). From these results, Dechow et al. (2001) concluded that cows that are efficient producers of milk, direct more nutrients towards milk production and less toward body reserves during the lactation and thus, tend to have lower BCS during the lactation. Nevertheless, the genetic relationships between BCS and production traits are not 1, indicating that, using appropriate indexes, both traits could be improved by genetic selection. In contrast to these studies, Pryce et al. (2006) found a genetic correlation between BCS and 270-d fat changing from moderately positive in early lactation to negative in late lactation. They observed the same trend in protein yield, and, to a lesser extent, in milk yield. Pryce et al. (2006) concluded that under the pastoral production systems typical in New Zealand, cows that have high BCS in early lactation (in spring) are more likely to have higher total yields of fat and protein because they have more reserves available for production in the autumn when feed resources are limited.
19Several studies investigated the genetic relationships between BCS and conformation traits. Overall, traits related to dairyness of cows such as dairy form, angularity or udder traits are generally negatively correlated with BCS. Since dairy form (or angularity) is a subjective type evaluation trait described by the openness and the angle of the ribs and the flatness of bones, it could be considered a similar trait, yet opposite, to BCS. On average the genetic correlation between BCS and dairy form was -0.65 (Table 3); with the exception of Kadarmideen et al. (2003) who reported a genetic correlation of -0.35, most of the studies reported relatively strong estimates ranging from -0.77 to -0.61. Furthermore, genetic relationships between BCS and udder type traits have been reported to be unfavorable but low to moderate (Veerkamp et al., 1997; Dechow et al., 2003; Kadarmideen et al., 2003).
20In opposition to dairyness traits, traits related to body size, body development, and body weight were generally positively correlated with BCS. Genetic correlations with BCS were on average 0.45 for strength, 0.20 for stature, 0.28 for heart girth, and 0.20 for body depth (Table 3). Moreover, Veerkamp et al. (1997) showed that the accuracy of selection for BCS using an index combining stature, chest width, body depth, angularity, and rump width would be 0.88, suggesting that BCS could be predicted from the type traits with little loss in accuracy. Dechow et al. (2003) concluded that cows with a higher BCS have more body fat and muscle and thus appear to be stronger, have somewhat larger body dimensions and weigh more. Moderate to strong genetic correlations between BCS and body weight have been documented with average estimates ranging from 0.42 to 0.67 (Table 3). From their results, Berry et al. (2002) proposed that some breeding indices pursuing a reduction in body weight to increase animal efficiency may also lead to reducing animals’ BCS, assuming no cognizance of other traits associated with BCS.
21Overall, cows with high merit for BCS are genetically less susceptible to diseases. On average, the genetic correlation between BCS and the occurrence of diseases other than mastitis was -0.19 (Table 3). Nevertheless, estimates vary across studies according to the trait considered (from -0.64 to 0.27; Lassen et al., 2003; Dechow et al., 2004b; Koeck et al., 2012). The strongest genetic associations were found for ketosis, displaced abomasum, mastitis and metritis in Koeck et al. (2012) and for metabolic and digestive disease, displaced abomasum, and mastitis in Dechow et al. (2004b). Correlations between BCS and mastitis ranged from -0.61 to -0.25 indicating that animals with higher BCS are genetically more resistant to mastitis. This is corroborated by the weak negative genetic correlation between BCS and somatic cell score, which is considered an indicator of udder health (lower values of somatic cell score are desirable). This correlation was -0.12 on average (Table 3).
4.2. Genetic correlations with fertility
22Over a range of studies, favorable, moderate to strong genetic relationships have been documented between BCS and fertility (Table 3); cows that have genetically lower levels of BCS, on average, experience more reproductive difficulties.
23Negative genetic correlations between BCS and interval reproductive traits (i.e. number of days between two events such as calving, heat, insemination, conception or subsequent calving) have been reported. Genetically low BCS tend to be associated with delayed first estrus, and negative correlations have been found between BCS and the number of days to first heat (-0.41; Pryce et al., 2001) and the number of days to commencement of luteal activity (-0.84; Royal et al., 2002). Cows with low BCS may not maintain energy levels that are sufficient to activate ovarian function or display estrus and they are therefore likely inseminated for the first time at a later date (Dechow et al., 2001). Likewise, cows genetically inclined to maintain BCS in early lactation are inseminated earlier in the lactation (Dechow et al., 2002). The number of days to first service actually showed moderate to strong negative correlations with BCS, ranging from -0.63 to -0.35 with an average of -0.48 (Table 3). Over a range of interval traits within the same study, the number of days to first service often showed the strongest genetic correlation with BCS (Veerkamp et al., 2001; Berry et al., 2003a; Wall et al., 2003). Negative genetic correlations of BCS with calving interval, number of days to last service, number of days from calving to conception and days between first and last services have also been reported and range on average from -0.39 to -0.46 (Table 3). Overall, it suggests that lower BCS levels during the lactation would increase the number of days when the cow is not pregnant.
24Moderate favorable genetic relationships have been reported between BCS and traits reflecting pregnancy status of the cow after the first insemination or within a specific time interval. Conception (rate) at first service, pregnant 63d after the start of breeding season, presented for mating within 21 days from the planned start of mating, and calving rate within 42 days from the planned start of calving were all positively genetically correlated with BCS, with the correlations ranging from 0.22 to 0.60 (Table 3). Negative genetic correlations between BCS and number of services per cow have been reported (Table 3), ranging from -0.37 to -0.06. These estimates suggest that cows with genetically higher BCS would have a greater chance to conceive after insemination.
25Although the direction of correlations between BCS and fertility traits generally did not change over the lactation, studies reported that the magnitude of correlations varied according to the lactation stage. Dechow et al. (2001), Berry et al. (2003a) and de Haas et al. (2007) reported that BCS in mid-lactation had the strongest relationship with fertility. Because genetic correlations between fertility and BCS could depend on lactation stage, it might be expected that the BCS change is correlated with reproductive performance. Despite the fact that estimates are quite variable and are subject to high standard errors, unfavorable low to moderate genetic correlations between fertility and BCS loss in early lactation have been reported (Pryce et al., 2001; Dechow et al., 2002; Berry et al., 2003a), indicating that greater BCS loss in early lactation is correlated with poorer fertility.
26In early lactation, cows are in negative EB. Consequently, they mobilize body tissue to sustain milk production and their BCS decreases. Therefore, they may be yielding milk at the expense of reproduction. Hence, Dechow et al. (2001; 2002) included mature equivalent milk yield as a covariable in the model to adjust the genetic correlation between BCS and fertility for milk production as they stated that producers might inseminate higher producing cows later in lactation. However, this adjustment did not have a significant effect on the correlations. Berry et al. (2003a) and Pryce et al. (2000) also reported that adjustment for milk had no effect on the direction of correlations between BCS and fertility traits.
5. Body condition score as an indirect predictor of fertility
27A number of studies stated that focusing selection on high production over the last 50 years has resulted in selection for cows that prioritize milk production at the expense of both health and fertility (Veerkamp et al., 2007). To overcome declining cow fertility by means of genetic selection, most leading dairy countries have, by now, routine genetic evaluation systems for female fertility, and such fertility traits are now nearly unanimously included in national breeding goals (Miglior et al., 2005). However, direct selection for female fertility might be complicated by the following factors:
28– difficulty in collecting large quantities of relevant direct fertility records, especially for unfertile animals (e.g. no calving interval records for animals that are infertile);
29– the long time period required to validate some phenotypes (e.g. calving interval) and its subsequent effect on generation interval and thus genetic gain;
30– the generally low heritability of most traditional fertility phenotypes (from 0.01 to 0.05; e.g. Veerkamp et al., 2007).
31These factors contribute to low accuracy of estimated breeding values, especially for cows and young bulls. Therefore, indicator traits are of interest to supplement the prediction of genetic merit for fertility as long as these traits are easy to measure, are ideally recorded earlier in the cow’s lactation, are heritable, and are genetically correlated with fertility. Body condition score meets all these criteria, so is considered a useful indicator trait for health and fertility status in dairy cattle (Loker, 2011). Body condition score is easy, quick and measurable at low cost, exhibits genetic variation, is heritable (Table 2), and is moderately to strongly favorably genetically correlated with fertility (Table 3). Furthermore, many countries have, by now, implemented national genetic evaluations for BCS (Battagin et al., 2012).
32Numerous studies have discussed the possibility of using BCS in a selection index or the usefulness of BCS in predicting estimated breeding values for fertility traits. Banos et al. (2010) investigated the associations of nine direct and indirect body energy traits with fertility and reported that BCS in early lactation was one of the most useful traits for selection in terms of the correlated improvement in a cow’s capacity to resume her reproductive activity postpartum. Berry et al. (2003b) stated that BCS can serve as a predictor for the estimated breeding value of fertility, albeit with an accuracy no greater than the genetic correlation between BCS and the fertility trait. de Jong (2005) presented the effect of using different sources of information on the reliability of the Dutch fertility index. Their results were based on a bull achieving 100 daughters in the first lactation of which 64 had BCS and showed little advantage of including BCS in a genetic evaluation. These authors concluded that BCS adds extra information only when it is recorded early in lactation. Such results might be due to the use of classifier recorded BCS data, which seems to be less informative than repeated measurements of BCS during the lactation. Veerkamp et al. (2007) also stated that the additional value of including BCS in a genetic evaluation is highest when breeding values for fertility have low accuracy, as in the case for individual cows or when limited progeny records are available for a sire. Berry et al. (2003a) investigated different selection indexes and illustrated the possibility of continued selection for increased milk production without any deleterious effects on fertility or average BCS, albeit genetic merit for milk production would increase at a slower rate. Finally, Pryce et al. (2000) also indicated that a fertility index based on calving interval, BCS and type traits would be attractive to improve, or prevent further decline in fertility.
33Over a range of studies, BCS in mid-lactation appeared to be a more informative fertility predictor than average BCS or BCS at other stages of lactation. Mid-lactation is the time when genetic variability for BCS and its correlation with fertility are the greatest (Mao et al., 2004; de Haas et al., 2007; Loker et al., 2011). Mid-lactation is also the most critical part of the lactation of the cow, as this is when insemination often occurs, daily milk yield approaches its peak, and EB and BCS are on the decline (Banos et al., 2004). Dechow et al. (2002) and Pryce et al. (2001) also concluded that selection for BCS level itself, rather than BCS change across lactation, would be more efficient for improving fertility. Banos et al. (2004) further suggested that each cow has a genetically predetermined lowest level of body energy (and BCS) that she is allowed to reach, and it is this nadir that determines her aptitude for fertility. These authors also stated that the speed of reaching this level seems to be less important than the level itself. This assumption was supported by results from phenotypic studies by Pryce et al. (2001) and Buckley et al. (2003).
6. Alternatives to body condition score
34Several traits that are indicators of EB or changes in body reserves are potential alternatives to BCS as fertility predictors. It includes body weight, measurements of metabolic and hormone factors that are indicative of energy in early lactation (e.g. non esterified fatty acids, growth hormone, and insulin), and BCS measured via automatic scoring technology. This section focuses on traits that are potentially available within performance recording schemes: body weight, angularity, and traits predicted from milk samples by mid-infrared spectrometry.
35Body weight appears to be an obvious option to monitor changes in body reserves. Although it has been suggested that changes in body weight are influenced by a multitude of factors other than changes in amount of body fat (Bewley et al., 2008) and that body weight should be supplemented by BCS to provide accurate assessments of energy balance changes across lactation (Toshniwal et al., 2008), genetic correlations between fertility traits and body weight were in the same range as the corresponding estimates between fertility traits and BCS (Veerkamp et al., 2000; Berry et al., 2003a).
36Angularity (or dairy form) has also been investigated as an indicator of EB and fertility and has shown genetic correlations with fertility similar in magnitude to those of BCS (Pryce et al., 2000; Dechow et al., 2004c). Although it remained unclear that genetic evaluations for BCS would provide valuable genetic information beyond current dairy form evaluations, Dechow et al. (2004b) concluded that there might be advantages to selecting BCS to improve fertility. In fact, producers may be less reluctant to select for higher BCS than for lower dairy form because dairy form is generally weighted positively in final score calculations.
37The measurement of factors in milk that are related to EB could be promising as long as these factors can be obtained within the routine analysis of milk recording samples. Reist et al. (2002) investigated the use of milk traits for estimating EB and demonstrated that fat:lactose ratio was one of the most informative traits for estimation of EB. Also milk fatty acid (FA) profile has been suggested to be related to energy balance status of cows in early lactation (Stoop et al., 2009), a topic that deserves further research. Recently, McParland et al. (2011) reported the opportunity to predict body energy status of Holstein cows using mid-infrared analysis of milk.
7. Conclusion
38Body condition score meets all criteria required for indirect improvement of health and fertility. First, heritability and genetic variation estimates from literature are sufficient to support BCS as a trait suitable for breeding programs of dairy cattle. Second, although BCS is a subjectively measured trait, BCS is both easy and quick to record. Third, genetic correlations between BCS and fertility are favorable and moderate to strong. Cows that mobilize more body reserves and exhibit lower BCS during lactation are genetically more disposed to fertility problems. Consequently, selection for higher levels of BCS, especially in mid-lactation, would indirectly improve fertility of dairy cows using an appropriate selection index.
39List of abbreviations
40BCS: Body Condition Score
41DIM: Days In Milk
42EB: Energy Balance
43Acknowledgements
44Sarah Loker (Livestock Improvement Corporation, Hamilton 3240, New Zealand), Marie Dufrasne and Pierre Faux (University of Liege, Gembloux Agro-Bio Tech, Animal Science Unit, Gembloux, Belgium) are acknowledged for the manuscript review.
Bibliographie
Banos G., Brotherstone S. & Coffey M.P., 2004. Evaluation of body condition score measured throughout lactation as an indicator of fertility in dairy cattle. J. Dairy Sci., 87, 2669-2676.
Banos G. & Coffey M.P., 2010. Genetic association between body energy measured throughout lactation and fertility in dairy cattle. Animal, 4, 189-199.
Battagin M. et al., 2012. International genetic evaluation of Holstein bulls for overall type traits and body condition score. J. Dairy Sci., 95, 4721-4731.
Berry D.P. et al., 2002. Genetic parameters for level and change of body condition score and body weight in dairy cows. J. Dairy Sci., 85, 2030-2039.
Berry D.P. et al., 2003a. Genetic relationships among body condition score, body weight, milk yield, and fertility in dairy cows. J. Dairy Sci., 86, 2193-2204.
Berry D.P. et al., 2003b. Genetic parameters for body condition score, body weight, milk yield, and fertility estimated using random regression models. J. Dairy Sci., 86, 3704-3717.
Berry D.P. et al., 2003c. Estimation of genotype × environment interactions, in a grass-based system, for milk yield, body condition score, and body weight using random regression models. Livest. Prod. Sci., 83, 191-203.
Berry D.P., Veeerkamp R.F. & Dillon P., 2006. Phenotypic profile for body weight, body condition score, energy intake, and energy balance across different parities and concentrate feeding levels. Livest. Sci., 104, 1-12.
Bewley J.M. & Schutz M.M., 2008. Review: an interdisciplinary review of body condition scoring for dairy cattle. Prof. Anim. Sci., 24, 507-529.
Buckley F. et al., 2003. Relationships among milk yield, body condition, cow weight, and reproduction in spring-calved Holstein-Friesians. J. Dairy Sci., 86, 2308-2319.
Butler W.R. & Smith R.D., 1989. Interrelationships between energy balance and postpartum reproductive function in dairy cattle. J. Dairy Sci., 72, 767-783.
Buttchereit N., Stamer E., Junge W. & Thaller G., 2011. Short communication: genetic relationships among daily energy balance, feed intake, body condition score, and fat to protein ratio of milk in dairy cows. J. Dairy Sci., 94, 1586-1591.
Dal Zotto R. et al., 2007. Heritabilities and genetic correlations of body condition score and calving interval with yield, somatic cell score, and linear type traits in Brown Swiss cattle. J. Dairy Sci., 90, 5737-5743.
Dechow C.D., Rogers G.W. & Clay J.S., 2001. Heritabilities and correlations among body condition scores, production traits, and reproductive performance. J. Dairy Sci., 84, 266-275.
Dechow C.D., Rogers G.W. & Clay J.S., 2002. Heritability and correlations among body condition score loss, body condition score, production and reproductive performance. J. Dairy Sci., 85, 3062-3070.
Dechow C.D., Rogers G.W., Klei L. & Lawlor T.J., 2003. Heritabilities and correlations among body condition score, dairy form, and selected linear type traits. J. Dairy Sci., 86, 2236-2242.
Dechow C.D., Rogers G.W., Klei L. & Lawlor T.J., 2004a. Heritability and correlations for body condition score and dairy form within and across lactation and age. J. Dairy Sci., 87, 717-728.
Dechow C.D. et al., 2004b. Correlations among body condition scores from various sources, dairy form, and cow health from the United States and Denmark. J. Dairy Sci., 87, 3526-3533.
Dechow C.D. et al., 2004c. Body condition scores and dairy form evaluations as indicators of days open in US Holsteins. J. Dairy Sci., 87, 3534-3541.
de Haas Y., Janss L.L.G. & Kadarmideen H.N., 2007. Genetic correlations between body condition scores and fertility in dairy cattle using bivariate random regression models. J. Anim. Breed. Genet., 124, 277-285.
de Jong G., 2005. Usage of predictors for fertility in the genetic evaluation, application in the Netherlands. Interbull Bull., 33, 69-73.
de Vries M.J. & Veerkamp R.F., 2000. Energy balance of dairy cattle in relation to milk production variables and fertility. J. Dairy Sci., 83, 62-69.
Edmonson A.J. et al., 1989. A body condition scoring chart for Holstein dairy cows. J. Dairy Sci., 72, 68-78.
Ferguson J.D., Galligan D.T. & Thomsen N., 1994. Principal descriptors of body condition score in Holstein cows. J. Dairy Sci., 77, 2698-2703.
Friggens N.C. et al., 2007. Breed and parity effects on energy balance profiles through lactation: evidence of genetically driven body energy change. J. Dairy Sci., 90, 5291-5305.
Gallo L. et al., 2001. Test-day genetic analysis of condition score and heart girth in Holstein Friesian cows. J. Dairy Sci., 84, 2321-2326.
Garnsworthy P.C., 2006. Body condition score in dairy cows: targets for production and fertility. In: Garnsworthy P.C. & Wiseman J., eds. Recent advances in animal nutrition. Nottingham, UK: Nottingham University Press, 61-86.
Jones H.E., White I.M.S. & Brotherstone S., 1999. Genetic evaluation of Holstein Friesian sires for daughter condition-score changes using a random regression model. Anim. Sci., 68, 467-475.
Kadarmideen H.N., 2004. Genetic correlations among body condition score, somatic cell score, milk production, fertility, and conformation traits in dairy cows. Anim. Sci., 79, 191-201.
Kadarmideen H.N. & Wegmann S., 2003. Genetic parameters for body condition score and its relationship with type and production traits in Swiss Holsteins. J. Dairy Sci., 86, 3685-3693.
Koeck A., Miglior F., Kelton D.F. & Schenkel F.S., 2012. Short communication: genetic association of body condition score with disease resistance in first lactation Canadian Holsteins. Can. J. Anim. Sci., 92, 285-289.
Koenen E.P.C. & Veerkamp R.F., 1998. Genetic covariance functions for live weight, condition score and dry-matter intake measured at different lactation stages of Holstein Friesian heifers. Livest. Prod. Sci., 57, 67-77.
Koenen E.P.C., Veerkamp R.F., Dobbelaar P. & De Jong G., 2001. Genetic analysis of body condition score of lactating Dutch Holstein and Red-and-White heifers. J. Dairy Sci., 84, 1265-1270.
Lassen J. et al., 2003. Genetic relationship between body condition score, dairy character, mastitis, and diseases other than mastitis in first-parity Danish Holstein cows. J. Dairy Sci., 86, 3730-3735.
Loker S., 2011. Genetic analysis of body condition score in Canadian Holsteins. PhD thesis: University of Guelph (ON, Canada).
Loker S. et al., 2011. Short communication: estimates of genetic parameters of body condition score in the first three lactations using a random regression animal model. J. Dairy Sci., 94, 3693-3699.
Loker S. et al., 2012. Genetic and environmental relationships between body condition score and milk production traits in Canadian Holsteins. J. Dairy Sci., 95, 410-419.
Mao I.L., Sloveniewski K., Madsen P. & Jensen J., 2004. Changes in body condition score and in its genetic variation during lactation. Livest. Prod. Sci., 89, 55-65.
Massart X., 2011. Un suivi du BCS via le contrôle laitier bientôt valorisé sur my@wenet. Wallonie Élevages, 6 (Juin 2011), 17-19.
McParland S. et al., 2011. The use of mid-infrared spectrometry to predict body energy status of Hosltein cows. J. Dairy Sci., 94, 3651-3661.
Miglior F., Muir B.L. & Van Doormaal B.J., 2005. Selection indices in Holstein cattle of various countries. J. Dairy Sci., 88, 1255-1263.
Oikonomou G. et al., 2008. Genetic profile of body energy and blood metabolic traits across lactation in primiparous Holstein cows. J. Dairy Sci., 91, 2814-2822.
Pryce J.E., Coffey M.P. & Brotherstone S., 2000. The genetic relationship between calving interval, body condition score, and linear type and management traits in registered Holsteins. J. Dairy Sci., 83, 2664-2671.
Pryce J.E., Coffey M.P. & Simm G., 2001. The relationship between body condition score and reproductive performance. J. Dairy Sci., 84, 1508-1515.
Pryce J.E., Coffey M.P., Brotherstone S.H. & Woolliams J.A., 2002. Genetic relationships between calving interval and body condition score conditional on milk yield. J. Dairy Sci., 85, 1590-1595.
Pryce J.E. & Harris B.L., 2006. Genetics of body condition score in New Zealand dairy cows. J. Dairy Sci., 89, 4424-4432.
Reist M. et al., 2002. Estimation of energy balance at the individual and herd level using blood and milk traits in high-yielding dairy cows. J. Dairy Sci., 85, 3314-3327.
Reksen O. et al., 2002. Relationships among body condition score, milk constituents and postpartum luteal function in Norwegian dairy cows. J. Dairy Sci., 85, 1406-1415.
Roche J.R. et al., 2004. Relationships among international body condition scoring systems. J. Dairy Sci., 87, 3076-3079.
Roche J.R. et al., 2007a. Associations among body condition score, body weight, and reproductive performance in seasonal-calving dairy cattle. J. Dairy Sci., 90, 376-391.
Roche J.R. et al., 2007b. Describing the body condition score change between successive calvings: a novel strategy generalizable to diverse cohorts. J. Dairy Sci., 90, 4378-4396.
Roche J.R. et al., 2009a. Invited review: body condition score, and its association with dairy cow productivity, health, and welfare. J. Dairy Sci., 92, 5769-5801.
Roche J.R. et al., 2009b. Weather, herbage quality and milk production in pastoral systems. 2. Temporal patterns and intra-relationships in herbage quality and mineral concentration parameters. Anim. Prod. Sci., 49, 200-210.
Roche J.R. et al., 2009c. Weather, herbage quality and milk production in pastoral systems. 2. Effects on dairy cattle production. Anim. Prod. Sci., 49, 222-232.
Royal M.D., Pryce J.E., Woolliams J.A. & Flint A.P.F., 2002. The genetic relationship between commencement of luteal activity and calving interval, body condition score, production, and linear type traits in Holstein-Friesian dairy cattle. J. Dairy Sci., 85, 3071-3080.
Spurlock D.M. et al., 2012. Genetic parameters for energy balance, feed efficiency and related traits in Holstein cattle. J. Dairy Sci., 95, 5393-5402.
Stoop W.M., Bovenhuis H., Heck J.M.L. & van Arendonk J.A.M., 2009. Effect of lactation stage and energy status on milk fat composition of Holstein-Friesian cows. J. Dairy Sci., 92, 1469-1478.
Toshniwal J.K. et al., 2008. Heritability of electronically recorded daily body weight and correlations with yield, dry matter intake, and body condition score. J. Dairy Sci., 91, 3201-3210.
Vallimont J.E. et al., 2010. Genetic parameters of feed intake, production, body weight, body condition score, and selected type traits of Holstein cows in commercial tie-stall barns. J. Dairy Sci., 93, 4892-4901.
Veerkamp R.F. & Brotherstone S., 1997. Genetic correlations between linear type traits, food intake, live weight and condition score in Holstein Friesian dairy cattle. Anim. Sci., 64, 385-392.
Veerkamp R.F., Oldenbroek J.K., Van Der Gaast H.J. & Van Der Werf J.H.J., 2000. Genetic correlation between days until start of luteal activity and milk yield, energy balance, and live weights. J. Dairy Sci., 83, 577-583.
Veerkamp R.F., Koenen E.P.C. & De Jong G., 2001. Genetic correlations among body condition score, yield, and fertility in first-parity Holstein cows estimated by random regression models. J. Dairy Sci., 84, 2327-2335.
Veerkamp R.F. et al., 2002. Evaluation of classifiers that score linear type traits and body condition score using common sires. J. Dairy Sci., 85, 976-983.
Veerkamp R.F. & Beerda B., 2007. Genetics and genomics to improve fertility in high producing dairy cows. Theriogenology, 68S, S266-S273.
Wall E. et al., 2003. Genetic evaluation for fertility using direct and correlated traits. J. Dairy Sci., 86, 4093-4102.
Waltner S.S., McNamara J.P., Hillers J.K. & Brown D.L., 1994. Validation of indirect measures of body fat in lactating cows. J. Dairy Sci., 77, 2570-2579.
Zink V., Štípková M. & Lassen J., 2011. Genetic parameters for female fertility, locomotion, body condition score, and linear type traits in Czech Holstein cattle. J. Dairy Sci., 94, 5176-5182.
Om dit artikel te citeren:
Over : Catherine Bastin
Univ. Liege - Gembloux Agro-Bio Tech. Animal Science Unit. Passage des Déportés, 2. B-5030 Gembloux (Belgium). E-mail: catherine.bastin@ulg.ac.be
Over : Nicolas Gengler
Univ. Liege - Gembloux Agro-Bio Tech. Animal Science Unit. Passage des Déportés, 2. B-5030 Gembloux (Belgium).
