1 Introduction
Simulations at microscopic scale are subject of research in many fields of continuous fiber reinforced materials. They allow the virtual characterization with clearly defined boundary conditions and the investigation of effects that cannot easily be observed in experimental tests, such as crack initiation.
The simulation of dry yarns at the scale of the fibers is uncommon and only few disseminations exist. Sherburn [1] investigated the yarn shape in textiles by microscopic simulations. He applied boundary conditions to the fibers that provoked the formation of weft patterns, and investigated the equilibrium shape of the fiber bundles. Subject of this research were synthetic fibers with a significantly bigger diameter than carbon fibers. Therefore, the number of fibers was comparatively low.
Other disseminations with carbon fibers used representative volume elements (RVE) to reduce the size of the simulation models [2,3]. Stapleton et al. [2] used the discrete element method (DEM), where the filaments are rigid and interact with each other. They investigated fiber volume fractions between 85 % and 95 %. The simulated fibers were short in respect to the RVEs’ side lengths and parallel. With this approach, they found a reasonable RVE size of minimum 16² fibers. [2]
Vorobiov et al. [3] used a FEM approach with curved glass fibers and simulated different deformation modes. Subject of research was amongst others the influence of the fiber volume fraction and the variance of the fibers’ direction. [3]
The mentioned approaches used different assumptions to reduce the complexity of the simulation models, which is necessary due to the numerous properties of yarns and their variance. However, the sensitivity of those models towards the simulation methods and the simplifications was not part of the research. To use microscopic simulations for the characterization of yarns for process simulations, such as mesoscopic draping simulation, the reliability is very important. Therefore, the influence of the simulation’s boundary conditions is subject of this article.
2 Methodology
Microscopic simulations are used to characterize the deformation behavior of carbon fiber yarns. Those simulations have to fulfill several requirements in order to provide realistic results. Important parameters are the size of the microstructures, the simplification of the filaments and the boundary conditions.
A Matlab® code [4] generated the microstructures. The microstructures consist of arbitrary curved fibers and exhibit different statistical values. These are specifically normally distributed fiber diameters, normally distributed mean directions of the fibers, number of bundles within the microstructure and their mean orientation. Due to the number of parameters and of the fibers in the microstructures in comparison to the yarn size, the microstructures do not meet the Hills’ criterions [5]. Therefore, they are not representative, which means the term “representative volume element (RVE)” does not fit. Because of this, the microstructures describe statistical volume elements (SVE).
Next to the characteristic parameters that have to correspond with the real yarn, such as the fiber volume fraction or the fiber angle distribution, several other parameters describe a microscopic simulation. The reliability of a simulation depends on the optimal choice of those other parameters. The parameters, whose influence on the simulations’ results were investigated, are listed in Table 1.
Table 1. Investigated parameters of the microscopic simulation.

To reduce the number of simulations, a standard configuration is chosen. Towards this, the sensitivity of the parameters is investigated. The standard configuration is a SVE with a fiber volume content of 55 %, a side length of 50 times the mean radius of the fibers, a length to width ratio κ of 2, an initital stress of 40 MPa per fiber, a velocity of 1 % of the diagonal per ms and a friction coefficient of 0.24.
The carbon fiber yarn ZOLTEK PX35 50k [7] functions as example for the microscopic simulations. Table 2 shows the material dependent parameters.
Table 2. Relevant parameters of the ZOLTEK PX35 50k yarn.

Fig. 1 shows the simulation set-up for pure shearing of a SVE. Beam elements with different statistically distributed diameters represent the fibers. The movements of the fibers’ ends are constrained transversal in fiber direction and in all rotational directions. Rigid shells simulate the boundaries transversal to the fiber direction. The rigid elements and the fibers interact by node-to-surface contacts without frictional forces. Fibers that enter or leave the SVE are coupled to the rigid elements with tied contacts. The AUTOMATIC-GENERAL contact, which is in this case an edge-to-edge contact, simulates the interaction. The static friction coefficient is 0.24 and is derived from measurements [6]. A movement of an edge induces pure shearing of the SVE and the resulting force is measured in the opposite edge.
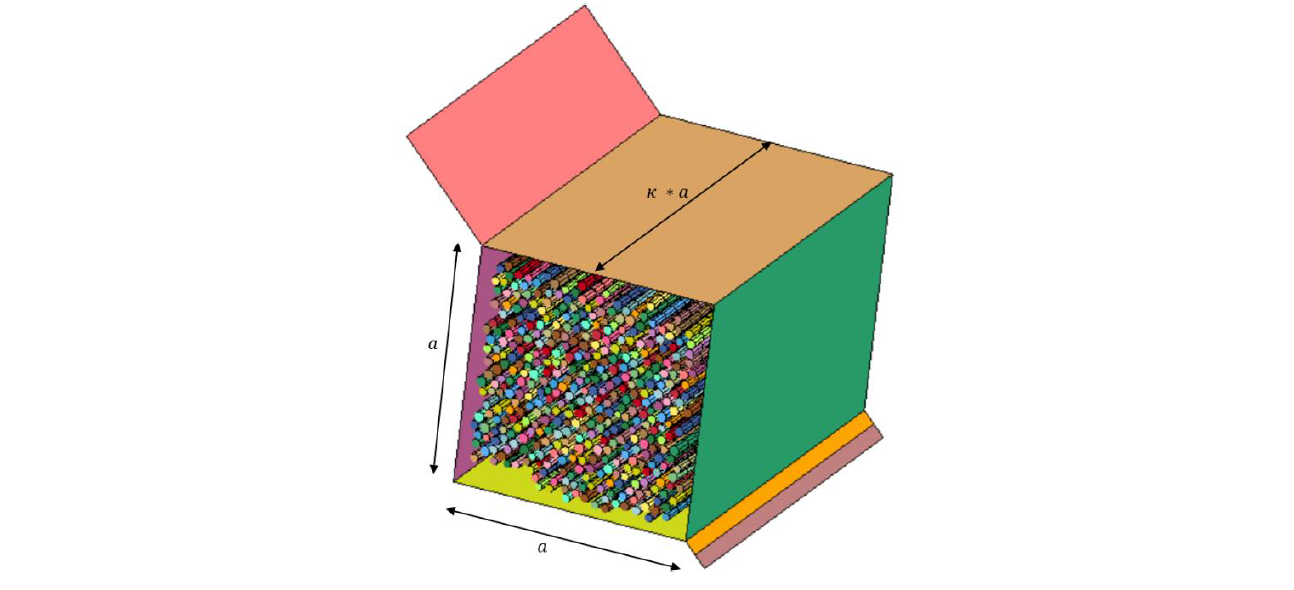
Fig. 1. SVE with rigid shells; the beam elements are illustrated with their assigned diameters.
Due to the statistically generated microstructure, SVEs with the same parameters differ and the results show a significant scatter. Therefore, every parameter set is simulated with five different SVEs. Parameters that do not affect the microstructure are compared based on one SVE. All simulations are implicitly solved with the LS DYNA solver, release version 12.0.
The volume of the SVE changes during the shear deformation. As a result, the fiber volume fraction increases with the travel of the moving edge and the shear stress is not proportional to the force in the fixed edge. Equation (1) gives the relation between the force F and the shear stress τs with respect to the time dependent cross-sectional area A(t), the side length a and the ratio of length to width κ.

3 Results
As shown in Fig. 2 the simulations have a significant scatter in the shear stress. Which is why, it is necessary to average and smooth the results. Otherwise, a comparison between the different parameter sets is not possible. The black dashed line in Fig. 2 represents the average curve of the shear stress from different SVEs. This curve is smoothed for a better visualization of the trend. The curves show a narrow peak in the beginning, which represents the relaxation due to the initial stress before the movement and the impulse, when the rigid walls attach to the fibers in the beginning of the movement. In the first third of the movement, the shear stresses are low. In the second third, they increase slightly and in the last third, they increase significantly. The raise of the shear stress with increasing shear angle β is directly related with the increase of the fiber volume content. With increasing fiber volume content, the contact forces and the amount of contacts between the fibers increase. Therefore, the friction forces increase. The local peaks and the high scatter are among others caused by impulses of single or a group of fibers and locking of the shear deformation by the fiber arrangement.
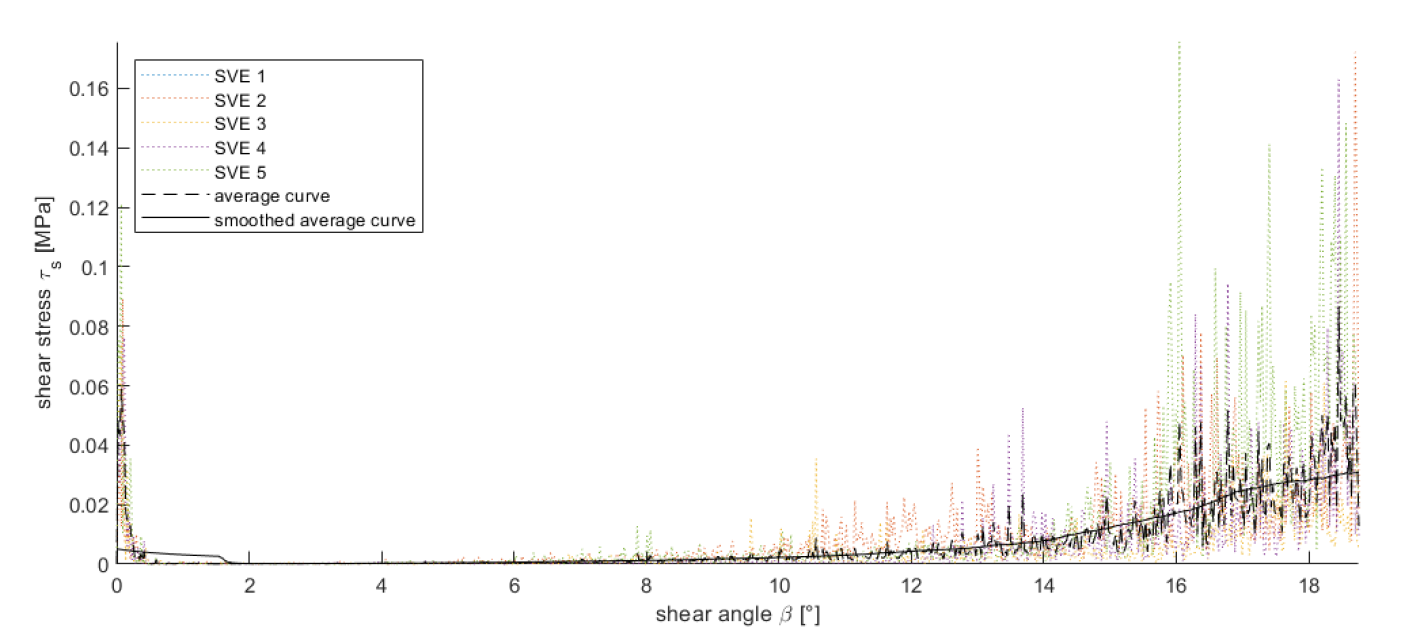
Fig. 2. Shear stress of all simulations with the standard configuration (a =50, k = 2, v = 1, σt=40MPa, μ = 0.24) and the average curve.
Fig. 3 shows different states during the shearing. After the first peak, which was mentioned before, the fibers are in a state of equilibrium (left). During roughly 70 % of the deformation, the fibers do not have contacts with the moving corner area (middle). The rigid shells that are attached to the fixed corner push against the fibers. This circumstance results in a local compaction in the area of the fixed corner. In the last period of the deformation, the fibers attach to the rigid elements in the moving corner again.
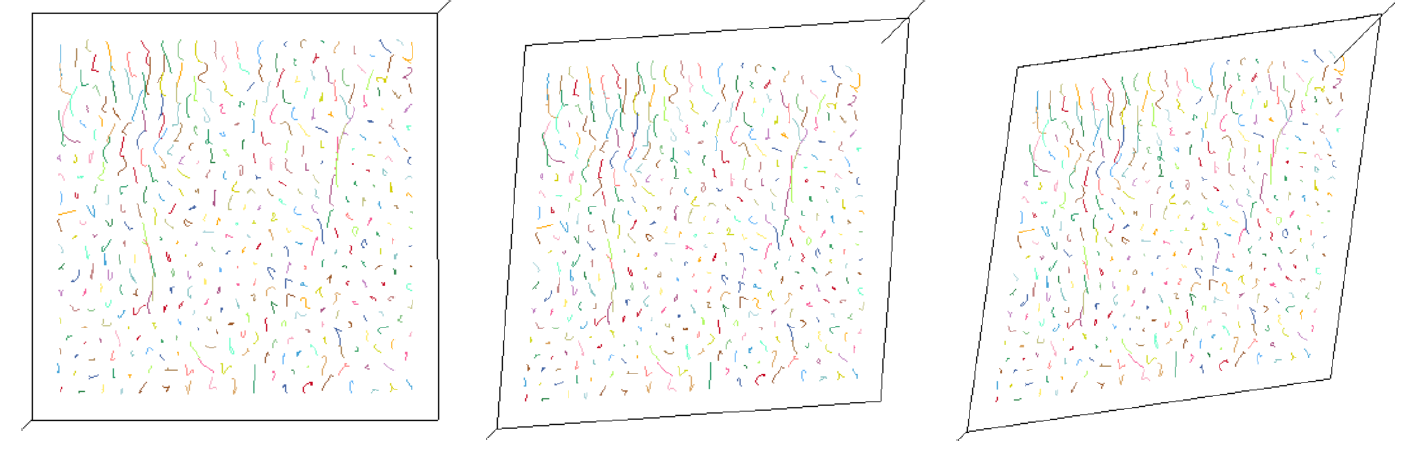
Fig. 3. Different states of the shear deformation.
The fibers in the SVEs have curvatures and entanglements. This circumstance is necessary to transmit friction forces between the fibers, Otherwise the fibers would only interact by impulses. In contrast to real yarns, the fibers in the simulation have no initial stresses. Therefore, an initial tensional stress of 1 % of the fibers’ yield stress is applied on each element. This leads to a slight rearrangement of the fibers in the beginning of the simulations. By the initial stress, contact forces between the fibers are induced after the relaxation. Fig. 4 (left) shows the influence of the initial stress on the shear stress. The simulations without initial stress did not show a peak at beginning of the simulation. By the missing stresses in the beginning, these SVEs were already in a state of equilibrium. The simulations with initial stress showed a higher increase of the shear stress. The higher contact forces between the fibers can explain this circumstance.
Fig. 4 (right) shows the influence of the SVE’s length. While the curve of the simulations with the length to width ratio κ = 2 shows a clear trend, the curve of the simulations with cubic SVEs (κ = 1) has various stress peaks and no obvious trend is recognizable. Theoretically, the SVEs with κ = 2 have double the number of contacts of the ones with κ = 1 and stronger entanglement. Therefore, the fibers build better linkages to each other and frictional forces dominate over impulses.
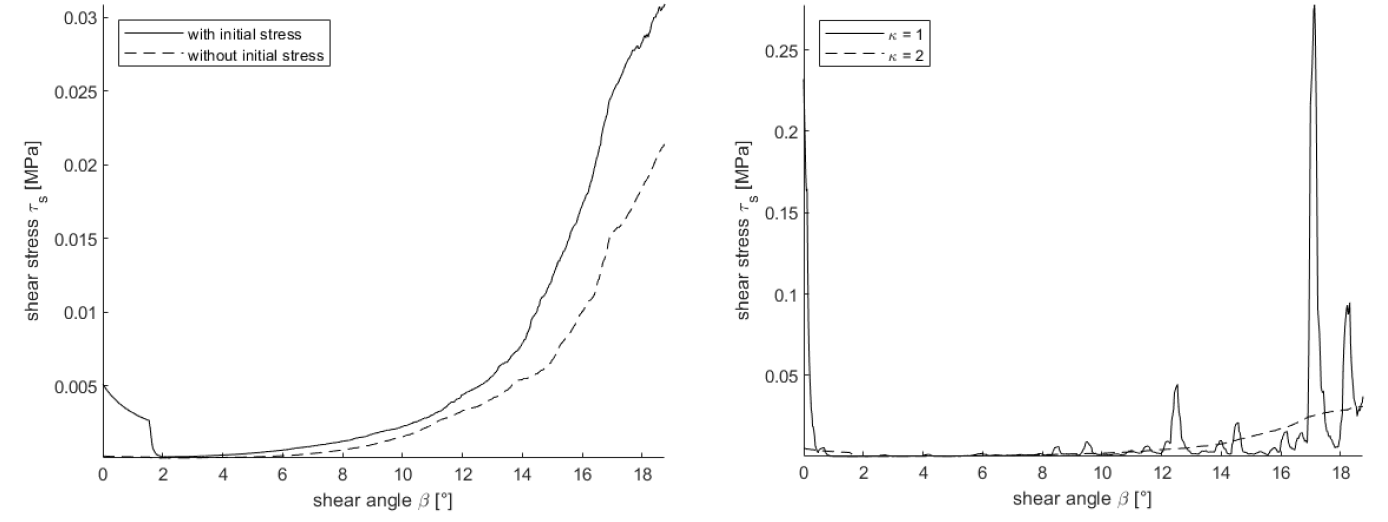
Fig. 4. Shear stress curves with variation of the initial stress (left) and with variation of the length ratio k (right).
Fig. 5 (left) shows the shear stresses of simulation sets with different side lengths of the SVEs. In comparison to the already above described trend of SVEs with the side length a = 50, SVEs with smaller side length do not show a raise of the shear stress with higher shear angle. The peak at the beginning of the deformation indicates a loose bond between the fibers and a tendency towards impulse based movements of the fibers similar to the SVEs with the ratio κ = 1.
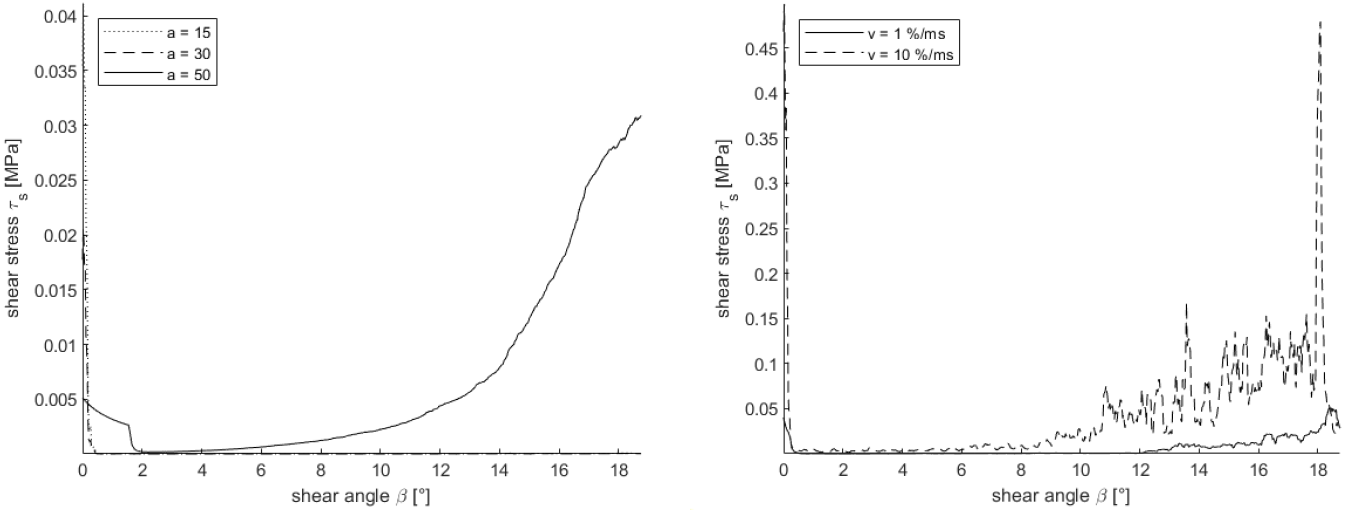
Fig. 5. Shear stress curve with variation of the side length a (left) and the velocity v (right).
Fig. 5 (right) shows the influence of the deformation velocity v on the shear stress. The simulation with higher deformation velocity shows significantly higher shear stresses than the one with the lower velocity. It shows also higher peaks at the beginning and in the end of the movement. This reveals a high sensitivity towards the velocity, which is caused by inertial forces.
Fig. 6 shows the influence of the friction coefficient μ on the deformation of the same microstructure. The used friction coefficients correspond to the values that were measured between dry carbon filaments at different boundary conditions [6]. The relation of the friction coefficient and the shear stress is noticeable. This emphasizes the role of the friction forces in the deformation of yarns.
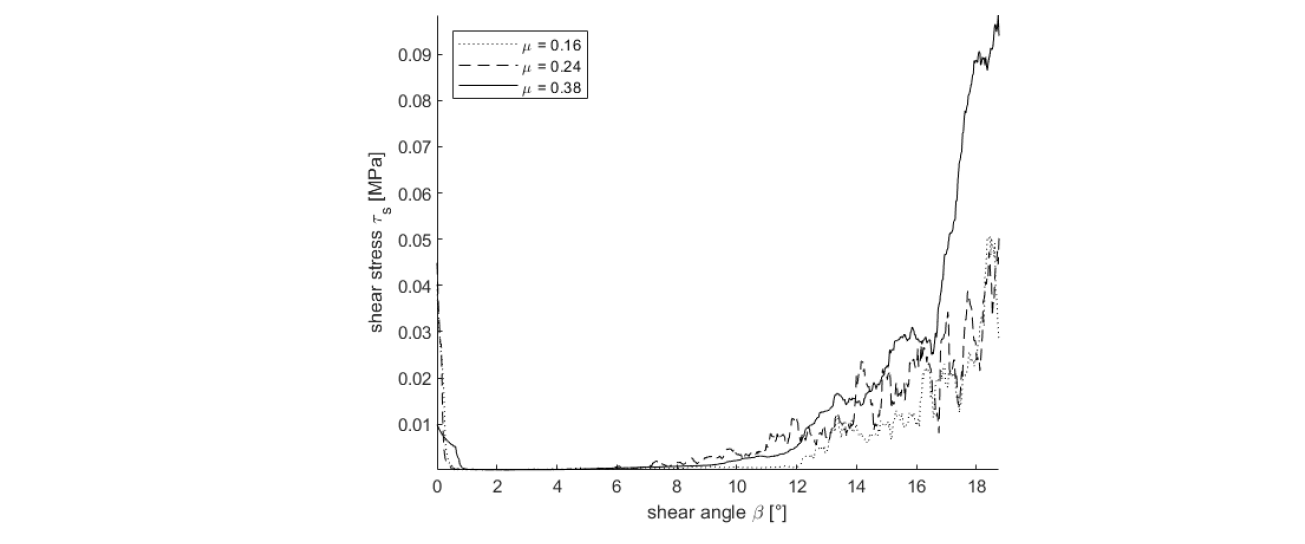
Fig. 6. Shear stress curves with variation of the friction coefficient.
4 Conclusion and Outlook
An approach for the microscopic simulation of carbon fiber yarns was presented and the functionality was proven. The influence of different parameters was investigated by the simulation of different SVEs with the same characteristic values. Despite the scatter between the different SVEs, the averaged results showed noticeable influences of the investigated parameters on the simulation results. Especially the number of contacts between the fibers and the friction forces influence the deformation behavior. More fiber contacts in combination with high contact forces lead to reasonable results. Low numbers of contacts and high deformation velocities lead to impulse dominated deformation, which results in high scatter and force peaks.
However, the results show the sensibility towards different parameters but do not give ideal values for these parameters. Especially, the size of the SVE and the deformation velocity needs to be investigated in detail. In addition, the way the initial stresses are applied should be investigated more deeply. Initial bending stresses dependent of the fibers’ curvatures promise good results. After finishing these investigations, the simulation approach needs to be validated by experiments.
Acknowledgements
The authors thank the Federal Ministry of Science, Research and Art of the federal state of Baden-Württemberg, Germany, for funding this research.
