1 Introduction
The miniaturization of device is a race which started three decades ago, and this tendency led to a high demand for components with sub-millimeter dimensions. In order to meet the needs of industries with increasing production rates, the forming processes by plastic deformation remains the most common technological solution for the manufacture of miniature parts, such as those found in the watchmaker industry. Since the beginning of mechanical watchmaking, copper alloys have been part of the standard materials of various watchmaking components. In fact, these parts require peculiar mechanical properties, both machinability and in service life, by meeting more and more requirements. In this context, the use of the incremental sheet forming is interesting for the small batch production and rapid prototyping [1]. Powell and Andrew [2] developed for the first time incremental forming process. Several studies have been carried out to investigate the influence of process parameters on surface quality [3], geometric accuracy [4], forming forces [5], thinning and sustainability. Regarding thin metallic sheet, the identification of the constitutive law is often performed by using mechanical tests, i.e. tensile, bending, and shear tests [6]. However, deformations’ modes encountered during micro Single Incremental forming (μSPIF) process are essentially those of plane tension. Associated plasticity models are often not competent enough because they do not offer sufficient flexibility to describe well both the anisotropy of hardening and plastic flow. In order to obtain a more precise model while keeping simple laws, it is possible to use a non-associated plastic flow, that is to say to use a function to describe the plastic potential and an other for the load surface in order to be able to separately control the deformation anisotropy and the material flow stress [7]. In this work, an anisotropic macroscopic approach is used to model the material behavior. Concerning anisotropy, the yield criteria frequently used can be those of Barlat 2003 [8] or that of Hill48 [9]. Hill48 has the advantage to use a quadratic function with anisotropic coefficients which describe the values of the Lankford ratios and the flow stress for different orientations relative to the rolling direction. The objective of this study is to simulate a micro Single Incremental forming process with parameters identified from tensile and shear tests.
2 Classical characterization
2.1 Material and mechanical tests
The material is a 0.2 mm thick copper-beryllium alloy sheet, which principal properties are in Table 1. In order to determine the behavior under different stress states, an experimental characterization was carried out using uniaxial tensile tests for different orientations (0°, 45°, 90°) to the rolling direction (RD).
The Cauchy stress 𝜎 is calculated by using the applied force:

Where 𝐹, 𝑆0 and 𝜀n are respectively the tensile force, the initial area of the specimen section and the longitudinal deformation.
The transverse deformation is measured by image correlation and the normal deformation is calculated from the assumption of invariance of the plastic volume 𝑡𝑟(εp) = 0 and the longitudinal deformation.

𝐿0 is the initial length and Δ𝐿 the length traction during tensile test.
The Lankford ratios 𝑟0, 𝑟45 and 𝑟90 are accessible thanks to the tensile test. They correspond to the slope of the transverse strain curve according to the normal strain ε22p = 𝑓(ε33p).
Shear tests were carried out in order to be able to go further in strains compared to a simple tensile test.
Following formula is used to have access to the stress:

Where F is the applied force and S the shear section. The strain 𝛾 corresponds to twice the shear strain.
Table 1. Material parameters of CuBe.

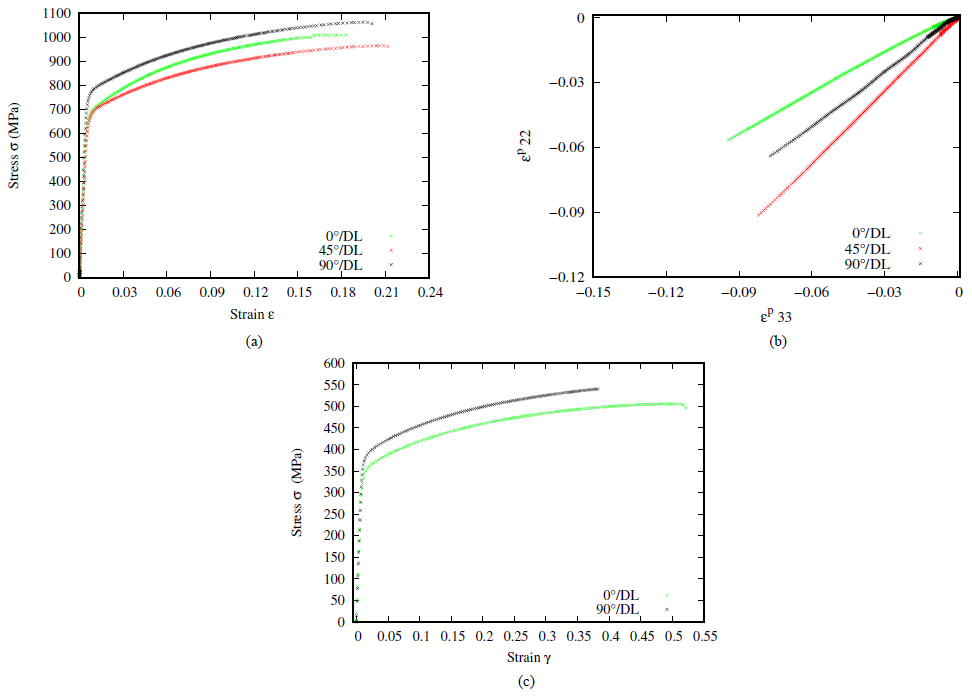 Figure 1. Work hardening curves (a), anisotropic coefficients (b) for a tensile test, work hardening during a shear test (c) for CuBe alloy of thickness 0.2 mm
On the figure 1.a, the work hardening curves are plotted for different orientations to the rolling direction. It is observed that the mechanical properties in the transverse direction are higher both during the tensile and the shear tests, especially the yield stress is higher. The values of the anisotropy ratios also show an anisotropy in terms of strains in addition to that observed for the stresses. A different evolution of the deformation is clearly observed, it shows an anisotropy of the material behavior.
The average anisotropy coefficient 𝑟̅ that characterizes overall normal anisotropy can also be calculated by an average of anisotropy coefficients calculated for different orientations. The more 𝑟̅ is closed to 1, the more the normal anisotropy is low.

Planar anisotropy coefficients Δ𝑟 assess the variation of anisotropy in the sheet plane according to the orientation in relation to the rolling direction:

A zero value of Δ𝑟 implies that the anisotropic deformation is the same regardless of the orientation, i.e. the material is isotropic in the plane.
Results show that the CuBe alloy has a normal anisotropy enough low but a pretty significant planar anisotropy.
3 Constitutive laws in non-associated plasticity
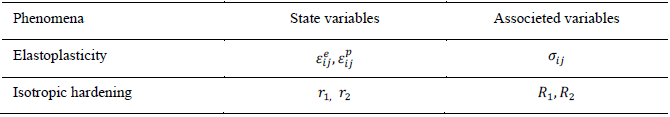
In this work, the framework of thermodynamics of irreversible processes is used to define the overall constitutive equations of anisotropic elastoplastic model under isothermal conditions. The assumption of small elastic strains, which is verified for most metallic materials, is adopted, then this leads to the additive decomposition of the total strain rate tensor. All phenomena considered are represented by a pair of state variables. As showed in Table 2, the following pairs of state variables are introduced: (i) (εije , 𝜎ij) represents the elastoplastic flow; (ii) (𝑟1, 𝑅1) represents the nonlinear isotropic hardening (Voce) and (iii) (𝑟2, 𝑅2) represents the linear isotropic hardening.
 A model is proposed after the experimental observations, we propose the following form to express the specific free energy Ψ:
Table 2. State and associated variables.

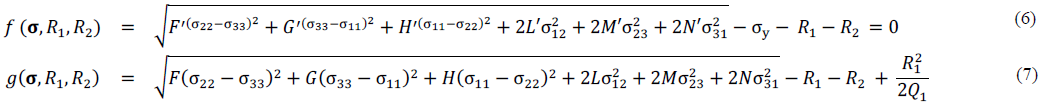
A Hill48 criterion is retained with a non-associated plasticity (Non Associated Flow Rule). In fact, according to Safaei [10] a function based on the Hill criterion may be used in order to describe the potential separately and therefore to better describe the material behavior. Cardoso [11] also choose this criterion to develop functions capable of correctly describing the anisotropy values r and the flow stress simultaneously. One function describes the yield surface 𝑓 (Eq.6) and the other is dedicated to the work hardening 𝑔 (Eq.7).
The relations between thermodynamic forces and internal variables are also expressed:
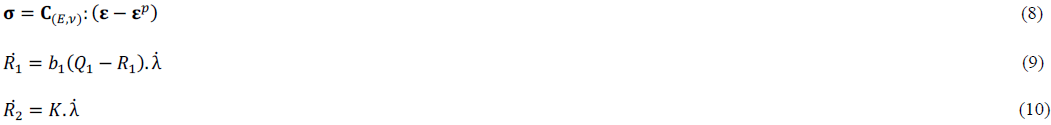
The plastic multiplier λ̇ in Eq.9, Eq.10 is determined using the consistency condition ̇f = 0 if 𝑓 = 0 .
3.1 Identification of plastic parameters
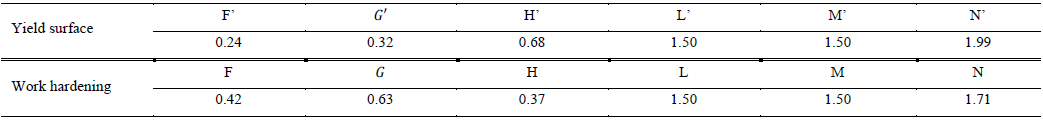
The model contains 8 independent parameters (E, n, F, G, N, F’, G’, N’) with 𝐻 = 1 − 𝐺 and 𝐻′ = 1 − 𝐺′. Out-of-plane parameters (L, M, L’, M’) were not identified and considered as constants and equal to isotropic values 𝐿 = 𝐿′ = 𝑀 = 𝑀′ = 1.5. Parameters are identified thanks to a minimization algorithm (Levenberg-Marquardt) available in the MIC2M software developed by Richard [12]. Experimental tensile and shear tests are used to identified parameters. The anisotropic coefficient for the yield surface description and work hardening definition are presented in Table 3:
Table 3. Anisotropic parameters
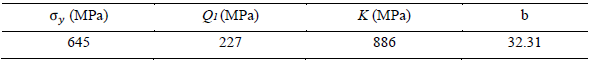
The set of parameters is identified using the experimental curve in the direction of rolling, the following coefficients are obtained and defined in Table 4:
Table 4. Material parameters.
Tensile and shear tests are simulated with the constitutive equations implemented in MIC2M and integrated by MIC2M using a Runge-Kutta algorithm.
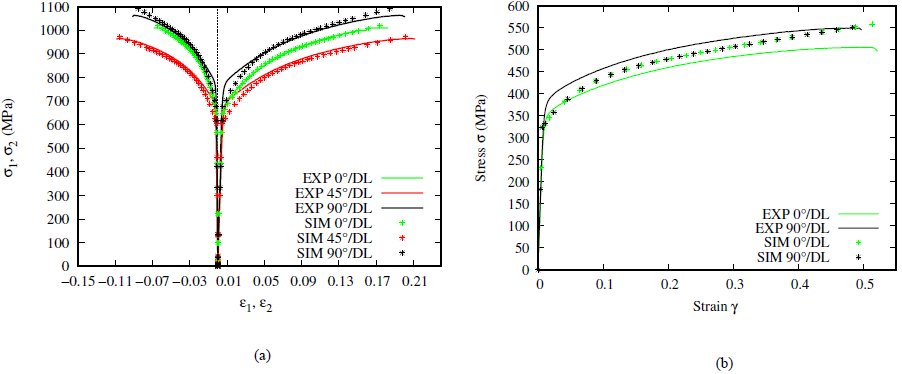 Figure 2 Comparison of experimental and numerical hardening curves with parameters identified with MIC2M for a tensile (a) and shear (b) tests for CuBe alloy of thickness 0.2mm
Simulations carried out with parameters identified by MIC2M are in good agreement with experimental results.
4 Single Point Incremental Forming
The micro Single Point Incremental Forming process (μSPIF) can be used to form very thin sheets [13][14]. It consists in locally deforming a clamped blank using a hemispherical punch which has a small diameter compared to the blank dimensions. The SPIF device allows to have a maximum of plastic parameters involved in only one test. The Micro incremental deformation testing device represented in Fig.3 is composed of a fixed die support, a modular die, a fixed blank holder clamped to the die using screws and a forming punch with a radius of 0.5 mm. The lubrication of the sheet/tool interface (water/oil mixture) is used to improve the sheet formability. The tool moves with a constant feed rate of 500 mm/min and rotates with a speed rate of 500 rpm. A 3-axis micro-milling CNC Machine (KERN HSPC) is used and the forming forces F⃗exp are acquired by using a 4- axis dynamometer. The KERN HSPC can be repositioned in μm but its repeatability is 5 μm. From a 0.2 mm thick sheet, a square-based pyramid is obtained incrementally, with a define height pass and feed rate.
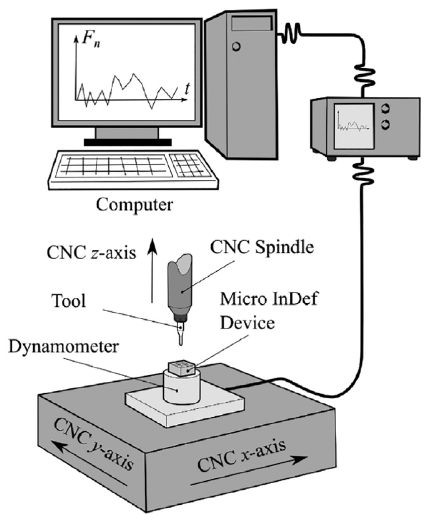 Figure 3. Principe of force acquisition for the Micro Incremental Deformation device
Two approaches are used in Fig 4: the helical paths (continuous paths) and the constant Z-level one (discontinuous path). Different parameters are tested in order to study their influence on the Z-axis force. First of all the influence of the lubrication is checked and it was observed to be weak, however lubrification is activated in order to decrease friction between the tool and the material. Then the pass height for the two approaches is tested. In the two strategies when the pass height increases the axial force in Z direction also increases. By comparing the two approaches it can be observed for the constant Z-level strategy the influence of Z-increment on the curve while the helical paths approach is smoother. These strategies are reviewed by Thibaud et al. [15].
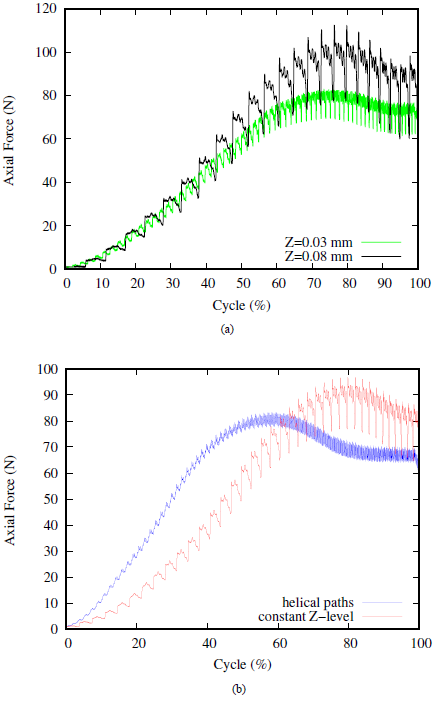 Figure 4. (a) Comparison of axial force for two cycles of μSPIF for two constant Z-level. (b) Comparison of helical and constant Z-level paths.
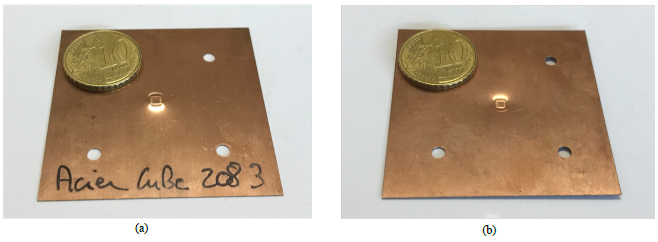 Figure 5. Geometries of the pyramid after single point incremental forming with the constant Z-level strategy: (a) above side, (b) below side.
Dimensions of the formed pyramid are presented in Fig. 6 and detailed on Table 5.
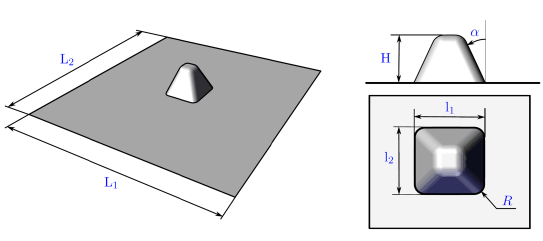 Figure 6. Dimensions of the squared-based pyramid
Table 5. Dimensions of the squared-based pyramid.

4.1 Numerical simulation of μSPIF
A numerical simulation of μSPIF is performed in order to compare experimental and numerical forming forces in z-direction with finite element code Abaqus Standard [16]. The constitutive model of the non-associated flow plasticity is introduced as a User Material Subroutine. The elements used are S4R shell elements with 4 nodes with reduced integration.
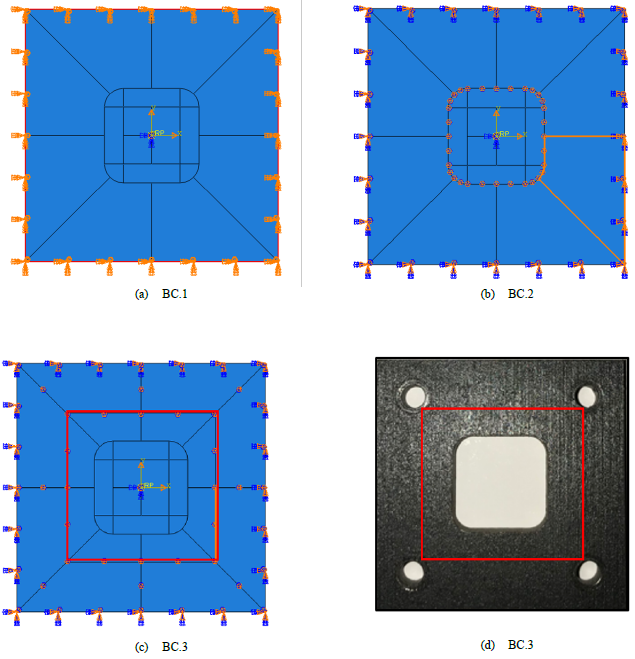 Figure 7. Different configurations of boundary conditions of the blank for the simulation of μSPIF. The red line represents the location of the effective boundary conditions.
Different boundary conditions are tested according to Fig 7:
• BC.1 the outline of the blank is embedded (Fig 7.a)
• BC.2. the movements of the nodes are blocked along the Z axis from the outline of the blank to the free inner edge (Fig 7.b)
• BC3. the movements of the nodes are blocked along the Z axis up to the experimental location of the screws (Fig 7.c, Fig 7.d)
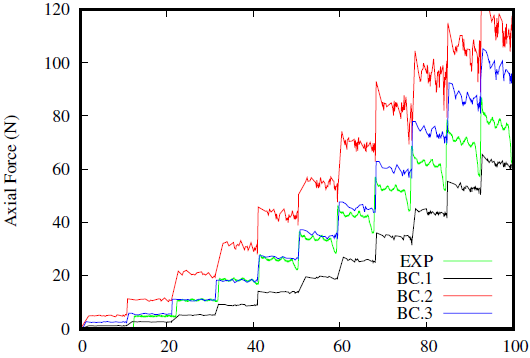 Figure 8. Comparison of axial force for simulation on μSPIF with different configurations of boundary conditions
A whole cycle of 11 passes is simulated in Fig.8 in order to reduce computation time, which corresponds to 42% of the real cycle to build the complete pyramid. It is observed for the BC.1, when only the outline of the blank is embedded, that the axial force is lower that the experimental one because the blank is not supported enough compared to the experimental conditions. Concerning the BC.2, the axial force is higher than the real one if the blank is over blocked. It is with the BC.3, the numerical results are closer to the experimental force which corresponds to the blank blocked until the experimental location of the screws.
In the Fig.9, a comparison between experimental results and simulations is shown. Overall a good match is found. For the first pass the simulated force is greater than the experimental force. After this first pass the two curves are superimposed. Then, after a certain number of passes, the gap between experimental and numerical results increases. It is observed that the more the test progresses the more the deformation increases and the two simulated curves begin to separate. In SPIF, there is a loading and unloading of the material area under the punch, which creates a loading-unloading strain path, which is hardly taken into account in our model since the hardening is only isotropic. The improvement of the results will be achieved by taking into account in the model a kinetic contribution of the hardening. This work is currently in progress.
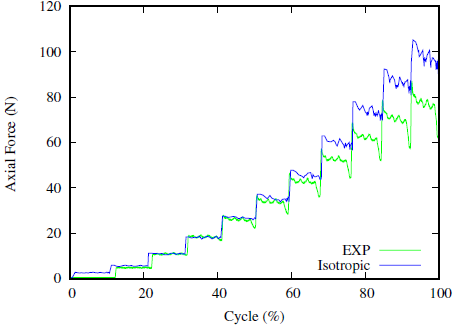 Figure 9. Comparison of the axial force between experimental and numerical curves for simulation of μSPIF
In Fig 10. is a simulation of the micro-forming at the end of the process is presented in terms of the effective plastic strain. Values are defined to be equivalent to Hill48 criterion A maximum value of approximately 15% is reached.
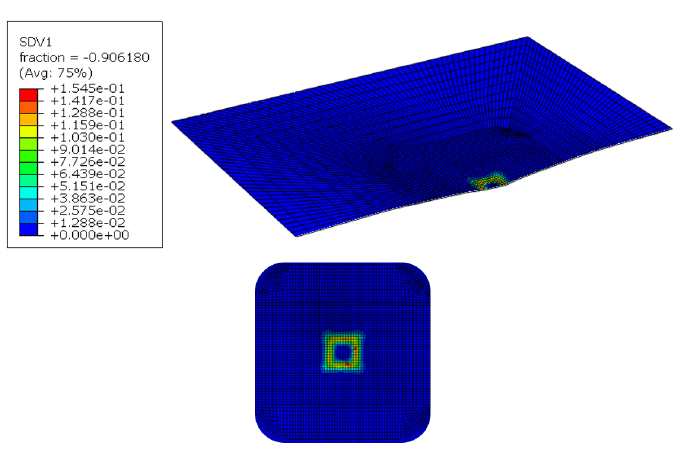 Figure 10. Effective plastic strain at the end of the μSPIF simulation
The variety of strain or stress states is also an important factor for an accurate calibration of a constitutive model, especially when a complex yield criterion has to be calibrated. Therefore, the plot of the strain in the principal axes (in-plane) is presented in Fig.11. ε1 and ε2 represent the major and minor strains.
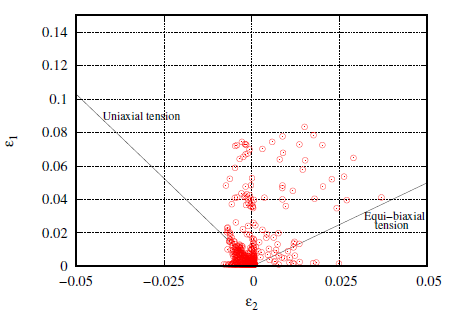 Figure 11. Plot of the principal strain fields during the μSPIF simulation
It should be noted in Fig. 11 that there is essentially plane tension. It confirms the use of a non-associated plasticity model to describe this particular state which has difficulty to be predict with associated plasticity models.
Fig.12 presents the shell thickness of the deformed blank after the 11 passes. The thickness is reduced on the edges because of the repetitive passage of the tool to make the different increments of strain. The section thickness of finite-strain shell elements changes as a function of the membrane strain based on the effective section Poisson’s ratio υ.
In plane stress 𝜎33 = 0 ; linear elasticity gives Eq. 11

Treating these as logarithmic strains in Eq. 12, where 𝑙10, 𝑙20 are the initial length and 𝑙1, 𝑙1 the current length.

Where A is the arear on the shell’s reference surface. This nonlinear analogy with linear elasticity leads to the thickness change relationship Eq. 13:

𝑡0 and 𝑡 are respectively the initial shell thickness and the current thickness.
In the case of plasticity, υ = 0.5.
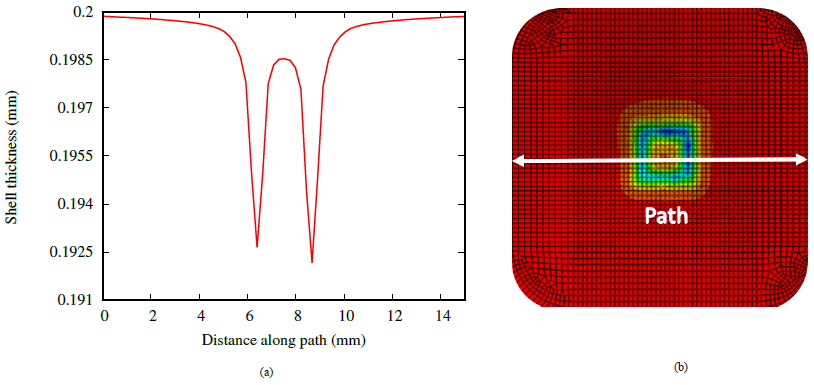 Figure 12. Shell thickness of the deformed blank (a) at the end of the μSPIF simulation along a path (b)
Experimental measurements using a tomograph are in progress to compare experimental and numerical thickness profiles of the formed pyramid.
Conclusion
This work is dedicated to the simulation of a micro Single Incremental forming process with plastic parameters identified from tensile and shear tests. An elastic-plastic model which combines a Hill’s 1948 anisotropic criterion and plastic potential using a non-associated flow rule is retained. Good results are obtained with plastic parameters identified with the classical method. However, other experimental tests such as reversed shear tests will be carried out in the aim to studied other phenomena such as kinematic hardening and to improved our model in order to have results closer to the experimental.
Acknowledgements
This work has been supported by the EIPHI Graduate school (contract "ANR-17-EURE-0002") and by the Brittany region.
