1 Introduction
In manufacturing, thermoforming is a process in which one or more sheets of material are formed to a desired shape using either open or closed tooling. This process is very attractive as it can allow for the low-cost high-volume composite manufacture of simple to complicated geometries. Coupling the thermoforming process with the versatility of thermoplastic composite materials opens an abundance of possibilities in the realm of manufacturing. In one form of this process, thermoplastic sheets are heated to a pliable temperature, transferred to a form or molding fixture, and aligned with a punch that draws the material into the final shape. This process can be used to create a final part or a preform. When used for preforming, the layers of the preform are consolidated at pressures and high temperatures that bond the layers of material together to form a part. A schematic of the preforming and consolidation steps of the thermoforming process is illustrated in Figure 1 [1]. Binder rings are used to induce in-plane tension in the sheets so as to mitigate material wrinkling. If the in-plane tension is too low, the material may wrinkle, and if the in-plane tension is too high, then the material may tear. Because the fabric slides under the binder ring as well as between layers, ply/ply and tool/ply frictions play a critical role in thermoforming. In the current work, two unidirectional cross-ply ultra-high molecular weight polyethylene (UHMWPE) materials are characterized for their frictional properties with steel tooling.
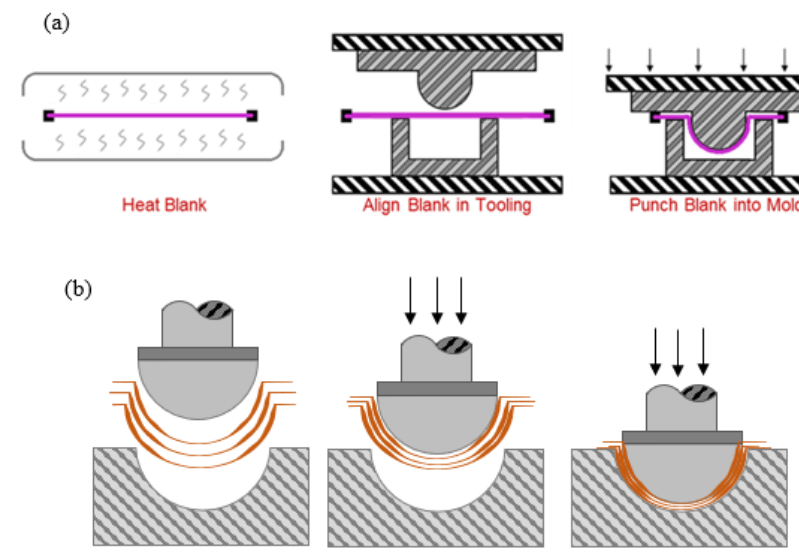 Figure 1. Preform (a) and Consolidation (b) steps of the thermoforming process [1].
2 Methodology
2.1 UHMWPE Materials
The materials being tested in this work are HB210 and HB311. These fiber-matrix material systems consist of a combination of ultra-high molecular weight polyethylene (UHMWPE) sheets and resin. Four unidirectional plies are stacked together to create a multi-layered cross-ply layup ([0/90/0/90]) [2]. When manufacturing these materials, the unidirectional sheets are stacked on top of another such that there are layers of resin between the UHMWPE sheets. This process results in a resin-rich (R+) and a resinpoor (R-) side of the material. Figure 2 shows an illustration of the cross-ply layup.
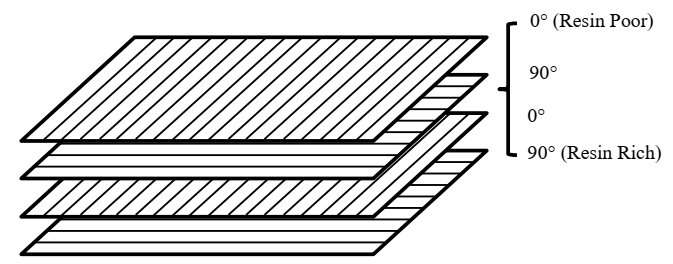 Figure 2: Cross-ply Layups.
2.2 Friction Testing Setup
The friction testing apparatus is shown in Figure 3. It utilizes compressed air to fill an air bladder, engaging two 127.4 mm x 62.2 mm (length x width) platens with the testing fabric, which creates a normal force on the tested material. A motorized rack and pinion drive system is used to pull the heated material between the compressed platens. A variable frequency drive (VFD) is used to control the motor speed, hereby allowing for various pulling velocities to be tested.
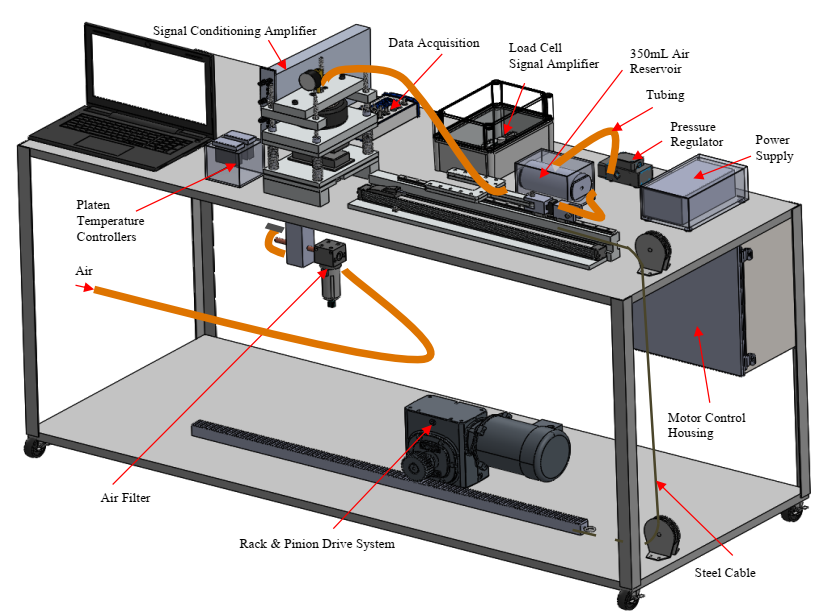 Figure 3: Drawing of the friction testing setup.
The pulling and a normal forces are recorded throughout the test. To measure the pulling force, a tension load cell is installed between the fabric holding mechanism and the steel cable that couples the rack and pinion drive to the fabric holder. The normal force is measured by three compressive load cells under the bottom platen. A LabVIEW user interface (UI) allows for monitoring of fabric position and fabric contact pressure and works in conjunction with a pressure regulator to maintain a consistent pressure on the fabric samples as the material is pulled between the platens. One critical component of the testing setup is that it accounts for a changing area of material under the platens so as to maintain a constant pressure on the material within the testing area.
2.3 Friction Characterization
Coulomb’s law is used for the calculation of the effective coefficient of friction [3],

where µ is the friction coefficient, F is the pulling force and N is the normal force. On the testing apparatus at the University of Massachusetts Lowell (UML), there is contact on both sides of the testing material leading to frictional effects on both the top and bottom surfaces. Applying this condition to the Coulomb friction law yields,

Previous studies of friction testing indicate that friction coefficients can be expressed as a function of four independent parameters [4]:

where θ is fiber orientation, N is normal force, U is material sliding velocity, and T is material temperature. At higher temperatures, it was found that the melted resin acts as a lubricant, linking this process to Stribeck theory and the Hersey number, H [5].

where η is the fluid viscosity, U is the sliding velocity and N is the normal force resulting from the contact pressure on the effected material. For this study, it was assumed that the material viscosity did not change throughout the testing process, which simplifies Equation (4) to a modified Hersey number, Hmod.

Previous work outlines that there is a linear relationship between Hersey number and friction coefficient [6]. This relationship is a powerful tool as it can be a starting point for the development of a friction model for finite element software and can be used to predict friction coefficients for a given combination of sliding velocity and normal force.
The friction responses of the two UHMWPE cross-ply material systems were characterized at three different modified Hersey numbers. Two different combinations of contact pressure and pulling velocity that resulted in the same modified Hersey number were used and averaged. The different combinations of contact pressure and pulling velocity are summarized in Table 1.
Table 1. Modified Hersey number combinations. 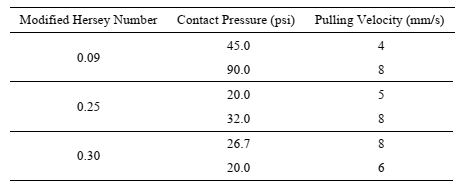
All friction tests were conducted with the material temperature at 120 °C, which corresponds to the processing temperature of the preforming process. Heating of the materials was done between the engaged platens using electric heaters embedded into the platens, and a digital temperature controller with a feedback loop in each of the platens maintained the target temperature.
For finite element modeling it is desired to have values for both the static coefficient of friction as well as the kinetic coefficient. To calculate the coefficient of friction from the measured data, Coulomb’s law revisited. Equations 5 and 6 outline how frictional coefficients are obtained [4].

and

where µs is the static coefficient of friction, FPeak is the pull-out force of the initial peak, µk is the kinetic coefficient of friction, Fss is the pull-out force during steady-state, and N is the normal force.
2.4 Sample Preparation
Prior to testing, the UHMWPE materials are cut to size from a roll. The materials were cut to 19.05 cm x 8.89 cm (7½ in. x 3½ in.) rectangles and folded on its long end. After folding, the material is fixed into the fabric holding mechanism shown in Figure 4, which utilizes mechanical hardware and a tongue and groove fitting to grip the material on three of its four sides to prevent any slipping.
Clamping all “free” ends of the continuous fiber in the holding mechanism prevents the presence of exposed fiber ends that can be pulled out from the platens during testing. After assembling, the resulting testing area of the material is 6.35 cm x 6.35 cm.
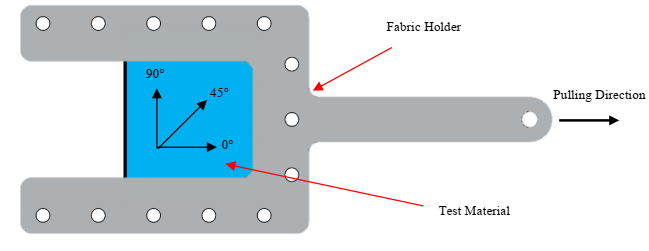 Figure 4: Fabric clamping mechanism.
Figure 5 shows a side view of the platens engaging a fabric sample without the fabric clamping mechanism. One critical component to the testing setup is the placing of a fabric spacer. Without it, the platens would tilt and pinch on the far-left side of the platens during the pulling process. The left-side pinching creates a large gap on the opposite side, which can prevent the platens from remaining in contact with the fabric samples. In turn, inaccurate contact pressures would occur, leading to inaccurate results. The materials were tested at fiber orientations of 0°, 45°, and 90° relative to the direction of pulling as shown in Figure 5.
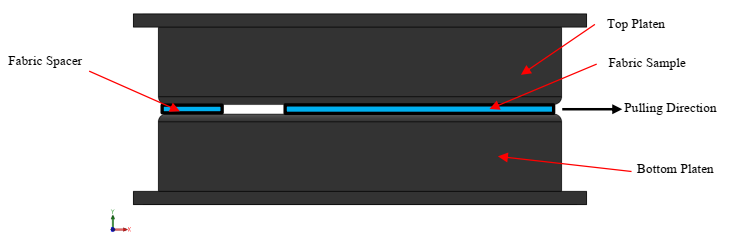 Figure 5: Material in between platens.
3 Results and Discussion
The coefficient of friction for the two material systems was explored as a function of fiber orientation and resin side per the conditions that are summarized in Table 1.
3.1 Fiber Orientation Effects
Figure 6 illustrates the resulting static coefficients of friction of the three tested fiber orientations for the HB210 and the HB311; sheets. To make a direct comparison, the coefficient results were separated by their respective resin-rich (R+) and resin-poor (R-) material sides. For the R+ side of the HB210 (Figure 6a), it was observed that all of the nominal static friction-coefficient values are relatively close to each other and lie within a standard deviation of one another, making it difficult to take away any definitive fiber orientation dependencies. In the case of the R- HB210 (Figure 6b), it was observed that the 90° fiber orientation values were consistently larger than the 0° values, which may give some insight to a fiber orientation dependency. The R+ and R- static frictioncoefficient results of the HB311 (Figures 6c and 6d, respectively) show that the static coefficient increases with respect to an increasing modified Hersey number despite the resulting values lying within a standard deviation of each other. Much like the R+ static-coefficient results, most of the R- results lie within a standard deviation of each other and the coefficient values increase with the modified Hersey number.
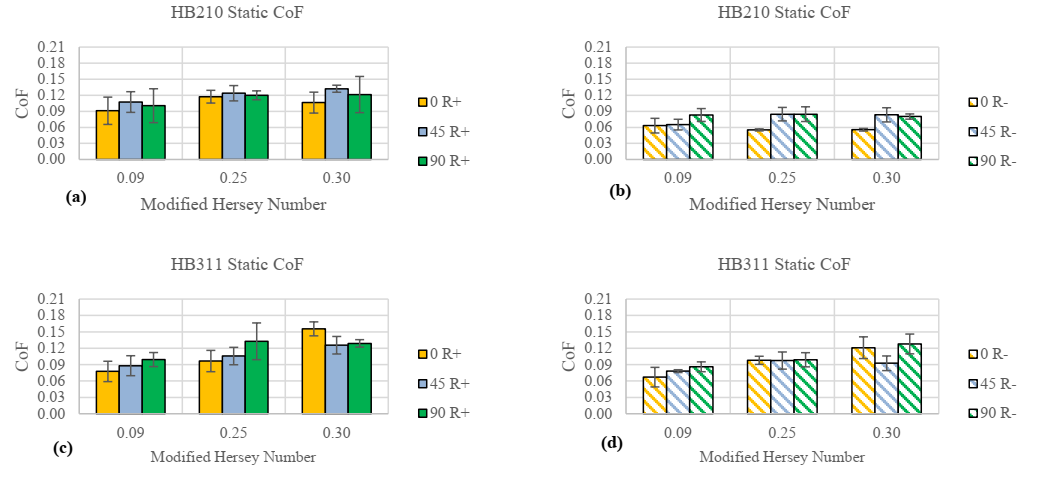 Figure 6. Static Coefficient comparison of HB311 and HB210.
After the material begins to move during the forming process, the friction transitions from static to the dynamic. The test results from the dynamic coefficient-of-friction testing are shown in Figure 7. The average values of the R+ results of the HB210 (Figure 7a) suggest that the dynamic coefficient of friction is a function of the fiber orientation, but the credibility of the trend becomes questionable when the standard deviation magnitudes are brought into consideration. For the HB210 material, it was observed that the 90° values were larger than the 0° across both R+ and R- sides of the material. The dependency is shown clearly in Figure 7b which suggests that the dynamic coefficient of friction of the HB210 is strongly connected to the orientation of UHMWPE fibers relative to the direction of pulling. The HB311 results (Figure 7c & 7d) do not show fiber orientation influences as strongly as the HB210 results do. Instead, the HB311 dynamic results show that the 45° fiber angle has the lowest average coefficients of friction for both the R+ and the R- sides of the material. This result is interesting because it was expected that the 45° results would lie somewhere between the 0° and the 90° values.
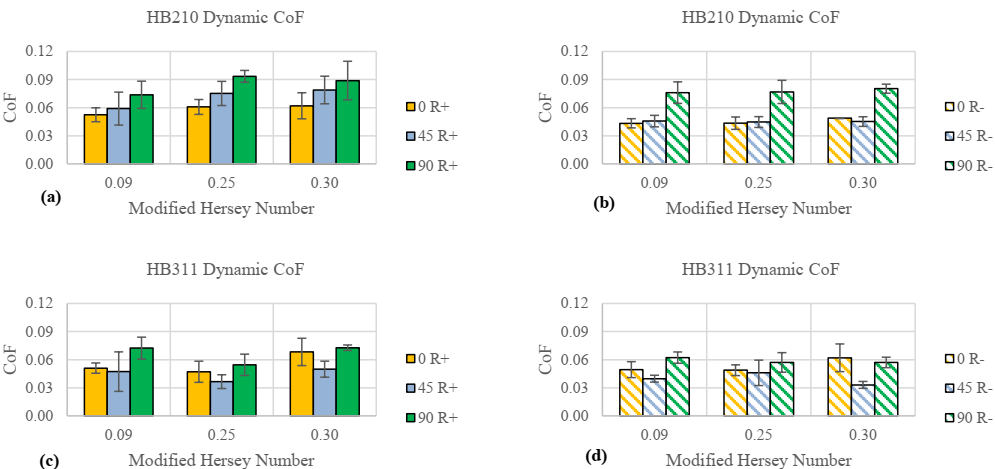 Figure 7. Kinetic Coefficient comparison of HB311 and HB210.
3.2 Resin Side Dependency
To characterize the frictional properties of the UHMWPE materials, the resin-rich (R+) and resin-poor (R-) sides of the sheets were tested to observe any differences between them. Figure 8 compares each side for each of the materials at each combination of the modified Hersey number and fiber orientation that were investigated. There is some evidence of higher coefficients among the HB311 R+ results, but the magnitude of variance among the average values makes it difficult to show the differences between the material sides (Figure 8 a-c). The HB210 static results (Figure 8 d-e) show that the R+ surfaces have a larger coefficient of friction than the Rsides of the material. Overall, the trends in Figure 8 show the static coefficient of friction of the HB210 sheets is influenced much more by the resin surface than the HB311 sheets.
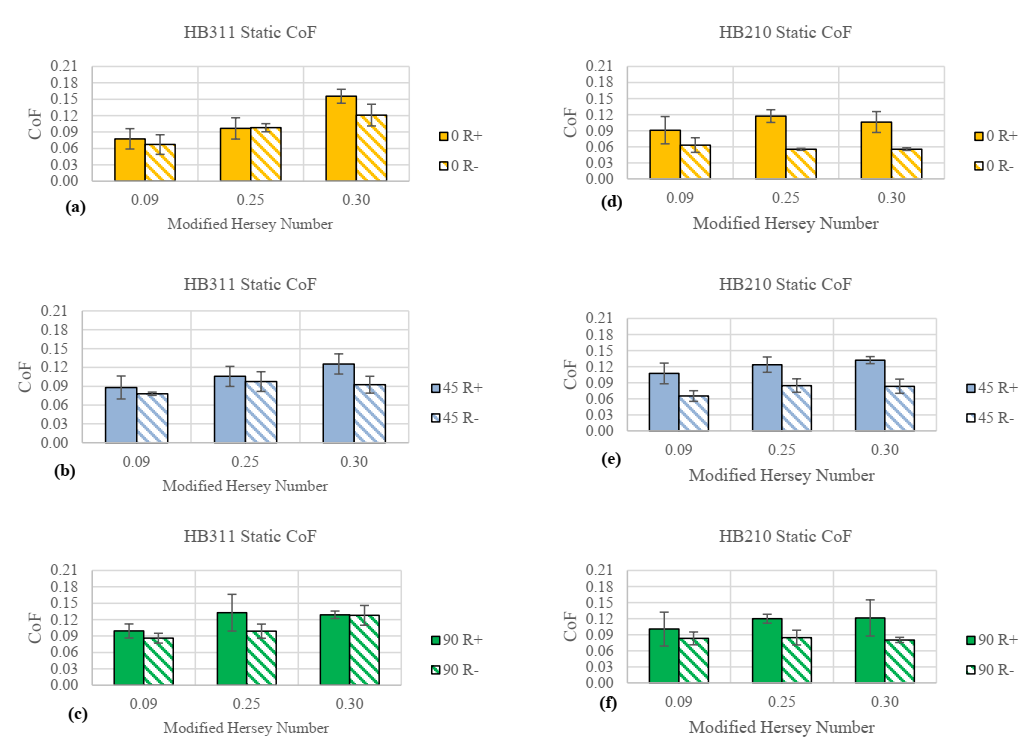 Figure 8: Static coefficients of friction for HB210 and HB311 as a function of resin surface and pull orientation.
The dynamic coefficients of friction results are shown in Figure 9. The results of the HB311 show that there is very little dependency between the resin surfaces (Figure 9 a-c) because of how close the values of the R+ and R- sides are. In some cases, the average dynamic coefficient value was found to be larger for the 90° tests than the 0°, which was unexpected. It is suspected that the HB311 is thin enough that the melted resin can disperse among the entire sample at high temperatures. Once the resin soaks into the layup, the structure of the fabric sample would be similar for either the resin rich or the resin poor samples. In the case of the HB210, most of the dynamic coefficient values are larger on the R+ side of the material than on the R- side Figure 9 (d-f), which suggests that the dynamic coefficient of friction for the HB210 is dependent on the resin surface of the material.
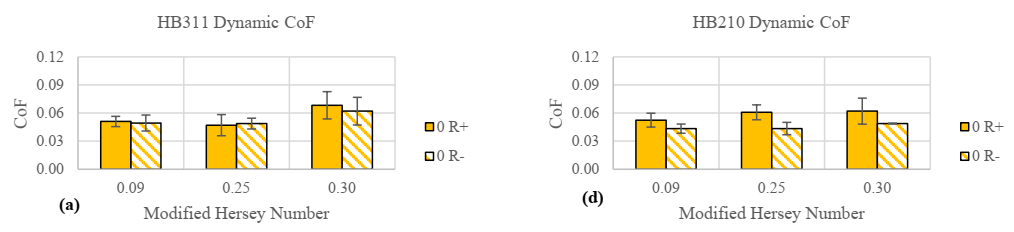
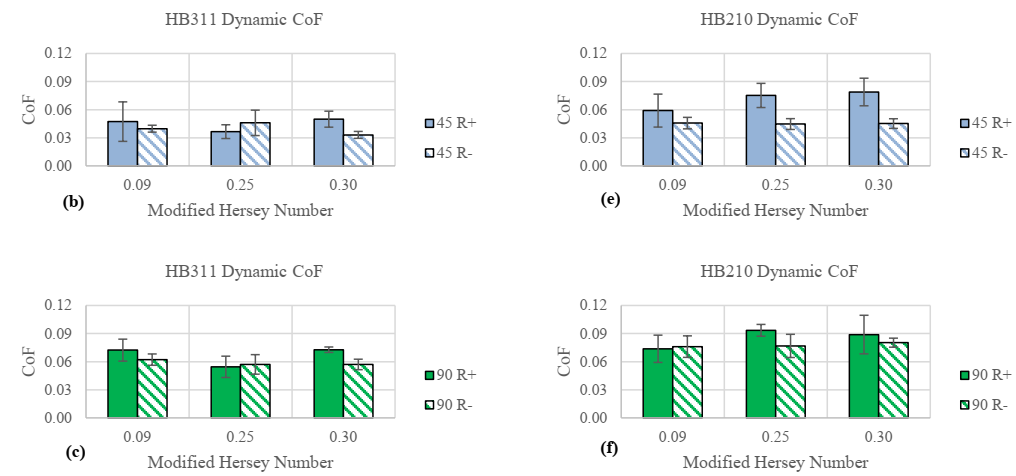
Figure 9: Dynamic Friction Coefficient Results.
4 Conclusion
In this study, the friction behaviors of two UHMWPE cross-ply material systems (HB210 and HB311) were characterized as a function R+ vs. R- surface type and fiber orientation with respect to pull direction. Multiple combinations of pullout speed and normal pressure were considered to span a range of modified Hersey numbers. It was found that the static coefficients of friction for both materials were within one standard deviation of each other, making it difficult to draw conclusion concerning dependence on fiber orientation. Dynamic coefficients of friction indicate that the R- surface of the HB210 has larger coefficients at 90° than 0°, suggesting that the R- surface is influenced by fiber orientation. Surprisingly, the HB311 dynamic results show that the 45° values were lower than both the 0° and the 90° tests. Finally, it was found that HB210 has a dependency on the resin surface of the material with resin rich values being notably larger than resin poor. HB311 was found to have little to no resin surface influence.
Acknowledgements
The research in this work was made possible by the supported of the Army Research Laboratory. The authors also thank DSM for providing the materials for characterization, and Konstantine Fetfatsidis for the development of the testing system.
