


- Home
- Volume 11 (2007)
- numéro 4
- Geographical allozymes differentiation in wild Phaseolus lunatus L. of the Central Valley of Costa Rica and its implications for conservation and management of populations


View(s): 2415 (12 ULiège)
Download(s): 107 (1 ULiège)

Geographical allozymes differentiation in wild Phaseolus lunatus L. of the Central Valley of Costa Rica and its implications for conservation and management of populations

Editor's Notes
Received on June 22nd, 2006, accepted on July 3rd, 2007
Résumé
Différenciation géographique des allozymes chez la forme sauvage de Phaseolus lunatus L. dans la Vallée Centrale du Costa Rica et ses implications pour la conservation et la gestion des populations. Afin de proposer une stratégie de conservation et de gestion pour la forme sauvage du haricot de Lima (Phaseolus lunatus L.) dans la Vallée Centrale du Costa Rica, nous avons examiné la distribution spatiale de la variabilité génétique de 96 populations. Dix loci enzymatiques ont été utilisés pour analyser les F-statistiques et l’indice I de Moran. Ces loci ont exprimé 20 allèles dont 5 ayant des fréquences relativement élevées étaient exclusivement localisés dans la partie centrale de la vallée. Les valeurs estimées des F-statistiques indiquaient un haut niveau de différenciation génétique entre les populations (FST=0,504±0,094). Une telle valeur suggère que la forme sauvage de P. lunatus maintient environ 50 % de sa variabilité totale entre les populations. En outre, les niveaux de consanguinité (FIT=0,882±0,026 et FIS=0,761±0,012) étaient significativement supérieurs à zéro. En conséquence, la composition génotypique du haricot de Lima sauvage dévie des proportions de Hardy-Weinberg suite à la différenciation génétique entre les populations et à l’absence de la panmixie dans les populations. L’analyse de l’autocorrélation spatiale effectuée à partir des données de quatre loci a montré que l’indice I de Moran était positif et significatif à courtes distances pour la plupart des loci. Les corrélogrammes qui en résultent ont montré une variation stochastique irrégulière ainsi que l’existence d’une structuration spatiale de la diversité génétique en taches. En combinant les résultats des études précédentes concernant la structure génétique, le système de reproduction, le flux de gènes et la démographie, nous avons proposé des facteurs et mécanismes d’évolution qui pourraient moduler la variabilité génétique des populations analysées. En plus, nous avons indiqué les populations qui pourraient être protégées et proposé une stratégie fiable de gestion in situ.
Abstract
To suggest a conservation and management strategy for wild Lima bean (Phaseolus lunatus L.) in the Central Valley of Costa Rica, we examined the spatial distribution of genetic variation in 96 populations, using ten enzyme loci to analyse F-statistics and Moran’s I. These loci displayed 20 alleles, of which 5 with relatively high frequencies were exclusively localised in the central part of the Valley. The estimates of F-statistics indicated a high level of genetic differentiation between populations (Mean FST=0.504±0.094). Such a value suggested that wild P. lunatus maintains about 50% of its genetic variation among populations. Moreover, the levels of inbreeding (FIT=0.882±0.026 and FIS=0.761±0.012) were high and significantly different from zero. Hence the genotypic composition of wild Lima bean deviated from Hardy-Weinberg proportions as a result of genetic differentiation between populations and non-random mating within populations. Spatial autocorrelation analysis using four loci showed positive and significant Moran’s I at short distance in most cases. The resulting correlograms displayed up and down stochastic variations and indicated a patchy genetic structure. Combining the results obtained with those previously published on genetic structure, mating system, gene flow, and demography, we suggested probable causal factors and evolutionary mechanisms driving the genetic variability of the populations analysed. In addition, we indicated populations that should be preserved and proposed a reliable in situ management strategy.
Table of content
1. Introduction
1In research on appropriate way to address plant resources conservation and management strategies, knowledge of the amount of genetic diversity and the spatial distribution of this diversity is essential for a correct diagnosis of the status, threats, and viability of populations (Hamrick, Allard, 1972; He et al., 2000; Escudero et al., 2003; Wilson, 2004). Genetic diversity may be spatially structured at different scales (geographic, population, subpopulation, etc.), due to environmental influence, life history, and demographic traits of the species (Loveless, Hamrick, 1984; Slatkin, 1985; Oostermeijer et al., 2003). Consequently, spatial genetic structure provides a valuable tool for inferring causal factors and underlying operating evolutionary forces such as selection, gene flow, and drift (Nevo et al., 1982; Nevo et al., 1986; Barbujani, 1987; Epperson, 1990; Wilson, 2004).
2Levin (1974), Loveless, Hamrick (1984), Wade, McCauley (1988), Oostermeijer et al. (1994) and Grassi et al. (2004) have highlighted the influence of environmental factors (including human activities and various interactions) and life history traits of plant species on population viability and genetic variability. An increasing number of studies have also integrated data from ecology, population biology, genetics, and reproductive biology in order to formulate reliable conservation and management strategies of populations (Schaal, Levin, 1976; Guerrant, 1992; Widén, 1993; Alvarez-Buylla et al., 1996; Oostermeijer et al., 2003). In these investigations, spatial analysis methods are of a special interest (Sokal, Oden, 1978a; Sokal, Oden, 1978b; Legendre, Fortin, 1989; Escudero et al., 2003). Indeed, this technique may be helpful, for example, for the improvement of sampling strategies in collecting seeds for ex situ conservation, the selection of populations that should be protected in situ, the determination of the area size necessary for the conservation of a particular population, the selection of a specific site for the establishment of a corridor population, etc.
3In 1992–2002, a wide research program describing population genetic structure, gene flow, genetic variability at geographical level, reproductive biology, and dynamics of wild Lima bean (Phaseolus lanatus L.) populations was conducted in the Central Valley of Costa Rica with the aim of developing a strategy for in situ conservation and management. This material represents a very important genetic reservoir for the improvement of the various Phaseolus bean cultigens, commonly found in many traditional cropping systems in Latin America and East Africa (Maquet, Baudoin, 1997). In this project, P. lunatus is also considered as a plant model due to its alternatively outbreeder-inbreeder behaviour. Indeed, Lima bean is a self-compatible annual or short-living perennial species with a mixed-mating system, but predominantly self-pollinating, since the average outcrossing rate is low: 0.096±0.071 (Zoro Bi et al., 2004).
4Wild individuals in the valley are characterized by an indeterminate, climbing and vigorous growth habit, showing a prolonged flowering period (mid-November to mid-February) and a heavy pod load. Around 400 wild P. lunatus populations have been recorded in collaboration with the University of San José (Costa Rica) in the target area, which covers 2100 km2, in variants of premontane and lower montane humid forests, with altitudes ranging from 500 to 1800 m.a.s.l. Reproductive individuals can bear several racemes (about 400) with 1-20 pods per raceme, each pod containing 1-5 seeds. A three-year soil seed bank study indicated the occurrence of 3-5 seeds/m2 according to populations (Degreef et al., 2002). The annual germination rate from this soil seed bank ranged from 70 to 86%. In order to investigate the population genetic aspects, 22 enzyme loci from 15 enzymatic systems were resolved and their genetic basis established (Zoro Bi et al., 1999). Sampling strategies integrating criteria of efficiency relevant to multilocus and many target populations have been investigated, in particular the number of plants and the number of seeds to be sampled (Zoro Bi et al., 1998). Using the 22 enzyme loci resolved and the determined seeds sampling strategy, we analysed the genetic structure of 29 populations (Zoro Bi et al., 2003). Thus, we quantified the proportion of polymorphic loci (P=10.32%), the mean number of alleles per locus (A=1.10), and the mean effective number of alleles per locus (Ae=1.05). The genotypic composition of the analysed populations showed deviation from the expected Hardy-Weinberg proportions. The total heterozygosity (HT), the intrapopulation genetic diversity (HS) and the interpopulation genetic diversity (DST) were 0.193, 0.082, and 0.111 respectively. From the level of genetic differentiation between populations (FST=0.444) which suggest that wild Lima bean maintains most of its isozyme variation among populations, gene flow was estimated, calculating the number of migrants per generation and assuming an island model (Wright, 1951): Nm=0.398.
5In order to refine the diagnosis of genetic status and threats on wild Lima bean from the Central Valley of Costa Rica, additional investigations concerning the spatial structure of the genetic variation have been suggested. Here we report the results of a study aimed at determining the geographical distribution of allozyme frequencies, based on 96 wild Lima bean populations from the Central Valley of Costa Rica. Specifically, our goals were:
6– to assess the patterns of the spatial distribution of the genetic diversity;
7– to identify populations that were particularly interesting for conservation purposes;
8– to suggest an in situ management strategy for the studied plant material.
2. Material and methods
2.1. Plant material and sampling method
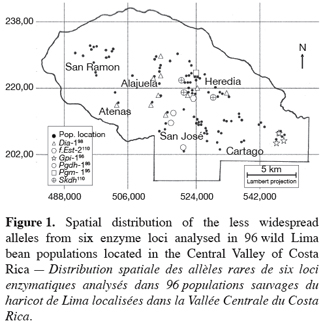
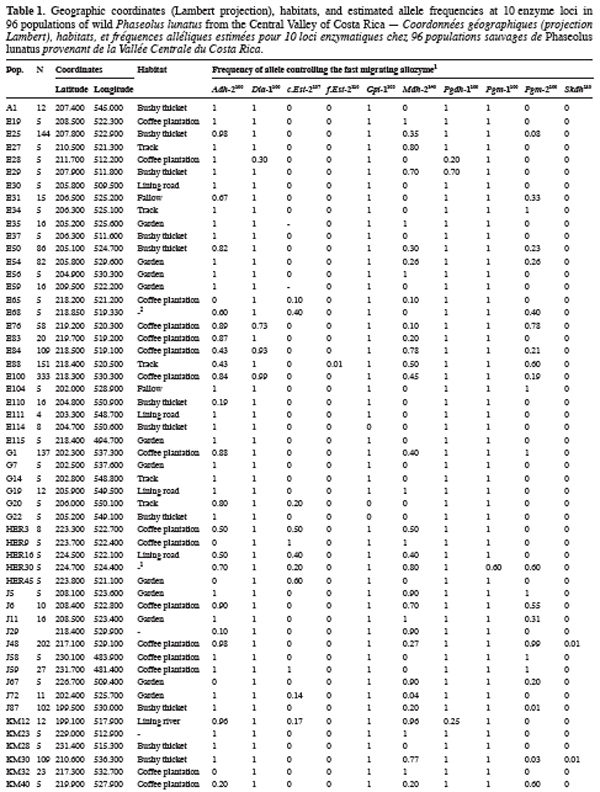
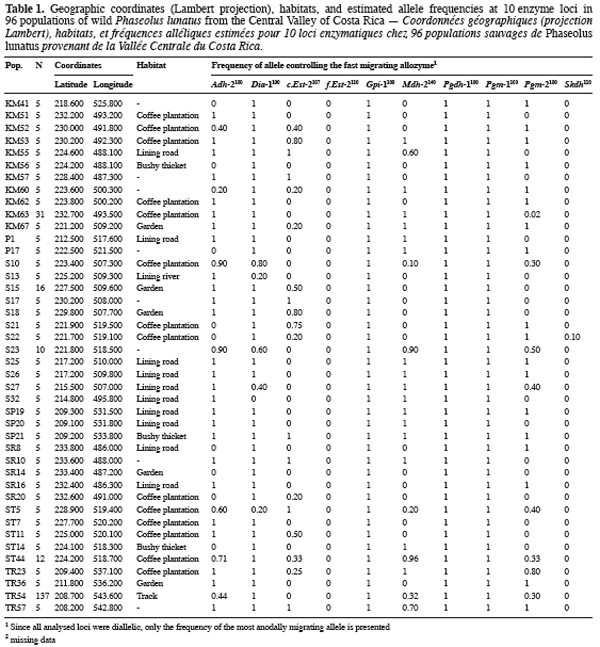
9Ninety-six wild Lima bean populations distributed in the Central Valley of Costa Rica (Figure 1) were sampled between 1993 and 1998, from January to March, corresponding to the time of seed maturity. Each population was followed during a complete season so that all individuals bearing pods during this season were sampled. Geographical coordinates (Lambert projection) and associated vegetation of each sampled population were recorded (Table 1). The 29 populations analysed previously for the genetic structure study (Zoro Bi et al., 2003) were included in the 96 selected populations. A population is here defined as any set of individuals, regardless of size that lives in the same habitat patch and isolated at least 500 m from other plants of the same species. We adopted a sampling strategy integrating criteria of efficiency relevant to a multilocus model and many target populations, designed for Lima bean (Zoro Bi et al., 1998). Thus, in each selected population, we sampled all pod-bearing plants, resulting in sample sizes of one to 60 plants per population, and four to six racemes per plant. One seed was randomly chosen per raceme for electrophoretic analysis, resulting in sample sizes ranging from four to 334 seeds per population, according to the number of pod-bearing plants. The selected populations were identified by alpha-numeric codes.
2.2. Electrophoretic analysis
10For electrophoretic variation, we analysed ten readable and reproducible enzyme loci resolved from eight enzymatic systems: alcohol dehydrogenase (ADH, E.C. 1.1.1.1), diaphorase (DIA, E.C. 1.8.1.4), esterases (fluorimetric and colorimetric: fEST and cEST, E.C. 3.1.1.-), glucose-6-phosphate isomerase (GPI, E.C. 5.3.1.9), malate dehydrogenase (MDH, E.C. 1.1.1.37), phosphogluconate dehydrogenase (PGDH, E.C. 1.1.1.44), phosphoglucomutase (PGM, E.C. 5.4.2.2), and shikimate dehydrogenase (SKDH, E.C. 1.1.1.25). Enzyme extraction was done by grinding 5-day-old cotyledon tissues in a potassium phosphate buffer, pH 7.0, containing 20% sucrose, 5% PVP-40, 0.05% triton X-100, 14 mM 2-mercaptoethanol, and 0.1 M KH2PO4. The pH value was adjusted to 7.0 with a solution of 5 M NaOH. Electrophoresis was performed using a horizontal 10% starch-gel containing 3% sucrose. Two buffer systems were employed: continuous histidine-citrate, pH 6.1 for ADH GPI, MDH, and PGDH, and discontinuous lithium-borate, pH 8.1/Tris-citrate, pH 8.4 for DIA, cEST, fEST, PGM, and SKDH. The techniques for gel electrophoresis and histochemical staining procedures are those reported elsewhere (Zoro Bi et al., 1999).
11Loci were labelled sequentially, with those migrating closest to the anodal end designated as number 1. Accession G25221 from the collection of the Centro Internacional de Agricultura Tropical (CIAT, Cali, Colombia), a Mexican wild form, was used as the control for our analyses. The allozyme from this genotype was designated 100 and all other allozymes were assessed according to their relative migration distance. The genetic control and the quaternary structure of the analysed enzyme systems have been discussed previously (Zoro Bi et al., 1999).
2.3. Data analysis
12The allozyme multilocus genotypes from polymorphic loci (99% criterion) were recorded and the obtained data were used to calculate allelic frequencies. We used G-tests (Sokal, Rohlf, 1995) to evaluate significant heterogeneity in allele frequencies among populations. F-statistics (FIT, FIS, and FST) estimated from genetic markers provide information on the genetic structuring within and among populations (Weir, Cockerham, 1984). Of these indices, the value of FST indicates how much of the genetic variation is partitioned among populations and then, can be used as a measure of the genetic differentiation that can be expected as a consequence of low level of gene flow among populations or steady differential selection (Slatkin, 1985; 1987). To analyse the genetic differentiation among the studied wild Lima bean populations, F-statistics were estimated for all polymorphic loci according to Weir and Cockerham (1984) and FST was tested for significant difference from zero using a Student t-test (Sokal, Rohlf, 1995). Allele frequencies and F-statistics were computed using the GENEPOP software (Raymond, Rousset, 1995).
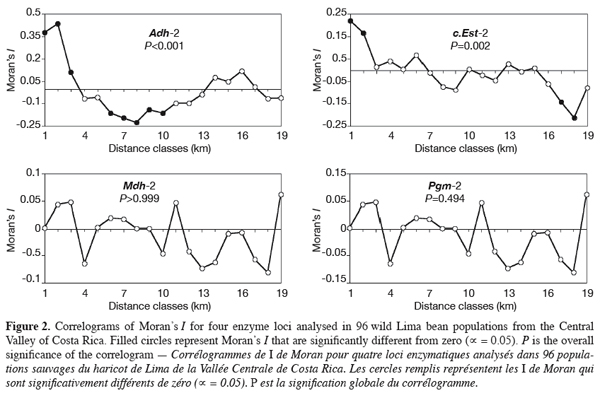
13We tested whether geographical-scale spatial arrangement of allele frequencies was random using spatial autocorrelation analysis (Cliff, Ord, 1973; Sokal, Oden, 1978a); results were presented as correlograms, i.e. graphics in which values of the autocorrelation coefficients are plotted against distance classes. Spatial autocorrelation analysis tests whether observations of a variable at one geographical site are independent of observations at neighbouring sites. The spatial autocorrelation was quantified using Moran’s I (1950) calculated from allele frequencies on individual populations. To perform the test, populations were connected according to Gabriel-connected scheme (Gabriel, Sokal, 1969). A total of 4560 connexions were then drawn. The performed Gabriel-connected graph was subdivided into 19 distance classes, each class corresponding to about 3 km. The distance classes number was chosen to ensure that at least 30 pairs of points were included for each class (Legendre, Fortin, 1989). Tests of significance (against the null hypothesis that allele frequencies were randomly distributed in space) were performed for each distance class by a randomisation process, whereas the overall significance of correlograms was tested using Bonferroni approximation. Calculation of Moran’s I and the tests of significance were performed using the SAAP software (Wartenberg, 1989). Four enzyme loci (Adh-2, c.Est-2, Mdh-2, and Pgm-2) with two widespread alleles (both alleles observed in at least 15 populations) were selected to perform the spatial autocorrelation tests. For the other loci, expressing polymorphism in less than 15 populations (Dia-1, f.Est-2, Gpi-1, Pgdh-1, Pgm-1, and Skdh), we plotted the less common alleles locations on the sampling map to evaluate visually their spatial distribution.
3. Results
3.1. Populations’ genetic differentiation
14Each of the ten polymorphic loci analysed displayed two alleles, resulting in a total of 20 alleles observed. The most anodally migrating allozyme frequencies, calculated for each population and each locus are presented in table 1. The loci f.Est-2 and Pgm-1 expressed polymorphisms in only one population (E88 for f.Est-2 and HER30 for Pgm-1), inducing skewed estimates for G-tests and inflated F-statistics values. Consequently, these two loci were discarded in performing G-tests and F-statistics calculation.
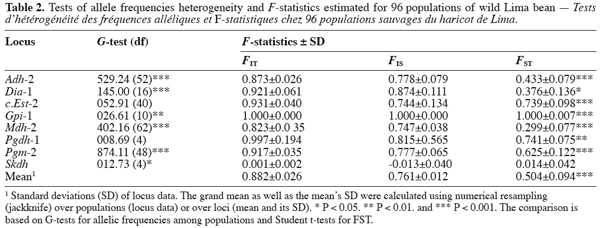
15Six out of eight loci tested showed significant allele frequencies heterogeneity among populations (Table 2). Non-significant G values were obtained with c.Est-2 (G=52.92, df=40, P=0.065) and Pgdh-1 (G=8.69, df=4, P=0.101). As expected on the basis of the previous studies (Zoro Bi et al., 2003; 2004), the estimated F-statistics indicated a high level of genetic differentiation between populations (Mean FST=0.504±0.094), suggesting that wild Lima bean maintains about 50% of its isozyme variation among populations. Such tendency was confirmed by the fact that for all loci analysed except Skdh, the estimates of FST were significantly different from zero (Table 2), resulting in a high and significant mean value. Concomitantly, FIT (the correlation between uniting gametes relative to all populations sampled) and FIS (the correlation between uniting gametes within individual populations) were high and significant for the majority of the loci analysed and hence, for the mean values. Indeed, low values of FIT and FIS were observed only for Skdh, with negative sign for FIS, suggesting an excess of heterozygotes at this locus. Contrary to Skdh, we obtained the highest estimates of F-statistics with Gpi-1 (FIT=FIS=FST=1), due to the fact that the two alleles observed at this locus were completely fixed in the sampled populations (i.e. in any population, p=1 and q=0 or p=0 and q=1). This suggested that the studied populations were completely differentiated at locus Gpi-1.
3.2. Spatial distribution of allele frequencies
16The less common alleles at six out of the ten loci analysed presented restricted geographic distribution. Indeed, besides the case of f.Est-2 and Pgm-1 explained before, the spatial distribution of the second allele from the four other loci (Dia-1, Gpi-1, Pgdh-1, and Skdh) showed an interesting particularity for conservation purpose (Figure 1): Dia-198, Pgdh-186, and Skdh110 were exclusively located in the central part, and Gpi-196 in the western part of the target site. Dry season in the western part is not as severe as in the central part.
17Spatial autocorrelation analysis was performed for alleles from four enzyme loci: Adh-2, c.Est-2, Mdh-2, and Pgm-2. The resulting correlograms are presented in figure 2. Positive autocorrelation was found at shorter distance for the main loci analysed and this was significant for Adh-2 (3-9 km) and c.Est-2 (3-6 km). Then, the autocorrelation decreased to become negative at distance of 9-39 km, with significant values for Adh-2 (12-30 km). At large distances (50-60 km), positive autocorrelation was observed again for alleles from Mdh-2 and Pgm-2; for the later, significant value was obtained at 54 km. For Adh-2 and c.Est-2, autocorrelation remained negative at the same lag classes, the trend being significant with c.Est-2 (51-54 km). Overall, the correlograms for the four individual loci showed an irregular shape, displaying up and down stochastic variations. Two correlograms, namely those of Adh-2 and c.Est-2, were significant (Figure 2). The pattern of correlograms indicated a patchy structure of allozyme variants in wild P. lunatus from the Central Valley of Costa Rica. The results show that isolation by distance occurs in these populations.
4. Discussion
18Of the 20 alleles recorded, six were sporadic and localised, with two private alleles (as defined by Slatkin, 1985): f.Est-2110 and Pgm-195. Two aspects of the results concerning these alleles appeared particularly interesting for conservation. First, data given in table 1 showed that except f.Est-2110 and Skdh110 (frequencies=0.01 and 0.01-0.10, respectively), all the alleles with a restricted distribution presented relatively high frequencies in most populations in which they were observed: 0.01-0.80 for Dia-198, 1 for Gpi-196, 0.30-0.80 for Pgdh-186, and 0.40 for Pgm-195. The second aspect of these results was the grouping of five of these alleles (Dia-198, f.Est-2110, Pgdh-186, Pgm-195, and Skdh110) in the central part of the Valley, Gpi-196 being localised in the western part, characterized by a less severe dry season compared to the central part (Figure 1). These results could be related with the breeding system of the wild Lima bean populations. Indeed such pattern of genetic variation is expected in general for any predominantly self-pollinating species (because alleles often tend to be fixed within population) displaying isolation by distance (because rare alleles will usually be restricted to a reduced geographical range due to limited dispersal). Another hypothesis to explain the two aspects of our results is the impact of selection. Genotypes with localised alleles could have relatively high viability or reproductive success, leading to high frequencies of these alleles in the populations involved. It has been established from studies of natural selection using various predominantly self-pollinated plant species that homozygote genotypes at a marker locus may differ substantially in fitness according to life cycle stages, seasons, and environment (Allard, Workman, 1963; Imam, Allard, 1965; Hamrick, Allard, 1972; Nevo et al., 1982; Nevo et al., 1986; Ennos, 1990). Simulation studies (Epperson, 1990) have also shown that selection can greatly contribute to the development of the spatial genetic structuring in plant populations. For wild Lima bean, the restricted geographic distribution of the sporadic alleles could indicate the occurrence of microhabitat-level alleles selection in the populations studied: as a result, genotypes carrying locally advantaged alleles might have high survival value, due to natural selection tending to increase the homozygosity. This hypothesis could be supported by data on Gpi-196 which, although rare (observed in only three populations), was completely fixed (frequency=1). As will be discussed more thoroughly later, random genetic drift in small bottlenecked populations and founder effects resulting from extinction/recolonisation episodes that characterised the populations studied could enhance the fixation process of the advantaged alleles. Indeed, these populations are usually found in open and disturbed areas with grasses and scattered trees or bushy thickets; they also colonise coffee plantations from the long-living fences (usually Erythrina and euphorbs) bordering the plots. Each year, some wild Lima bean populations are eliminated due to land management, such as growing urbanisation, severe grazing, seasonal fires in pasture lands and sugar cane plantations, and the replacement of traditional small-scale coffee plantations by modern high input demanding plantations (Rocha et al., 1997). Recolonisation of the cleared sites could be due to nearby plants or to new individuals emerging from the soil seed bank.
19Since the correlation between uniting gametes relative to all populations as expressed by FIT was high and significant (FIT=0.882±0.026), we deduced that the genotypic composition of wild Lima bean showed a deviation from the Hardy-Weinberg proportions. This disequilibrium was attributable to both genetic differentiation between populations (FST=0.504±0.094) and non-random mating within populations (FIS=0.761±0.012). The review of Hamrick and Godt (1990) based on eight life histories and ecological traits of plants, and presenting a compilation of statistics on populations’ genetic structure indicates that in short-lived perennial and predominantly selfing species, gene differentiation among populations is high. Lima bean is a mixed-mating and predominantly autogamous species (Zoro Bi et al., 2004) that is expected to express a high level of genetic divergence among populations, coupled with an important heterozygotes deficiency. The estimates of the populations’ genetic structure indices analysed in our study were in accordance with the designated trend. It should also be noted that the estimated F-statistics were close to those obtained from previous study using 29 populations and nine polymorphic loci (Zoro Bi et al., 2003): FIT=0.932±0.066, FIS=0.866±0.128, and FST=0.497±0.358. Factors explaining the genetic structuring in wild Lima bean populations and hypotheses on the evolutionary processes likely to affect them have been thoroughly discussed in the indicated paper. Briefly, it has been argued that the most likely phenomena explaining the low allelic richness, the frequent and steady heterozygotes deficiency, and the high genetic divergence of wild Lima bean populations are founder effects, genetic drift, high selfing rate, Wahlund effects, and limited gene flow between populations.
20Study of Rocha et al. (1997) has highlighted genetic drift and founder effects in the studied populations. Indeed, the authors established after a 7-year survey that of the 400 populations inventoried in the target site, about 60 (only 16%) contained more than five pod-bearing plants, so that genetic drift must be high. The presence of the founder effects is supported by the fact that during the period between 1992 and 1998, the number of plants reaching reproductive age differs markedly among years, varying from one to 50 plants in one population (data not shown).
21In the Central Valley of Costa Rica, the outcrossing rate of wild Lima bean is low, ranging from 0.027 to 0.268, with a mean of 0.096±0.071 (Zoro Bi et al., 2004). Such estimates suggested that this plant had a high level of autogamy.
22The Wahlund effects, i.e. the existence of genetic structure in a population, were mentioned as another factor explaining the frequent deficiency of heterozygotes observed. The actual genetic structure of wild Lima bean was assessed in a previous work using isozyme electrophoresis and three populations (Zoro Bi et al., 1997). Seeds were sampled according to a grid of 44 m for bidimensional populations or 4 m apart for linear populations and the genotypes of mother plants at each node were so determined. The genetic structure in the populations was obvious: alternative alleles at each locus were clustered in opposite parts of the populations, creating a patch structure mainly composed of homozygote individuals (Wahlund effects).
23From the estimates of FST (=0.504) and on the basis of Wright’s (1951) equation, as modified by Crow and Aoki (1984), the number of migrants per generation was Nm=0.243. This value must however be taken with caution because Wright’s equation is established for an island model at equilibrium and our populations are unlikely to be at equilibrium.
24Since most of the genetic variation in wild Lima bean proved to reside among populations, the question of how it is spatially organised appeared relevant. F-statistics provide information on the genetic structuring within and among populations. Tests of hypotheses on the evolutionary processes that account for the observed gene frequencies distribution, however, require more complex approaches such as spatial autocorrelation (Sokal, Oden, 1978a; Barbujani, 1987; Epperson, 1990; Heywood, 1991). The significant spatial autocorrelation of allele frequencies at shorter distance classes observed for most of the loci analysed indicated clearly that these variables were not spatially random in wild Lima bean from the Central Valley of Costa Rica. Recent reviews on genetic structure studies in plant populations (Sokal, Oden, 1978a; Barbujani, 1987; Heywood, 1991; Escudero et al., 2003; Vekemans, Hardy, 2004) have addressed differences in spatial distribution of genetic variation at various life stages or age classes and in different microenvironments of a particular population or zone. For wild Lima bean, the single-locus genetic structure due to isolation by distance is highly stochastic and may well explain alone variation among loci. Other mechanisms influencing the genetic structuring of the studied populations cannot be discarded, such as isolation-by-distance due to limited pollen and seed flow between populations, founder effects, genetic drift, and microhabitat selection of alleles. In our case, the dissimilar course of correlograms curves could result from combined effects of the factors suggested, creating various patch structures in wild Lima bean.
5. Implications for conservation and management
25Knowledge of the genetic variability within a taxon is crucial for conservation purposes, when interpreted within a broader ecological and organismal context. For wild P. lunatus populations, isozyme electrophoresis data indicated high genetic heterogeneity among populations, localised alleles, and patchy structures of allele frequencies throughout the sampled zone. The occurrence of patchy genetic structure show the relevance of in situ conservation actions for these populations. The results also suggest that many populations distributed throughout the range of the species should be protected, since the conservation of few populations would not guarantee the preservation of a representative sample of the existing genetic diversity, as alleles distribution greatly varied between patches. Thus, protecting the following populations should preserve the less common and localised alleles identified: E28, E29, E76, E84, E88, E114, G22, HER30, J48, KM12, S10, S13, S23, S27 and ST5. Moreover, if populations E35, G1, G19, J59 and KM32 are included, the preserved allelic variation would be increased to 100%.
26Once populations have been selected for in situ conservation, their sound management is necessary to preserve a high level of genetic variability. For wild Lima bean populations, an appropriate management method was indicated from demographic and soil seed banks studies (Degreef et al., 1997; Degreef et al., 2002). These authors reported that most wild P. lunatus populations from the target zone produced adult individuals every year and were characterised by abundant seeds production. However, rainfall during the post-ripening period or adult plants destruction by man or cattle could markedly reduce seeds production and then, the number of individuals in such populations the next year. Seed dormancy and soil seed banks in these populations ensured the recolonisation of the sites. Based on information gained from these studies, it was suggested to pay particular attention to the timing of clearing and weeding which are regularly carried out in the sites. Indeed, weeding coffee plantations in which wild Lima bean populations are localised just after the seed dispersal (at the end of the dry season) favours the breakdown of seed dormancy and reduces germination delays, because these practices expose the seeds to high temperatures and humidity at the moment of the first rains. Clearing was proposed at the beginning of the rain season, since field observations showed that populations cut or disturbed during the dry season were less likely to regrow and accordingly, less likely to produce seeds in the next fruiting period.
27The most reliable way for the preservation of wild P. lunatus genetic variability in the Central Valley of Costa Rica is the design of synthetic populations with all the allelic diversity identified, given that natural populations are threatened, due to several human activities in this zone. In 1998, synthetic populations have been established in protected sites throughout the Valley. These synthetic populations should contain genotypes carrying all the alleles identified. Preliminary demographic study on the synthetic populations confirmed that a careful management is required to break seed dormancy. Weeding during rainy season could speed up the colonisation process and ensure the stability of these populations (Meurrens et al., 2001).
28It must be recognised that allozymes often underestimate levels of intra- and interpopulations genetic variation for adaptive traits crucial to the survival and reproduction of plants (Hamrick et al., 1991; Francisco-Ortega et al., 2000). Consequently, further investigations using more variable genetic markers such as microsatellities, AFLPs, RADPs or ISSRs (Schaal et al., 1991; Amos, Hoelzel, 1992, Ouédraogo et al., 2005) are required to refine the present results and suggestions for the conservation and management of wild P. lunatus and other plant species with similar biological and ecological traits.
29Acknowledgements
30We thank the Professor Oscar Rocha (Universidad de Costa Rica, Escuela de Biología) for its franc involvement in the preservation and characterisation of wild Lima beans in the Central Valley of Costa Rica. We thank also Dr Jérome Degreef (National Botanic Garden, Meise, Belgium) for assistance with plant materials sampling. This research was financed by the Direction Générale de la Coopération au Développement (DGCD, Brussels, Belgium) and supervised by IPGRI (Rome, Italy). A scholarship to the first author was provided by the Scientific Research Ministry of Côte d’Ivoire.
Bibliographie
Allard RW., Workman PL. (1963). Population studies in predominantly self-pollinated species. IV. Seasonal fluctuations in estimated values of genetic parameters in Lima bean populations. Evolution 17, p. 470–480.
Alvarez-Buylla ER., Chaos Á., Piñero D., Garay AA. (1996). Demographic genetics of a pioneer tropical tree species: patch dynamics, seed dispersal and seed banks. Evolution 50 (3), p. 1155–1166.
Amos B., Hoelzel AR. (1992). Applications of molecular genetic techniques to the conservation of small populations. Biol. Cons. 61, p. 133–144.
Barbujani G. (1987). Autocorrelation of gene frequencies under isolation by distance. Genetics 117, p. 777–782.
Baudoin JP., Degreef J., Hardy O., Janart F., Zoro Bi I. (1998). Development of an in situ conservation strategy for wild Lima bean (Phaseolus lunatus L.) populations in the central valley of Costa Rica. In Owens SJ., Rudall PJ. Reproduction biology. Kew, England: Royal Botanic Gardens, p. 417–426.
Cliff AD., Ord JK. (1973). Spatial autocorrelation. London: Pion Limited, 178 p.
Crow JF., Aoki K. (1984). Group selection for a polygenic behavioral trait: estimating the degree of population subdivision. Proc. Natl Acad. Sci. USA 81, p. 6073–6077.
Degreef J., Baudoin JP., Rocha OJ. (1997). Case studies on breeding systems and its consequences for germplasm conservation. 2. Demography of wild Lima bean populations in the central valley of Costa Rica. Genet. Resour. Crop. Evol. 44, p. 429–438.
Degreef J., Rocha OJ., Vanderborght T., Baudoin JP. (2002). Soil seed bank and seed dormancy in wild populations of Lima bean (Fabaceae): considerations for in situ and ex situ conservation. Am. J. Bot. 89 (10), p. 1644–1650.
Ennos RA. (1990). Detection and measurement of selection: genetic and ecological approaches. In Brown AHD., Clegg MT., Kalher AL., Weir BS. Plant population genetics, breeding, and genetic resources. Sunderland, Massachusetts, USA: Sinauer Associates Inc., p. 200–214.
Epperson BK. (1990). Spatial autocorrelation of genotypes under directional selection. Genetics 124, p. 757–771.
Escudero A., Iriondo JM., Torres ME. (2003). Spatial analysis of genetic diversity as a tool for plant conservation. Biol. Cons. 113 (3), p. 351–365.
Francisco-Ortega J., Santos-Guerra A., Kim SC., Crawford DJ. (2000). Plant genetic diversity in the Canary Islands: a conservation perspective. Am. J. Bot. 87, p. 909–919.
Gabriel KR., Sokal RR. (1969). A new statistical approach to geographic variation analysis. Syst. Zool. 18, p. 259–278.
Grassi F., Imazio S., Gomarasca S., Citterio S., Aina R., Sgorbati S., Sala F., Patrignani G., Labra M. (2004). Population structure and genetic variation within Valeriana wallrothii Kreyer in relation to different ecological locations. Plant Sci. 116, p. 1437–1441.
Guerrant EO Jr. (1992). Genetic and demographic considerations in the sampling and reintroduction of rare plants. In Fiedler PL., Jain SK. Conservation biology: the theory and practice of nature conservation, preservation and management. London: Chapman and Hall, p. 321–344.
Hamrick JL., Allard RW. (1972). Microgeographical variation in allozyme frequencies in Avena barbata. Proc. Natl Acad. Sci. USA 69 (8), p. 2100– 2104.
Hamrick JL., Godt JW. (1990). Allozyme diversity in plant species. In Brown AHD., Clegg MT., Kalher AL., Weir BS. Plant population genetics, breeding and genetic resources. Sunderland, Massachusetts, USA: Sinauer Associates Inc., p. 43–63.
Hamrick JL., Godt MJW., Murawski DA., Loveless MD. (1991). Correlations between species traits and allozyme diversity: implications for conservation biology. In Falk DA., Holsinger KE. Genetics and conservation of rare plants. Oxford, UK: Oxford University Press, p. 75–86.
Hardy O., Dubois S., Zoro Bi I., Baudoin JP. (1997). Gene dispersal and its consequences on the genetic structure of wild populations of Lima bean (Phaseolus lunatus) in Costa Rica. Plant Genet. Resour. Newsl. 109, p. 1–6.
He T., Rao G., You R., Ge S., Hong D. (2000). Spatial autocorrelation of genetic variation in three stands of Ophiopogon xylorrhizus (Liliaceae s.l.). Ann. Bot. 86, p. 113–121.
Heywood JS. (1991). Spatial analysis of genetic variation in plant populations. Annu. Rev. Ecol. Syst. 22, p. 335–355.
Imam AG., Allard RW. (1965). Population studies in predominantly self-pollinated species. VI. Genetic variability between and within natural populations of wild oats from differing habitats in California. Genetics 51, p. 49–62.
Legendre P., Fortin MJ. (1989). Spatial pattern and ecological analysis. Vegetatio 80, p. 107–138.
Levin SA. (1974). Distribution and population interactions. Am. Nat. 108 (960), p. 207–229.
Loveless MD., Hamrick JL. (1984). Ecological determinants of genetic structure in plant populations. Annu. Rev. Ecol. Syst. 15, p. 65–95.
Maquet A., Baudoin JP. (1997). Aperçu de la distribution néotropicale de Phaseolus lunatus. Belg. J. Bot. 130 (1), p. 93–116.
Meurrens F., Degreef J., Rocha OJ., Baudoin JP. (2001). Demographic study in micro-conservation sites with a view to maintaining in situ wild Lima beans (Phaseolus lunatus L.) in the Central Valley of Costa Rica. Plant Genet. Resour. Newsl. 128, p. 45–50.
Moran PAP. (1950). Notes on continuous stochastic phenomena. Biometrika 37, p. 17–23.
Nevo E., Golenberg EM., Bieles A., Brown AHD., Zohary D. (1982). Genetic diversity and environmental association of wild wheat, Triticum diccocoides in Israel. Theor. Appl. Genet. 62, p. 241–254.
Nevo E., Beiles A., Kaplan D., Golenberg EM., Olsvig-Whittaker L., Naveh Z. (1986). Natural selection of allozyme polymorphisms: a microsite test revealing ecological genetic differentiation in wild barley. Evolution 40 (1), p. 13–20.
Oostermeijer JGB., van Eijck MW., den Nijs JCM. (1994). Offspring fitness in relation to population size and genetic variation in the rare perennial plant species Gentiana pneumonanthe (Gentianaceae). Oecologia 97, p. 289–296.
Oostermeijer JGB., Luijten SH., den Nijs JCM. (2003). Integrating demographic and genetic approaches in plant conservation. Biol. Cons. 113 (3), p. 389–398.
Ouédraogo M., Maquet A., Baudoin JP. (2005). Etude comparative de la diversité et de la structure génétique de populations sauvages de Phaseolus lunatus L. à l'aide des marqueurs enzymatiques et microsatellites. Biotechnol. Agron. Soc. Environ. 9 (3), p. 195–205.
Raymond M., Rousset F. (1995). Genepop (Version 1.2): population genetics software for exact tests and ecumenicism. J. Hered. 86 (3), p. 248–249.
Rocha OJ., Macaya G., Baudoin JP. (1997). Causes of local extinction and recolonization, determined by 3 years of monitoring wild populations of Phaseolus lunatus L. in the central valley of Costa Rica. Plant Genet. Resour. Newsl. 112, p. 44-48.
Schaal BA., Levin DA. (1976). The demographic genetics of Liatris cylindricaea Michx. (Compositae). Am. Nat. 110, p. 191–206.
Schaal BA., O'Kane Jr SL., Rogstad SH. (1991). DNA variation in plant populations. Trends Ecol. Evol. 6 (10), p. 329–333.
Slatkin M. (1985). Gene flow in natural populations. Annu. Rev. Ecol. Syst. 16, p. 393–430.
Slatkin M. (1987). Gene flow and the geographic structure of natural populations. Science 236, p. 787–792.
Sokal RR., Oden NL. (1978a). Spatial autocorrelation in biology: 1. Methodology. Biol. J. Linn. Soc. 10, p. 199–228.
Sokal RR., Oden NL. (1978b). Spatial autocorrelation in biology: 2. Some biological implications and four applications of evolutionary and ecological interest. Biol. J. Linn. Soc. 10, p. 229–249.
Sokal RR., Rohlf FJ. (1995). Biometry. New York: Freeman, W.H. and Company, 776 p.
Vekemans X., Hardy O. (2004). New insights from fine-scale spatial genetic structure analyses in plant populations. Mol. Ecol. 13 (4), p. 921–935.
Wade MJ., McCauley DE. (1988). Extinction and recolonization: their effects on the genetic differentiation of local populations. Evolution 42 (5), p. 995–1005.
Wartenberg D. (1989). Spatial autocorrelation analysis programm (SAAP). Piscataway (NJ), USA: Rutgers University.
Weir BS., Cockerham CC. (1984). Estimating F-statistics for the analysis of population structure. Evolution 38 (6), p. 1358–1370.
Widén B. (1993). Demographic and genetic effects on reproduction as related to population size in a rare, perennial herb, Senecio integrifolius (Asteraceae). Biol. J. Linn. Soc. 50, p. 179–195.
Wilson I. (2004). Spatial population genetics. Trends Ecol. Evol. 19 (5), p. 229–230.
Wright S. (1931). Evolution in mendelian population. Genetics 16, p. 97–159.
Wright S. (1951). The genetical structure of populations. Ann. Eugenet. 15, p. 323–354.
Zoro Bi I., Maquet A., Baudoin JP. (1997). Spatial patterns of allozyme variants within three wild populations of Phaseolus lunatus L. from the central valley of Costa Rica. Belg. J. Bot. 129 (2), p. 149–155.
Zoro Bi I., Maquet A., Degreef J., Wathelet B., Baudoin JP. (1998). Sample size for collecting seeds in germplasm conservation: case of the Lima bean (Phaseolus lunatus L.). Theor. Appl. Genet. 97 (1–2), p. 187–194.
Zoro Bi I., Maquet A., Baudoin JP. (1999). Genetic control of isozymes in the gene pool Phaseolus lunatus L. Biotechnol. Agron. Soc. Environ. 3 (1), p. 10–27.
Zoro Bi I., Maquet A., Baudoin JP. (2003). Population genetic structure of wild Phaseolus lunatus (Fabaceae), with special reference to population sizes. Am. J. Bot. 90 (6), p. 897–904.
Zoro Bi I., Maquet A., Baudoin JP. (2004). Mating system of wild Phaseolus lunatus L. and its relationship to population size. Heredity 92 (2), p. 153–158.
To cite this article
About: Arsène Irié Zoro Bi
Université d’Abobo-Adjame. UFR des Sciences de la Nature. 02 BP 801. Abidjan 02 (Côte d’Ivoire). E-mail : zorobi@uabobo.ci
About: Jean-Pierre Baudoin
Gembloux Agricultural University – FUSAGx. Unité de Phytotechnie tropicale et Horticulture. Passage des Déportés, 2. B-5030 Gembloux (Belgique).
