


- Accueil
- Volume 26 (2022)
- Special issue : 150 years of CRA-W
- Specific density as parameter for separating feed ingredients


Visualisation(s): 1406 (16 ULiège)
Téléchargement(s): 127 (0 ULiège)

Specific density as parameter for separating feed ingredients

Document(s) associé(s)
Version PDF originaleRésumé
La densité spécifique comme paramètre de séparation des matières premières des aliments pour animaux
Description du sujet. Les densités spécifiques de 13 échantillons de huit matières premières végétales et de farine de sang destinées à l’alimentation animale ont été déterminées.
Objectifs. Le but de l'étude était de recourir à la densité spécifique comme paramètre pour la classification d'une sélection de matières premières utilisées en alimentation animale. La gamme de densités spécifiques pour chacune des matières premières testées pourrait aider à l'identification des matières premières dans un aliment composé pour animaux. Les matières premières en mélanges pourraient être séparées en jouant sur les densités spécifiques.
Méthode. La part du flotat et du sédiment de chacune des matières testées a été déterminée en double le long d'une gamme de densités spécifiques croissantes du mélange de solvants, en allant de 1,22 g·cm-3 à 1,52 g·cm-3, initialement en quatre étapes. Des densités intermédiaires ont parfois été mises en œuvre pour affiner les données. Les densités spécifiques ayant généré soit ~100 % de sédiment, soit ~100 % de flotat sont utilisées comme indicateurs de la plage de densités spécifiques de cette matière.
Résultats. Les matériaux utilisés semblaient présenter trois gammes différentes de densités spécifiques : le gluten de maïs et la farine de sang (1,12 – 1,32 g·cm-3), les drêches de maïs, la farine de graines de colza, la farine de graines de soja et les issues de blé (1,25 – 1,42 g·cm-3), et le tourteau de palmiste, la pulpe d'agrumes et la pulpe de betterave (1,35 – 1,55 g·cm-3). Les densités spécifiques s’échelonnent entre celles trouvées pour les muscles des vertébrés et les fragments d'insectes (inférieures à 1,3 g·cm-3) et celle des fragments osseux (supérieure à 1,62 g·cm-3). Quatre échantillons mélangés, chacun composé de deux matières premières différentes dans un rapport de 1:1 (p/p) ont été testés avec des solvants à différentes densités spécifiques. Les matières premières de chaque échantillon mélangé semblaient se séparer dans les fractions attendues, principalement soit dans le flotat soit dans le sédiment.
Conclusions. Les expériences montrent que la séparation basée sur la densité spécifique peut aider à l'identification des matières premières constitutives des aliments pour animaux dans une ou plusieurs combinaisons de fractions de sédiment et de flotat.
Abstract
Description of the subject. Specific densities of 13 samples of eight vegetable feed ingredients and of blood meal have been established.
Objectives. The aim of the study was to use the parameter specific density for classification of a selection of feed materials. The range of specific densities for each of the tested materials could support the identification of ingredients in a compound feed. Ingredients in mixtures could be separated when different specific densities apply to these ingredients.
Method. The share of the flotate and of the sediment of each of the tested materials has been established in duplicate along a range of increased specific density of the solvent mixture, from 1.22 g·cm-3 up to 1.52 g·cm-3, initially in four steps. Intermediate densities have been used where appropriate for collecting more detailed ranges. The specific densities which resulted in approximately 100% sediment and in approximately 100% flotate are used as indicators for the range of the specific density of that material.
Results. The materials used appeared to show three different ranges of specific density: corn gluten and blood meal (1.12 – 1.32 g·cm-3), corn distillers’ grain, rapeseed kernel meal, soya kernel meal and wheat middlings (1.25 – 1.42 g·cm-3), and palm kernel meal, citrus pulp and beet pulp (1.35 – 1.55 g·cm-3). The specific densities range from those found for vertebrate muscles and insect fragments (below 1.3 g·cm-3) up to the specific density of bone fragments (exceeding 1.62 g·cm-3). Four mixed samples, each existing of two different ingredients at a ratio of 1:1 (w/w) were tested with solutions at different specific densities. The ingredients of each mixed sample appeared to separate in the expected fractions, predominantly in either the flotate or in the sediment.
Conclusions. The experiments show that separation based on specific density can assist in the identification of feed ingredients in one or more combinations of sediment and flotate fractions.
Table des matières
Received 16 September 2021, accepted 9 November 2022, available online 14 December 2022.
This article is distributed under the terms and conditions of the CC-BY License (http://creativecommons.org/licenses/by/4.0)
1. Introduction
1Authenticity is, for several reasons, an intrinsic part of the control on safety of feed and food (Regulation (EU) 2017/625). The information on the label of a product is the first and most obvious source of information to decide on the specific tests to be applied for monitoring safety aspects. The type(s) of material as indicated on the label provides the reference to types of prohibited compounds and to their maximum residue limits or other limits. Therefore, feed and food materials are required to be labelled according to a set of specifications, including composition. Proper labelling supports enforcement, traceability and control purposes (Regulation (EC) 767/2009, preamble 17). Documentation on the nature and origin of the components of aggregate feed and food products would facilitate detection of fraud, which is important for consumers’ confidence, besides the necessary enforcement of adverse economic activities (Regulation (EU) 2017/625 repealing Regulation (EC) 882/2004; Decision (EU) 2015/1918). Related to this, the organization of international markets and trade for agricultural products demand methods and procedures to identify materials for proper categorization (Regulation (EU) 1308/2013; Regulation (EU) 2016/1821).
2The identification of materials intended for use in compound feed is part of the discipline of microscopic and visual inspection. The European Union’s Feed Catalogue provides a range of materials, which should be, in principal, detectable (Regulation (EU) 68/2013, consolidated version of 1 July 2020). Annual proficiency tests provide documentation on the level of expertise. Certain feed materials are difficult to distinguish. Examples are the distinction between beet pulp and citrus pulp (van Raamsdonk et al., 2017) and the distinction between palm pit kernel meal and vertebrate blood meal (van Raamsdonk et al., 2018). Another issue is the estimation of the shares of feed materials with a small contribution to the total composition. These are usually overestimated (van Raamsdonk et al., 2017; 2020a). One parameter currently not used for support of the identification of feed materials is the specific density, which might be expected to vary.
3The specific density is a common parameter in microscopic procedures for the separation of certain fractions from a sample. In the detection of animal by-products, the first procedural step is the separation of a sediment containing heavy particles in tetrachloroethylene (TCE, specific density D = 1.62 g·cm-3), if present, after grinding a sample (Regulation (EC) 152/2009, consolidated version 16 November 2020). The effect is a concentration of the target particles with a specific density larger than 1.62 g·cm-3, principally minerals and bone fragments. Strategies for using mixtures of solvents with other densities for sample preparation were applied in several modified versions of the known procedures. A French method was based on two solvents with different densities, resulting in two sediments. The first sediment fraction would occur at the plane between TCE and a mixture of TCE and tetrabromoethane (TBE; D = 2.4 g·cm-3), and a second sediment at the bottom of the TCE/TBE mixture. Bone fragments were expected to show up primarily in the first sediment, and the minerals primarily in the second, heaviest fraction (Michard & Ziebal, 1999; Gizzi et al., 2004; Liu et al., 2011). Sensitivity issues led to the discredit of this approach (see van Raamsdonk et al., 2007). Separation of vertebrate muscle fibers from compound feed samples was achieved by applying a mixture of two solvents with an adjusted density. A range of solvent combinations was tested in different ratios. The experimental results indicated a combination of TCE and heptane as most promising. For the particular aim to separate muscle fibers from the remaining material of a compound feed, a mixture of TCE and heptane in the ratio 7:3 (v/v) with a specific density of 1.33 g·cm-3 was successfully used (Bremer et al., 2012). A more recent application of specific density separation was initiated by the desire to concentrate insect shell fragments. A combination of the solvents TCE and petroleumether was used with the approximate final density of 1.26 g·cm-3 (Veys & Baeten, 2018). Considering the specific density applied, a separation of vertebrate muscle fibers along with the insect shell parts can be expected. The relative similarity of palm kernel meal and vertebrate blood meal could lead to confusion (van Raamsdonk et al., 2018). It can be hypothesized that blood meal, as other materials of animal origin such as muscle fibers, show a low specific density, which would facilitate density separation.
4Specific density is also used as parameter in other disciplines, e.g. mineralogy. A specific application connected to feed and food safety is the separation of microplastic particles from products related to the production of food. Microplastic particles were successfully separated from inorganic or mineral materials with a different (mostly higher) specific density, e.g. river sediment, beach sand, marine clay, fertilizer and sea salt (Klein et al., 2015; Iñiguez et al., 2017; Leslie et al., 2017; Gündoğdu, 2018; Kosuth et al., 2018; Weithmann et al., 2018; Hantoro et al., 2019). Specific densities of types of microplastic range from 0.8 to 2.3 g·cm-3 (Hidalgo-Ruz et al., 2012; Quinn et al., 2017), which is lower compared to that of sand or clay minerals, which are in the range of 2.60 to 2.94 g·cm-3 (Osipov, 2012). However, the specific density of montmorillonite can be as low as 1.40 g·cm-3 in hydrated form (Osipov, 2012). Although specific density differs among different types of microplastic, considerable documentation is needed for proper application (van Raamsdonk et al., 2020b). Parallel to the situation in mineral materials and microplastics, differences in specific density among the range of feed materials can be assumed. The current study aims at collecting a proof of principle of separation of a selected set of feed materials.
5Experiments were conducted for establishing the range of specific density of eight different feed ingredients, represented by 13 different samples. Mixed samples consisting of two ingredients with equal shares were tested for the options to separate the ingredients, and the results were verified with microscopic confirmation of the content of the flotations and sediments.
2. Materials and methods
2.1. Materials
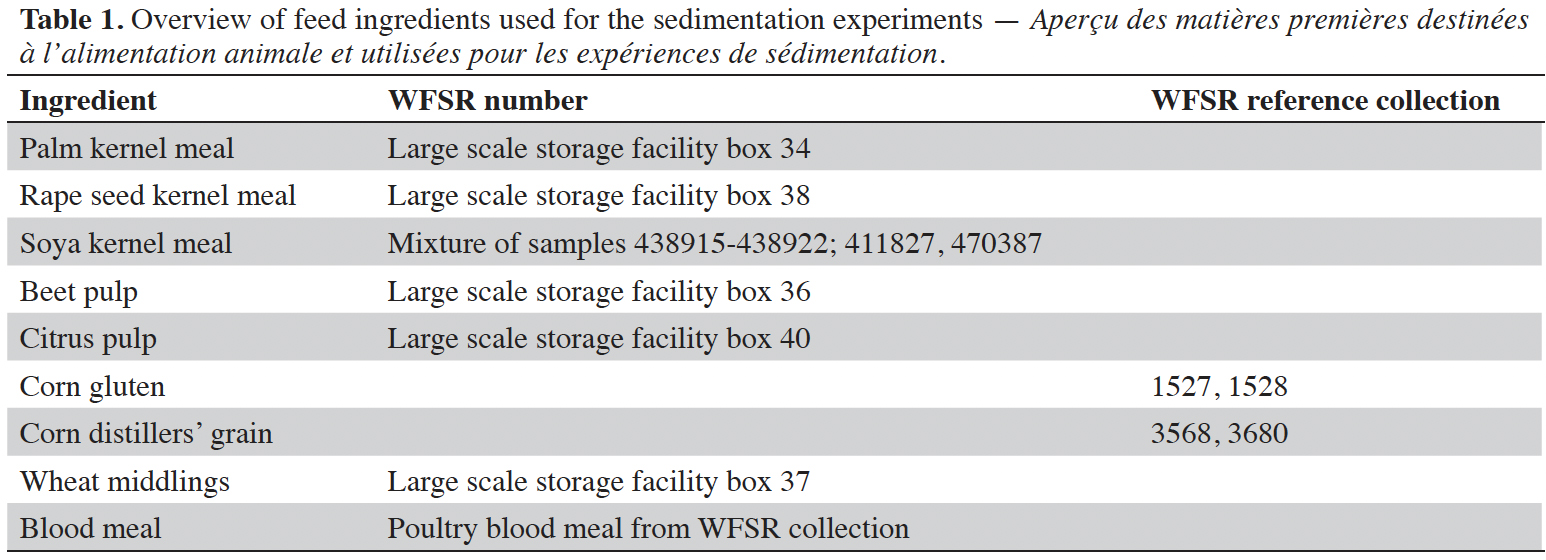
6Eight different feed ingredients have been used in the sedimentation experiments. These are listed in table 1 together with their source.
2.2. Procedure
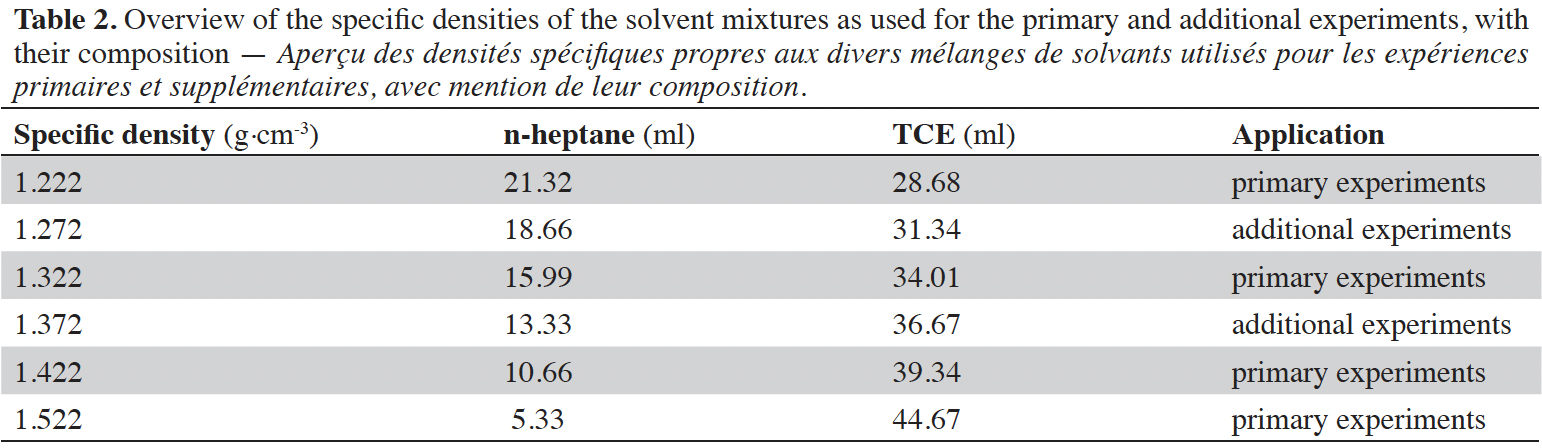
7The correct ratio of n-Heptane (specific density 0.684 g·cm-3) and Tetrachloroethylene (1.622 g·cm-3) has been calculated using a calculation tool developed in Excel for obtaining the desired densities. This tool is freely available at WFSR. Stock solutions of these solvents have been made in storage bottles for use during the experiments. Because of the volatile nature of these solvents, new stock solutions were prepared every day of experimentation, in order to assure the correct densities. Six mixtures with specific densities in the range of 1.222 to 1.522 g·cm-3 have been applied (Table 2). The filtration papers were weighed beforehand and their exact weight was marked in mg.
8Fifty ml of each of the four stock primary solutions were poured in separate beakers. Four amounts of a minimum of 500 mg of sample material were weighed and their exact weight written down in mg, the weighed samples were then added to each of the solutions respectively. The solutions are stirred and let to settle for 1 minute. When the sample only floats or sinks, the solution was poured over its respective filter. Some TCE was used to wash out the remaining sample material in order to assure that all the sample material was transferred to the filter. In those cases that both a flotation and a sediment was formed, a laboratory spoon was used to carefully scoop out the floating material and put it on a marked watch glass. The sample was left to settle again for 30 seconds and then the remaining flotate was scooped out as well. This process was repeated until the solution was cleared of the flotate and only the sediment remained. The remaining solution with the sediment was poured over a filtration paper and the beaker was washed with TCE in order to transfer the entire sample material to the filter. All filters with the respective materials were placed in a fume hood to dry.
9After a couple of hours, the filters and watch glasses were checked for any remaining solvent. When all of the solvent had evaporated filtration papers including the sample were weighed and the weight of the filter was subtracted. The sample fractions on the watch glass were brushed off the glass onto a weighing boat and weighed.
10The weights of the flotate and sediment were used to calculate the flotate/sediment (w/w) percentages.
3. Results
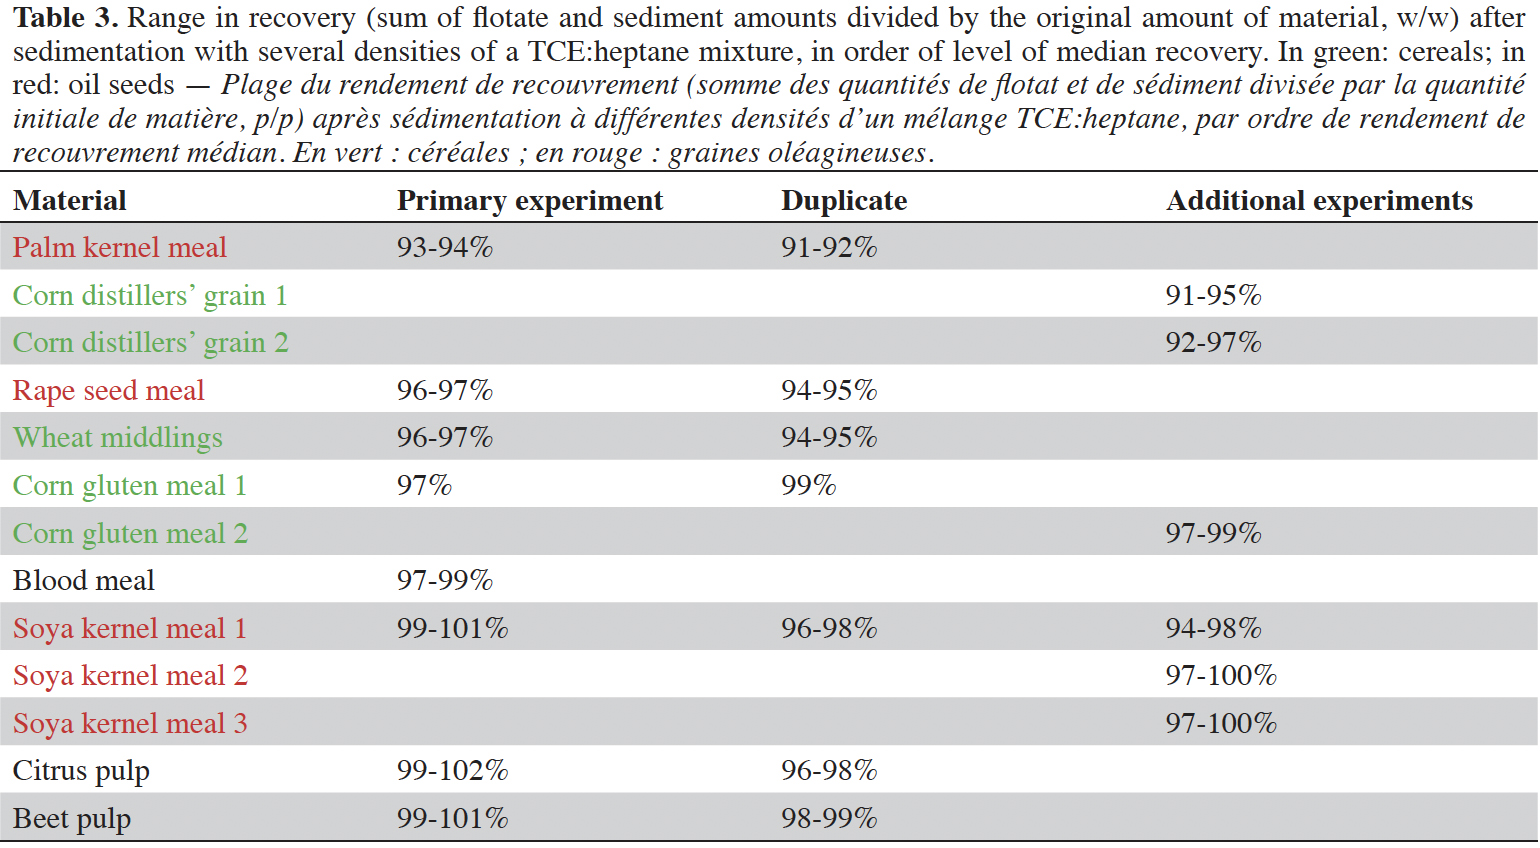
11The application of the protocol as set out in the section Materials and Methods resulted in a set of flotations and sediments per sample per specific density of the solvent. A range of several specific densities was applied at regular intervals from the specific density of 100% of tetrachloroethylene (1.62 g·cm-3) in steps of 0.1 or 0.05 g·cm-3. Along the range of increased specific density of the solvent, from 1.22 g·cm-3 up to 1.52 g·cm-3, initially in four steps, the share of the flotate increased, in most cases from 0% to 100%. The recovery rate for most samples and experiments was between 92% and 102% (median = 97%), with very few exceptions as low as 86% for the experiments with the mixed materials or as high as 110% resulting from a measurement artefact in one experiment. The results of this experiment are eligible, since the mass balance flotate/sediment (w/w) is still applicable in relative sense. In all cases the recovery rate was within the most frequently used range for recovery (80-110%), which is a widely applied range for recovery of a component after extraction from a sample.
12The recovery of all materials and experiments is presented in table 3. The recoveries of the duplicates of experiment 1 were generally lower than found in experiment 1. For both the groups of cereals and oil seeds, slight differences occur among the different types of materials. Oil seed material can still contain traces of oil after the extraction process, which might have a higher share in palm kernel meal than found in the soya kernel meals. Blood meal is an extremely fine granular powder, which can hardly be collected as flotate using a spoon. The material was sucked from the fluid plane by using a Pasteur pipette. This appeared to be a sufficient alternative procedure in the view of the recovery close to 100%. The range of recoveries in cereals is comparable to that of oil seeds. However, there is no obvious component which can be assumed to be dissolved in the mixture of TCE:heptane.
13The exploratory experiment 1 with a set of seven regular feed ingredients, investigated in duplicate, showed a diversity in specific density (Figure 1). The relative large steps among the densities of the solvent range (δ = 0.1 g·cm-3) resulted in a pattern of differences of almost full sedimentation to almost full flotation in the range of densities. Several groups can be distinguished. Oil seeds (rape seed, soya kernel) showed a specific density between 1.22 and 1.42 g·cm-3. Palm kernel meal, an oil seed as well, was found to have a pattern comparable to that of the pulps (citrus, beet) with a specific density between 1.42 and 1.52 g·cm-3. The cereals (corn gluten, wheat middlings) appeared to have a diversity in specific density between 1.22 and 1.42 g·cm-3. The duplicate analyses produced highly comparable results in all cases.
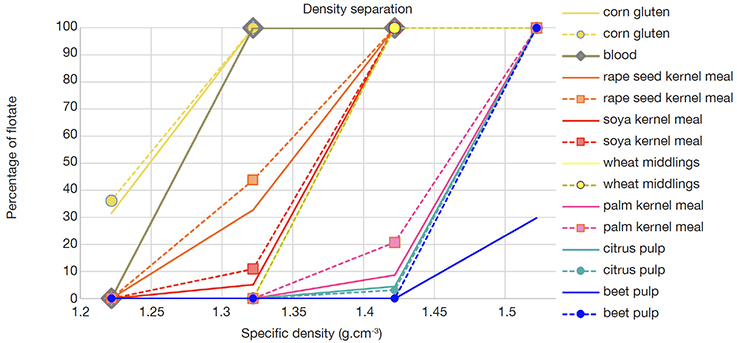 Figure 1. Specific density profiles of seven vegetable feed ingredients and blood meal. y-axis: percentage of flotate (amount of flotate divided by the sum of the amounts of flotate and sediment, w/w). Straight lines: first experiments; dashed lines: experiments for verification — Profils de densités spécifiques de sept matières premières végétales et d’une farine de sang. En ordonnées : pourcentage de flotat recueilli (quantité de flotat divisée par la somme des quantités de flotat et de sédiment, p/p). Lignes droites : premières expériences ; lignes pointillées : expériences pour vérification.
14Several additional experiments were carried out. These experiments had the aim to investigate the diversity among different versions of the same type of material, the reproducibility of the results, and to precise the turn-over point of the specific density.
15Three different samples of soya kernel meal were used for several additional experiments. Soya kernel meal 1 has been used in the first exploratory experiment. The three samples showed a gradually different specific density. In the solvent mix with a specific density of 1.32 g·cm-3, meal 1 showed a share of flotate around 10%, meal 2 a share of 45-65%, and meal 3 a flotate share of 70-85% (Figure 2). This meal 3 was found to produce a flotate share of 30-40% at a density as low as a specific density of 1.22 g·cm-3 (green lines in figure 2). The several replicates were highly comparable. An experiment with intermediate steps (1.27 and 1.37 g·cm-3) resulted in a reproducibility of the differences between the samples (dotted lines in figure 2).
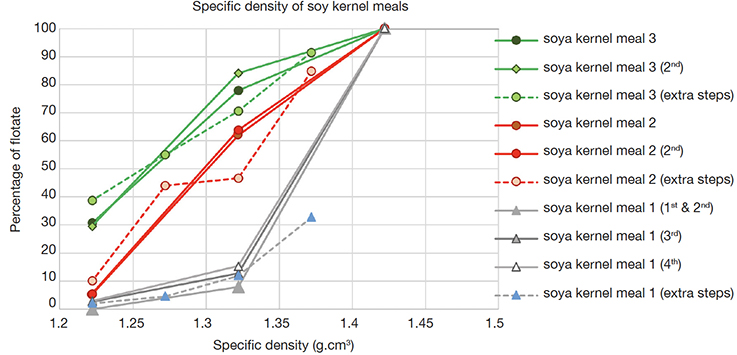 Figure 2. Specific density profiles of three samples soya kernel meal. y-axis: percentage of flotate (amount of flotate divided by the sum of the amounts of flotate and sediment, w/w) — Profils de densités spécifiques de trois échantillons de farine de graines de soja. En ordonnées : pourcentage de flotat recueilli (quantité de flotat divisée par la somme des quantités de flotat et de sédiment, p/p).
16Two types of corn materials, gluten feed and distillers’ grain, each represented by two different samples, showed a difference in their specific density (Figure 3). Within-sample and within-type diversity appeared to be low.
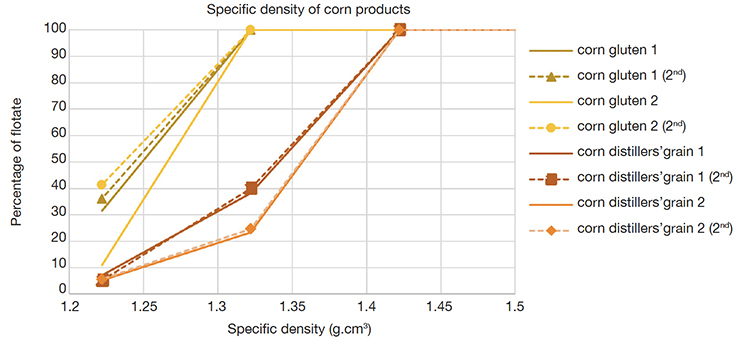 Figure 3. Specific density profiles of four samples corn material. y-axis: percentage of flotate (amount of flotate divided by the sum of the amounts of flotate and sediment, w/w) — Profils de densités spécifiques de quatre échantillons de matière première à base de maïs. En ordonnées : pourcentage de flotat recueilli (quantité de flotat divisée par la somme des quantités de flotat et de sédiment, p/p).
17The poultry blood meal was concentrated as sediment in the solvent with a specific density of 1.22 g·cm-3, and as flotate at specific densities of 1.32 g·cm-3 and 1.42 g·cm-3. This indication of the specific density could allow to separate it from some feed ingredients of vegetable origin.
18The opportunity to separate mixtures of feed ingredients was tested by applying the sedimentation protocol with different specific densities to four different mixtures. The mixtures consisted of citrus pulp/soya kernel meal, palm kernel meal/soya kernel meal, beet pulp/wheat middlings, and palm kernel meal/blood meal, each in a ratio of 1:1 (w/w), and a total weight of approximately 1 gram.
19Only one fraction resulted after sedimentation of the mixture citrus pulp/soya kernel meal at both the specific density of the solvent of 1.52 g·cm-3 (only flotate) and 1.32 g·cm-3 (only sediment), in both cases with an expected share of each of the two ingredients of 50%. The sedimentation at the specific density of 1.42 g·cm-3 resulted in a flotate of 441 mg and a sediment of 525 mg (recovery 93%). These fractions were found to contain for the vast majority soya kernel meal and citrus pulp, respectively (Figure 4). The mixture palm kernel meal/soya kernel meal resulted in a flotate of 445 mg and a sediment of 480 mg (recovery 87%) at the specific density of 1.42 g·cm-3. These fractions were found to consist primarily of soya kernel meal and palm kernel meal, respectively. A precise calculation for this particular mix was hampered by the relatively low recovery, which prevented to make the assumption that both ingredients were evenly represented in the collected fractions. In both mixtures the soya kernel meal was primarily present in the flotate, which matches the low specific density of this material (Figure 1). Notwithstanding this incomplete mass balance, the relative shares of the two subfractions in the total of the recovered amount of material would fix the total contribution of the ingredients in each of the subsamples to the composition of the original sample.
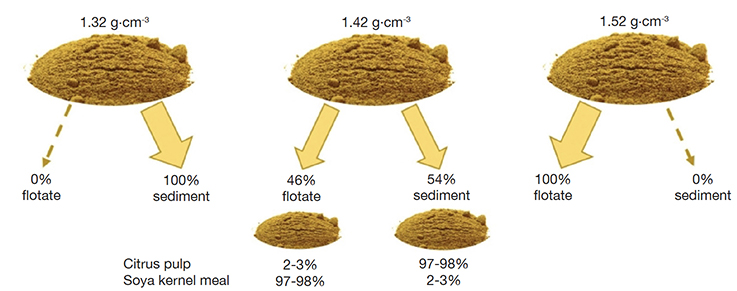 Figure 4. Mixtures of soya kernel meal and citrus pulp separated according to their specific density using three different solvent mixtures. The resulting portions for flotate and sediment for the density 1.42 g.cm-3 have each been verified for their composition. The sediment after 1.32 g.cm-3 and the flotate after 1.52 g.cm-3 will consist of both ingredients — Mélanges de farine de graines de soja et de pulpe d’agrumes soumis à une séparation en fonction de la densité spécifique à l’aide de trois mélanges de solvants différents. Les portions résultantes pour le flotat et le sédiment pour la densité de 1,42 g.cm-3 ont chacune été vérifiées pour leur composition. Le sédiment recueilli à la densité de 1,32 g.cm-3 et le flotat recueilli à la densité de 1,52 g.cm-3 n’isolent pas les deux matières premières du mélange.
20The result for the mixture beet pulp/wheat middlings is shown in figure 5. At a specific density of 1.42 g·cm-3 both a flotate of 138 mg and a sediment of 825 mg were obtained. The total weight of the two fractions was 963 mg (recovery 96%), and it was assumed that both ingredients were evenly harvested after sedimentation, 481.5 mg each. Based on the previous experiments, the flotate was expected to consist of 100% of the ingredient with the lowest specific density, i.e. the wheat middlings (138 mg). Consequently, a remaining portion of 342.5 mg was expected to be part of the sediment (481.5 – 138), with a remainder of total amount of 481.5 mg of the beet pulp in the sediment (825 – 343.5). These shares translated to 42% wheat middlings and 58% of beet pulp to be expected in the sediment. The four fractions, two sediments and two flotates, were examined for their composition to confirm or reject the expectations. The flotate obtained after sedimentation with a solvent with a density of 1.42 g·cm-3 consisted of 100% wheat middlings. For the other three fractions an overestimation of the share of wheat middlings was observed.
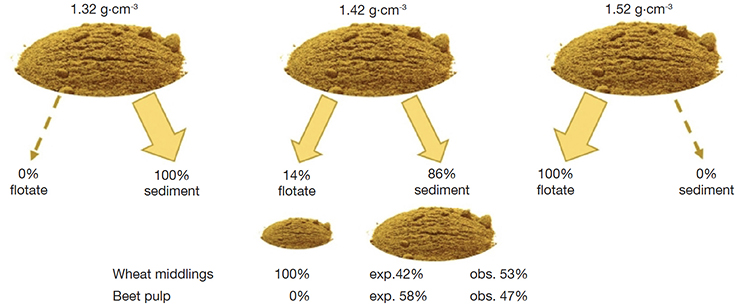 Figure 5. Mixtures of wheat middlings and beet pulp separated according to their specific density using three different solvent mixtures. The resulting portions for flotate and sediment for the density 1.42 g.cm-3 have each been verified for their composition. The sediment after 1.32 g.cm-3 and the flotate after 1.52 g.cm-3 will consist of both ingredients — Mélanges d’issues de blé et de pulpe de betterave soumis à une séparation en fonction de la densité spécifique à l’aide de trois mélanges de solvants différents. Les portions résultantes pour le flotat et le sédiment pour la densité de 1,42 g.cm-3 ont chacune été vérifiées pour leur composition. Le sédiment recueilli à la densité de 1,32 g.cm-3 et le flotat recueilli à la densité de 1,52 g.cm-3 n’isolent pas les deux matières premières du mélange.
exp.: expected — résultat attendu; obs.: observed — résultat observé; see text for further explanation — voir le texte pour plus d’explications.
21The mixture of palm kernel meal/blood meal was tested in solvent combinations with a more restricted set of specific densities than applied to the other feed ingredients. At specific densities of 1.32 g·cm-3, 1.37 g·cm-3 and 1.42 g·cm-3 the blood meal remained floating, whereas the palm kernel meal was concentrating in the sediment. The color of the fractions, either flotate or sediment after all three treatments show the primary ingredient, dark brown to black for blood meal and light brown to brown for palm kernel meal (Figure 6). At a specific density of 1.32 g·cm-3 the flotate consisted of almost exclusively blood meal, with a share of palm kernel meal less than 3%. At a specific density of 1.42 g·cm-3 this share of palm kernel meal was as high as 15%.
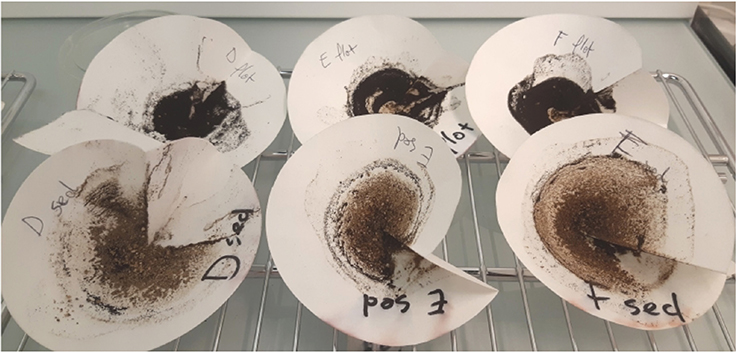 Figure 6. Collected flotate (back) and sediment (front) material of a mixture of blood meal and palm kernel meal separated at specific densities of 1.32 g.cm-3 (left), 1.37 g.cm-3 (centre) and 1.42 g.cm-3 (right). The colours (blood meal: black; palm kernel meal: brown) show a clear separation resulting from the difference in specific density — Flotats (rangée arrière) et sédiments (rangée avant) recueillis d’un mélange de farine de sang et de farine de palmiste séparés à des densités spécifiques de 1,32 g.cm-3 (gauche), 1,37 g.cm-3 (centre) et 1,42 g.cm-3 (droite). Les couleurs (farine de sang : noir ; farine de palmiste : marron) montrent une nette séparation résultant de la différence de densité spécifique.
4. Discussion
22Several prerequisites exist for a successful application of density separation of feed ingredients. In a situation where almost all material is recovered, either in the flotate or in the sediment, a sufficient estimation can be made of the distribution of the original materials over the two fractions. In specific cases with a suboptimal recovery, down to 91%, it is unknown to which ingredient the lost material could be attributed. Besides the application of TCE for separating heavy fractions from feeds, the defatting properties are known as well (Liu et al., 2011). Expeller or kernel material resulting from the oil production processes could be expected to contain remaining portions of oil, but cereal by-products show a comparable range of recoveries from 92% to 100% (Table 1). In a qualitative sense, any separation of feed ingredients with an expected distribution along a specific density gradient could help to identify these ingredients. Quantitatively, the mass balance of the subfractions, adjusted to any loss after TCE treatment, would fix the sum of shares of the ingredients in any of the individual subfractions, which could help to prevent under- or overestimations.
23A diversity is found at three levels: between different types of ingredients, among different samples of the same ingredient, and among replicates of the same sample. Replicates of different samples of soya kernel meal, corn gluten and of corn distillers’ grain show a good to perfect replication of the specific density profile (Figures 2 and 3). The analyses of intermediate densities of soya kernel meal provide a confirmation of the results as obtained using larger steps in the density profile, although soya kernel meal 2 showed some deviation (Figure 2). It can be expected that in particular the transition zone in the density profile from full sedimentation to full flotation will be subjected to the highest level of diversity. A good replication of results within each particular sample, and preferably a comparable density profile of the different samples belonging to the same feed ingredient are also prerequisites for a functional application of density separation.
24The identification of the ingredients in the four mixed samples proves the correct separation as predicted from the single ingredient experiments. The repeated overestimation of the wheat middlings (Figure 5) is not supported by data from proficiency tests. Several tendencies in these proficiency tests can be found: ingredients with lower shares in the composition might tend to be overestimated, whereas higher shares seem to be underestimated, and the combination of certain mimicking ingredients can disturb proper estimations (Van Raamsdonk et al., 2017). The over- versus under-estimations as illustrated in figure 5 fit in the accepted ranges of the IAG estimation model for compound feed (Van Raamsdonk et al., 2022a). Another factor showing up in the results of proficiency tests is the frame of the estimation of the composition of a compound feed: with or without a known declaration, which might, if present, be either correct or incorrect. An evaluation of proficiency test results showed that the a priori presence of a composition seems to interact with the final result. In all three cases where an ingredient was overrated in the declaration more than twice the correct share, a notable overestimation was found. In all four cases where an ingredient was underrated for more than twice the correct presence, underestimations were reported. Notwithstanding these biases, results were found to be correct for the majority of ingredients (Van Raamsdonk et al., 2022b). The estimation of the correctness of a label declaration, or in more general of the composition of a compound feed, is a principle procedure for monitoring several legal provisions. In this view the examination of the specific density as supportive extra parameter can be a beneficial addition.
25It can be difficult to collect the floating material from the plane of the fluid. As alternative to scooping the material, the use of a Pasteur pipette for sucking the material from the surface of the fluid appeared to be successful for the blood meal. The collected amount of solvent with the floating material can be released directly to a paper filter.
26The results as presented in figures 1, 2 and 3 are compiled to the minimum-maximum range of specific density for each of the eight feed ingredients of vegetable origin as used in this study. For some ingredients this range spans only one interval (e.g. citrus pulp), covers two intervals (e.g. soya kernel meal 2), or extends outside the total range of densities as examined (e.g. corn gluten at the lower end, and beet pulp at the upper end). In those cases a lower or upper limit of the range was estimated from the data. The estimated density ranges of the eight ingredients are shown in figure 7. A density of 1.42 g·cm-3 seems to be a distinctive threshold, separating two groups. The two pulps show a comparable specific density, which is not supportive for discriminating these two ingredients. Corn gluten and corn distillers’ grain show overlapping ranges as well, although the overlap is smaller compared to the pulps and each range includes a unique part. Soya kernel meal, with three samples the best represented material in the study, showed a large range in its specific density.
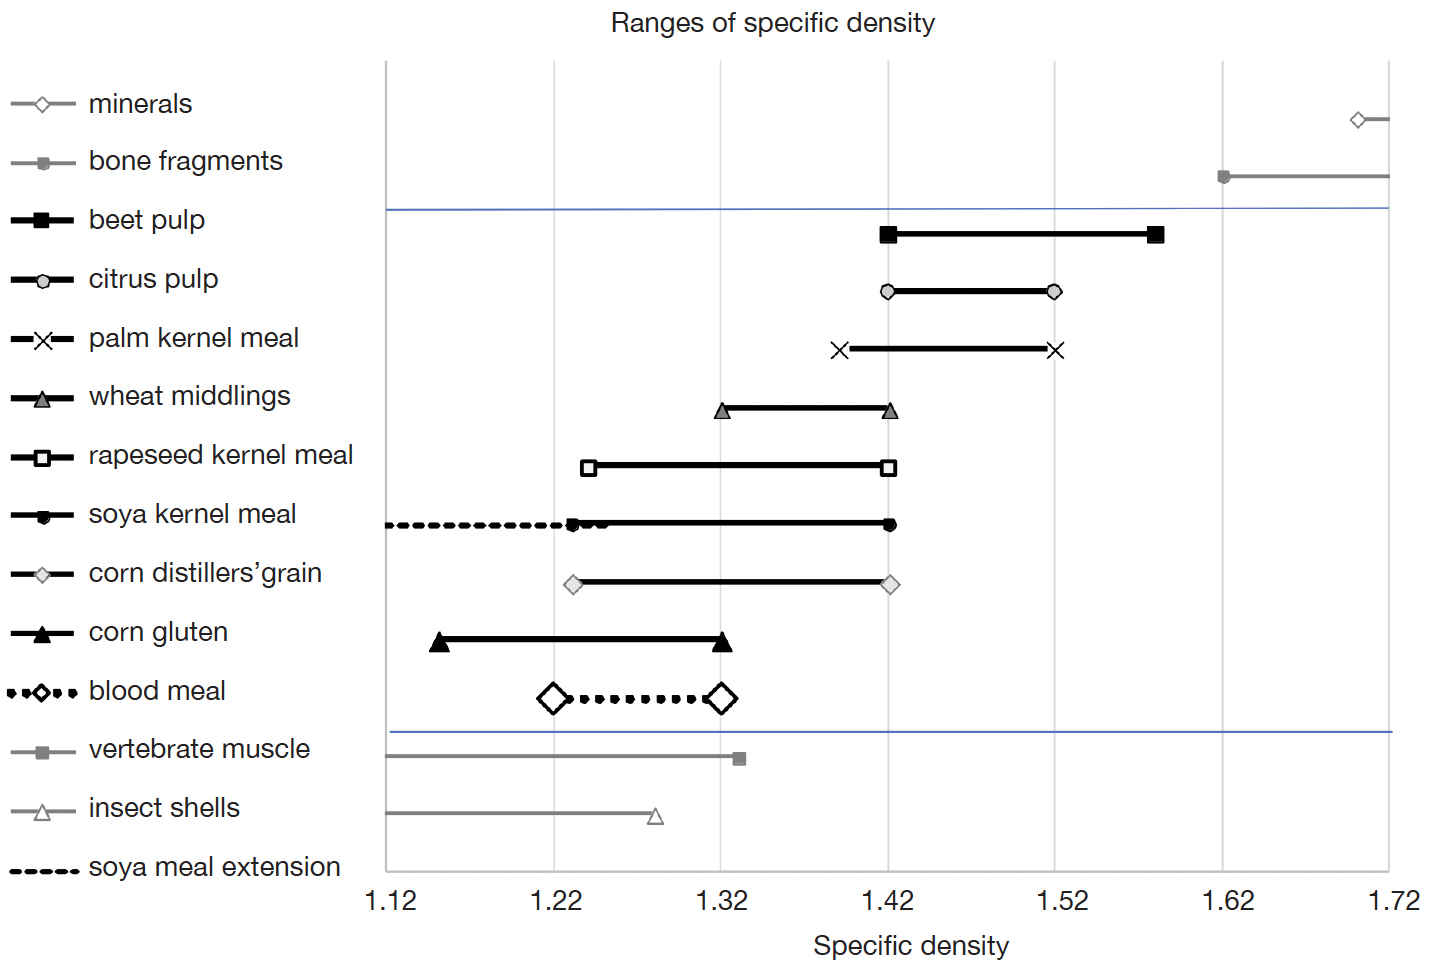 Figure 7. Overview of min-max ranges of eight different vegetable feed ingredients and blood meal (this study, in black) and ranges of animal or inorganic materials obtained from literature (in grey) — Vue d’ensemble des plages min-max en densité spécifique de huit matières premières végétales et d’une farine de sang (cette étude, plages en noir) et données issues de la littérature (plages en gris) pour des matières premières animales ou inorganiques.
27A comparison can be made with results of other studies. At the upper end of the density range as used in this study the frequently applied and legally demanded separation is achieved between the usual vegetable ingredients and the heavy fraction of minerals and, occasionally, bone fragments in compound feed (Regulation (EC) 152/2009, consolidated version 16 November 2020). This separation is very effective and basically complete. At the lower end of the range as studied the specific density ranges show a more confusing pattern. Several studies reported the effective use of a mix of two solvents with a specific density between 1.25 to 1.32 g·cm-3 to separate muscle fibers and chitin parts, opposed to the other vegetable ingredients (Bremer et al., 2012; Veys & Baeten, 2018). The current results, however, predict the presence of certain additional ingredients in that light fraction. For instance, corn gluten shares its specific density range with that of vertebrate muscle and blood meal. The two studies as referred to did not specify the matrix composition from which the muscle fibers and chitin parts were separated. At least, in a compound feed with a variety of ingredients, the lighter parts of animal material, i.e. muscle fibers from either vertebrates and invertebrates, seem to be collected in the same fraction.
28The current approach to add a characteristic to the identification of different feed ingredients should be evaluated as a proof of principle. A larger range of ingredients, and a larger range of different samples of each of those ingredients need to be investigated. This proof of principle shows a large range of differences in specific density of vegetable ingredients which can add to the characteristics of vegetable ingredients. The conclusions point to two ways of application of the range in specific density of feed ingredients. At first, the current results show that a further division of the fraction lighter than 1.62 g·cm-3, preferably at approximately 1.4 g·cm-3, would help to achieve two subfractions in which certain ingredients are separated from each other. This separation could assist in providing a better basis for identification of the components in each subfraction. An example is the separation of blood meal from palm kernel meal, which can be confusing in an entire sample (van Raamsdonk et al., 2018). This availability of different subfractions can be helpful as such without knowledge of the specific densities of all possible ingredients. The relative weight of a subfraction would fix the sum of the estimated shares of the ingredients included in that subfraction, which can be adjusted for any loss after the TCE treatment. Secondly, the expectation based on a priori knowledge of specific densities that certain ingredients could be abundantly present, whereas others might be hardly present in one of the subfractions, can be informative for identification. Division of subfractions dedicated to specific densities could separate related, difficult to distinguish ingredients such as corn gluten and corn distillers’ grain, in this case at a chosen specific density of approximately 1.27-1.30 g·cm-3 (Figure 3). These ways of applying specific densities would provide a new tool supporting the estimation of the composition of compound feeds.
Bibliographie
Bremer M.G.E.G. et al., 2012. Combination methods for PAP detection and species determination of animal particles. In: Jørgensen J.S. & Baeten V., eds. Detection, identification and quantification of processed animal proteins in feedingstuffs. Namur, Belgium: Presses universitaires de Namur, 139-149.
European Commission, 2009. Commission Regulation (EC) No 152/2009 of 27 January 2009 laying down the methods of sampling and analysis for the official control of feed. Off. J. Eur. Union, L 54, 26.2.2009, 1.
European Commission, 2013a. Commission Regulation (EU) No 68/2013 of 16 January 2013 on the catalogue of feed materials. Off. J. Eur. Union., L 29, 30.1.2013, 1-84.
European Commission, 2013b. Regulation (EU) No 1308/2013 of 17 December 2013 establishing a common organisation of the markets in agricultural products and repealing Council Regulations (EEC) No 922/72, (EEC) No 234/79, (EC) No 1037/2001 and (EC) No 1234/2007. Off. J. Eur. Union, L 347, 184.
European Commission, 2016. Commission Implementing Regulation (EU) 2016/1821 of 6 October 2016 amending Annex I to Council Regulation (EEC) No 2658/87 on the tariff and statistical nomenclature and on the Common Customs Tariff. Off. J. Eur. Union., L 294, 6.10.2016, 1-956.
European Commission, 2017. Regulation (EU) 2017/625 of 15 March 2017 on official controls and other official activities performed to ensure the application of food and feed law, rules on animal health and welfare, plant health and plant protection products, amending Regulations (EC) No 999/2001, (EC) No 396/2005, (EC) No 1069/2009, (EC) No 1107/2009, (EU) No 1151/2012, (EU) No 652/2014, (EU) 2016/429 and (EU) 2016/2031 of the European Parliament and of the Council, Council Regulations (EC) No 1/2005 and (EC) No 1099/2009 and Council Directives 98/58/EC, 1999/74/EC, 2007/43/EC, 2008/119/EC and 2008/120/EC, and repealing Regulations (EC) No 854/2004 and (EC) No 882/2004 of the European Parliament and of the Council, Council Directives 89/608/EEC, 89/662/EEC, 90/425/EEC, 91/496/EEC, 96/23/EC, 96/93/EC and 97/78/ EC and Council Decision 92/438/EEC (Official Controls Regulation). Off. J. Eur. Union, L 95, 142.
European Union, 2004. Regulation (EC) No 882/2004 of the European Parliament and of the Council of 29 April 2004 on official controls performed to ensure the verification of compliance with feed and food law, animal health and animal welfare rules. Off. J. Eur. Union, L 165, 30.4.2004, 1-141.
European Union, 2009. Regulation (EC) No 767/2009 of the European Parliament and of the Council of 13 July 2009 on the placing on the market and use of feed, amending European Parliament and Council Regulation (EC) No 1831/2003 and repealing Council Directive 79/373/EEC, Commission Directive 80/511/EEC, Council Directives 82/471/EEC, 83/228/EEC, 93/74/EEC, 93/113/EC and 96/25/EC and Commission Decision 2004/217/EC. Off. J. Eur. Union., L 229, 1.9.2009, 1-28.
Gizzi G. et al., 2004. Determination of processed animal proteins, including meat and bone meal, in animal feed. J. AOAC., 87, 1334-1341.
Gündoğdu S., 2018. Contamination of table salts from Turkey with microplastics. Food Addit. Contam. Part A, 35, 1006-1014, doi.org/10.1080/19440049.2018.1447694
Hantoro I. et al., 2019. Microplastics in coastal areas and seafood: implications for food safety. Food Addit. Contam. Part A, 36, 674-711, doi.org/10.1080/19440049.2019.1585581
Iñiguez M.E., Conesa J.A. & Fullana A., 2017. Microplastics in Spanish table salt. Nat. Sci. Rep., 7, 8620, doi.org/10.1038/s41598-017-09128-x
Hidalgo-Ruz V., Gutow L., Thompson R.C. & Thiel M., 2012. Microplastics in the marine environment: a review of the methods used for identification and quantification. Environ. Sci. Technol., 46, 3060-3075, doi.org/10.1021/es2031505
Klein S., Worch E. & Knepper T.P., 2015. Occurrence and spatial distribution of microplastics in river shore sediments of the Rhine-Main Area in Germany. Environ. Sci. Technol., 49, 6070-6076, doi.org/10.1021/acs.est.5b00492
Kosuth M., Mason S.A. & Wattenberg E.V., 2018. Anthropogenic contamination of tap water, beer, and sea salt. PLoS One, 13, e0194970, doi.org/10.1371/journalpone.0194970
Leslie H.A., Brandsma S.H., van Velzen M.J.M. & Vethaak A.D., 2017. Microplastics en route: field measurements in the Dutch river delta and Amsterdam canals, wastewater treatment plants, North Sea sediments and biota. Environ. Int., 101, 133-142, doi.org/10.1016/j.envint.2017.01.018
Liu X. et al., 2011. An overview of the legislation and light microscopy for detection of processed animal proteins in feeds. Microsc. Res. Tech., 74, 735-743, doi.org/10.1002/jemt.20951
Michard J. & Ziebal R., 1999. Note concernant le protocole de détection des farines de viande, d’os et de poisson dans les aliments pour animaux. Ann. Falsific L’expert. Chim. Toxicol., 947, 209-223.
Osipov V.I. 2012. Density of clay minerals. Soil Mech. Found. Eng., 48(6), 231-240, doi.org/10.1007/s11204-012-9153-0
Quinn B., Murphy F. & Ewins C., 2017. Validation of density separation for the rapid recovery of microplastics from sediment. Anal. Methods, 9, 1491-1498, doi.org/10.1039/c6ay02542k
van Raamsdonk L.W.D. et al., 2007. New developments in the detection and identification of processed animal proteins in feeds. Anim. Feed Sci. Technol., 133, 63-83, doi.org/10.1016/j.anifeedsci.2006.08.004
van Raamsdonk L.W.D., Smits C.P.A.F., Vliege J.J.M. & Pinckaers V.G.Z., 2017. IAG ring test feed composition 2017. Report 2017.011. Wageningen, The Netherlands: RIKILT, 32, doi.org/10.18174/431698
van Raamsdonk L.W.D., Hedemann B., Smits C.P.A.F. & Vliege J.J.M., 2018. IAG ring test animal proteins 2018. Report 2018.008. Wageningen, The Netherlands: RIKILT, 33, doi.org/10.18174/462578
van Raamsdonk L.W.D., Smits C.P.A.F. & Vliege J.J.M., 2020a. IAG proficiency test feed composition 2019. Report 2019.014. Wageningen, The Netherlands: RIKILT, 32, doi.org/10.18174/517730
van Raamsdonk L.W.D. et al., 2020b. Current insights into monitoring, bioaccumulation, and potential health effects of microplastics present in the food chain. Foods, 9, 72-99, doi.org/10.3390/foods9010072
van Raamsdonk L.W.D. et al., 2022a. Quality assurance and control of visual methods for feed and food inspection. Part 1, Part 2. Report 2021.006. Wageningen, The Netherlands: WFSR, 90.
van Raamsdonk L.W.D., Smits C.P.A.F. & Hedemann B., 2022b. IAG proficiency test feed composition 2021. Report 2022.021. Wageningen, The Netherlands: WFSR, 27.
Veys P. & Baeten V., 2018. Protocol for the isolation of processed animal proteins from insects in feed and their identification by microscopy. Food Control, 92, 496-504, doi.org/10.1016/j.foodcont.2018.05.028
Weithmann N. et al., 2018. Organic fertilizer as a vehicle for the entry of microplastic into the environment. Sci. Adv., 4, eaap8060, doi.org/10.1126/sciadv.eaap8060
