


- Accueil
- Volume 26 (2022)
- Special issue : 150 years of CRA-W
- Determination of urea in compound feed for ruminants: interlaboratory comparison for the validation of the spectrophotometric method in Commission Regulation (EC) No 152/2009


Visualisation(s): 1301 (10 ULiège)
Téléchargement(s): 183 (0 ULiège)

Determination of urea in compound feed for ruminants: interlaboratory comparison for the validation of the spectrophotometric method in Commission Regulation (EC) No 152/2009

Document(s) associé(s)
Version PDF originaleRésumé
Dosage de l’urée dans les aliments pour ruminants : comparaison interlaboratoire pour la validation de la méthode spectrophotométrique décrite dans le Règlement (CE) N° 152/2009 de la Commission
Description du sujet. L'urée est un additif alimentaire autorisé dans l'alimentation des ruminants avec une teneur maximale dans les aliments composés de 8 800 mg·kg-1. Le règlement (CE) n° 152/2009 de la Commission indique la méthode officielle de détermination de l'urée dans les aliments pour animaux, mais ne précise pas le type d'aliments pour animaux pour lequel la méthode est applicable. À la suite de rapports d'États membres indiquant que la méthode spectrophotométrique officielle n'est pas adaptée à un usage autre que l'alimentation des ruminants et compte tenu du fait qu'aucune caractéristique de performance de la méthode n'est définie, le Centre Commun de Recherche a organisé un exercice interlaboratoire pour la validation de cette méthode.
Objectifs. L'objectif était de réaliser un essai circulaire interlaboratoire pour la validation de la méthode spectrophotométrique officielle de dosage de l'urée dans les aliments composés pour ruminants, à la demande spécifique de la DG SANTÉ de la Commission européenne.
Méthode. Une étude collaborative a été réalisée sur six matériaux d'essai différents préparés à partir d'aliments composés pour ruminants contenant de l'urée à différentes fractions massiques et un matériau d'essai à blanc. Dix-neuf laboratoires ont participé à l'étude et dix-huit laboratoires de dix États membres de l'UE ont soumis des résultats.
Résultats. Les caractéristiques de performance ont été établies, à savoir que le critère de validation utilisé dans cette étude (RSDR) était respecté dans tous les cas (i.e. inférieur à 20 %), sauf dans les aliments pour ovins à 3 000 mg·kg-1 mesurés à 420 nm. Des résultats légèrement meilleurs en termes de précision et de justesse ont été obtenus à 435 nm.
Conclusions. Il convient de réviser le règlement (CE) N° 152/2009 de la Commission en ce qui concerne la méthode spectrophotométrique officielle avec une restriction du champ d’application, à savoir un dosage de l’urée dans les aliments composés pour ruminants au niveau autorisé. En outre, la longueur d’onde de mesure choisie, soit 420 nm soit 435 nm, a une incidence mineure sur le profil de performance de la méthode.
Abstract
Description of the subject. Urea is a feed additive authorized in ruminant feedingstuff with a maximum content in compound feed of 8,800 mg·kg-1. Commission Regulation (EC) No 152/2009 displays the official method for the determination of urea in feed but does not specify the type of feed for which the method is applicable. Following reports from Member States stating that the official spectrophotometric method is not fit for purpose for other feed than ruminant feed and given the fact that no method performance characteristics are set, the Joint Research Centre organized an interlaboratory exercise for the validation of this method.
Objectives. The objective was to carry out an interlaboratory ring trial for the validation of the official spectrophotometric method for the determination of urea in compound feed for ruminants, under specific request from DG SANTE of the European Commission.
Method. A collaborative study was carried out on six different test materials prepared from ruminant compound feeds containing urea at various mass fractions and a blank test material. Nineteen laboratories enrolled for the study and eighteen laboratories from ten EU Member States submitted results.
Results. The performance characteristics were established, namely, the validation criterion used in this study (RSDR) was in all cases, except in sheep feed at 3,000 mg·kg-1 measured at 420 nm, achieved (i.e. lower than 20%). Slightly better results in terms of precision and trueness were obtained at 435 nm.
Conclusions. Commission Regulation (EC) No 152/2009 should be revised as regards the official spectrophotometric method with a restriction of the scope, which is the determination of urea in ruminant compound feedingstuff at authorized level. Additionally, the selected measurement wavelength, which is either 420 nm or 435 nm, has a minor impact on the performance profile of the method.
Table des matières
Received 1 October 2021, accepted 6 December 2022, available online 21 December 2022
This article is distributed under the terms and conditions of the CC-BY License (http://creativecommons.org/licenses/by/4.0)
1. Introduction
1Feed additives including urea play an important role in animal nutrition. Prior to their use in the European Union (EU) they undergo an authorization process, as specified by European legislation (European Union, 2003). Urea is a feed additive authorized in ruminant feed by Commission Implementing Regulation (EU) No 839/2012 (European Union, 2012) with a maximum content of 8,800 mg·kg-1 in compound feed. Moreover, this Regulation requires the use of the official spectrophotometric method for the determination of urea in compound feed as specified by Commission Regulation (EC) No 152/2009 (European Union, 2009). On the other hand, urea can also be added to feed and feed materials as adulterant to increase the apparent protein content when determining the crude protein content with the simplified Kjeldahl method (Finete et al., 2013). In 2017, Latvia reported to the European Commission’s Rapid Alert System for Food and Feed (RASFF) the presence of urea in feed grade yeast without corresponding declaration on the level (European Union, 2018). Subsequently, Flanelly et al. (2019) conducted a study on the determination of urea in yeast by comparing the results from the EU official spectrophotometric method with results from liquid chromatography coupled to mass spectrometry (LC-MS) applied on identical samples. The comparison clearly showed that the EU official spectrophotometric method delivers false positive results in respect to the urea, especially at lower levels of this compound (Flannelly et al., 2019). These results corresponded well with the outcome of a previous study on the determination of urea in pet feed (Pibarot & Pilard, 2012), demonstrating the lack of accuracy, repeatability and specificity of the EU official spectrophotometric method. The authors also showed that the presence of free amino acids in the feed sample could trigger false positive results for urea with this method. Moreover, EU National Reference Laboratories (NRLs) and Official Control Laboratories (OCLs) have reported to the EURL for Feed Additives (EURL-FA), hosted by the Joint Research Centre of the European Commission (JRC), that the EU official spectrophotometric method delivers much higher mass fractions of urea compared to corresponding values obtained with LC-MS.
2Further discussions of the EURL-FA with expert laboratories raised the question, whether this spectrophotometric method should be completely removed from Commission Regulation (EC) No 152/2009. Alternatively, the scope of the method could be restricted to ruminant feed, reflecting the high levels of urea in this matrix when used as feed additive and the different composition of this matrix compared to pet feed with less interfering substances in ruminant feed. In addition, the official spectrophotometric method as specified by European legislation (European Union, 2009) does not include any method performance characteristics. To address this question, the European Commission’s Directorate General for Health and Food Safety (DG SANTE) asked the EURL-FA to perform an interlaboratory comparison study for the validation of this method for the determination of urea exclusively in ruminant feed. Finally, the results of this interlaboratory comparison study will be used to decide on the corresponding revision of Commission Regulation (EC) No 152/2009.
3In this frame, the JRC first performed an internal testing and a single-laboratory validation of the method that led to satisfactory analytical performance characteristics of the method according to the validation criterion for the performance of analytical methods for feed additive analysis in compound feed proposed by the EURL for Feed Additives and agreed upon by the network of EU expert laboratories in the area of feed analysis. Subsequently, the method was subjected to validation by conducting a collaborative study.
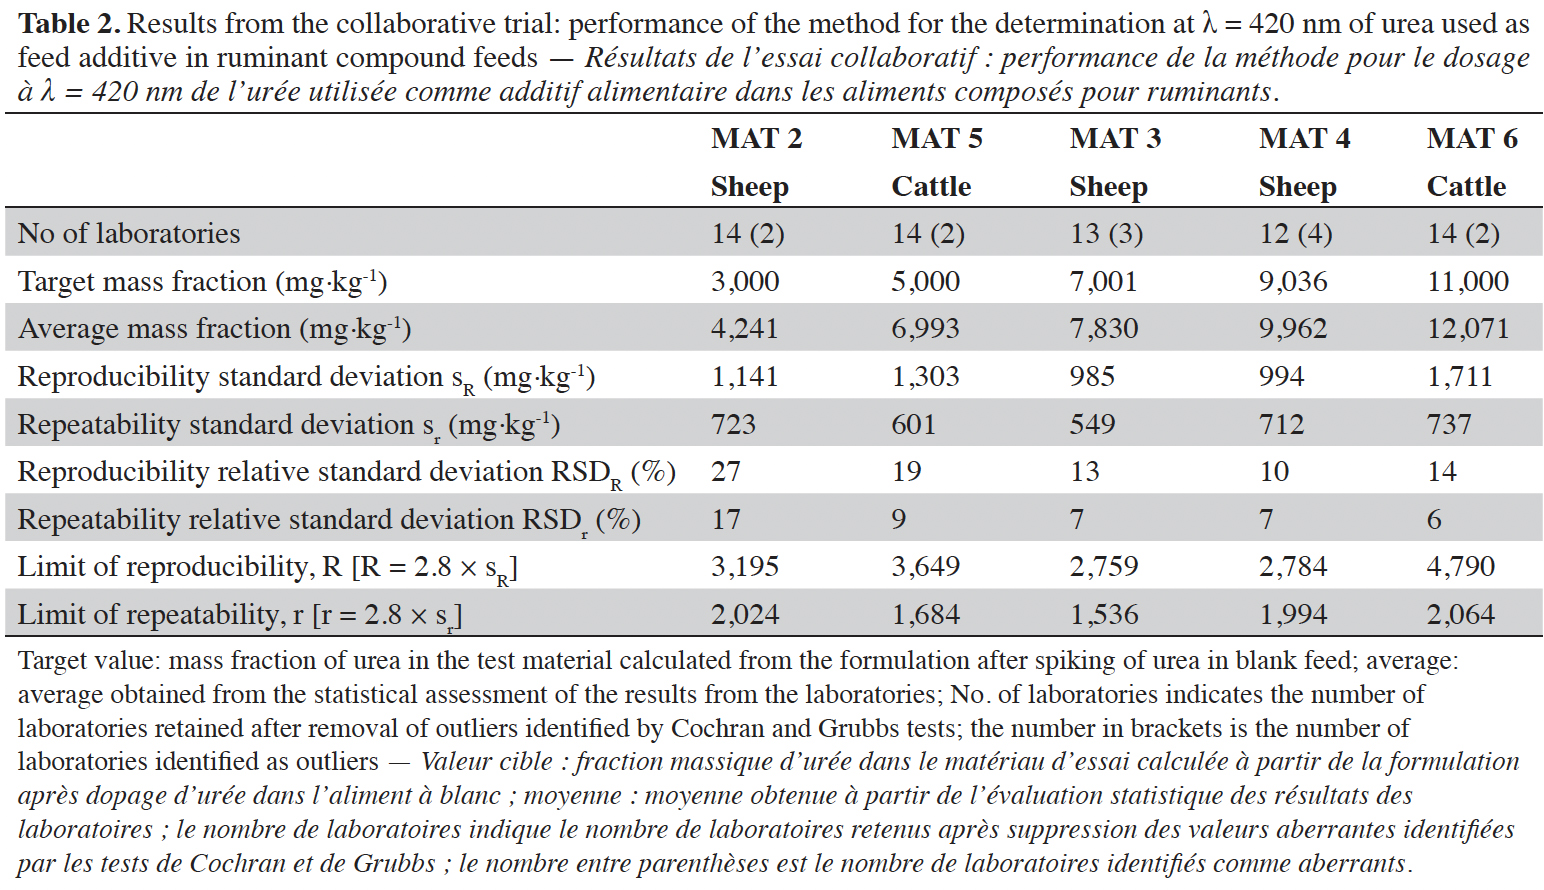
4The interlaboratory exercise was open to laboratories having the required expertise in feed analysis such as NRLs, OCLs and other laboratories performing routinely the control of urea in feed and willing to participate. Nineteen laboratories enrolled for participating in the study and eighteen laboratories delivered quantitative results subsequently used for the validation study.
5This paper summarizes the outcome of the collaborative study.
2. Materials and methods
2.1. Study design
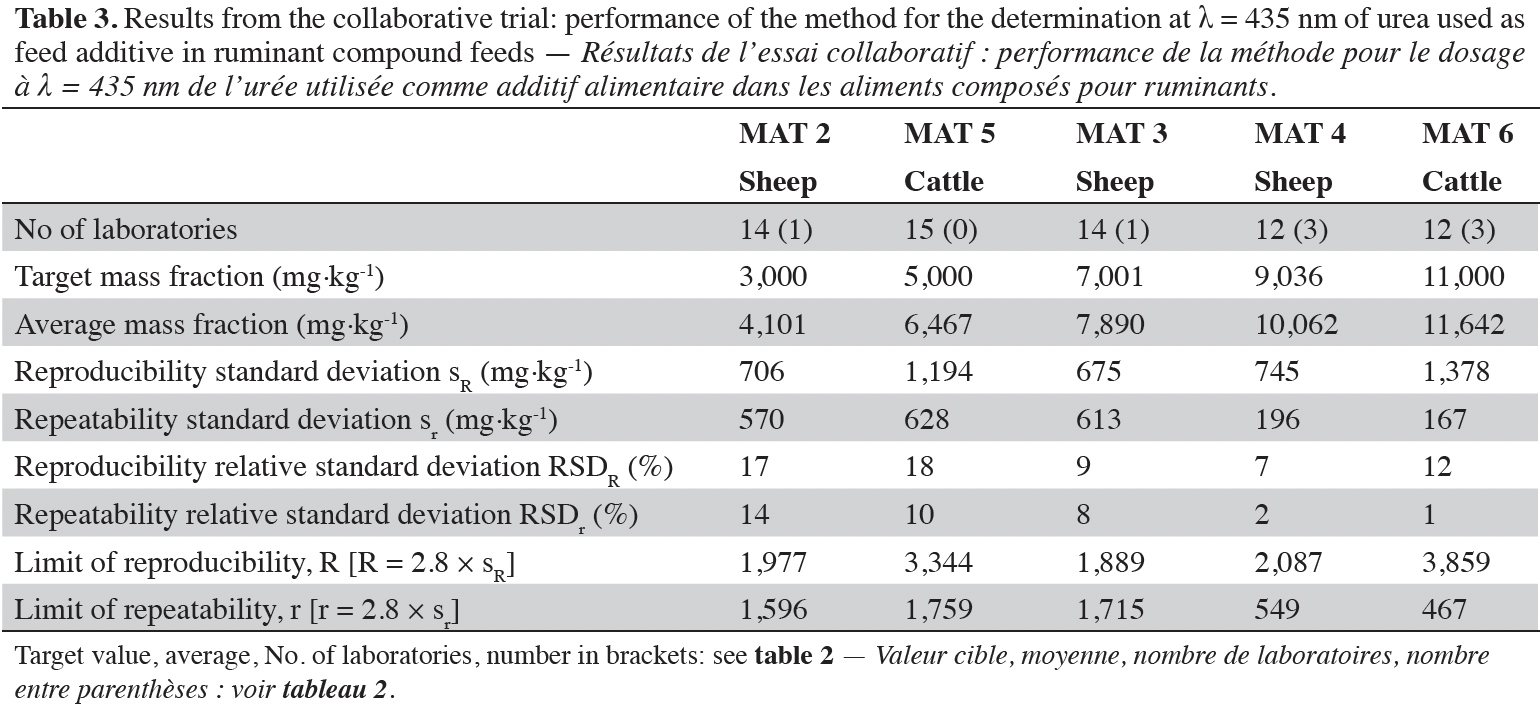
6The collaborative study was designed following the recommendations stated in recognized international guidelines (Horwitz, 1995; AOAC International, 2000). The number of materials, laboratories and replicates are therefore set in order to comply with at least the minimum requirements for a quantitative study. The two matrices selected in this study were sheep and cattle feedingstuff as representatives of ruminant feed supplemented with different amounts of urea.
7Given the fact that this method is not new and that the laboratories participating in the study are sufficiently familiar with this method, no training phase prior to the validation exercise was organized. The assessment of the within-laboratory repeatability requires replicate (at least duplicate) analysis of each material. There are two recommended ways to attain the replication, namely blind duplicates and split levels (Youden pairs). In this study, the first option was selected. Consequently, for this validation, the five test materials were analyzed in blind duplicates, plus a coded single blank test material, leading to a total of 11 coded test materials dispatched to each laboratory. Each measurement had to be performed at two wavelengths 420 nm and 435 nm, in order to determine the method performance profile separately at these wavelengths and to assess the impact of the measurement wavelength on the results.
2.2. Statistics
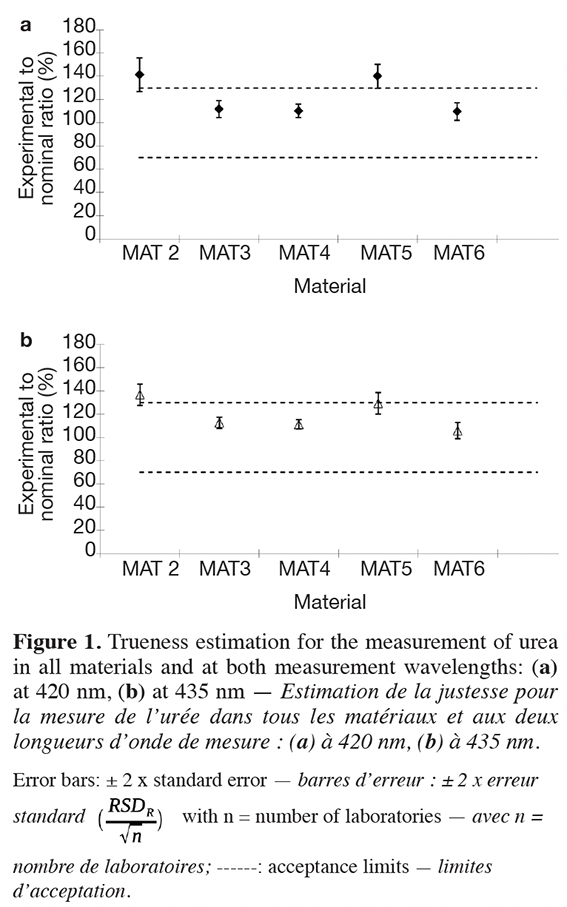
8Statistical data treatment was done according to international protocols (Horwitz, 1995; AOAC International, 2000). The study presented here is based on the principle that a set of duplicate samples of five different feed samples are analyzed by the participating laboratories as well as one blank analyzed once and the results are reported back to the organizer of the study for further statistical assessment of the precision of the method.
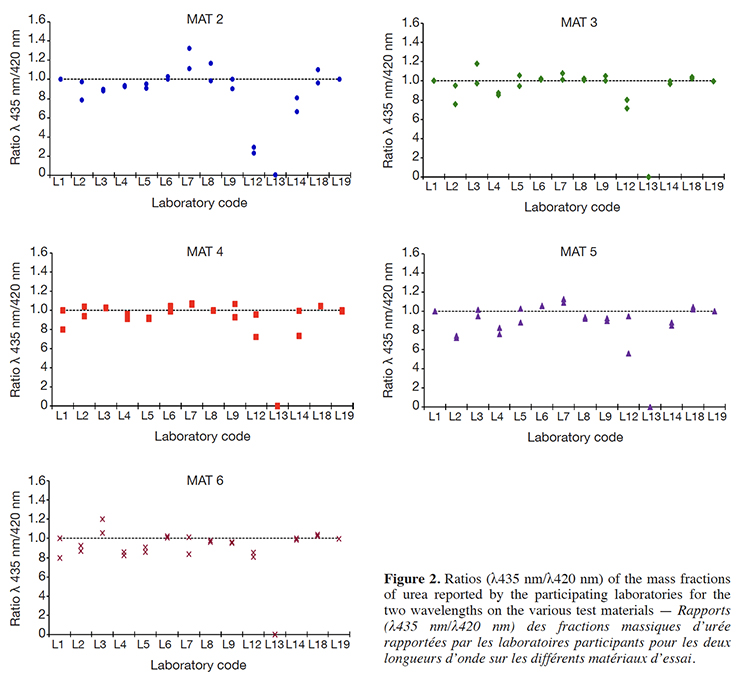
9First, non-compliant results were excluded from the study, especially when obvious experimental deviations from the protocol were identified or when specific quality criteria of the method were not met. In the second step, the remaining valid data were purged of all outliers flagged by the harmonized outlier removal procedure as specified by the IUPAC protocol (Horwitz, 1995). This procedure consists of the sequential application of the Cochran and Grubbs tests (at 2.5% probability level, one-tail for Cochran and two-tails for Grubbs) until no further outliers are flagged or until a drop of 22.2% (= 2/9) in the original number of laboratories providing valid data occurred.
10The remaining data were subsequently subjected to analysis of variance (ANOVA) to estimate the values for the target performance characteristics of the method, namely within-laboratory repeatability (sr) and between-laboratory reproducibility (sR), separately for each test material and per measurement wavelength. Calculations for repeatability (r) and reproducibility (R) limits as defined by international guidelines were also carried out.
11One may compare the obtained precision against the Horwitz ratio (Horwitz & Albert, 2006) also called HorRat, taken as a normalized performance parameter and a benchmark for the fitness for purpose of an analytical method. This approach is frequently applied for evaluating methods targeting a single analyte. However, it is known that in some cases, e.g. at high mass fractions, this criterion is not appropriate. In recent years, experts in feed analysis from EU laboratories have been discussing on defining appropriate criteria for assessing the fitness for purpose of analytical methods in terms of precision. It is now accepted in the feed analysis domain to use a predefined and mass fraction independent relative standard deviation for reproducibility (RSDR) as fitness for purpose criterion rather than the RSDR calculated with the Horwitz equation as expressed by HorRat. In the current study, the assessment criterion agreed upon was that the RSDR should be less than or equal to 25%, which has been agreed on by the network of EU expert laboratories in the area of feed analysis including the determination of feed additives.
12Additionally, mean values for the mass fractions of urea were calculated for each material from the corresponding mass fractions reported by the participants, after removal of outliers as previously described. The mean values were subsequently utilized to evaluate the trueness of the method at the level of interest, which was possible in this study, since all test materials were prepared by a spiking experiment and therefore target values for the mass fractions of urea were known prior to the study.
2.3. Test materials
13The composition of the test materials was designed in order to ensure five different matrix/analyte/mass fraction combinations (Horwitz, 1995) across the range of mass fractions tested at and around the additive levels. In addition, a blank material was included in the validation study, thus leading to six test materials with different levels of urea (incl. the blank).
14The test materials containing urea at the different levels were prepared at the JRC. The complete mass fraction design of the materials is given in table 1.
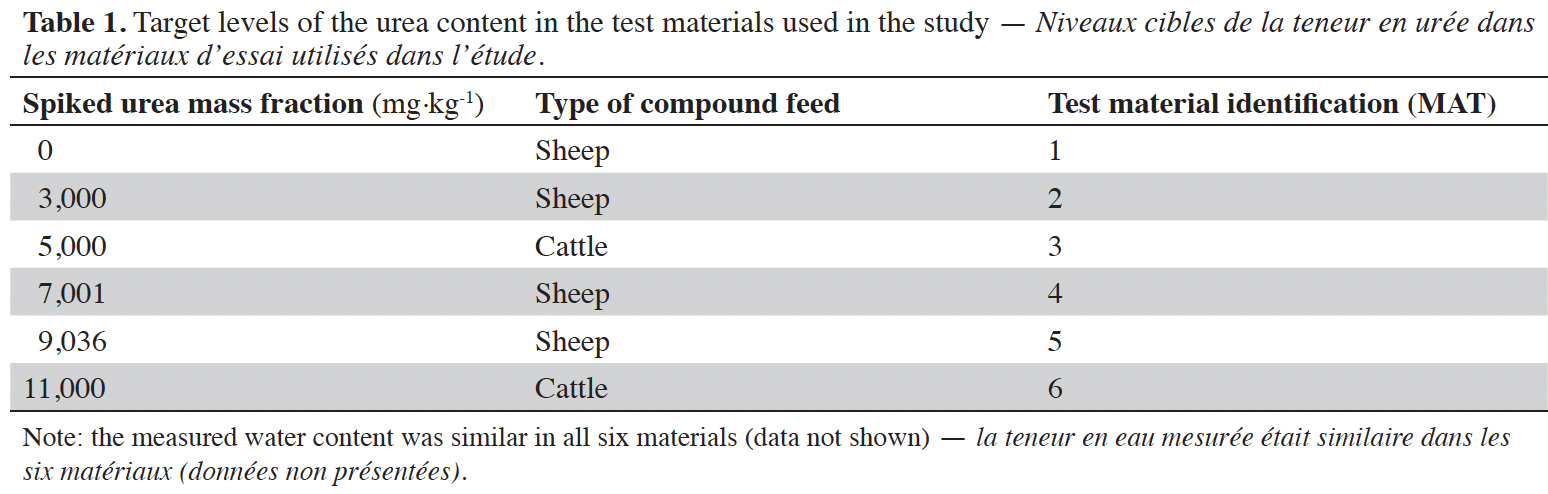
15Two different commercial complete compound feeds (one sheep feed and one cattle feed) were used to prepare the test materials. First, the commercial feeds were tested in the laboratory to ensure that they would not contain urea. Then the feeds were ground, spiked with urea solutions according to the design in table 1 and then cryogenically milled. Finally, the materials were sieved and homogenized and distributed in bottles containing approximately 10 g of material. Prior to shipment of the test materials, 10 samples were randomly taken from each type of test material and analyzed in duplicates. Results were evaluated according to ISO 13528:2015 (ISO, 2015), passing the corresponding clauses B.2.2 and B.2.3 of this standard, thus showing that the test materials were sufficiently homogenous for the purpose of the study.
16A proven stability of the final test material during the validation study is considered as a crucial element. Therefore, the stability of the samples was evaluated on the short-term (to mimic the transport of the parcels to the participants) and on the longer term covering the whole duration of the study. The stability study was performed on two materials MAT 4 and MAT 5, representative of the sheep and cattle feeds, respectively, with the assumption that the stability behavior of urea is similar in the other materials. One aliquot of one bottle was measured once at each step.
17Two temperatures, namely 40 °C (possible during the transport to some participants) and 23 °C (handling temperature in the laboratory) were considered. The calculation was done on two series of measurements. The first series was performed when the materials were homogenized and kept at the reference temperature of -18 °C (T0) and the second after 1 week (short-term), 2 weeks (short-term) or after the completion of the method validation study by all participants and reception of the results (T14 weeks).
18The obtained mass fractions from all three groups of samples were then subjected to statistical assessment. First, a one-tailed F-test showed that there was no significant difference of the variances between the respective two series of measurements. Then, the subsequent t-test ( = 0.05) demonstrated that the mean values of the urea mass fractions obtained after 1 week, 2 weeks or 14 weeks were not significantly different to the mean values of the mass fractions at T0. The samples can therefore be considered as stable both during the transport and at the recommended storage temperature tested during the whole duration of the method validation study.
19In total, the laboratories received 11 samples supplemented with urea (MAT 2 – MAT 6) and a blank compound feed sample (MAT 1) in order to assess the probability of false positive results of the method.
2.4. Method
20The laboratories were asked to perform one single analysis of each coded sample for the determination of urea.
21The analytical procedure that the laboratory had to apply is detailed in Commission Regulation (EC) No 152/2009 (European Union, 2009) and consists of the following steps:
22– suspension of the test sample in water with a clarifying agent;
23– filtration of the suspension and addition of 4-dimethylaminobenzaldehyde (4-DMAB);
24– determination of the urea content by measuring the optical density at a wavelength of 420 nm.
25The method protocol also contains the information that the measurement is carried out at 435 nm if the sample contains simple nitrogenous compounds such as amino acids. This provision indicates that measuring at this wavelength improves the specificity of the method compared to measuring at 420 nm. The laboratories participating in the study were requested to perform the measurements at both wavelengths.
3. Results
26Nineteen laboratories covering National Reference Laboratories for feed additives, official control laboratories and private laboratories registered for the study and eighteen performed the required analysis of the test materials and provided results. Some laboratories did not provide results for all materials and/or for both wavelengths of measurement. In total, 347 results were reported.
27First, the results of the laboratories and information on the execution of the method were individually screened for obvious experimental deviations from the method protocol. The evaluation did not reveal any non-compliances. The data were subsequently subjected to the statistical treatment as described before.
28The results from the statistical assessment on the five materials are presented in tables 2 and 3. In nine out of ten cases, the number of removed outliers was below the threshold ratio of 2/9 (Horwitz, 1995), while for MAT 4 this ratio was 4/16. Since this was a single case and the ratio was very close to the threshold ratio, no further action was taken, and the calculated method performance profile was maintained in the validation study.
29No laboratory reported any measured urea mass fraction (false positive results) from the blank samples or false negative results from the test samples supplemented with urea.
4. Discussion
4.1. Precision profile
30The laboratories participating in the study performed single analysis from each of the 11 sample jars, thus delivering analytical results from 11 independent measurements applying the whole analytical procedure. This allows for estimating the precision of the method separately for five mass fraction/matrix combinations. In addition, the laboratories performed a single analysis of the blank sample.
31The data were evaluated separately for each wavelength, obtaining the following results. At 420 nm, the relative standard deviation for reproducibility (RSDR) was 27% at 3,000 mg·kg-1 (which was the lowest spiking level) and varied from 10% to 19% for the test material containing urea at higher mass fractions.
32At 435 nm, the relative standard deviation for reproducibility (RSDR) was 17% at 3,000 mg·kg-1 and varied from 7% to 18% for the test material containing urea above this level. At 420 nm the precision of all test materials with exception of MAT 2 was below the fitness for purpose criterion of 25% for RSDR, while at 435 nm all test materials satisfied this criterion. Moreover, a comparison of the results from both wavelengths showed that the precision was in all cases better at 435 nm compared to 420 nm.
33Considering the complete set of results, the official spectrophotometric method was considered as fit for purpose of determining urea at the regulated additive mass fractions in ruminant feed. Slightly better results for the precision were observed when measuring at 435 nm.
4.2. Trueness
34Prior to the interlaboratory study, a single laboratory validation study was conducted, to estimate the trueness of the method from the analytical recovery on spiked blank materials (cattle and sheep compound feeds) covering a range from 1,000 mg.kg-1 to 30,000 mg.kg-1. The overall recovery for the urea determination in cattle feed was 106% for measurements at 420 nm and 97% for measurements at 435 nm, and the corresponding data for sheep feed analysis were 105% at 420 nm and 101% at 435 nm.
35Figure 1 shows the corresponding results obtained in the interlaboratory study along with the acceptance limits of 70% to 130% as proposed by the EURL for Feed Additives as validation criterion for the performance of analytical methods for feed additive analysis in compound feed. Again, somewhat better results were obtained at 435 nm, because at this wavelength the trueness was for all materials with the exception of MAT 2 below the upper threshold of 130%, while at 420 nm the trueness values of MAT 2 and MAT 5 were slightly above 130%.
4.3. Influence of the measurement wavelength
36Figure 2 displays the ratios of the mass fractions of urea reported by the participating laboratories for the two wavelengths on the various test materials. As can be seen on the figure 2, the majority of all results fluctuated around one, thus indicating that the impact of the selected wavelength on the result of analysis was negligible. Nevertheless, the comparison of the performance profile in terms of the precision and the trueness from both wavelengths hinted at slightly better results obtained at 435 nm. Again, the largest deviation from the ideal factor of 1 was observed on the results obtained with test material containing urea at the lowest level (MAT 2). The protocol of the official method (European Union, 2009) specifies that the optical density shall be measured at 435 nm, if the sample contains simple nitrogenous compounds such as amino acids. The good correlation of the results from both wavelengths may indicate that in the matrices used for the test materials, no other nitrogenous compounds are present or that they are below a level at which they would interfere with the correct measurements of urea. It is important, however, to refer to the results from a previous study (Pibarot & Pilard, 2012), showing that free amino acids give a significant response across a broad wavelength range including 435 nm. In consequence, measuring at 435 nm does not guarantee that the analytical result for the determination of urea is unaffected by the presence of free amino acids and the corresponding remark in the official method protocol should be removed.
4.4. Specificity
37The study also confirmed a sufficient specificity of the method when applied to the compound feed used in this study, because no false positive results were reported on the analysis of the blank samples (MAT 1).
5. Conclusions
38The aim of this study was to determine by a collaborative trial the performance characteristics of the official spectrophotometric method for the determination of urea at additive level in compound feeds, described in Commission Regulation (EC) No 152/2009. Another goal was to assess, whether or not the Regulation should be revised with respect to the scope of the method.
39The fitness for purpose of the method was evaluated from the results of the collaborative trial, calculating separately for each test material made the precision and trueness values. The criterion assessed was the RSDR.
40The general outcome of the study led to the conclusion that Commission Regulation (EC) No 152/2009 should be revised as regards the official spectrophotometric method with a restriction of the scope, which is the determination of urea in ruminant compound feedingstuff at authorized level. The following performance characteristics were established:
41– the validation criterion used in this study (RSDR) was in all cases, except in sheep feed at 3,000 mg·kg-1 measured at 420 nm, achieved (i.e. lower than 20%);
42– the selected measurement wavelength, which is either 420 nm or 435 nm, has a minor impact on the performance profile of the method. However, slightly better results in terms of precision and trueness were obtained at 435 nm.
Bibliographie
AOAC International, 2000. Appendix D: guidelines for collaborative study procedures to validate characteristics of a method of analysis. Official Methods of Analysis of AOAC International, 17th ed. Rockville, MD, USA: AOAC.
European Union, 2003. Regulation (EC) No. 1831/2003 of the European Parliament and the council of 22 September 2003 on additives for use in animal nutrition. Off. J. Eur. Union, L 285, 33-37.
European Union, 2009. Commission Regulation (EC) No 152/2009 of 27 January 2009 laying down the methods of sampling and analysis for the official control of feed. Off. J. Eur. Union, L 54, 1-130.
European Union, 2012. Commission Implementing Regulation (EU) No 839/2012 of 18 September 2012 concerning the authorisation of urea as a feed additive for ruminants. Off. J. Eur. Union, L 252, 11-13.
European Union, 2018. RASFF - The Rapid Alert System for Food and Feed - 2017 annual report, https://ec.europa.eu/food/safety/rasff-food-and-feed-safety-alerts_en, (12/12/2022).
Finete V.L.M., Gouvêa M.M., Marques F.F.C. & Netto A.D.P., 2013. Is it possible to screen for milk or whey protein adulteration with melamine, urea and ammonium sulphate, combining Kjeldahl and classical spectrophotometric methods? Food Chem., 141, 3649-3655, doi.org/10.1016/j.foodchem.2013.06.046
Flannelly L., Dillon G.P. & Moran C.M., 2019. A comparison of analytical methods for the determination of urea in yeast-based food and feed ingredients. Food Addit. Contam., 36, 1467-1474, doi.org/10.1080/19440049.2019.1644457
Horwitz W., 1995. Protocol for the design, conduct and interpretation of method-performance studies. Pure Appl. Chem., 67, 331-343.
Horwitz W. & Albert R., 2006. The Horwitz ratio (HorRat): a useful index of method performance with respect to precision. J. AOAC Int., 89, 1095-1109.
ISO 13528:2015, 2015. Statistical methods for use in proficiency testing by interlaboratory comparisons. Geneva, Switzerland: International Organization for Standardization.
Pibarot P. & Pilard S., 2012. Analysis of urea in petfood matrices: comparison of spectro-colorimetric, enzymatic and liquid chromatography electrospray ionization high resolution mass spectrometry methods. Am. J. Anal. Chem., 3, 613-621.
