


- Portada
- Volume 14 (2010)
- numéro spécial 2
- Quality of mixing in a stirred bioreactor used for animal cells culture: heterogeneities in a lab scale bioreactor and evolution of mixing time with scale up


Vista(s): 5886 (32 ULiège)
Descargar(s): 0 (0 ULiège)

Quality of mixing in a stirred bioreactor used for animal cells culture: heterogeneities in a lab scale bioreactor and evolution of mixing time with scale up

Résumé
Qualité du mélange dans un bioréacteur à cuve agitée utilisé pour la culture de cellules animales : étude de l'hétérogénéité à l'échelle laboratoire et prédiction de l'évolution du temps de mélange avec le scale-up. Les cellules animales sont industriellement cultivées dans des cuves agitées pour produire des composés protéinés. Les conditions d'agitation étant généralement douces pour limiter les contraintes mécaniques, des problèmes d'homogénéité du milieu de culture peuvent apparaitre. Cette étude a dès lors deux objectifs : décrire globalement le mélange via le temps de mélange et décrire localement les champs de concentration. Les temps de mélange sont mesurés par conductimétrie dans 3 cuves de 20 l, 80 l et 600 l. La corrélation de Grenville est ajustée sur ces points expérimentaux pour améliorer la prédiction du temps de mélange lors du scale-up du procédé. Les champs de concentration sont déterminés par fluorescence induite par plan laser (P.L.I.F.) dans la cuve de 20 l. Cette étude est focalisée sur l'évolution temporelle de la concentration maximale dans les plans de mesure et sur le pourcentage du plan dont la concentration est supérieure à un seuil arbitraire.
Abstract
Animal cells are industrially cultivated inside stirred bioreactors to produce proteinic compounds. Due to the use of mild agitation conditions in order to limit mechanical constraints, the homogeneity of the culture medium can be far from perfect. This study has therefore two objectives: the global characterization of the mixing via the mixing time and the local description of concentration fields. The mixing time is measured by conductimetry inside 20 l, 80 l, 600 l tanks. The Grenville correlation is adjusted on these experimental measurements to improve the prediction of the mixing time during the scale-up of the process. The concentration fields are visualized by the Planar Laser Induced Fluorescence (P.L.I.F.) technique in the 20 l tank. This part of the study is focused on the time evolution of the maximum value of the tracer concentration inside measurement planes and of the numerical distribution of theses concentration fields.
Tabla de contenidos
1. Introduction
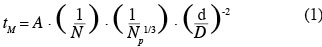
1Nowadays, animal cell cultures are essential for the production of proteinic compounds. Therefore, the size of stirred tank bioreactors has continuously increased over the last decades. Given that animal cells only have a thin plasma membrane, they are usually considered, in an excessive way, as more fragile than bacteria to mechanical constraints produced by liquid motions (velocity gradients, interactions with micro-eddies, collisions, etc.) and by air sparging (bubble rupture, coalescence and bursting, etc.). Numerous studies have been performed on this subject (Papoutsakis, 1991; Chisti, 2000; etc.). Therefore, animal cells are usually cultivated in mild agitation conditions in the laboratory scale stirred tank reactor. For instance, the volumetric power dissipated inside the tank (P/V) can be two orders of magnitude smaller than those typically dissipated inside a fermenting reactor. Moreover, the scale-up of these bioreactors is generally performed by keeping constant the geometric ratios of the tank and either the volumetric power dissipated inside the tank (P/V) or the impeller tip speed (vtip). These scale-up criterions imply a reduction of the impeller rotational speed by a factor F-2/3 and F-1, respectively, if F is the scale factor between both bioreactors. Numerous correlations (Ruszkowski, 1994; Grenville et al., 1995; etc.) predict that the time needed to reach the homogeneity inside the tank after a species injection, named the mixing time, evolves in an inversely proportional way with the impeller rotational speed. All these facts clearly show that the presence of spatial heterogeneities of concentration should be more and more important as the size of the bioreactor increases. These heterogeneities, especially those of pH and nutrient concentration, should partially explain the lower productivity generally observed in the industrial scale bioreactors. Therefore, to optimize the culture productivity, a hybrid scale-up strategy has to be found between a scale-up at constant volumetric power and a scale-up at constant mixing time. To achieve this goal, it is important to correctly correlate the mixing time at the agitation conditions. Therefore, the first objective of this study is to adapt the Grenville correlation (Grenville et al., 1995):
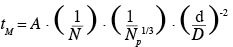
2in order to predict the mixing time inside a specific bioreactor. This bioreactor is composed of a cylindrical tank equipped with two baffles and a hemispheric bottom and stirred successively by three axial impellers (propeller Mixel TTP: d/D = 0.4, d/D = 0.5; propeller Applikon Elephant Ear EE: d/D = 0.5). To perform this adjustment, the mixing times are measured by conductimetry at several impeller rotational speeds corresponding to the turbulent regime in 20 l, 80 l and 600 l bioreactors.
3Even if the mixing time is widely used in mixing analysis, it remains a global parameter which does not describe the local evolution of concentration inside the tank after a species injection. As shown by Houcine et al. (1996) and by Guillard et al. (2000), the Planar Laser Induced Fluorescent (P.L.I.F.) technique allows the quantitative measurement of these concentration fields inside a plane lighted by a laser. However this technique is limited to small volume tanks. P.L.I.F. measurements are therefore performed inside the 20 l tank successively stirred by the impellers TTP (d/D = 0.4) and EE (d/D = 0.5). The analysis of the concentration fields is focused on the time evolution of the maximum concentration inside each measurement plane and of the numerical distribution of the concentration field inside these measurement planes.
2. Materials and methods
2.1. Stirred tank geometry
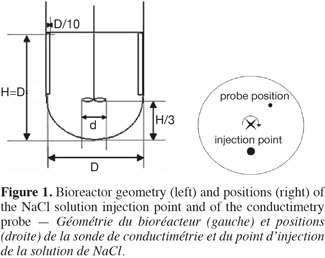
4Figure 1 shows the geometric characteristics shared by the three tanks used in this study. They are filled with 20 l, 80 l and 600 l of water, respectively. Their diameter measures 0.3 m, 0.5 m and 1 m, respectively. The liquid height to diameter ratio equals to 1. Each tank is equipped with a hemispheric bottom and two baffles. The baffles width is equivalent to 0.1 D and they are placed 180° one from each other on the vessel wall. The impeller clearance equals one third of the liquid height. This current mixing study is successively performed with three impellers frequently used during the cultures of animal cells:
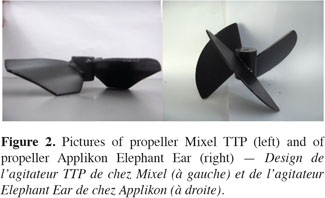
5– two propellers Mixel TTP with a diameter d equal to 0.4 D and 0.5 D, respectively;
6– one impeller Applikon “Elephant Ear” with a diameter d equal to 0.5 D.
7The shape of these impellers is shown on figure 2. They turn in clockwise so their blades force the liquid to flow downwards. They are rotated by a Heidolf motor (RZR 2102 Control, 100 W) which controls their rotational speed N with an accuracy of one rotation per minute (rpm).
2.2. Mixing time measurement
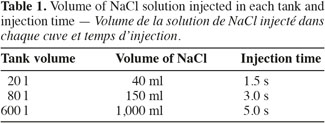
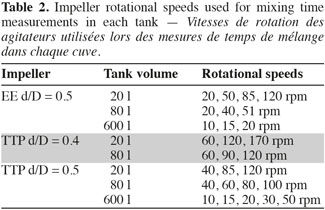
8The mixing time is defined as the time to achieve a predefined level of homogeneity of a tracer at the macroscopic scale through the tank. This mixing time is determined by conductimetry in the 20 l, 80 l, and 600 l tanks successively stirred by the three impellers. A small volume of a Sodium Chloride solution (359 g.l-1) is injected at the surface of the liquid. The injection point location is shown in the right part of the figure 1. The injected volume in each tank and the time needed to perform this injection are summarized on table 1. A home-made conductimetry probe is composed of a platinum thread wound around a PVC cylinder on a height of 5 cm and an electronic card. This probe measures an electric signal proportional to the local NaCl concentration. This signal is recorded at a frequency of 2 Hz using the Labview software (version 2.5.2). The bottom of the probe is localized 9 cm under the liquid surface. Its position in respect to the injection point is indicated on figure 1 (right). The mixing time can be defined for several levels of homogeneity of a tracer; the most frequently used being 90%, 95%, 99%. In this study, experimental mixing times are determined from each time profile of the liquid conductivity as the time corresponding to the conductivity equals 95% of the asymptotic value. Mixing times are determined for impeller rotational speeds indicated in table 2. These rotational speeds correspond to classical agitation conditions used during animal cell culture and they also keep a similar range of Reynolds numbers (Nd²/υ = 7,500-208,000) from one tank scale to each other. For each agitation condition, the tracer injection is repeated at least two times.
2.3. Concentration field measurement
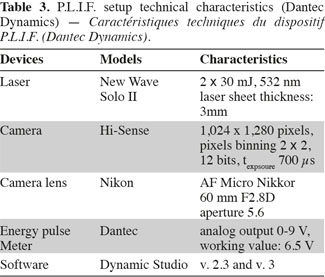
9Working principle of P.L.I.F. technique. Planar Laser Induced Fluorescence (P.L.I.F.) technique allows the determination of instantaneous concentration fields inside a plane lighted by a laser. The technical characteristics of the apparatus commercialized by Dantec Dynamics (Denmark) are summed up in table 3. A Nd-YAG laser pulses at the frequency of 15 Hz and lights the vertical plane crossing the stirred tank just in front of the impeller shaft (Figure 4). The photons emitted by the laser at the wavelength of 532 nm are progressively absorbed by the molecules of Rhodamine 6G (989-38-8) situated in the laser plane. These excited molecules then broadcast light at wavelengths between 540 nm and 640 nm. This light is recorded by a camera, situated perpendicularly to the laser sheet and equipped with a filter which eliminates the laser light wavelength. As shown by Houcine et al. (1996), the pixel grey level is directly proportional to the laser energy and to the Rhodamine 6G concentration if this latter is low enough. To determine this proportionality parameter, the tank is filled with Rhodamine 6G solutions of known concentration and a calibration curve is drawn for each pixel, allowing to take lighting heterogeneity into account. These calibration curves show that the pixel grey level increases linearly with the Rhodamine 6G concentration until the concentration of 60 µg.l-1. The laser energy fluctuates from one pulse to another. Therefore to correct pixel grey level, the laser energy at each pulse is measured by a photo-diode (Energy Pulse Meter) installed between the laser head and the optical device which expands the laser beam into a plane.
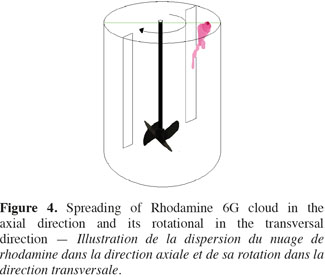
10Operating process of P.L.I.F. measurements. The concentration fields measured by the P.L.I.F. technique are spatially limited to the vertical plane crossing the stirred tank just in front of the impeller shaft. However, as illustrated on figure 3, when a small volume of Rhodamine 6G solution is injected at the liquid surface, the cloud of Rhodamine 6G spread in the axial direction but it also moves outside the vertical measurement plane due to the impeller rotational motion. To overcome the limitation of the P.L.I.F. technique, the spreading of Rhodamine 6G is successively measured in three axial planes. As it is not practical to modify the position of the laser plane, the position of the injection point and the baffles (Figure 4) is adapted to remain in the same configurations while increasing the distance between the injection point and the measurement plane. Due to the rotational motion of the impeller, the Rhodamine 6G cloud leaves more or less rapidly the first plane and takes between two and three seconds to reach the second or the third planes. In order to keep the range of concentration in Rhodamine 6G between 0 µg.l-1 and 60 µg.l-1 in each measurement plane, 5 ml of a 100 µg.l-1 of Rhodamine 6G are injected in the first injection point, 5 ml of 400 µg.l-1 are injected in the second injection point and 5 ml of 800 µg.l-1 are injected at the third injection point. Each injection lasts one second. All theses injections are repeated three times. These P.L.I.F. experiments are performed inside the 20 l tank successively stirred by the propeller TTP (d/D = 0.4) and the propeller EE (d/D = 0.5) rotating at speeds indicated in table 4.
11Analysis process on P.L.I.F. results. The software Dynamic Studio (version 3, Dantec S.A.) and Matlab (version 2008) are used to process the raw images recorded by the Hi-Sense camera (Table 3). Firstly, these images are masked to eliminate areas situated outside the tank or inside the shadow of the impeller. Secondly, each image is converted pixel by pixel into Rhodamine 6G concentration field using the calibration curves computed for each pixel. Thirdly, the average concentration field before each injection is subtracted from the corresponding instantaneous concentration fields.
12Two quantities are then extracted from these corrected concentration fields:
13– the maximum concentration value Cmax;
14– the spatial fraction of the concentration fields characterized by concentration values higher than a given value arbitrary chosen.
15The time evolution of these quantities is then analyzed. To compare results obtained for the three injection positions, concentrations inside each measurement plane are normalized by the concentration of the injection solution.
3. Results and discussion
3.1. Evolution of mixing time with scale-up
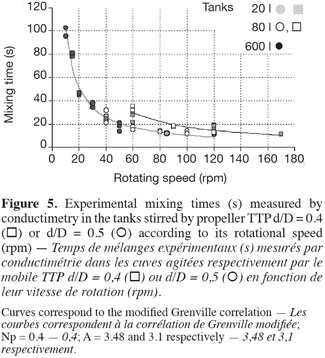
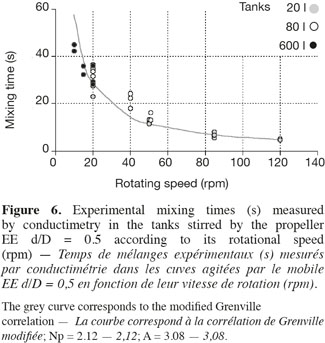
16The Grenville correlation (equation 1) is adjusted on the mixing times measured by conductimetry inside the 20 l, 80 l and 600 l tanks successively stirred by propellers TTP (d/D = 0.4, d/D = 0.5) and propeller EE (d/D = 0.5).
17This correlation is interesting because it highlights the separate effects of the impeller rotational speed (N), of the impeller type (indirectly by the power number Np) and of the impeller diameter to tank diameter ratio (d/D). Moreover, only one parameter A has to be adjusted. As shown on figures 5 and 6, the agreement between experimental (in 20 l tank, in 80 l tank, in 600 l tank) and predicted (the grey curve) values is quite good. The deviation has the same order of magnitude than the fluctuations of the experimental mixing times obtained for each given agitation conditions. It is interesting to mention that the parameter A, determined by a least-square fitting estimation, is around 3 for all impellers. This value is quite different from the value 5.4 obtained by Grenville et al. (1995). This difference probably comes from the specific geometry of the tank used, with a hemispheric bottom and only two baffles.
3.2. Study of heterogeneities inside a laboratory scale bioreactor
18Analysis of the noise associated to P.L.I.F. measurement. In the P.L.I.F. technique, there are several sources of errors, namely noise due to the camera, due to the laser, and due to the image processing software. This noise reduces the quality of the signal in spite of optimizations of the camera parameters (exposure time, aperture, pixel binning, pixel sensibility), of energy pulse meter sensibility and of the Rhodamine 6G concentration range. Nevertheless, this noise seems to follow a Gaussian law centered on zero at each pixel. Therefore, 95% of noise values are expected to lie in the [-2σ, 2σ] interval, where σ is the standard deviation. Moreover, the mean width of the [-2σ, 2σ] interval for all pixels situated inside the tank seems to evolve linearly with the Rhodamine 6G concentration. This characteristic has been used during the analysis of instantaneous concentration fields.
19Description of the time evolution of concentration fields. The normalized maximum concentration Cmax is extracted from each instantaneous concentration field. To eliminate values corresponding to noise, the following condition is applied:

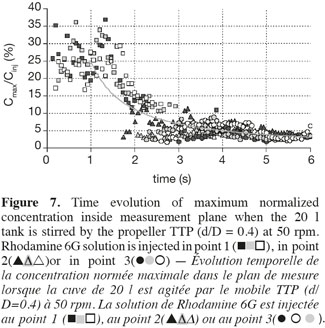
20Figure 7 illustrates a typical evolution of Cmax values according to the time. This curve can be divided into two periods of time. In the first one, which lasts one second, Cmax values seem to fluctuate around 30%. In the second one, Cmax values seem to decrease according to a power law. It can be noticed that symbols which are relative to injections at points 1, 2 and 3, respectively, follow each other. The symbols relative to injection points 2 and 3 appear on the graph after a delay of two or three seconds. The impeller rotational speed and the impeller type slightly modify these delays. They do not influence the almost constant value of Cmax observed during the first second. This latter observation let think that the first second of the mixing is controlled in the way the Rhodamine 6G is injected inside the tank (injection flow, position of the injection, volume injected, etc.). This assumption is supported by the fact that the time needed to perform the injection of 5 ml of Rhodamine 6G lasts one second. The decrease of Cmax according to a power law in measurement planes results from the two combined effects: firstly, the dilution of the Rhodamine 6G cloud and secondly, the rotation of the Rhodamine 6G cloud around the impeller shaft. This last mechanism implies that the maximum value observed in each measurement plane does not necessarily correspond to the maximum value inside the tank. A 3D model should be required to account for these two effects separately.
21For each normalized concentration level, the fraction of instantaneous concentration fields characterized by a concentration value higher than a given arbitrary value seems to follow a bell shape curve according to time. Unfortunately, this quantity is strongly affected by the measurement noise. It is therefore not possible to clearly highlight the influence of the impeller rotational speed or of the kind of impeller. Nevertheless, the maximum size of the area characterized by a normalized concentration higher than a few percent is really small. For instance, the order of magnitude is 1% and 0.1%, if the normalized concentration equals 5% and 20% respectively.
4. Conclusion
22The aim of this study is to describe the mixing inside a cylindrical tank equipped with a hemispheric bottom and two baffles and stirred by a propeller TTP (Mixel) or a propeller Elephant Ear (Applikon) in typical agitation conditions used in animal cell cultures. Indeed, these agitation conditions are generally mild to limit mechanical constraints applied on animal cells. These mild agitation conditions could imply concentrations heterogeneities of the culture medium, which could reduce the productivity of animal cell culture.
23In the first time, the mixing is studied using a global approach via the measurement by conductimetry of the mixing time inside 20 l, 80 l, 600 l tanks. The parameter A of the Grenville correlation (eq. 1) is adjusted on these experimental points. A value around 3 is obtained, which is quite different from the value 5.4 obtained by Grenville. The specific geometry of the tank could explain this difference. For the process scale-up, this modified Grenville correlation is interesting because it should lead to a better prediction of the mixing time for this specific tank geometry.
24In a second time, the mixing is characterized locally via the visualization of instantaneous concentration fields inside three vertical planes of the 20 l tank by the P.L.I.F. technique. The normalized maximum concentration inside measurement plane firstly fluctuates around a value of 30% and then decreases according to a power law. The spatial fraction of the each concentration field characterized by concentration values higher than a given value arbitrary chosen evolves as a bell shape curve according to the time. The maximum size of these areas is very small for normalized concentrations higher than a few percent. This study also stresses three main drawbacks of the P.L.I.F. technique: it is limited to small volume tanks, measurements are spatially limited to a plane and the noise to signal ratio can be high. Nevertheless, the two last limitations are overcome by performing measurements in three different planes and by taking errors into account in the concentration field analysis. However, the P.L.I.F. technique remains a powerful tool to validate 3D mixing models as those based on Computational Fluid Dynamics or Networks of Zones. These 3D validated models could take into account chemical reactions and could therefore be a useful tool to simulate the pH evolution inside the tank after an alkali injection. This idea will be developed in a future study.
25Acknowledgements
26We acknowledge the financial support provided by the F.R.S.-FNRS (National Fund for Scientific Research of Belgium), by the Communauté française de Belgique (Action de Recherche Concertée) and by the company GlaxoSmithkline Biologicals. We kindly thank Sandrine Dessoy and Ludovic Peeters for the information and advice relative to the animal cell culture.
Bibliographie
Chisti Y., 2000. Animal-cell damage in sparged bioreactors. Trends Biotechnol., 18, 420-432.
Cooke M., Middleton J.C. & Bush J.R., 1988. Mixing and mass transfer in filamentous fermentations. In: King R., ed. Proceedings of the 2nd International conference on bioreactor fluid dynamics, Crandfield, U.K. Cranfield, UK: BHR Group, 37-64.
Grenville R.K., Ruszkowski S. & Garret E., 1995. Blending of miscible liquids in the turbulent and transitional regimes. In: Proceedings of the 15th NAMF mixing conference, Banff, Canada.
Guillard F., Trägardh C. & Fuchs L., 2000. A study of turbulent mixing in a turbine-agitated tank using a fluorescence technique. Exp. Fluids, 28, 225-235.
Houcine I. et al., 1996. Planar laser induced fluorescence technique for measurements of concentration fields in continuous stirred tank reactors. Exp. Fluids, 22, 95-102.
Papoutsakis E.T., 1991. Fluid-mechanical damage of animal-cells in bioreactors. Trends Biotechnol., 9, 427-437.
Ruzskowski S., 1994. A rational method for measurement blending performance and comparison of different impeller types. In: Proceedings of the 8th European mixing conference, Institution of Chemical Engineers, Rugby, U.K., 283-291.
Para citar este artículo
Acerca de: Marie-Laure Collignon
Univ. Liege. F.R.S.- FNRS. Chemical Engineering Laboratory. Allée de la Chimie, 3/6c. B-4000 Liege (Belgium). E-mail: mlcollignon@ulg.ac.be.
Acerca de: Denis Dossin
Univ. Liege. F.R.S.- FNRS. Chemical Engineering Laboratory. Allée de la Chimie, 3/6c. B-4000 Liege (Belgium).
Acerca de: Angélique Delafosse
Univ. Liege. F.R.S.- FNRS. Chemical Engineering Laboratory. Allée de la Chimie, 3/6c. B-4000 Liege (Belgium).
Acerca de: Michel Crine
Univ. Liege. F.R.S.- FNRS. Chemical Engineering Laboratory. Allée de la Chimie, 3/6c. B-4000 Liege (Belgium).
Acerca de: Dominique Toye
Univ. Liege. F.R.S.- FNRS. Chemical Engineering Laboratory. Allée de la Chimie, 3/6c. B-4000 Liege (Belgium).
